Annexes - tables and graphs FvH · Policy Research Corporation SOUND SOLUTIONS BASED ON SCIENTIFIC...
97
Policy Research Corporation Policy Research Corporation SOUND SOUND SOLUTIONS BASED ON SCIENTIFIC RESEARCH SOLUTIONS BASED ON SCIENTIFIC RESEARCH The role of Maritime Clusters to enhance the strength and development of European maritime sectors Annexes 13 November 2008
Transcript of Annexes - tables and graphs FvH · Policy Research Corporation SOUND SOLUTIONS BASED ON SCIENTIFIC...

Policy Research CorporationPolicy Research CorporationSOUNDSOUND SOLUTIONS BASED ON SCIENTIFIC RESEARCHSOLUTIONS BASED ON SCIENTIFIC RESEARCH
The role of Maritime Clusters to enhance the strength and development of European maritime sectors
Annexes
13 November 2008

Policy Research Corporation 28 July 200813 November 2008
ANNEXES
Annex 1: Definitions of the sea-related sectors (Area 1, 2 and 3)Annex 2: Production value, value added and employment on EU-level: absolute figures and stars (overall + per
Area)Annex 3: Overview of employment and value added in the sea-related sectors in the EU’s member states and
NorwayAnnex 4: Analysis of differences in employment figures per countryAnnex 5: Results to be integrated in the European Cluster Observatory’s database (Area 1, 2 and 3 + cluster
organisations)Annex 6: Employment summary pages per country (in alphabetical order)Annex 7: Main trends & policies in the national maritime clusters in Europe (overall & per sector) and relevant EU
policyAnnex 8: Trends and policies in the maritime clusters of Singapore and Dubai Annex 9: Archetypes of maritime cluster organisationsAnnex 10: Similarities and differences between maritime cluster organisationsAnnex 11: Main differences and similarities between cluster organisations and sector associationsAnnex 12: Overview of main benefits of clustering and good practices of maritime cluster organisationsAnnex 13: The link between cluster policies and sector performanceAnnex 14: SWOT-analysis of top-down and bottom-up maritime cluster organisationsAnnex 15: Contacted persons Annex 16: List of abbreviationsAnnex 17: References

Policy Research Corporation 38 July 200813 November 2008
ANNEX 1: DEFINITIONS OF THE SEA-RELATED SECTORS
The above definitions for the sea-related sectors are used in order to map the economic impact of the maritime sectors on a European scale although some member
states’ definitions may differ from the above
Area 1: Traditional maritime sectors– Inland navigation: Inland shipping and ship management; chartering-out; inland cruises and ferries; harbour and river towage; freighting– Marine equipment: Manufacturing and wholesale trade in maritime equipment for all maritime (sub-)sectors (no building, repair and/or conversion and
no offshore supply)– Maritime services: Research and development; education; classification and inspection; bunkering; maritime insurance; maritime financing; maritime
brokerage; maritime law; crewing; associations; government services; rescue; diving; ship supply (no port services)– Maritime works: Dredging; nautical cable and pipelines; river works; construction of canals, dykes and ports; support vessels; sand transport– Navy and coastguard (no shipbuilding)– Offshore supply: Construction and installation of platforms, storage vessels and equipment; drilling; offshore-related transport, engineering,
communication, consultancy and other support; seismic research; manufacturing, installation and maintenance of offshore and coastal wind turbines (no extraction of oil such as operators of oil rigs)
– Recreational boating: Boat chartering and renting; marinas; inland boat basins; supporting services concerning the construction of and trade in recreational vessels; boating-related training and trade (no manufacturing)
– Seaports: Cargo-handling; shipping related storage, agency, maritime logistics and forwarding; port authorities; pilotage– Shipbuilding: Construction and repair of sea-going vessels (commercial ships, fishing boats and naval ships), recreational boats and inland vessels; ship
scrapping; floating sections; dry docks (no offshore-rigs and/or -vessels)– Shipping: Merchant shipping and ship management; short-sea shipping; chartering-out; ferry services; ocean towage (only national seafarers and
onshore persons employed)– Marine aggregates: Exploitation of marine aggregates
Area 2: Coastal and sea-related (marine) recreation and tourism:– Coastal tourism: Tourism within 10 km from the coast– Cruise tourism: Service on board of cruise ships (no land-based tourism and/or related services)
Area 3: Fisheries– Fisheries: Maritime and inland fishing; fish processing; aquaculture
Policy Research Corporation 48 July 200813 November 2008
ANNEX 2: PRODUCTION VALUE AND ADDED VALUE IN THEORY AND PRACTICE FOR THE SEA-RELATED SECTORS
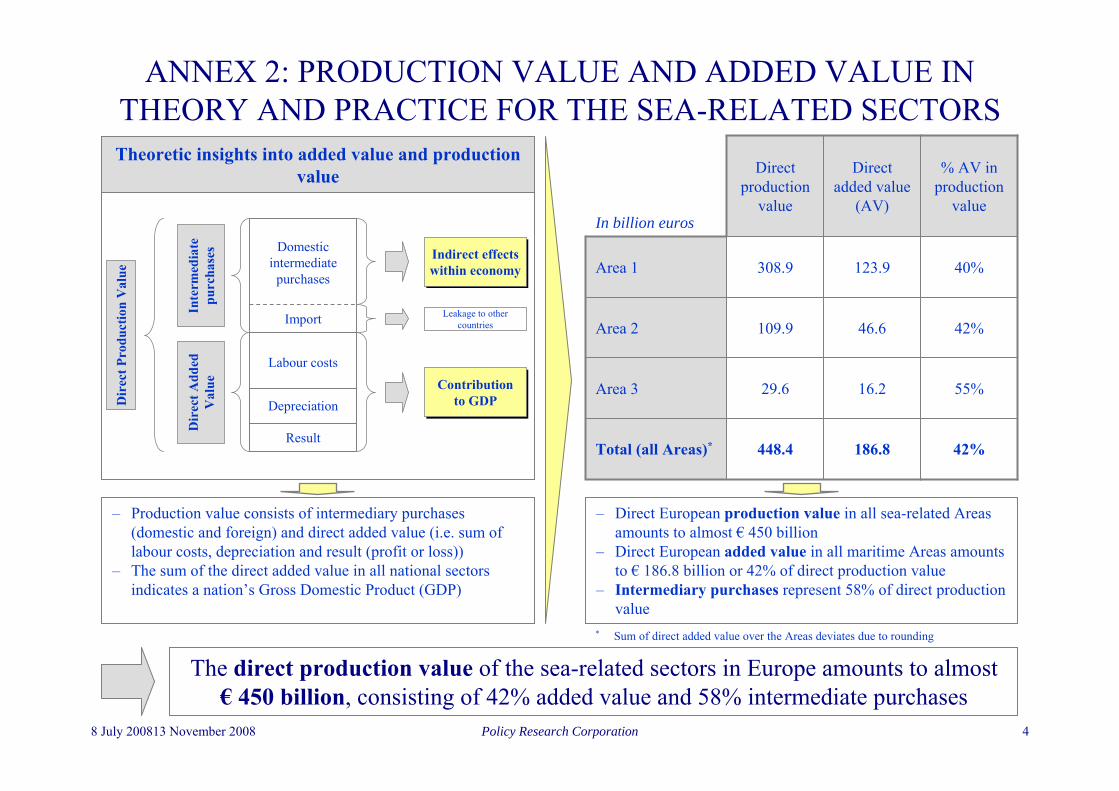
The direct production value of the sea-related sectors in Europe amounts to almost€ 450 billion, consisting of 42% added value and 58% intermediate purchases
42%
55%
42%
40%
% AV in production
value
186.8
16.2
46.6
123.9
Direct added value
(AV)
448.4Total (all Areas)*
29.6Area 3
109.9Area 2
308.9Area 1
Direct production
valueIn billion euros
Theoretic insights into added value and production value
– Direct European production value in all sea-related Areas amounts to almost € 450 billion
– Direct European added value in all maritime Areas amounts to € 186.8 billion or 42% of direct production value
– Intermediary purchases represent 58% of direct production value
– Production value consists of intermediary purchases (domestic and foreign) and direct added value (i.e. sum of labour costs, depreciation and result (profit or loss))
– The sum of the direct added value in all national sectors indicates a nation’s Gross Domestic Product (GDP)
Import
Domestic intermediate
purchases
Result
Depreciation
Labour costs
Dir
ect P
rodu
ctio
n V
alue
Dir
ect A
dded
V
alue
Inte
rmed
iate
pu
rcha
ses
Contribution to GDP
Contribution to GDP
Indirect effects within economyIndirect effects within economy
Leakage to other countries
* Sum of direct added value over the Areas deviates due to rounding

Policy Research Corporation 58 July 200813 November 2008
ANNEX 2: PRODUCTION VALUE AND ADDED VALUE IN THE TRADITIONAL MARITIME SECTORS (AREA 1)
Significant differences in the share of added value in the production value reflect the differences in the use of production means (capital and labour) and the level of in-house
production and outsourcing
48%2 0004 200Inland navigation
38%332870Marine aggregates
40%
63%
51%
34%
55%
68%
28%
32%
30%
% AV in production value
2 1005 300Maritime works
9 40015 000Maritime services
9 00017 900Offshore supply
8 100
15 400
22 700
10 000
17 600
27 300
Direct added value (AV)
23 500Recreational boating
27 900Navy
33 300Seaports
35 200Shipbuilding
54 200Marine equipment
91 500Shipping
Direct production valueIn million euros
More information on the relation between added value and production value is provided in the ‘Overview of applied research methodology’

Policy Research Corporation 68 July 200813 November 2008
ANNEX 2: ADDED VALUE AND EMPLOYMENT IN ALL SEA-RELATED AREAS FOR EUROPEAN UNION AND NORWAY
The top-10 countries account for 88% of added value and 83% of employment in all sea-related sectors
EmploymentDirect (Σ direct) employment = 4.78 million persons**
* Added value is formulated in € million; the definition of added value is provided in the ‘Overview of the applied research methodology’** For a detailed breakdown of added value and employment for all sea-related Areas and sectors see Annex 3; Annex 4 explains the differences in employment with national
maritime cluster studies*** Top-10 countries in terms of share of maritime added value (and employment) in all sea-related Areas are listed; for other countries % share is well below 2.5% (and 3%)
15 000 = 15 000 million euros of added value 500 000 = 500 000 persons employed
Added valueDirect (Σ direct) added value = 186.8 billion euros**
200
300300
50100
100
4 000
4 000
6 000
1 100
10 000
4 000
Percentage maritimeemployment in natio-
nal employment***
Percentage maritimeemployment in natio-
nal employment***
Europe: 2.25%MT: 13.51%CY: 12.02%NO: 6.85%EE: 6.54%GR: 6.39%LV: 5.36%DK: 5.26%ES: 4.62%BG: 3.46%PT: 3.34%
Europe: 2.25%MT: 13.51%CY: 12.02%NO: 6.85%EE: 6.54%GR: 6.39%LV: 5.36%DK: 5.26%ES: 4.62%BG: 3.46%PT: 3.34%
Percentage maritimeadded value in
national GDP***
Percentage maritimeadded value in
national GDP***
Europe: 1.65%MT: 11.36%CY: 9.07%EE: 8.83%LV: 7.71%NO: 6.23%DK: 4.19%GR: 3.24%LT: 2.59%ES: 2.53%NL: 2.25%
Europe: 1.65%MT: 11.36%CY: 9.07%EE: 8.83%LV: 7.71%NO: 6.23%DK: 4.19%GR: 3.24%LT: 2.59%ES: 2.53%NL: 2.25%
Average valueadded/employee =
€ 39 000
Average valueadded/employee =
€ 39 000
48 100
103 300
41 800
287 300
144 700
39 700
876 400
50 100
503 700
279 200
38 400
724 700
34 500
55 400
20 100
190 500
156 300
147 000
171 200
136 600
70 400
634 400
4 000
1 200
17 200
8 700
23 000
3 200
25 400
6 400
2 100
24 300
1 000
500
11 500
15 100
3 400
2 800
1 200
3 800
28 400
1 000
500
500

Policy Research Corporation 78 July 200813 November 2008
ANNEX 2: EUROPEAN OVERVIEW OF ADDED VALUE AND EMPLOYMENT IN THE TRADITIONAL MARITIME SECTORS
The top-10 countries account for 87% of value added and 80% of employmentin the traditional maritime sectors
EmploymentDirect (Σ direct) employment = 1.92 million persons**
Added value*
Direct (Σ direct) added value = 123.9 billion euros**
Average valueadded/employee =
€ 64 600
Average valueadded/employee =
€ 64 600
* Added value is formulated in million euros** For a detailed breakdown of added value and employment for all sea-related sectors see Annex 3; Annex 4 explains the differences in employment with national
maritime cluster studies
10 000 = 10 000 million euros of added value = 200 000 persons employed200 000
100
200
30100100
3 000
2 000
4 000
1 000
2 000
4 000
Area 1Area 1
36 700
29 700
10 100
197 500
82 600
25 900
136 700
42 100
230 700
76 200
6 400
196 100
21 600
38 900
7 600
128 100
110 000
117 000
29 000
80 400
48 300
253 600
3 700
300
400
14 900
6 900
800
7 400
2 900
16 000
3 400
300
900
13 300
400
900
9 900
12 900
3 100
1 000
1 000
3 200
20 200
300

Policy Research Corporation 88 July 200813 November 2008
ANNEX 2: STAR METHOD APPLIED WITH REGARD TO EMPLOYMENTIN TRADITIONAL MARITIME SECTORS ON EUROPEAN LEVEL*
Three-star regions in the traditional maritime sectors are Sud-Est (Ro), Pomorskie (Pl), Liguria (It), Haute-Normandie (Fr) and Vestlandet (No)
Stars based on strength indicators size, specialisation and focus**
Maritime employment(> 50 000)
Maritime employment
(25 000-50 000)
Maritime employment (< 25 000)
3 3 3
2 2 2
1 1 1
* Stars for regions on country-level are analysed in the country-reports** Detailed data on size, specialisation and focus of star-regions are provided in Annex 5
Region excels in three strength indicators
Region excels in two out of three strength
indicators
Region excels in one out of three strength
indicators
Area 1Area 1
PT
FR
DE
SE
FI
PL
CZ
AT
IT
SI
GR
SK
HU
RO
BG
ES
MTCY
IE
LU
33
2
3
3
2
2
2
2
2
22
2
2
1
1
1
1
1
1
2
1
11
1
1
1
1
1

Policy Research Corporation 98 July 200813 November 2008
In comparison to employment-stars in the traditional maritime sectors, value added stars shift to regions in north-western Europe
ANNEX 2: STAR METHOD APPLIED WITH REGARD TO ADDED VALUEIN TRADITIONAL MARITIME SECTORS ON EUROPEAN LEVEL
Stars based on strength indicators size, specialisation and focus
Maritime added value
(> € 3 billion)
Maritime added value
(€ 2 - 3 billion)
Maritime added value
(< € 2 billion)
Region excels in three strength indicators
Region excels in two out of three strength
indicators
Region excels in one out of three strength
indicators
3 3 3
2 2 2
1 1 1
Area 1Area 1
PT
FR
DE
SE
FI
PL
CZ
AT
IT
SI
GR
SK
HU
RO
BG
ES
MTCY
IE
LU
2
2
22
1
2
2
1
21
3
1
2
1
1
1
1
1
1
1
1
1
3
3
3
2
3
1
1

Policy Research Corporation 108 July 200813 November 2008
Top-10 countries account for more than 93% of total added value in Area 2
ANNEX 2: EUROPEAN OVERVIEW OF ADDED VALUE AND EMPLOYMENT IN COASTAL (AND MARINE) TOURISM
EmploymentDirect (Σ direct) employment = 2.42 million persons**
Added value*
Direct (Σ direct) added value = 46.6 billion euros**
* Added value is formulated in million euros** For a detailed breakdown of added value and employment for all sea-related sectors see Annex 3
2 000 = 2 000 million euros of added value = 300 000 persons employed300 000
Average valueadded/employee =
€ 19 300
Average valueadded/employee =
€ 19 30060
20
30
70
100
Area 2Area 2
9 700
72 700
30 600
73 300
48 0007 200
652 400
5 300
208 200
165 300
21 400
480 700
6 300
6 000
11 000
53 400
29 600
10 100
109 100
45 600
18 200
7 400
347 300
200
800
1 600
1 000
12 700
200
6 300
1 900
500
8 900
200
1 200
1 000
1 200
200
500
7 800
200

Policy Research Corporation 118 July 200813 November 2008
ANNEX 2: STAR METHOD APPLIED WITH REGARD TO EMPLOYMENTIN COASTAL TOURISM ON EUROPEAN LEVEL
Main regions in terms of employment in coastal tourism and recreation are situated in the Mediterranean
* Stars for regions on country-level are analysed in the country-reports** Detailed data on size, specialisation and focus of star-regions are provided in Annex 5
Stars based on strength indicators size, specialisation and focus**
Maritime employment(> 50 000)
Maritime employment
(25 000-50 000)
Maritime employment (< 25 000)
Region excels in three strength indicators
Region excels in two out of three strength
indicators
Region excels in one out of three strength
indicators
PT
FR
DE
SE
FI
PL
CZ
AT
SI
SK
HU
RO
BG
ES
IE
LU
UK
NO
BE
3
3
3
2
2
2
2
2
2
2
2
2
2
1
1
1
1
1
1
1
1
1
1
1
11
11
1
1
Canarias (ES)
EE
LV
LT
3 3 3
2 2 2
1 1 1
Area 2Area 2
Policy Research Corporation 128 July 200813 November 2008
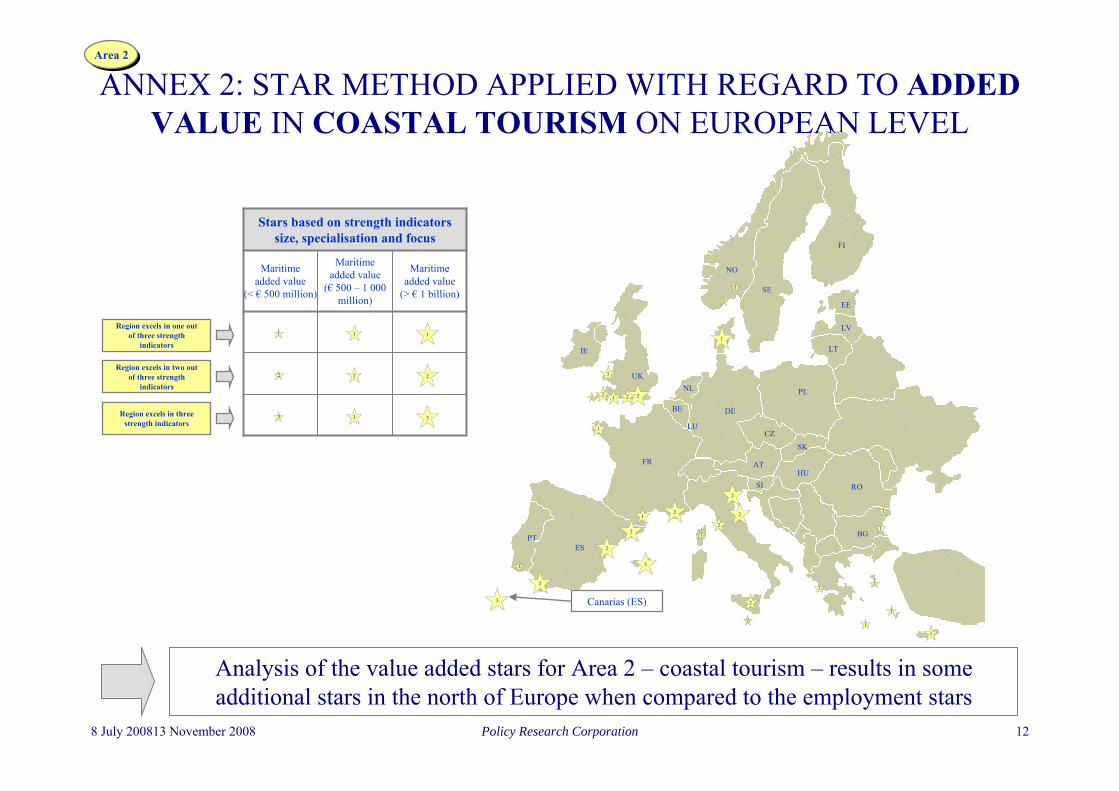
ANNEX 2: STAR METHOD APPLIED WITH REGARD TO ADDED VALUE IN COASTAL TOURISM ON EUROPEAN LEVEL
Analysis of the value added stars for Area 2 – coastal tourism – results in some additional stars in the north of Europe when compared to the employment stars
Stars based on strength indicators size, specialisation and focus
Maritime added value
(> € 1 billion)
Maritime added value
(€ 500 – 1 000 million)
Maritime added value
(< € 500 million)
Region excels in three strength indicators
Region excels in two out of three strength
indicators
Region excels in one out of three strength
indicators
PT
FR
DE
SE
FI
PL
CZ
AT
SI
SK
HU
RO
BG
ES
IE
LU
UK
NO
BE
1
1
1
1
1
1
1
1
1
1
1
1
1
11
1
1
2
2
2
2 2
22
2
2
2
2
3
3
3 Canarias (ES)
NL
EE
LV
LT
3 3 3
2 2 2
1 1 1
Area 2Area 2

Policy Research Corporation 138 July 200813 November 2008
ANNEX 2: ADDED VALUE AND EMPLOYMENT OF THE MAJOR TEN EUROPEAN COUNTRIES IN FISHERIES
The top-10 countries account for almost 85% of employment and over 90% of value added in Area 3
EmploymentDirect (Σ direct) employment = 444 000 persons**
= 1 000 million euros of added value 50 000 = 50 000 persons employed
Added value*
Direct (Σ direct) added value = 16.2 billion euros**
1 000
* Added value is formulated in million euros** For a detailed breakdown of added value and employment for all sea-related sectors see Annex 3; Annex 4 explains the differences in employment with national
maritime cluster studies
Average valueadded/employee =
€ 36 600
Average valueadded/employee =
€ 36 600
120
80
60
5
3030
60
90
10
30
90
30
20
10
600
700
1 700
1 200
1 700
1 400
1 200
900
Area 3Area 3
16 400
14 100
6 700
87 300
2 700
64 700
37 700
10 600
48 000
6 600
10 600
9 000
16 700
19 900
33 200
10 600
4 000
33 500
2 300
700
2 900
3 100
1 200
600
2 100
400
1 200
200
700
200
1 500
700

Policy Research Corporation 148 July 200813 November 2008
ANNEX 2: STAR METHOD APPLIED WITH REGARD TO EMPLOYMENT IN FISHERIES ON EUROPEAN LEVEL
Main regions in terms of employment in fisheries are located at the Atlantic Ocean with Galicia (Es), Bretagne (Fr) and Algarve (Pt) as three-star regions
PT
FR
DE
SE
FI
PL
CZ
AT
IT
SI
SK
HU
RO
BG
ES
MTCY
IE
LU
UK
NO
BE
3
3
3
2
2
2
2
2
2
2
2
2
2
2
1
1
1
1
1
1
1 1
1
1
1 1
1
1
1 1
1
* Stars for regions on country-level are analysed in the country-reports** Detailed data on size, specialisation and focus of star-regions are provided in Annex 5
Stars based on strength indicators size, specialisation and focus**
Maritime employment(> 10 000)
Maritime employment
(5 000-10 000)
Maritime employment
(< 5 000)
Region excels in three strength indicators
Region excels in two out of three strength
indicators
Region excels in one out of three strength
indicators
3 3 3
2 2 2
1 1 1
Area 3Area 3

Policy Research Corporation 158 July 200813 November 2008
ANNEX 2: STAR METHOD APPLIED WITH REGARD TO ADDED VALUE IN FISHERIES ON EUROPEAN LEVEL
Compared to employment stars, value added stars for fisheries show about the same stars in southern Europe, but additional stars in north-western Europe
PT
FR
DE
SE
FI
PL
CZ
AT
IT
SI
SK
HU
RO
BG
ES
MTCY
IE
LU
UK
NO
BE
3
3
3
3
2
2
2
2
2
2
2
2
2
2 1
1
1
1
1
1
1
1
11
1
1
1
1
1
1
Stars based on strength indicators size, specialisation and focus
Maritime added value
(> € 300 million)
Maritime added value(€ 200 – 300
million)
Maritime added value
(< € 200 million)
Region excels in three strength indicators
Region excels in two out of three strength
indicators
Region excels in one out of three strength
indicators
3 3 3
2 2 2
1 1 1
Area 3Area 3

Policy Research Corporation 168 July 200813 November 2008
ANNEX 3: OVERVIEW OF EMPLOYMENT IN THE SEA-RELATED SECTORS IN ALL COUNTRIES
Employment in the sea-related sectors amounts to 2.25% of total employment in the European Union and Norway
Area 1 Area 2 Area 3
Σ= 1 920 000Σ= 444 000
* Shipping includes only EU-resident seafarers because although non-resident seafarers receive their income from EU-based companies, they – in general – transfer a very large share of that income to non-EU countries resulting in expenditures outside the EU; e.g. non-resident seafarers working for Dutch shipping companies amount to 13 710 (6 140 resident shipping personnel) and non-EU seafarers working for Italian-based companies amount to 14 000 (22 800 resident shipping personnel) (Source: Ecotec (2006))
Source: Policy Research based on Ecotec (2006) – Employment trends in all sectors related to the sea or using sea-resources, LEI (2006) – Employment in the fisheries sector, BIMCO/ISF (2005) – Manpower 2005 update, Eurostat – Industry, Trade and Services (Annual enterprise statistics) 2005, G.P. Wild and Business Research and Economic Advisors (2007) – Contribution of cruise tourism to the economies of Europe and Eurostat – Tourism indicators 2005
NavyMarine equipment Shipping Seaports Shipbuilding
Recreational boating
Offshore supply
Maritime services
Inland navigation
Maritime works
at Austria - 1 709 52 - 383 634 - - 379 -be Belgium 2 400 894 866 16 651 1 170 565 - 9 865 788 3 460bg Bulgaria 10 000 8 172 5 405 - 6 147 - - - - -cy Cyprus 330 - 5 100 3 909 157 407 - 116 - 97cz Czech Republic - - 689 - 512 114 - - 723 -de Germany 24 559 72 000 11 072 7 500 23 600 15 602 17 220 13 720 9 075 3 150dk Denmark 300 20 626 11 244 - 7 423 2 539 7 887 32 460 - 150ee Estonia 300 1 500 10 191 10 300 3 031 218 - 312 - -es Spain 47 300 14 523 10 506 35 000 8 953 17 920 - 1 562 227 742fi Finland 2 300 19 000 6 806 3 559 6 083 1 575 661 1 657 207 249fr France 55 293 30 000 18 240 27 259 30 764 24 000 26 800 11 041 3 454 3 564gr Greece 19 500 3 281 36 594 - 3 601 3 288 - 9 961 - -hu Hungary - - 2 027 - 411 179 - - 1 228 -ie Ireland - - 3 637 1 958 48 512 - 210 - 12it Italy 35 261 24 000 22 772 26 048 23 295 60 334 - 1 477 2 858 30lt Lithuania 644 - 6 428 2 730 4 967 40 3 514 1 738 141 1 426lu Luxembourg - - 917 - - - - 136 47 -lv Latvia 630 1 435 17 890 11 046 2 670 260 - 3 243 20 1 700mt Malta - - 118 5 536 1 763 200 - - - -nl Netherlands 14 500 13 140 6 140 27 130 10 090 12 160 18 750 9 550 11 500 5 100no Norway 3 700 9 646 18 036 2 200 27 729 - 40 000 8 700 31 -pl Poland 16 000 34 517 30 418 9 727 20 230 900 475 3 185 1 249 303pt Portugal 14 745 - 2 397 2 002 4 782 1 761 1 300 - 1 467 509ro Romania 6 800 17 709 13 327 18 000 19 855 - - - 3 097 1 575se Sweden 5 670 12 470 14 447 6 500 3 485 2 200 - 2 401 1 063 35si Slovenia - - 698 - 428 380 - 150 28 -sk Slovakia - - 578 - 950 55 - - 733 -uk United Kingdom 61 500 16 604 26 550 42 150 32 582 13 158 30 000 27 402 1 167 -Total 321 732 301 226 283 145 259 205 245 107 159 000 146 607 138 886 39 482 22 102
Σ=2 420 000
*Marine aggregates
----------
300----------------
2 5002 800
Coastal tourism Cruise tourism Fisheries
- 168 7349 707 - 1 743
72 653 - 89530 555 - 1 175
- - 2 26770 385 2 963 16 40947 950 67 14 060
7 198 - 6 700651 116 1 279 87 310
5 280 - 2 740207 634 606 64 712165 291 - 37 701
- 101 1 68021 158 236 10 584
468 612 12 086 47 9576 350 - 6 565
- - -5 976 - 10 580
11 000 - 1 44152 968 438 9 04925 881 3 670 16 700
9 795 269 19 923108 147 909 33 229
45 610 - 10 60018 061 101 3 955
7 393 - 623- 67 1 180
336 786 10 470 33 5342 385 505 33 430 444 046

Policy Research Corporation 178 July 200813 November 2008
Added value in the sea-related sectors amounts to 1.65% of total added value (GDP at market price) in the European Union and Norway
Area 1 Area 2 Area 3
Σ= € 123.9 billionΣ= € 16.2 billion
ANNEX 3: OVERVIEW OF ADDED VALUE IN THE SEA-RELATED SECTORS IN ALL COUNTRIES
Σ= € 46.6 billion
Shipping SeaportsMarine equipment Navy Shipbuilding
Offshore supply
Maritime services
Recreational boating
Maritime works
Inland navigation
at Austria 9 - 126 - 18 - - 35 - 21be Belgium 152 2 011 75 134 55 - 752 35 452 41bg Bulgaria 127 - 45 58 38 - - - - -cy Cyprus 159 260 - 10 4 - 5 - 7 -cz Czech Republic 90 - - - 4 - - 2 - 10de Germany 2 788 778 5 120 1 179 1 261 952 927 827 354 738dk Denmark 1 972 - 1 448 18 334 522 2 621 - 21 -ee Estonia 446 322 30 4 36 - 9 - - -es Spain 838 2 839 764 1 775 318 - 82 742 65 5fi Finland 437 395 1 412 118 290 36 95 89 30 8fr France 1 957 3 187 1 980 2 990 1 583 1 485 708 1 433 451 162gr Greece 2 125 - 96 695 99 - 363 - - -hu Hungary 266 - - - 3 - - 4 - 17ie Ireland 638 274 - - 2 - 19 - 2 -it Italy 2 535 2 794 1 610 1 749 1 158 - 65 3 304 3 120lt Lithuania 208 65 - 7 54 44 30 0 37 2lu Luxembourg 125 - - - - - 7 - - 6lv Latvia 456 236 27 6 23 - 90 3 39 0mt Malta 6 300 - - 40 - - - - -nl Netherlands 1 077 2 884 913 713 548 1 143 683 660 587 704no Norway 3 125 397 753 1 918 2 095 2 944 785 - - 2pl Poland 1 330 285 859 217 312 8 58 13 10 39pt Portugal 305 99 - 336 101 53 - 44 27 15ro Romania 312 266 164 47 125 - - - 25 24se Sweden 864 746 841 301 105 - 125 129 4 38si Slovenia 34 - - - 10 - 5 10 - 0sk Slovakia 11 - - - 7 - - 1 - 14uk United Kingdom 4 906 4 571 1 298 3 085 1 406 1 839 2 007 729 - 44Total 27 300 22 700 17 600 15 400 10 000 9 000 9 400 8 100 2 100 2 000
Marine aggregates
---
2 -4 -0 -
--
9 -4 -0 382 -6 -
-9 -
-- -2 -2 -4 -6 -
-6 -
-6 -
-4 -9 2940 300
Coastal tourism Cruise tourism Fisheries
- 17 33224 - 87185 - 5762 - 32
- - 341 245 373 7001 019 7 735
58 - 8512 652 51 2 889
170 - 1246 285 33 3 1001 879 - 1 182
- 7 26513 23 608
8 217 673 2 10924 - 63
- - -32 - 92
162 - 321 111 43 394
706 318 1 23660 6 243
1 139 58 666172 - 65466 3 186109 - 13
- 1 146 878 967 1 489
44 100 2 600 16 200

Policy Research Corporation 188 July 200813 November 2008
ANNEX 4: ANALYSIS OF DIFFERENCES IN EMPLOYMENT FIGURES PER COUNTRY
PRC-figures - Country figures
+ 6%+ 73 800+ 67 200+ 21 200+ 40 300+4 400+5 400- 61 200+ 7 000+ 15 800- 10 200- 16 100Total (28 countries)
+ 27 400
+ 3 900
- 23 700
- 7 600
- 7 100
+ 10 100
+ 21 000
Total
- 13 200
0
+ 2 900
- 21 900
- 21 000
(+1 600)
(+2 500)
Recre-ational
boating**
+ 11%+ 18 4000(+1 200)n.a.+ 17 10000+ 8 600+ 300- 5 000UK
+ 3%+ 3 900000000000Netherlands
- 11%+ 23 300(+47 300)(+200)(+ 700)- 63 000n.a.- 23 500+ 2 800- 13 900- 500Spain
- 3%+ 1 700- 4 000(+2 900)n.a.-1 200n.a.+ 6 900+ 11 300+ 400- 3 500Italy
- 2%+ 3 200- 4 700(+3 500)(+3 600)- 12 700- 500+ 21 800+ 1 000- 1 300France
+ 23%(+2 700)(+2 300)(+200)(+200)- 2 400+ 700+ 8 200- 6000- 2 800Finland
(+14 100)
Fishe-ries***
(+200)
Maritime works
n.a.
Inland navi-gation
n.a.
Seaports
(+ 300)
Navy and
coast-guard
0
Marine equip-ment
+ 6 600
Offshore
+ 22%+ 9000- 3 600Denmark
% of PRC-
figures
Shipbuil-ding**
Maritime services
Ship-ping*
Sector
Country****
Legend* Shipping excludes foreign seafarers** Shipbuilding includes yacht building and recreational boating includes the services related to yachts (e.g. renting)*** Fisheries includes fishing, aquaculture and fish processing (LEI figures)**** Denmark: offshore and coastal wind energy is excluded in country figures (source: Ministry of Economics and Business Affairs
(2006) – The Danish Maritime Cluster: an agenda for growth)Finland: marine equipment: not all equipment manufacturing companies are inquired to obtain country figures (source: Association of Finnish Maritime Industries (2003) – The Finnish maritime cluster)France: seaports include non-maritime port services in country figures (source: Cluster Maritime Français, 2005)Italy: source: Federazione del Mare (2006) – Rapporto sull’ economia del mareSpain: in country figures maritime services includes non-maritime part of services, shipbuilding includes indirect employment, marine equipment includes non-maritime part and ports include logistics (source: Spanish Maritime Cluster (2005) – Quantification and economic impact of the maritime sector and CEET estimates)The Netherlands: source: Policy Research Corporation (2006) – Economic monitor of Dutch maritime clusterUnited Kingdom: in country figures seaports exclude maritime port related services (source: Sea Vision UK, 2005)
∆ = PRC - Country figures+ = PRC > Country figure- = PRC < Country figure0 = PRC = Country figure( ) = not included in country figuresn.a. = not available

Policy Research Corporation 198 July 200813 November 2008
ANNEX 4: ANALYSIS OF DIFFERENCES IN EMPLOYMENT FIGURES PER COUNTRY
France
0
10 000
20 000
30 000
40 000
50 000
60 000
70 000
Fisheries* Navy andcoastguard**
Recreationalboating***
Ports**** Shipbuildingand marine
equipment***
Offshoresupply*****
Shipping****** Maritimeservices
Maritimeworks
Inlandnavigation
PRC-figures
Information from Cluster Maritime Français, 2005
- 1 300
+ 1 000
+ 21 800
- 500
- 12 700
+ 3 600 +3 500
- 4 700
- 21 000
+ 3 200
Pers
ons e
mpl
oyed
* Fisheries includes fishing, aquaculture and fish processing in PRC-figures (source: LEI figures)** Navy and coastguard includes all government action at sea (from sea rescue to aircraft carriers) in country figures; aircraft carriers are excluded in PRC-figures*** Shipbuilding includes yacht building and recreational boating includes the services related to yachts (e.g. renting) in PRC-figures**** Seaports include non-maritime port services in country figures***** Offshore supply includes a part of maritime services in country figures****** Shipping excludes foreign seafarers in PRC-figures
Total PRC figures – Total country figures = - 7 100 ( = 295 200 – 302 300)

Policy Research Corporation 208 July 200813 November 2008
ANNEX 4: ANALYSIS OF DIFFERENCES IN EMPLOYMENT FIGURES PER COUNTRY
Italy
* Shipbuilding and marine equipment includes yacht building and recreational boating includes the services related to yachts (e.g. renting) in PRC-figures; recreational boating in country figures is based upon direct and indirect effects of the sector and marine equipment is based upon indirect effects of shipbuilding industry in Federazione del Mare (2002) – Rapporto sull’ economia del mare
** Fisheries includes fishing, aquaculture and fish processing in PRC-figures (source: LEI figures)*** Navy and coastguard includes all government action at sea (from sea rescue to aircraft carriers) in country figures**** Ports include a part of maritime services***** Shipping excludes foreign seafarers in PRC-figures
Total PRC figures – Total country figures = - 7 600 (= 244 100 – 251 700)
0
10 000
20 000
30 000
40 000
50 000
60 000
70 000
80 000
90 000
Recreationalboating*
Fisheries** Navy andcoastguard***
Ports**** Marineequipment*
Shipbuilding* Shipping***** Inlandnavigation
Maritimeservices
Federazione del Mare (2006) – Rapporto sull’economia del mare
PRC-figures
Pers
ons e
mpl
oyed
+ 1 700
- 4 000
- 21 900
- 1 200+ 6 900 + 11 300 - 3 500
+ 2 900 + 400

Policy Research Corporation 218 July 200813 November 2008
ANNEX 4: ANALYSIS OF DIFFERENCES IN EMPLOYMENT FIGURES PER COUNTRY
Spain
Spanish Maritime Cluster (2005) – Quantification and economic impact of the maritime sector and CEET estimates
* Fisheries includes fishing, aquaculture and fish processing in PRC-figures (source: LEI figures)** Seaports include logistics in country figures*** Recreational boating includes services in PRC-figures, not yacht building **** Marine equipment includes non-maritime part in country figures***** Shipbuilding includes yacht building in PRC-figures****** Maritime services includes non-maritime part of services in country figures
Total PRC figures – Total country figures*
= - 23 700 ( = 224 000 – 247 700)
Pers
ons e
mpl
oyed
PRC-figures
0
10 000
20 000
30 000
40 000
50 000
60 000
70 000
80 000
90 000
100 000
Fisheries* Navy andcoastguard
Ports** Recreationalboating***
Marineequipment****
Shipping Shipbuilding***** Maritimeservices******
Maritimeworks
Inlandnavigation
Ecotec
* Commerce and distribution and other activities related are excluded in this figure; total country figure including these sectors amounts to 345 800
Policy Research Corporation 228 July 200813 November 2008
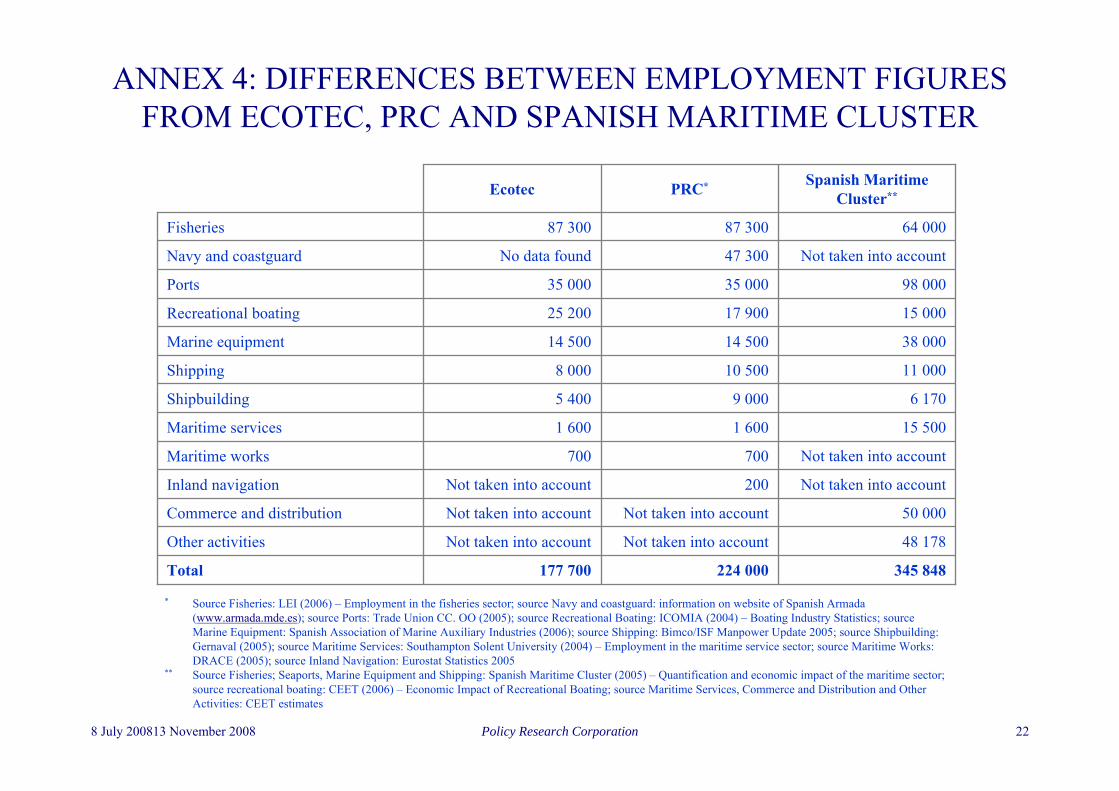
ANNEX 4: DIFFERENCES BETWEEN EMPLOYMENT FIGURES FROM ECOTEC, PRC AND SPANISH MARITIME CLUSTER
345 848224 000177 700Total
48 178Not taken into accountNot taken into accountOther activities
50 000Not taken into accountNot taken into accountCommerce and distribution
Not taken into account
No data found
Not taken into account200Inland navigation
Not taken into account700700Maritime works
15 5001 6001 600Maritime services
6 1709 0005 400Shipbuilding
11 00010 5008 000Shipping
38 00014 50014 500Marine equipment
15 00017 90025 200Recreational boating
98 00035 00035 000Ports
Not taken into account47 300Navy and coastguard
64 00087 30087 300Fisheries
Spanish Maritime Cluster**PRC*Ecotec
* Source Fisheries: LEI (2006) – Employment in the fisheries sector; source Navy and coastguard: information on website of Spanish Armada (www.armada.mde.es); source Ports: Trade Union CC. OO (2005); source Recreational Boating: ICOMIA (2004) – Boating Industry Statistics; source Marine Equipment: Spanish Association of Marine Auxiliary Industries (2006); source Shipping: Bimco/ISF Manpower Update 2005; source Shipbuilding: Gernaval (2005); source Maritime Services: Southampton Solent University (2004) – Employment in the maritime service sector; source Maritime Works: DRACE (2005); source Inland Navigation: Eurostat Statistics 2005
** Source Fisheries; Seaports, Marine Equipment and Shipping: Spanish Maritime Cluster (2005) – Quantification and economic impact of the maritime sector; source recreational boating: CEET (2006) – Economic Impact of Recreational Boating; source Maritime Services, Commerce and Distribution and Other Activities: CEET estimates
Policy Research Corporation 238 July 200813 November 2008
0
10 000
20 000
30 000
40 000
50 000
60 000
70 000
Navy andcoastguard
Ports* Fisheries** Shipbuilding*** Maritimeservices
Shipping**** Marineequipment
Recreationalboating***
Inlandnavigation
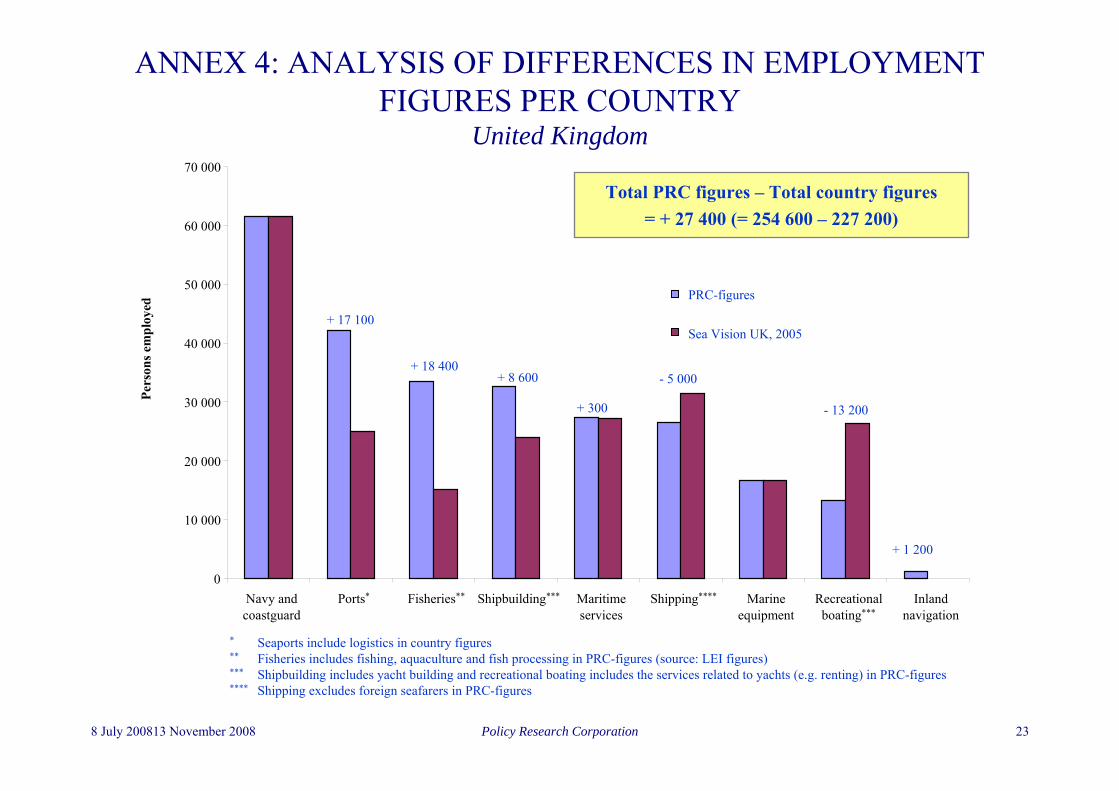
ANNEX 4: ANALYSIS OF DIFFERENCES IN EMPLOYMENT FIGURES PER COUNTRY
United Kingdom
Sea Vision UK, 2005
- 13 200+ 300
- 5 000+ 8 600
+ 1 200
+ 17 100
+ 18 400
* Seaports include logistics in country figures** Fisheries includes fishing, aquaculture and fish processing in PRC-figures (source: LEI figures)*** Shipbuilding includes yacht building and recreational boating includes the services related to yachts (e.g. renting) in PRC-figures**** Shipping excludes foreign seafarers in PRC-figures
Total PRC figures – Total country figures = + 27 400 (= 254 600 – 227 200)
Pers
ons e
mpl
oyed
PRC-figures

Policy Research Corporation 248 July 200813 November 2008
ANNEX 5: AREA 1 RESULTS TO BE INTEGRATED IN THE EUROPEAN CLUSTER OBSERVATORY’S DATABASE
0.21%
0.40%
0.59%
0.67%
0.70%
0.71%
0.91%
1.22%
1.26%
1.33%
1.35%
1.72%
2.12%
2.16%
1.14%
1.36%
1.54%
1.70%
1.89%
1.97%
2.03%
3.00%
3.11%
3.46%
4.31%
1.75%
2.40%
2.60%
4.19%
Size
StrongHigh28.61%0.71%59 757Area 1pl63 Pomorskie
StrongN/A10.67%0.75%4 106Area 1be23 Prov. Oost-Vlaanderen
StrongLow15.13%0.05%7 617Area 1mt Malta
StrongN/A16.29%0.08%11 392Area 1nl34 Zeeland
WeakMedium14.87%0.14%12 770Area 1de50 Bremen
StrongN/A11.71%0.93%13 516Area 1ukl1 West Wales and The Valleys
StrongMedium12.79%1.17%13 633Area 1ukc1 Tees Valley and Durham
Very strongLow14.09%0.07%17 507Area 1bg34 Yugoiztochen
Very strongHigh14.35%0.35%23 354Area 1no01 Oslo og Akershus
StrongHigh12.67%0.92%24 203Area 1ukj3 Hampshire and Isle of Wight
StrongHigh13.63%1.07%25 581Area 1be21 Prov. Antwerpen
StrongLow25.90%0.25%32 553Area 1pl42 ZachodniopomorskieWeakHigh29.58%0.24%29 598Area 1fi18 Etelä-Suomi
Very strongHigh28.04%1.21%26 096Area 1no04 Agder og RogalandStrongMedium25.71%2.86%21 950Area 1uke1 East Yorkshire and Northern LincolnshireWeakMedium13.28%0.39%41 503Area 1fr52 Bretagne
Very strongMedium13.23%0.48%40 634Area 1def0 Schleswig-Holstein
Very strongMedium14.26%0.29%25 852Area 1ee00 Estonia
WeakHigh12.02%0.40%32 988Area 1gr30 Attiki
StrongHigh22.83%2.36%36 200Area 1uki1 Inner London
WeakLow25.16%0.37%37 731Area 1de80 Mecklenburg-Vorpommern
Very strongLow23.76%1.23%38 894Area 1lv Latvia
StrongMedium23.70%1.35%57 545Area 1fr82 Provence-Alpes-Côte d'Azur
Very strongHigh 23.86%4.58%66 491Area 1nl33 Zuid-Holland
StrongMedium23.00%6.41%82 632Area 1dk0 Denmark
Very strongHigh34.48%0.96%33 545Area 1fr23 Haute-Normandie
WeakMedium311.71%1.33%46 139Area 1no05 Vestlandet
49 864
80 366
Persons employed
3
3
Stars
Low
N/A
Innovation
0.76%
2.22%
Specialisation
8.04%
7.04%
Focus
StrongArea 1itc3 Liguria
WeakArea 1ro22 Sud-Est
ExportsCategoryNUTS II region

Policy Research Corporation 258 July 200813 November 2008
Very StrongN/A18.00%0.00%0.23%5 566Area 2gr41 Voreio AigaioStrongLow111.24%0.00%0.30%7 204Area 2fr83 Corse
0.45%0.57%0.57%0.65%1.00%1.01%1.24%1.26%1.39%1.39%1.46%1.51%1.55%1.89%1.99%1.64%1.69%1.85%1.96%1.99%2.22%2.35%3.24%3.94%4.12%6.87%1.77%3.52%3.66%
Size
StrongMedium24.19%0.56%78 391Area 2itd5 Emilia-Romagna
Very StrongLow17.41%0.01%11 000Area 2mt MaltaStrongHigh15.86%0.02%13 706Area 2ukk3 Cornwall and Isles of Scilly
Very strongN/A15.68%0.01%13 840Area 2gr25 PeloponnisosVery strongN/A117.29%0.01%15 684Area 2gr22 Ionia NisiaVery strongN/A120.14%0.02%24 243Area 2gr42 Notio AigaioVery strongN/A19.52%0.02%24 474Area 2gr43 Kriti
StrongHigh15.92%0.10%29 941Area 2ukk4 DevonVery StrongLow18.78%0.06%30 555Area 2cy00 CyprusVery StrongLow117.30%0.04%33 548Area 2pt15 Algarve
StrongMedium15.41%0.10%33 554Area 2itc3 Liguria
StrongMedium22.97%0.18%44 839Area 2ite1 ToscanaStrongLow22.37%0.15%40 894Area 2itf3 CampaniaStrongHigh24.38%0.17%39 789Area 2ukj3 Hampshire and Isle of WightWeakHigh11.74%0.08%48 017Area 2dk0 DenmarkWeakN/A14.00%0.09%45 610Area 2ro22 Sud-Est
Very strongN/A19.62%0.05%37 456Area 2bg33 Severoiztochen
Very StrongN/A18.22%0.05%35 197Area 2bg34 YugoiztochenStrongLow13.00%0.12%36 635Area 2itf4 Puglia
StrongLow23.23%0.21%47 505Area 2itg1 SiciliaStrongHigh23.81%0.26%48 138Area 2ukj2 Surrey, East and West SussexStrongMedium23.45%0.12%53 582Area 2fr82 Provence-Alpes-Côte d'AzurStrongMedium22.75%0.29%56 740Area 2itd3 Veneto
Very strongLow24.64%0.31%95 250Area 2es52 Comunidad ValencianaVery strongLow23.31%0.34%99 679Area 2es61 AndaluciaVery strongMedium25.05%0.93%166 161Area 2es51 Cataluña
StrongHigh35.42%0.20%42 891Area 2ukl1 West Wales and The Valleys85 19088 457
Persons employed
33
Stars
LowLow
Innovation
0.25%0.26%
Specialisation
18.20%10.58%
Focus
Very strongArea 2es53 Illes BalearsVery strongArea 2es70 Canarias (ES)
ExportsCategoryNUTS II region
ANNEX 5: AREA 2 RESULTS TO BE INTEGRATED IN THE EUROPEAN CLUSTER OBSERVATORY’S DATABASE

Policy Research Corporation 268 July 200813 November 2008
N/AN/A11.27%0.02%0.53%2 337Area 3nl23 FlevolandStrongN/A12.75%0.01%0.56%2 493Area 3gr22 Ionia Nisia
0.62%0.65%0.68%0.71%0.76%0.84%0.91%0.98%1.04%1.05%1.17%1.17%1.44%1.48%1.54%1.10%1.37%1.51%1.60%1.78%2.15%2.38%2.39%2.70%3.11%3.17%2.20%4.17%
10.24%
Size
N/AN/A20.93%0.28%10 600Area 3ro22 Sud-Est
Very strongN/A11.40%0.02%2 738Area 3no06 TrøndelagStrongN/A11.26%0.01%2 875Area 3gr11 Anatoliki Makedonia, Thraki
Very strongN/A11.35%0.02%3 009Area 3no07 Nord-NorgeStrongN/A11.29%0.02%3 154Area 3gr25 PeloponnisosWeakMedium11.29%0.05%3 375Area 3de50 BremenStrongN/A13.10%0.03%3 733Area 3gr42 Notio AigaioStrongLow11.70%0.03%4 056Area 3es13 CantabriaStrongN/A16.24%0.04%4 346Area 3gr41 Voreio AigaioStrongN/A12.12%0.07%4 612Area 3gr24 Sterea ElladaWeakMedium11.21%0.09%4 658Area 3uke1 East Yorkshire and Northern Lincolnshire
StrongMedium21.10%0.09%6 700Area 3ee00 EstoniaWeakMedium21.12%0.21%6 063Area 3fr25 Basse-NormandieWeakMedium22.29%0.12%4 887Area 3ukm6 Highlands and IslandsStrongMedium10.21%0.08%6 841Area 3es51 Cataluña
Very strongLow10.45%0.08%6 565Area 3lt LithuaniaWeakLow10.52%0.08%6 401Area 3itf4 Puglia
WeakMedium11.79%0.06%5 184Area 3ukm5 North Eastern ScotlandWeakMedium10.33%0.10%5 187Area 3fr51 Pays de la Loire
WeakLow21.02%0.09%7 104Area 3pl63 PomorskieStrongLow20.44%0.10%7 892Area 3pt11 NorteWeakMedium21.23%1.71%9 532Area 3fr53 Poitou-Charentes
Very strongLow21.02%0.23%10 580Area 3lv Latvia
WeakLow20.82%0.27%12 005Area 3itg1 SiciliaStrongLow20.46%0.27%13 821Area 3es61 Andalucia
Very strongHigh20.51%0.43%14 060Area 3dk0 DenmarkStrongLow35.03%1.04%9 754Area 3pt15 Algarve
18 50245 487
Persons employed
33
Stars
MediumLow
Innovation
0.99%4.38%
Specialisation
1.46%4.03%
Focus
WeakArea 3fr52 BretagneStrongArea 3es11 Galicia
ExportsCategoryNUTS II region
ANNEX 5: AREA 3 RESULTS TO BE INTEGRATED IN THE EUROPEAN CLUSTER OBSERVATORY’S DATABASE
Policy Research Corporation 278 July 200813 November 2008
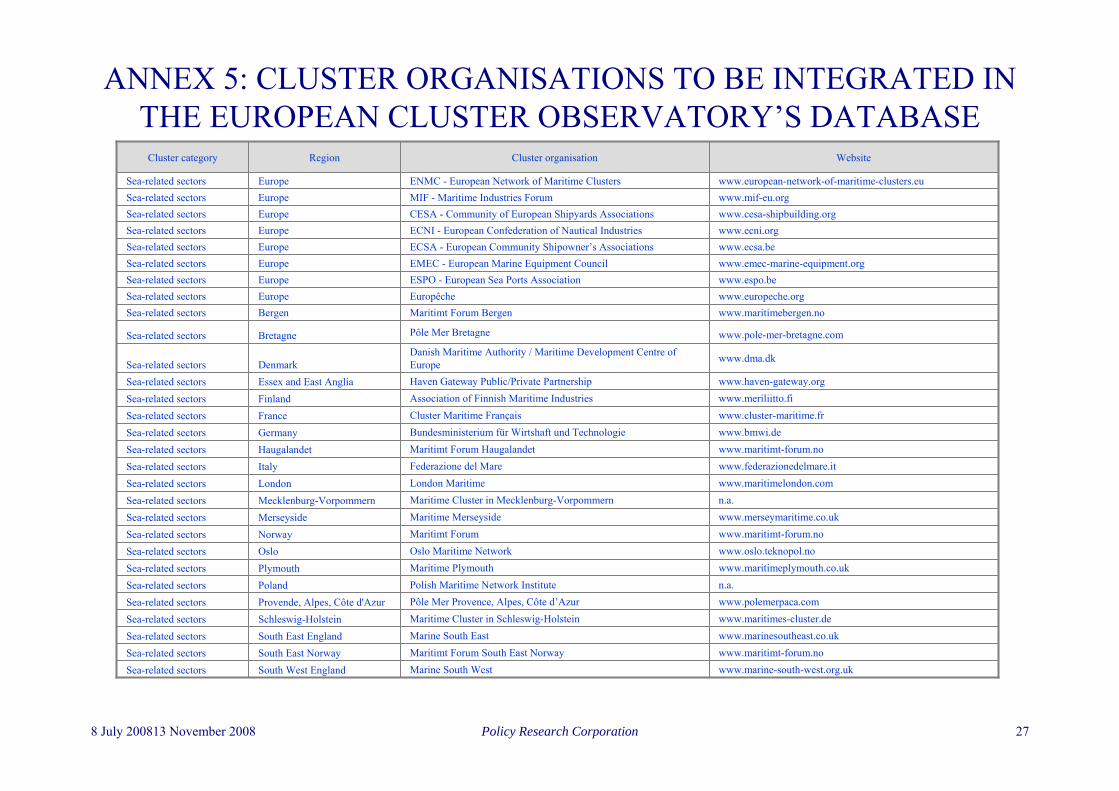
ANNEX 5: CLUSTER ORGANISATIONS TO BE INTEGRATED IN THE EUROPEAN CLUSTER OBSERVATORY’S DATABASE
www.espo.beESPO - European Sea Ports AssociationEuropeSea-related sectors
www.marine-south-west.org.ukMarine South WestSouth West EnglandSea-related sectorswww.maritimt-forum.noMaritimt Forum South East NorwaySouth East NorwaySea-related sectorswww.marinesoutheast.co.ukMarine South EastSouth East EnglandSea-related sectorswww.maritimes-cluster.deMaritime Cluster in Schleswig-HolsteinSchleswig-HolsteinSea-related sectorswww.polemerpaca.comPôle Mer Provence, Alpes, Côte d’AzurProvende, Alpes, Côte d'AzurSea-related sectorsn.a.Polish Maritime Network InstitutePolandSea-related sectorswww.maritimeplymouth.co.ukMaritime PlymouthPlymouthSea-related sectorswww.oslo.teknopol.noOslo Maritime NetworkOsloSea-related sectorswww.maritimt-forum.noMaritimt ForumNorwaySea-related sectorswww.merseymaritime.co.ukMaritime MerseysideMerseysideSea-related sectors
www.haven-gateway.orgHaven Gateway Public/Private PartnershipEssex and East AngliaSea-related sectorswww.meriliitto.fiAssociation of Finnish Maritime IndustriesFinlandSea-related sectorswww.cluster-maritime.frCluster Maritime FrançaisFranceSea-related sectorswww.bmwi.deBundesministerium für Wirtshaft und TechnologieGermanySea-related sectorswww.maritimt-forum.noMaritimt Forum HaugalandetHaugalandetSea-related sectorswww.federazionedelmare.itFederazione del MareItalySea-related sectors
n.a.Maritime Cluster in Mecklenburg-VorpommernMecklenburg-VorpommernSea-related sectorswww.maritimelondon.comLondon MaritimeLondonSea-related sectors
www.dma.dkDanish Maritime Authority / Maritime Development Centre of EuropeDenmarkSea-related sectors
www.pole-mer-bretagne.comPôle Mer BretagneBretagneSea-related sectors
www.maritimebergen.noMaritimt Forum BergenBergenSea-related sectorswww.europeche.orgEuropêcheEuropeSea-related sectors
www.emec-marine-equipment.orgEMEC - European Marine Equipment CouncilEuropeSea-related sectorswww.ecsa.beECSA - European Community Shipowner’s AssociationsEuropeSea-related sectorswww.ecni.orgECNI - European Confederation of Nautical IndustriesEuropeSea-related sectorswww.cesa-shipbuilding.orgCESA - Community of European Shipyards AssociationsEuropeSea-related sectors
MIF - Maritime Industries ForumENMC - European Network of Maritime Clusters
Cluster organisation
www.mif-eu.orgEuropeSea-related sectorswww.european-network-of-maritime-clusters.euEuropeSea-related sectors
WebsiteRegionCluster category

Policy Research Corporation 288 July 200813 November 2008
FR
North SeaNL
Brussels
ANNEX 6: EMPLOYMENT IN ALL SEA-RELATED SECTORS ON NUTS II-LEVEL IN BELGIUM
Belgium employs 36 700 persons in Area 1, 9 700 persons in Area 2 and1 700 persons in Area 3
Employment figures for Belgium in all Areas
Employment figures for Belgium in all Areas
36 700
9 700
1 700
0
5 000
10 000
15 000
20 000
25 000
30 000
35 000
40 000
Area 1 Area 2 Area 3
Pers
ons e
mpl
oyed
Source: Policy Research based on Ecotec (2006) – Employment trends in all sectors related to the sea or using sea-resources, Vlaamse Havencommissie (2005) –Jaaroverzicht van de Vlaamse Havens 2005, BIMCO/ISF (2005) – Manpower 2005 update, and Eurostat – Industry, Trade and Services (Annual enterprise statistics) 2005, Eurostat – Maritime Transport 2005, Eurostat – Tourism indicators 2005, and LEI (2006) – Employment in the fisheries sector
4 100
25 600
7 000 9 700 1 700
∑ = 48 100
Belgium
Area 1: Traditional maritime sectorsArea 2: Coastal (and marine) tourism and recreationArea 3: Fisheries
Area 1: Traditional maritime sectorsArea 2: Coastal (and marine) tourism and recreationArea 3: Fisheries

Policy Research Corporation 298 July 200813 November 2008
ANNEX 6: EMPLOYMENT IN SEA-RELATED SECTORS ON NUTS II-LEVEL IN BULGARIA
Bulgaria employs 29 700 persons in Area 1, 72 700 persons in Area 2 and900 persons in Area 3
Employment figures for Bulgaria in all Areas
Employment figures for Bulgaria in all Areas
Source: Policy Research based on Houthoff Buruma and Policy Research (2007) – IPR Shipbuilding study, BIMCO/ISF (2005) – Manpower 2005 update, Eurostat –Maritime Transport Statistics 2005, Eurostat – Industry, Trade and Services (Annual enterprise statistics) 2005, Eurostat – Tourism indicators 2005, and United Nations (2004) – Fishery country profile
17 50035 200
500
29 700
72 700
9000
10 000
20 000
30 000
40 000
50 000
60 000
70 000
80 000
Area 1 Area 2 Area 3
Pers
ons e
mpl
oyed
12 200
37 500
400
∑ = 103 300
Bulgaria
Area 1: Traditional maritime sectorsArea 2: Coastal (and marine) tourism and recreationArea 3: Fisheries
Area 1: Traditional maritime sectorsArea 2: Coastal (and marine) tourism and recreationArea 3: Fisheries

Policy Research Corporation 308 July 200813 November 2008
Employment figures for Cyprus in all Areas
Employment figures for Cyprus in all Areas
ANNEX 6: EMPLOYMENT IN SEA-RELATED SECTORS ON NUTS II-LEVEL IN CYPRUS
Cyprus employs 10 100 persons in Area 1, 30 600 persons in Area 2 and1 200 persons in Area 3
Source: Policy Research based on Ecotec (2006) – Employment trends in all sectors related to the sea or using sea-resources, Houthoff Buruma and Policy Research (2007) – IPR Shipbuilding study, BIMCO/ISF (2005) – Manpower 2005 update, Eurostat – Tourism indicators 2005, and LEI (2006) – Employment in the fisheries sector
10 100
30 600
1 200
0
5 000
10 000
15 000
20 000
25 000
30 000
35 000
Area 1 Area 2 Area 3
Pers
ons e
mpl
oyed
10 10030 600
1 200
∑ = 41 900
Cyprus
Area 1: Traditional maritime sectorsArea 2: Coastal (and marine) tourism and recreationArea 3: Fisheries
Area 1: Traditional maritime sectorsArea 2: Coastal (and marine) tourism and recreationArea 3: Fisheries

Policy Research Corporation 318 July 200813 November 2008
DE
Baltic Sea
Kattegat
Skagerrak
Copenhagen
Employment figures for Denmark in all Areas
Employment figures for Denmark in all Areas
ANNEX 6: EMPLOYMENT IN SEA-RELATED SECTORS ON NUTS II-LEVEL IN DENMARK
82 600
48 000
14 100
82 600
48 000
14 100
0
10 000
20 000
30 000
40 000
50 000
60 000
70 000
80 000
90 000
Area 1 Area 2 Area 3
Pers
ons e
mpl
oyed
Denmark employs 82 600 persons in Area 1, 48 000 persons in Area 2 and14 100 persons in Area 3
Source: Policy Research based on Ecotec (2006), the Danish Maritime Authority (2007) – Fakta om søfart, Eurostat – Tourism indicators 2005 and LEI (2006) –Employment in the fisheries sector
∑ = 144 700
Denmark
Area 1: Traditional maritime sectorsArea 2: Coastal (and marine) tourism and recreationArea 3: Fisheries
Area 1: Traditional maritime sectorsArea 2: Coastal (and marine) tourism and recreationArea 3: Fisheries

Policy Research Corporation 328 July 200813 November 2008
Employment figures for Estonia in all Areas
Employment figures for Estonia in all Areas
ANNEX 6: EMPLOYMENT IN SEA-RELATED SECTORSON NUTS II-LEVEL IN ESTONIA
Estonia employs 25 900 persons in Area 1, 7 200 persons in Area 2 and6 700 persons in Area 3
Source: Policy Research based on Ecotec (2006) – Employment trends in all sectors related to the sea or using sea-resources, Houthoff Buruma and Policy Research (2007) – IPR Shipbuilding study, BIMCO/ISF (2005) – Manpower 2005 update, Eurostat – Tourism indicators 2005, and LEI (2006) – Employment in the fisheries sector
25 9007 200 6 700
25 900
7 200 6 700
0
5 000
10 000
15 000
20 000
25 000
30 000
Area 1 Area 2 Area 3
Pers
ons e
mpl
oyed
∑ = 39 800
Estonia
Area 1: Traditional maritime sectorsArea 2: Coastal (and marine) tourism and recreationArea 3: Fisheries
Area 1: Traditional maritime sectorsArea 2: Coastal (and marine) tourism and recreationArea 3: Fisheries

Policy Research Corporation 338 July 200813 November 2008
ANNEX 6: EMPLOYMENT IN SEA-RELATED SECTORS ON NUTS II-LEVEL IN FINLAND
Finland employs 42 100 persons in Area 1, 5 300 persons in Area 2 and2 700 persons in Area 3
Employment figures for Finland in all Areas*
Employment figures for Finland in all Areas*
42 100
5 3002 700
0
5 000
10 000
15 000
20 000
25 000
30 000
35 000
40 000
45 000
Area 1 Area 2 Area 3
Pers
ons e
mpl
oyed
10 400500 1 200
* Annex 4 shows the differences in employment with the Finnish maritime cluster studies; in this country map only the most significant regions with regard to employ-ment in Area 1, 2 and/or 3 are shown; hence the sum of employment figures shown in this map is somewhat lower than total employment in Area 1, 2 and/or 3
Source: Policy Research based on Ecotec (2006) – Employment trends in all sectors related to the sea or using sea-resources, Houthoff Buruma and Policy Research (2007) – IPR Shipbuilding study, BIMCO/ISF (2005) – Manpower 2005 update, CESA – Annual Report 2006-2007, Eurostat – Industry, Trade and Services (Annual enterprise statistics) 2005, Eurostat – Tourism indicators 2005, and LEI (2006) – Employment in the fisheries sector
∑ = 50 100
29 600
3 400 600
Finland
Area 1: Traditional maritime sectorsArea 2: Coastal (and marine) tourism and recreationArea 3: Fisheries
Area 1: Traditional maritime sectorsArea 2: Coastal (and marine) tourism and recreationArea 3: Fisheries

Policy Research Corporation 348 July 200813 November 2008
Paris
Employment figures for France in all Areas*
Employment figures for France in all Areas*
ANNEX 6: EMPLOYMENT IN SEA-RELATED SECTORS ON NUTS II-LEVEL IN FRANCE
57 40053 600
2 100
22 30012 5004 600
41 50030 400
18 500
20 80014 1005 500
33 40011 3002 400
20 00010 3006 100
16 00017 8005 200
7 70012 3009 500
6 10026 100
4 400
1 400 7 200 400
France employs 230 700 persons in Area 1, 208 200 persons in Area 2 and64 700 persons in Area 3
* Annex 4 explains the differences in employment with the French maritime cluster study; in this country map only the most significant regions with regard to employ-ment in Area 1, 2 and/or 3 are shown; hence the sum of employment figures shown in this map is somewhat lower than total employment in Area 1, 2 and/or 3
Source: Policy Research based on Ecotec (2006) – Employment trends in all sectors related to the sea or using sea-resources, Information of French Maritime Cluster organisation, L’Insee (2006) – Ports Maritimes Autonomes, Eurostat – Tourism indicators 2005 and LEI (2006) – Employment in the fisheries sector
∑ = 503 600
France
Area 1: Traditional maritime sectorsArea 2: Coastal (and marine) tourism and recreationArea 3: Fisheries
Area 1: Traditional maritime sectorsArea 2: Coastal (and marine) tourism and recreationArea 3: Fisheries
230 700
208 200
64 700
0
50 000
100 000
150 000
200 000
250 000
Area 1 Area 2 Area 3
Pers
onse
mpl
oyed

Policy Research Corporation 358 July 200813 November 2008
Berlin
Employment figures for Germany in all Areas*
Employment figures for Germany in all Areas*
ANNEX 6: EMPLOYMENT IN SEA-RELATED SECTORS ON NUTS II-LEVEL IN GERMANY
197 500
73 300
16 400
0
50 000
100 000
150 000
200 000
250 000
Area 1 Area 2 Area 3
Pers
ons e
mpl
oyed
40 60025 300
2 900
25 30012 300
1 800
37 70026 100
1 90027 100
800
12 800800 3 400
Germany employs 197 500 persons in Area 1, 73 300 persons in Area 2 and16 400 persons in Area 3
* In this country map only the most significant regions with regard to employment in Area 1, 2 and/or 3 are shown; hence the sum of employment figures shown in this map is somewhat lower than total employment in Area 1, 2 and/or 3
Source: Policy Research based on information of German maritime cluster organisation, Ecotec (2006) – Employment trends in all sectors related to the sea or using sea-resources, Zentralverband der deutschen Seehafenbetriebe (2005) – Seegüterumschlag ausgewählter Häfen, and Eurostat – Tourism Indicators 2005 and LEI (2006) –Employment in the fisheries sector
∑ = 286 900
45 000
Germany
Area 1: Traditional maritime sectorsArea 2: Coastal (and marine) tourism and recreationArea 3: Fisheries
Area 1: Traditional maritime sectorsArea 2: Coastal (and marine) tourism and recreationArea 3: Fisheries

Policy Research Corporation 368 July 200813 November 2008
ANNEX 6: EMPLOYMENT IN SEA-RELATED SECTORS ON NUTS II-LEVEL IN GREECE
Employment figures for Greece in all areas*
Employment figures for Greece in all areas*
Ionian Sea
Aegean Sea
Athens
5 90024 500
1 800
2 50024 200
3 700
200 5 600 4 300
33 000
4 700
5 500 7 800 4 60070015 700
2 500
10 600
35 900
5 100
76 200
165 300
37 700
0
20 000
40 000
60 000
80 000
100 000
120 000
140 000
160 000
180 000
Area 1 Area 2 Area 3
Pers
ons e
mpl
oyed
Greece employs 76 200 persons in Area 1, 165 300 persons in Area 2 and37 700 persons in Area 3
* In the country maps only the most significant regions with regard to employment in Area 1, 2 and/or 3 are shown; hence the employment shown in this and following maps is somewhat lower than employment in Area 1, 2 and/or 3
Source: Policy Research based on Ecotec (2006) – Employment trends in all sectors related to the sea or using sea-resources, Houthoff Buruma and Policy Research (2007) – IPR Shipbuilding study, BIMCO/ISF (2005) – Manpower 2005 update, Eurostat – Tourism indicators 2005, and LEI (2006) – Employment in the fisheries sector
∑ = 279 200
Greece
Area 1: Traditional maritime sectorsArea 2: Coastal (and marine) tourism and recreationArea 3: Fisheries
Area 1: Traditional maritime sectorsArea 2: Coastal (and marine) tourism and recreationArea 3: Fisheries

Policy Research Corporation 378 July 200813 November 2008
Employment figures for Ireland in all Areas
Employment figures for Ireland in all Areas
ANNEX 6: EMPLOYMENT IN SEA-RELATED SECTORS ON NUTS II-LEVEL IN IRELAND
Ireland employs 6 400 persons in Area 1, 21 400 persons in Area 2 and10 600 persons in Area 3
Source: Policy Research based on Ecotec (2006) – Employment trends in all sectors related to the sea or using sea-resources, Houthoff Buruma and Policy Research (2007) – IPR Shipbuilding study, BIMCO/ISF (2005) – Manpower 2005 update, Eurostat – Tourism indicators 2005, and LEI (2006) – Employment in the fisheries sector
6 400
21 400
10 600
0
5 000
10 000
15 000
20 000
25 000
Area 1 Area 2 Area 3
Pers
ons e
mpl
oyed
6 100 14 900 5 700
300 6 500 4 900
∑ = 38 400
Ireland
Area 1: Traditional maritime sectorsArea 2: Coastal (and marine) tourism and recreationArea 3: Fisheries
Area 1: Traditional maritime sectorsArea 2: Coastal (and marine) tourism and recreationArea 3: Fisheries

Policy Research Corporation 388 July 200813 November 2008
Rome
Employment figures for Italy in all Areas*Employment figures for Italy in all Areas*
ANNEX 6: EMPLOYMENT IN SEA-RELATED SECTORS ON NUTS II-LEVEL IN ITALY
196 100
480 700
48 000
0
100 000
200 000
300 000
400 000
500 000
600 000
Area 1 Area 2 Area 3
Pers
ons e
mpl
oyed
49 90033 600
1 400
18 500
56 700
3 800
7 200
78 400
2 900
20 70044 800
1 500
10 900
40 900
3 40012 500
36 600
6 400
9 600
47 500
12 000
13 60026 300
3 800
Italy employs 196 100 persons in Area 1, 480 700 persons in Area 2 and48 000 persons in Area 3
* Annex 4 explains the differences in employment with the Italian maritime cluster studies; in this country map only the most significant regions with regard to employ-ment in Area 1, 2 and/or 3 are shown; hence the sum of employment figures shown in this map is somewhat lower than total employment in Area 1, 2 and/or 3
Source: Source: Policy Research based on Ecotec (2006) – Employment trends in all sectors related to the sea or using sea-resources, Federazione del Mare (2006) –Rapporto sull’economia del mare, Assoporti and Censis (2008) – Analisi dell’ impatto economico e occupazionale dei porti commerciali italiani – La nautica in cifre, UCINA (2007), Information on website of Assonave, Eurostat – Tourism indicators 2005, and LEI (2006) – Employment in the fisheries sector
10 500 1 500
26 500
20 4001 300
21 100
2 900 3 50017 600
∑ = 724 80011 900 2 800
25 800
Italy
Area 1: Traditional maritime sectorsArea 2: Coastal (and marine) tourism and recreationArea 3: Fisheries
Area 1: Traditional maritime sectorsArea 2: Coastal (and marine) tourism and recreationArea 3: Fisheries

Policy Research Corporation 398 July 200813 November 2008
Employment figures for Latvia in all Areas
Employment figures for Latvia in all Areas
ANNEX 6: EMPLOYMENT IN SEA-RELATED SECTORS ON NUTS II-LEVEL IN LATVIA
Latvia employs 38 900 persons in Area 1, 6 000 persons in Area 2 and10 600 persons in Area 3
Source: Policy Research based on Ecotec (2006) – Employment trends in all sectors related to the sea or using sea-resources, Houthoff Buruma and Policy Research (2007) – IPR Shipbuilding study, BIMCO/ISF (2005) – Manpower 2005 update, Eurostat – Tourism indicators 2005, and LEI (2006) – Employment in the fisheries sector
38 900
6 000
10 600
0
5 000
10 000
15 000
20 000
25 000
30 000
35 000
40 000
45 000
Area 1 Area 2 Area 3
Pers
ons e
mpl
oyed
38 900
6 000 10 600
∑ = 55 500
Latvia
Area 1: Traditional maritime sectorsArea 2: Coastal (and marine) tourism and recreationArea 3: Fisheries
Area 1: Traditional maritime sectorsArea 2: Coastal (and marine) tourism and recreationArea 3: Fisheries

Policy Research Corporation 408 July 200813 November 2008
Employment figures for Lithuania in all Areas
Employment figures for Lithuania in all Areas
ANNEX 6: EMPLOYMENT IN SEA-RELATED SECTORS ON NUTS II-LEVEL IN LITHUANIA
Lithuania employs 21 600 persons in Area 1, 6 300 persons in Area 2 and6 600 persons in Area 3
Source: Policy Research based on Ecotec (2006) – Employment trends in all sectors related to the sea or using sea-resources, Houthoff Buruma and Policy Research (2007) – IPR Shipbuilding study, BIMCO/ISF (2005) – Manpower 2005 update, Eurostat – Tourism indicators 2005, and LEI (2006) – Employment in the fisheries sector
21 6006 300 6 600
21 600
6 300 6 600
0
5 000
10 000
15 000
20 000
25 000
Area 1 Area 2 Area 3
Pers
ons e
mpl
oyed
∑ = 34 500
Lithuania
Area 1: Traditional maritime sectorsArea 2: Coastal (and marine) tourism and recreationArea 3: Fisheries
Area 1: Traditional maritime sectorsArea 2: Coastal (and marine) tourism and recreationArea 3: Fisheries

Policy Research Corporation 418 July 200813 November 2008
Employment figures for Malta in all Areas
Employment figures for Malta in all Areas
ANNEX 6: EMPLOYMENT SEA-RELATED SECTORS ON NUTS II-LEVEL IN MALTA
Malta employs 7 600 persons in Area 1, 11 000 persons in Area 2 and1 400 persons in Area 3
Source: Policy Research based on Ecotec (2006) – Employment trends in all sectors related to the sea or using sea-resources, Houthoff Buruma and Policy Research (2007) – IPR Shipbuilding study, BIMCO/ISF (2005) – Manpower 2005 update, Eurostat – Tourism indicators 2005, and LEI (2006) – Employment in the fisheries sector
7 600
11 000
1 400
0
2 000
4 000
6 000
8 000
10 000
12 000
Area 1 Area 2 Area 3
Pers
ons e
mpl
oyed
Mediterranean Sea
7 600 11 000 1 400
∑ = 20 000
Malta
Area 1: Traditional maritime sectorsArea 2: Coastal (and marine) tourism and recreationArea 3: Fisheries
Area 1: Traditional maritime sectorsArea 2: Coastal (and marine) tourism and recreationArea 3: Fisheries

Policy Research Corporation 428 July 200813 November 2008
North
Sea
Employment figures for the Netherlands in all Areas*
Employment figures for the Netherlands in all Areas*
ANNEX 6: EMPLOYMENT IN SEA-RELATED SECTORSON NUTS II-LEVEL IN THE NETHERLANDS
The Netherlands employ 128 100 persons in Area 1, 53 400 persons in Area 2 and 9 000 persons in Area 3
128 100
53 400
9 000
0
20 000
40 000
60 000
80 000
100 000
120 000
140 000
Area 1 Area 2 Area 3
Pers
ons e
mpl
oyed
66 500
15 5001 600
25 00023 4001 700
600 2 300
11 4006 000 1 200
* Annex 4 explains the differences in employment with the Dutch maritime cluster study; in this country map only the most significant regions with regard to employment in Area 1, 2 and/or 3 are shown; hence the sum of employment figures shown in this map is somewhat lower than total employment in Area 1, 2 and/or 3
Source: Policy Research Corporation (2006) – Economic Monitor of the Dutch Maritime Cluster, Information from members of Scheepsbouw Nederland (VNSI and HME), Nationale Havenraad (2005), Eurostat, Tourism Indicators 2005 and LEI (2006)
∑ = 190 500
The Netherlands
Area 1: Traditional maritime sectorsArea 2: Coastal (and marine) tourism and recreationArea 3: Fisheries
Area 1: Traditional maritime sectorsArea 2: Coastal (and marine) tourism and recreationArea 3: Fisheries

Policy Research Corporation 438 July 200813 November 2008
SE
Norweg
ian S
ea
Employment figures for Norway in all Areas*
Employment figures for Norway in all Areas*
ANNEX 6: EMPLOYMENT IN SEA-RELATED SECTORS ON NUTS II-LEVEL IN NORWAY
110 000
29 600
16 700
0
20 000
40 000
60 000
80 000
100 000
120 000
Area 1 Area 2 Area 3
Pers
ons e
mpl
oyed
46 100
5 600 4 500
23 3007 500 1 100
26 1005 000 2 700
Norway employs 110 000 persons in Area 1, 29 600 persons in Area 2 and16 700 persons in Area 3
* In this country map only the most significant regions with regard to employment in Area 1, 2 and/or 3 are shown; hence the sum of employment figures shown in this map is somewhat lower than total employment in Area 1, 2 and/or 3
Source: Policy Research, also based on Maritimt Forum (2007) – Maritim Verdiskapingsbok, Statistics Norway, and Houthoff Buruma and Policy Research (2007) – IPR Shipbuilding study and Eurostat
∑ = 156 300
2 900 2 7003 100
7 800 3 0004 100
Norway
Area 1: Traditional maritime sectorsArea 2: Coastal (and marine) tourism and recreationArea 3: Fisheries
Area 1: Traditional maritime sectorsArea 2: Coastal (and marine) tourism and recreationArea 3: Fisheries

Policy Research Corporation 448 July 200813 November 2008
DE Warsaw
Baltic SeaEmployment figures for Poland in all
Areas*Employment figures for Poland in all
Areas*
ANNEX 6: EMPLOYMENT IN SEA-RELATED SECTORS ON NUTS II-LEVEL IN POLAND
59 800
5 400 7 100
32 600
4 700 5 000
117 000
10 10019 900
0
20 000
40 000
60 000
80 000
100 000
120 000
140 000
Area 1 Area 2 Area 3
Pers
ons e
mpl
oyed
Poland employs 117 000 persons in Area 1, 10 100 persons in Area 2 and19 900 persons in Area 3
* In this country map only the most significant regions with regard to employment in Area 1, 2 and/or 3 are shown; hence the sum of employment figures shown in this map is somewhat lower than total employment in Area 1, 2 and/or 3
Source: Policy Research based on Ecotec (2006) – Employment trends in all sectors related to the sea or using sea-resources, Houthoff Buruma and Policy Research (2007) – IPR Shipbuilding study, BIMCO/ISF (2005) – Manpower 2005 update, Eurostat – Tourism indicators 2005, and LEI (2006) – Employment in the fisheries sector
∑ = 147 000
Poland
Area 1: Traditional maritime sectorsArea 2: Coastal (and marine) tourism and recreationArea 3: Fisheries
Area 1: Traditional maritime sectorsArea 2: Coastal (and marine) tourism and recreationArea 3: Fisheries

Policy Research Corporation 458 July 200813 November 2008
ANNEX 6: EMPLOYMENT IN SEA-RELATED SECTORS ON NUTS II-LEVEL IN PORTUGAL
Portugal employs 29 000 persons in Area 1, 109 100 persons in Area 2 and33 200 persons in Area 3
Employment figures for Portugal in all Areas*
Employment figures for Portugal in all Areas*
29 000
109 100
33 200
0
20 000
40 000
60 000
80 000
100 000
120 000
Area 1 Area 2 Area 3
Pers
ons e
mpl
oyed
11 600 21 2002 800
3 20019 500
5 500
100
33 5009 800
5 600 9 600 7 900
* In this country map only the most significant regions with regard to employment in Area 1, 2 and/or 3 are shown; hence the sum of employment figures shown in this map is somewhat lower than total employment in Area 1, 2 and/or 3
Source: Policy Research based on Ecotec (2006) – Employment trends in all sectors related to the sea or using sea-resources, BIMCO/ISF (2005) – Manpower 2005 update, Members of Associação das Indústrias Marítimas, Eurostat – Maritime Transport Statistics 2005, Eurostat – Industry, Trade and Services (Annual enterprise statistics) 2005, Eurostat – Tourism indicators 2005, and LEI (2006) – Employment in the fisheries sector
∑ = 171 300
Portugal
Area 1: Traditional maritime sectorsArea 2: Coastal (and marine) tourism and recreationArea 3: Fisheries
Area 1: Traditional maritime sectorsArea 2: Coastal (and marine) tourism and recreationArea 3: Fisheries

Policy Research Corporation 468 July 200813 November 2008
Bucharest
ANNEX 6: EMPLOYMENT IN SEA-RELATED SECTORS ON NUTS II-LEVEL IN ROMANIA
Romania employs 80 400 persons in Area 1, 45 600 persons in Area 2 and10 600 persons in Area 3
Employment figures for Romania in all Areas
Employment figures for Romania in all Areas
Source: Policy Research based on Houthoff Buruma and Policy Research (2007) – IPR Shipbuilding study, European Foundation for the improvement of living and working conditions (2008) – Article concerning port workers in Romania, BIMCO/ISF (2005) – Manpower 2005 update, Eurostat – Industry, Trade and Services (Annual enterprise statistics) 2005, Eurostat – Tourism indicators 2005, and United Nations (2004) – Fishery country profile
80 400
45 600
10 600
0
10 000
20 000
30 000
40 000
50 000
60 000
70 000
80 000
90 000
Area 1 Area 2 Area 3
Pers
ons e
mpl
oyed
80 400
45 600
10 600
∑ = 136 600
Romania
Area 1: Traditional maritime sectorsArea 2: Coastal (and marine) tourism and recreationArea 3: Fisheries
Area 1: Traditional maritime sectorsArea 2: Coastal (and marine) tourism and recreationArea 3: Fisheries

Policy Research Corporation 478 July 200813 November 2008
Employment figures for Slovenia in all Areas
Employment figures for Slovenia in all Areas
ANNEX 6: EMPLOYMENT IN SEA-RELATED SECTORS ON NUTS II-LEVEL IN SLOVENIA
Slovenia employs 1 700 persons in Area 1, 7 400 persons in Area 2 and600 persons in Area 3
Source: Policy Research based on Ecotec (2006) – Employment trends in all sectors related to the sea or using sea-resources, Houthoff Buruma and Policy Research (2007) – IPR Shipbuilding study, BIMCO/ISF (2005) – Manpower 2005 update, Eurostat – Tourism indicators 2005, and LEI (2006) – Employment in the fisheries sector
1 700
7 400
600
0
1 000
2 000
3 000
4 000
5 000
6 000
7 000
8 000
Area 1 Area 2 Area 3
Pers
ons e
mpl
oyed
1 700 7 400 600
∑ = 9 700
Slovenia
Area 1: Traditional maritime sectorsArea 2: Coastal (and marine) tourism and recreationArea 3: Fisheries
Area 1: Traditional maritime sectorsArea 2: Coastal (and marine) tourism and recreationArea 3: Fisheries

Policy Research Corporation 488 July 200813 November 2008
Madrid
Employment figures for Spain in all Areas*
Employment figures for Spain in all Areas*
ANNEX 6: EMPLOYMENT IN SEA-RELATED SECTORS ON NUTS II-LEVEL IN SPAIN
136 700
652 400
87 300
0
100 000
200 000
300 000
400 000
500 000
600 000
700 000
Area 1 Area 2 Area 3
Pers
ons e
mpl
oyed
14 100
88 500
4 900 28 700
99 700
13 800
6 900
85 200
1 3009 700
95 200
5 700
17 000 6 800
166 2008 200
38 300
5 20018 30039 10045 500 1 500
11 6004 100
Spain employs 136 700 persons in Area 1, 652 400 persons in Area 2 and87 300 persons in Area 3
13 6003 20012 300
* Annex 4 explains the differences in employment with the Spanish maritime cluster study; in this country map only the most significant regions with regard to employment in Area 1, 2 and/or 3 are shown; hence the sum of employment figures shown in this map is somewhat lower than total employment in Area 1, 2 and/or 3
Source: Policy Research based on Ecotec (2006) – Employment trends in all sectors related to the sea or using sea-resources, Cluster Maritimo Español (2005) Quantification and economic impact of the maritime sector, Information of Uninave and Asociación Española de Industrias Auxiliares Marítimas, Puertos del Estado (2005) – Anuario Estadístico, Eurostat – Tourism Indicators 2005, and LEI (2006) – Employment in the fisheries sector
∑ = 876 400
Spain
Area 1: Traditional maritime sectorsArea 2: Coastal (and marine) tourism and recreationArea 3: Fisheries
Area 1: Traditional maritime sectorsArea 2: Coastal (and marine) tourism and recreationArea 3: Fisheries

Policy Research Corporation 498 July 200813 November 2008
ANNEX 6: EMPLOYMENT IN SEA-RELATED SECTORS ON NUTS II-LEVEL IN SWEDEN
Sweden employs 48 300 persons in Area 1, 18 200 persons in Area 2 and4 000 persons in Area 3
Employment figures for Sweden in all Areas*
Employment figures for Sweden in all Areas*
9 600 5 700 700
22 5002 400 2 300
48 300
18 200
4 000
0
10 000
20 000
30 000
40 000
50 000
60 000
Area 1 Area 2 Area 3
Pers
ons e
mpl
oyed
* In this country map only the most significant regions with regard to employment in Area 1, 2 and/or 3 are shown; hence the sum of employment figures shown in this map is somewhat lower than total employment in Area 1, 2 and/or 3
Source: Policy Research based on Ecotec (2006) – Employment trends in all sectors related to the sea or using sea-resources, Houthoff Buruma and Policy Research (2007) – IPR Shipbuilding study, BIMCO/ISF (2005) – Manpower 2005 update, Members of Sweden Ocean Industry Group, and Eurostat – Industry, Trade and Services (Annual enterprise statistics) 2005, Eurostat – Tourism indicators 2005, and LEI (2006) – Employment in the fisheries sector
∑ = 70 500
Sweden
Area 1: Traditional maritime sectorsArea 2: Coastal (and marine) tourism and recreationArea 3: Fisheries
Area 1: Traditional maritime sectorsArea 2: Coastal (and marine) tourism and recreationArea 3: Fisheries

Policy Research Corporation 508 July 200813 November 2008
Employment figures for United Kingdom in all Areas*
Employment figures for United Kingdom in all Areas*
ANNEX 6: EMPLOYMENT IN SEA-RELATED SECTORSON NUTS II-LEVEL IN UNITED KINGDOM
35 900
3 100 8 100 5 200
13 300
42 900
1 000
8 80029 900
1 30010 400
26 800
500
24 00039 800
400
4 200
48 100
800
21 5005 400 4 700
United Kingdom employs 253 600 persons in Area 1, 347 300 persons in Area 2 and 33 500 persons in Area 3
* Annex 4 explains the differences in employment with the maritime cluster study of UK; in this country map only the most significant regions with regard to employment in Area 1, 2 and/or 3 are shown; hence the sum of employment figures shown in this map is somewhat lower than total employment in Area 1, 2 and/or 3
Source: Policy Research based on Ecotec (2006) – Employment trends in all sectors related to the sea or using sea-resources, SeaVision UK - Statistics, DTI (2001) – The UK marine equipment industry, Eurostat – Maritime Transport 2005, Eurostat – Tourism indicators 2005 and LEI (2006) – Employment in the fisheries sector
∑ = 634 400
13 5002 600
12 700
15 6001002 100
15 80011 600900
13 3004008 100
United Kingdom
Area 1: Traditional maritime sectorsArea 2: Coastal (and marine) tourism and recreationArea 3: Fisheries
Area 1: Traditional maritime sectorsArea 2: Coastal (and marine) tourism and recreationArea 3: Fisheries
253 600
347 300
33 500
0
50 000
100 000
150 000
200 000
250 000
300 000
350 000
400 000
Area 1 Area 2 Area 3
Pers
onse
mpl
oyed

Policy Research Corporation 518 July 200813 November 2008
ANNEX 6: EMPLOYMENT IN ALL AREAS ON NUTS II-LEVEL IN LANDLOCKED COUNTRIES
Hungary and Austria have highest employment in Area 1; the Czech Republic has highest employment in Area 3 compared to the other European landlocked countries
* Employment in Area 2 in landlocked countries is achieved in the cruise tourism sector** Employment in Area 3 in landlocked countries is achieved in fish processing and aquacultureSource: Policy Research based on Ecotec (2006) – Employment trends in all sectors related to the sea or using sea-resources, BIMCO/ISF (2005) – Manpower 2005 update, Eurostat – Industry, Trade and Services (Annual enterprise statistics) 2005, and Policy Research based on LEI (2006) – Employment in the fisheries sector
Employment figures for Czech Republic in all Areas
Employment figures for Czech Republic in all Areas
Employment figures for Austria in all Areas
Employment figures for Austria in all Areas
Employment figures for Luxembourg in all AreasEmployment figures for Luxembourg in all Areas
Employment figures for Slovakia in all Areas
Employment figures for Slovakia in all Areas
Employment figures for Hungary in all Areas
Employment figures for Hungary in all Areas
2 000
0
2 300
0
500
1 000
1 500
2 000
2 500
3 000
3 500
4 000
Area 1 Area 2 Area 3
Pers
ons e
mpl
oyed
1 100
0 00
500
1 000
1 500
2 000
2 500
3 000
3 500
4 000
Area 1 Area 2 Area 3
Pers
ons e
mpl
oyed
Area 1: Traditional maritime sectorsArea 2: Coastal (and marine) tourism and recreation*
Area 3: Fisheries**
Area 1: Traditional maritime sectorsArea 2: Coastal (and marine) tourism and recreation*
Area 3: Fisheries**
3 200
200
700
0
500
1 000
1 500
2 000
2 500
3 000
3 500
4 000
Area 1 Area 2 Area 3
Pers
ons e
mpl
oyed
2 300
100
1 200
0
500
1 000
1 500
2 000
2 500
3 000
3 500
4 000
Area 1 Area 2 Area 3
Pers
ons e
mpl
oyed
3 800
100
1 700
0
500
1 000
1 500
2 000
2 500
3 000
3 500
4 000
Area 1 Area 2 Area 3
Pers
ons e
mpl
oyed
Landlocked countries

Policy Research Corporation 528 July 200813 November 2008
ANNEX 7: RELEVANT EU POLICY FOR (MARITIME) CLUSTERS
EU policy & initiatives relevant for (maritime) clusters and sectors (non-exhaustive overview):
• 7th Framework Programme for Research and Development• Structural funds• ‘Regions of knowledge’ programme, aiming to strengthen the research potential of European
regions• Framework Programmes• Marine and Maritime Research Strategy• LeaderSHIP 2015• Europe INNOVA: focus on the joint development of new or better tools used by cluster
organisations in support of innovative SMEs• PRO INNO Europe initiative: foster trans-national cooperation between cluster policies at
policy or programme level• Marine Strategy Framework Directive• Communication on Maritime Policy in Member States• PAXIS initiative, aiming at identifying good practice examples and developing tool boxes for
establishing cluster initiatives
Additional information: http://europa.ec.eu/maritimeaffairs and Commission staff working document ‘The concept of cluster policies and their role for competitiveness and innovation: main statistical results and lessons learned’ (COM (2008) 652)

Policy Research Corporation 538 July 200813 November 2008
ANNEX 7: MAIN TRENDS & POLICIES IN THE NATIONAL MARITIME CLUSTERS IN EUROPE*
Far East attracts maritime companies (mainly service companies)
Implementation of State aid guidelines on maritime transport to provide a favourable tax environment to ship owners
‘Flagging-in’ of shipsCompetition from open-register countries
Among others improving accessibility of port of Antwerp by deepening the River Scheldt (BE), development of terminals Port 2000 at Le Havre and Fos 2XL at Marseille-Fos (FR), development of new terminals on Maasvlakte 2 (NL)
Expand and improve seaports (e.g. BE, FR, GR, IT, NL)
Growth of seaports and worldwide competition for trade
Establishment of organisations that promote the maritime activities to the public
Promotion of the maritime clusterLow awareness of the importance of the maritime sectors
Research on sustainability issues and possible improvementsFocus on sustainable developmentIncreasing awareness and know how of negative external effects on environment
Increase inflow and improve education:– Promote working in the cluster/industry– Establishment of maritime schools/academies and
training facilities– Recruitment of (foreign) labour forces (e.g. NL, NO)– Norway finances recruitment through a foundation that
consists of a share of the taxes of shipping employees
Solve HR-problems by:– Increase inflow by promotion of jobs in the
maritime cluster– Stimulation of maritime education
Recruitment problems, especially in shipping and the offshore industry
Establishment of RDI programmes and subsidies:– Mostly through government programmes (State Aid) (e.g.
DE, DK)– Norway: exclusively private R&D
Stimulation of RDI by companies, sector associations and governments
Increasing focus on innovation, in view of raising competitiveness of EU businesses at global level (especially in manufacturing)
Policy measuresPoliciesTrends
Maritime cluster policies mainly focus on the competitiveness of the clusters through promotion and support for innovation and education
* Trends and policies in the national maritime clusters are based on the trends and policies (+ sources) provided in ’Background country reports’

Policy Research Corporation 548 July 200813 November 2008
ANNEX 7: MAIN TRENDS & POLICIES IN EUROPEAN SHIPBUILDING AND MARINE EQUIPMENT
Policy: EC (DG ENTR) focuses on measures aiming at the improvement of competitiveness (strong competition from Asia) and, in particular, support for innovationSector Initiative: EMEC (marine equipment) established an R&D working group (EMECRID), which will regularly publish the sector vision on R&D topics and priorities in a pre-competitive stage (source: EMEC, 2008)
Complex and comprehensive interaction in shipbuilding projects between yards, suppliers, owners, classification societies, universities and other service providers increases chances for the leakage of knowledge; amongst others current difficulties with regard to enforcement of IPR should be overcome
Sector Initiative: EMEC (marine equipment): focus on effective implementation of enforcement legislationSector Initiative: CESA has identified the main contributors to knowledge leaking (source: CESA, 2007)Recommendation: Protect intellectual property rights (IPR) through (source: Houthoff Buruma & PRC (2007):
– Making better use of existing measures– Tackling enforcement and IP-leakage issues
European shipbuilders shift to the production of specialised ships (e.g. cruise, ferry, feeder, dredging) through advanced technological solutions, not through low costs*
Competition from Asian countries, especially in ships that are relatively lesscomplex to buildNon-EU competitors often may rely on advanced state-supported financing instruments
European shipbuilding is focusing on knowledge intensive production
Trends Policies
* See trends in Background Country Reports of Denmark, France, Germany, Italy, Norway, the Netherlands and, SpainSources: Leadership 2015, High-level advisory group to the European Commission (2003), website EMEC: www.emec-marine-equipment.org, Dutch Maritime Network(2005) - European Maritime Policy Conference: proceedings: Chapter 12, CESA (2007) – Annual report 2006-2007, Houthoff Buruma & Policy Research Corporation (2007) Shipbuilding IPR study and, Commission staff working document (2007) SEC (2007) 1351
Growing demands because of growth in trade and transport and a shift from congested road transportation to more environmental friendly water-borne means (source: CESA, 2007)
Since 2003, three consecutive years of new order increase (20% volume growth compared to 2005) (source: CESA, 2007); in 2008 prospects are less optimistic due to the price increases of building materials

Policy Research Corporation 558 July 200813 November 2008
ANNEX 7: MAIN TRENDS & POLICIES IN EUROPEAN SHIPPING
Flagging out of European fleets; since the 1970s the European fleet faces competition from vessels registered in third countries (source: EC, 2004)
Policy: Each member state has its individual shipping policy based on the State Aid Guidelines on Maritime Transport (latest revision in 2004) which provides the basis for a uniform level playing field; in these guidelines, Member States are allowed tosupport the European maritime industry by means of favourable tax environments (source: EC, 2004)
Complex and time-consuming procedures (lack of internal market on administrative procedures) that limit the potential ofshipping in freight transport
Policy: The Commission is proactive to establish an internal market through simplification of administrative procedures to exploit the potential of maritime transport (source: EC, 2007)
European shipping maintains key role in global transport with a substantial share of 41% of the global merchant fleet (EC, 2007)
Sector initiative: ECSA supports (source: ECSA, 2007):
– Ensuring the potential for growth in Europe through adequate transport capacity
– Ensuring a stable and competitive environment for EU shipping
– Keeping regulations global– Supporting a positive development of shipping in the EU– Taking a proactive environmental approach– Promote the image of shipping of being the safest, most
effective and economical and most environment friendlymode of transport
Growth sector because of continued world trade increase and road congestion
The Commission is proactive to increase the competitiveness of European shipping through the State Aid Guidelines
Source: Commission Communication (2004) – Community guidelines on State aid to maritime transport, Commission staff working document (2007) – Consultation on a European maritime transport space without barriers reinforcing the internal market for intra-European maritime transport, ECSA (2007) – Annual report 2006-2007
Trends Policies
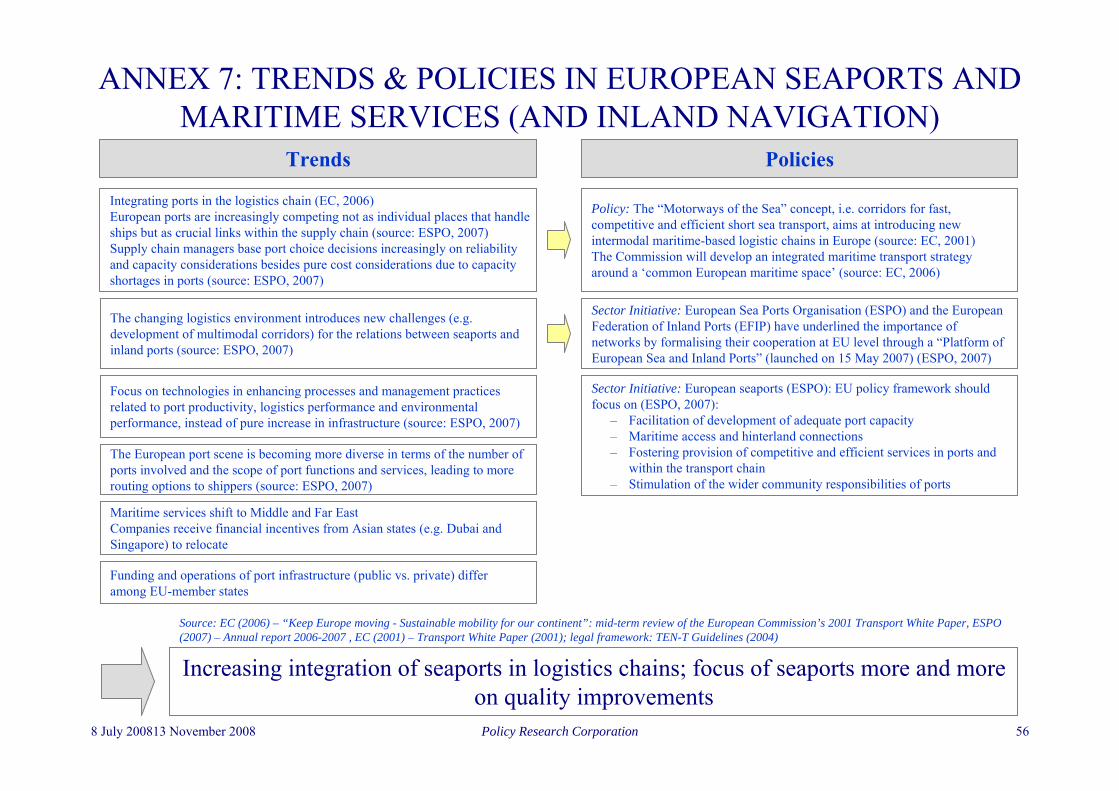
Policy Research Corporation 568 July 200813 November 2008
ANNEX 7: TRENDS & POLICIES IN EUROPEAN SEAPORTS AND MARITIME SERVICES (AND INLAND NAVIGATION)
Sector Initiative: European Sea Ports Organisation (ESPO) and the European Federation of Inland Ports (EFIP) have underlined the importance of networks by formalising their cooperation at EU level through a “Platform of European Sea and Inland Ports” (launched on 15 May 2007) (ESPO, 2007)
Sector Initiative: European seaports (ESPO): EU policy framework should focus on (ESPO, 2007):
– Facilitation of development of adequate port capacity– Maritime access and hinterland connections– Fostering provision of competitive and efficient services in ports and
within the transport chain– Stimulation of the wider community responsibilities of ports
Integrating ports in the logistics chain (EC, 2006)European ports are increasingly competing not as individual places that handle ships but as crucial links within the supply chain (source: ESPO, 2007)Supply chain managers base port choice decisions increasingly on reliability and capacity considerations besides pure cost considerations due to capacity shortages in ports (source: ESPO, 2007)
Focus on technologies in enhancing processes and management practices related to port productivity, logistics performance and environmental performance, instead of pure increase in infrastructure (source: ESPO, 2007)
Increasing integration of seaports in logistics chains; focus of seaports more and more on quality improvements
Source: EC (2006) – “Keep Europe moving - Sustainable mobility for our continent”: mid-term review of the European Commission’s 2001 Transport White Paper, ESPO (2007) – Annual report 2006-2007 , EC (2001) – Transport White Paper (2001); legal framework: TEN-T Guidelines (2004)
Policy: The “Motorways of the Sea” concept, i.e. corridors for fast, competitive and efficient short sea transport, aims at introducing new intermodal maritime-based logistic chains in Europe (source: EC, 2001)The Commission will develop an integrated maritime transport strategy around a ‘common European maritime space’ (source: EC, 2006)
The changing logistics environment introduces new challenges (e.g. development of multimodal corridors) for the relations between seaports and inland ports (source: ESPO, 2007)
Maritime services shift to Middle and Far East Companies receive financial incentives from Asian states (e.g. Dubai and Singapore) to relocate
The European port scene is becoming more diverse in terms of the number of ports involved and the scope of port functions and services, leading to more routing options to shippers (source: ESPO, 2007)
Funding and operations of port infrastructure (public vs. private) differ among EU-member states
Trends Policies

Policy Research Corporation 578 July 200813 November 2008
ANNEX 7: MAIN TRENDS & POLICIES IN EUROPEAN RECREATIONAL BOATING
Positive prospects for recreational boating although additional focus on R&D seems to be required
Funding and operations of boating-facilities (public vs. private) differ among EU Member States
Sector Initiative: ECNI founded a European Nautical Innovation Centre; aim is to provide information and assistance to companies willing to apply for EU R&D support programmes(ECNI, 2008)
Industry has enjoyed years of steady growth; growth in coming years is estimated at 5 to 6% annually
SMEs represent 98% of all businesses which causes high vulnerability to economic cycles; these businesses lack resources for R&D, which is required when competing with companies from emerging economies
Expansion will continue because:– ‘Baby boomer’ generation will reach retirement age– Increase of wealth among people– Potential in emerging economies
Sector Initiative: ECNI has investigated the impact of nauticalactivities on the environment
Sector Initiative: EURMIG’s policy:– Promote understanding of the sector and provide a
platform for the industry to represent mutual European interests
– Assistance in sustained and transferable research to gain a competitive advantage through increase in productivity and quality
* Source: Dutch Maritime Network (2005) – European Maritime Policy conference: Proceedings: chapter 24** Source: Website of ECNI: www.ecni.org
Trends* Policies**

Policy Research Corporation 588 July 200813 November 2008
ANNEX 7: MAIN TRENDS & POLICIES IN EUROPEAN MARITIME WORKS
World Leading European (Dutch & Belgian) companies
Due to capacity constraints seaport development and large maritime projects experience long lead times, causing cost increases and having a negative effect on competition with Asian countries (source: Dutch Maritime Network, 2005)
Sector Initiative: EuDA proposes an international European research initiative into the environmental effects of maritime works (source: Dutch Maritime Network, 2005 and EuDA)
Sector Initiative: Harmonization at EU level and improvements in cost-benefit assessments are highly desirable (source: Dutch Maritime Network, 2005)
European Dredging Association (EuDA) recognizes a shortage of knowledge and understanding of the ecological effects of hydraulic works on the marine environment (source: Dutch Maritime Network, 2005 and EuDA)
According to the EuDA, many models used to make decisions on infrastructure development are incomplete, insufficient and inconsistent (source: Dutch Maritime Network, 2005 and EuDA)
European, mainly Belgian and Dutch, dredging companies operate for a large part in Middle-East and Far-East countries
Source: Dutch Maritime Network (2005) – European Maritime Policy conference (Proceedings: chapter 17), Website of EuDA: http://www.european-dredging.info and, Website of CEDA: www.ceda.org
Sector Initiative: The World Organisation of Dredging Associations published the ‘Hamburg Declaration’ (2004): commitment of members to assist with knowledge and expertise to facilitate economic and ecological sustainability of dredgingand navigation projects (source: CEDA, 2008)
Most dredging activities are carried out in Middle-East and Far-East countries
Trends Policies

Policy Research Corporation 598 July 200813 November 2008
ANNEX 7: MAIN TRENDS & POLICIES IN EUROPEAN FISHERIES
Limited financial relations with other maritime sectors because fishery ships are (currently) no longer built (but in exceptional cases)
Precautionary approach to protect and conserve living aquatic resources, and to minimise the impact of fishing activities on marine eco-systems (source: EAPO, 2007)
Sector trend to expand fisheries territory to other continents (e.g. Africa) to avoid European restrictions and regulations
Policy: European Fisheries Policy through the European Fisheries Fund, objectives are (source: EC, 2006):
– Support for common fisheries policy to focus on technical (environment-friendly), economical and social endurance
– Promote a sustainable balance of fish-supply and fleet capacity
– Strengthen the competitiveness of companies and the development of economically viable enterprises
– Protection of environment and natural resources– Encourage sustainable development and improve the
quality of life in areas with activities in the fisheries sector
Policy: In June 2008, the Council of the EU reached an agreement on a temporary package of measures, e.g. financial compensation, to promote restructuring of European fishery (companies) that suffer from the the economic crisis (source: EC, 2008)
Fisheries experience difficult times and are confronted with a structural imbalance between catch possibilities and fleet size
Source: EAPO (2007) – Observations to the Green Paper “Towards a future maritime policy for the union”, EC (2006) – Council Regulation on the European FisheriesFund, No. 1198/2006 and, EC (2008) – Press release European Commission-Fisheries (IP/08/960)
Provide a greater and better knowledge of the actual economic condition of the sector; leading to a better insight into the impact of fisheries on its environment (source: EAPO, 2007)
Trends Policies
Sector (production) in many countries in very bad financial condition due to low volumes per vessel, low prices and high (fuel) costs

Policy Research Corporation 608 July 200813 November 2008
ANNEX 7: MAIN TRENDS & POLICIES IN EUROPEAN OFFSHORE SUPPLY
Policy: Sustainable Energy Europe 2005-2008 Campaign* aims to raise public awareness and promote sustainable energy production and use among individuals and organisations, private companies and public authorities, professional and energy agencies, industry associations and NGO’s across Europe
The European Union is very eager to promote alternative energy sources (e.g. offshore and coastal wind energy)
* Sustainable Energy Europe 2005-2008 Campaign and Windskill project are initiatives in the framework of the Intelligent Energy - Europe (2003-2006) programme of the European Commission (DG TREN)
Source: Information on website of DG TREN and, Information on website of Windskill:www.windskill.eu
Trends Policies
Possible depletion of offshore oil and gas resources and price fluctuations increase the need for alternative (sustainable) energy resources (amongst others offshore coastal and wind energy)
Policy: Windskill project* (2006-2009), which is part of the Intelligent Energy Europe programme (DG TREN), aims to:
– Set up an industry-based skills network for the wind energy sector
– Deliver a European industry qualification standard for operational skills in the wind energy sector (on-shore and off-shore)
– Boost the skills capital of the wind energy sector
European offshore oil and gas is mainly extracted in Norway, United Kingdom, France, the Netherlands and Denmark

Policy Research Corporation 618 July 200813 November 2008
ANNEX 7: MAIN TRENDS & POLICIES IN EUROPEAN COASTAL TOURISM AND CRUISE SHIPPING
Coastal tourism in the EU is facing increased worldwide competition, whereas cruise tourism is flourishing
Coastal tourism in the EU is facing increased worldwide competition, whereas cruise tourism is flourishing
Policy: European Regional Development Fund (ERDF) supports coastal tourism interventions considerably. The ERDF focuses on product & service diversification, sustainable development and the reduction of tourism seasonality effects (DGIPU, 2008)
Recommendations (DGIPU, 2008)– Integrate coastal tourism interventions within broader frameworks– Develop an integrated approach for the comprehensive management of
interventions falling within different policy fields but aimed at coastal areas
– Promote evaluation and monitoring activities to check the application of the sustainable development principle in coastal tourism
Recommendations: Increasing Port state control and a strengthening of global regulatory regimes may gradually (source: CAB, 2006):
-Enforce a meaningful link between flag states and their ships-Limit the freedom of offshore financial centres-Strengthen the conventions of the IMO and the International Labour
Organisation-Force the industry to cooperate more meaningfully in regional and
environmental development efforts
Remark: Cruise shipping is a valuable source of supplementary income forports but is not the core business and is unlikely to become the major economic driver of a port (source: CAB, 2006)
• European coastal tourism is facing increased competition. Moreover the needs of tourists evolve. The overall effect is a demand for higher quality at the lowest possible price (DGIPU, 2008)
• Mediterranean regions still play a major role in tourism, primarily as bathing destinations (DGIPU, 2008)
• Atlantic and Baltic regions: coastal tourism combines sea-related activities with the natural and cultural heritage of the hinterland (DGIPU, 2008)
• Preservation of traditions and authenticity of local populations is a main concern in the Outermost regions (DGIPU, 2008)
• Increasing concern for the preservation of the natural and cultural heritage of coastal regions (DGIPU, 2008)
• Cost of maintaining basic natural resources for tourism such as beaches and other coastal amenities will increase (ETC, 2006)
Trends Policies
• The world cruise market continues to grow. The market share of European cruise passengers is rising with an 11% share of the global market. The European cruise market has become the world’s second largest destination after the Caribbean (source: CAB, 2006):
• Cruise sector is a European growth industry: between 1995 and 2005 European cruise tourism has increased with 230% to 3.3 million passengers (Source: ECC, 2007)
• Increasing size of cruise ships in European Waters (Source: ECC, 2007)• Average age of cruise passengers is decreasing (source: CAB, 2006)• Cruise line industry is becoming increasingly concentrated due to mergers
and acquisitions (source: CAB, 2006)• Increasing concern for protection against piracy and environmental
pollution (source: CAB, 2006)

Policy Research Corporation 628 July 200813 November 2008
ANNEX 8: TRENDS & POLICIES IN THE MARITIME CLUSTER OF SINGAPORE
Components of the maritime
cluster
Companies from various sectors (e.g. shipping agents, cruise-industry, oil-companies) are represented in the Singaporean clusterMaritime Cluster Fund which aims to help, promote and strengthen the maritime cluster in Singapore amounts to € 40 millionPort of Singapore is the core sector of the maritime cluster:
– Singapore is one of the most efficient and one of the largest container ports in the world– Strategic location on the most important seafaring routes within Asia and on the routes to
and from Europe and America (see map)– Strong advantage of the port of Singapore are its low bunkering prices
Organisation and leader firms
Maritime Port Authority (MPA) is facilitator for the maritime cluster in SingaporeSingapore is a governmental controlled state, with state-controlled TEMASEK-holding as operator for, among others, maritime leader firms PSA and NOLMajor leader firms in the Singaporean maritime cluster:
– Singaporean Neptune Orient Line (NOL) with branding name American President Line (APL) is one of the largest container operators in the world (11 000 employees in 55 countries)
– Port of Singapore Authority (PSA) is a global terminal operator with headquarters in Singapore, its mission is to become the maritime centre of the world (5 000 employees in 16 countries)
– In the sector shipbuilding and –repair Keppel Offshore and Marine (one of the world’s largest offshore oil rig builders) is the major firm within Singapore
Trends and support measures
Companies are attracted by financial incentives to locate their headquarters in Singapore (mainly service companies in financing, insurance and law)Mainly blue collar workers are attracted and they receive training within Singapore (in e.g. Singapore Maritime Academy, Integrated Simulation Cenre of Singapore, PSA Institute)
Singapore’s maritime cluster is government-induced, focuses on a highly productive port and, is supported by strong leader firms and education/training
Source: Policy Research Corporation

Policy Research Corporation 638 July 200813 November 2008
ANNEX 8: TRENDS & POLICIES IN THE MARITIME CLUSTER OF DUBAI
Current situation (see map 1):– The maritime cluster of Dubai shows many similarities with the cluster of Singapore
– State-controlled society
– Strategic location as transhipment port for intra-Asian trade and trade from and to Europe
– DP World as Dubai’s large global terminal operator
– Maritime service companies (mainly in financing) are situated in Dubai
– Many immigrants for blue collar work
– Part of the port of Dubai consists of a free trade zone where the main industrial companies are located
– Dubai has an integrated sea-air vision to transport cargo combining a strong airline company(Emirates) and a maritime centre
– Dutch and Belgian companies in maritime works (Boskalis, De Nul, Deme and Van Oord) are very active in Dubai because of the large amount of dredging work (islands that are built on sea), having most company-operations located in the Middle East
Ambitions for the future:– Dubai Maritime City (see map 2) will host the whole maritime cluster in Dubai on a new
island to be built by offering top infrastructure, services and regulations; goal is to create an environment that will promote the networking and integration of maritime players
Dubai’s maritime cluster is government-induced and supported by strong leader firms (mainly in maritime service industry) and great ambitions for the future
Source: Policy Research Corporation
1
2

Policy Research Corporation 648 July 200813 November 2008
ANNEX 9: ARCHETYPES OF CLUSTER ORGANISATIONSDevelopment of maritime clusters
Cluster organisations can be initiated by the government, by companies and/or sector or by a combination of the two
‘TOP-DOWN’E.g. Germany
‘BOTTOM-UP’E.g. Maritimt Forum in Norway
– Government induced and/or supported– Holistic and cluster wide approach– Focus on long-term strategy and policy:
• Economy (e.g. level playing field and growth)• Education and recruitment• Research, development and innovation• Export• Common interest (e.g. environment and safety)
– Focus on professionalism and cooperation/integration of maritime sectors
– Induced and/or supported by strong leader firms and/or sector associations
– Limited cluster approach based on supporting companies and sector associations
– Focus on short-term benefits:• Rules and regulation• Tax regime• Labour market and job promotion• Innovation project support• Export support
– Focus on operational problems
Cha
ract
eris
tics
Initi
ativ
e
COMBINATIONPLAY
E.g. Dutch Maritime Network

Policy Research Corporation 658 July 200813 November 2008
ANNEX 10: CLASSIFICATION OF INQUIRED SEA-RELATED CLUSTER ORGANISATIONS AND THEIR ABBREVIATION
Key maritime cluster organisations in Europe have been inquired
HavenGatewayHaven Gateway Public/Private PartnershipNLDutch Maritime Network
UKSeaVision, Maritime UK and One Voice
SEMaritime Forum
PLPolish Maritime Network Institute
Bottom
-upB
ottom-up and top-dow
nT
op-down
Oslo
S-E (NO)
Haug.-Sunn.
Bergen
London
S-W (UK)
Mersey
S-E (UK)
PACA
Bretagne
Schl.-Hol.
NO2
IT
FR
FI
ES
NO1
DK
DE
MIF
ENMC
Marine South West (UK)
London MaritimeCluster Maritimo EspañaEuropean Network of Maritime Clusters
Maritimt Forum BergenAssociation of Finnish Maritime IndustriesMaritime Industries Forum
Oslo Maritime NetworkMaritimt Forum
Maritimt Forum South East NorwayFederazione del Mare
Maritimt Forum Haugalandet ogSunnhordlandCluster Maritime Français
Maritime Merseyside
Maritime South East (UK)MARUT
Pôle Mer Provence, Alpes, Côte d’Azur
Pôle Mer BretagneDanish Maritime Authority / Maritime Development Centre of Europe
Maritime Cluster in Schleswig-HolsteinBundesministerium für Wirtshaft und TechnologieAquamarina
RegionalNationalEuropean

Policy Research Corporation 668 July 200813 November 2008
PT
FR
DE
SE
FI
PL
CZ
AT
IT
SI
GR
SK
HU
RO
BG
ES
MTCY
IE
LU
33
3
3
3
33
3
3
3
3
3
3
2
2
2
2
2
22
2
2
2
2
2
2
2
22
2
2
1
1
1
1
1
1
1
1
1
1
1
11
1
1
1
1
1
1
1
1
1
1
1
1
1
11
1
1
ANNEX 10: REPRESENTATION BY A CLUSTER ORGANISATION IN STAR REGIONS IN THE TRADITIONAL MARITIME SECTORS*
1 Star2 Stars
3 Stars
NoNoYesYesNoYesNoYesYesNoNoYesNoYesYesYesYesYesYesYesNoYesYesYesYesYesYesYesNo
National cluster organisation
be23 Prov. Oost-Vlaanderenmt Maltanl34 Zeelandde50 Bremenbg34 Yugoiztochenuke1 East Yorkshire and Northern Lincolnshirelt Lithuaniano01 Oslo og Akershusnl32 Noord-Hollandbe21 Prov. Antwerpenee00 Estoniade6 Hamburggr30 Attikidef0 Schleswig-Holsteinfr52 Bretagneno04 Agder og Rogalandfi18 Etelä-Suomipl42 Zachodniopomorskieuki1 Inner Londonde80 Mecklenburg-Vorpommernlv Latviafr82 Provence-Alpes-Côte d'Azurnl33 Zuid-Hollanddk0 Denmarkfr23 Haute-Normandieno05 Vestlandetitc3 Liguriapl63 Pomorskiero22 Sud-Est
Star regions (Area 1)
No
NoN.A.NoNoNoNo
N.A.YesNoNo
NoNoYesYesYesNo
N.A.Yes
YesYesN.A.Yes
N.A.NoYesNoYesNo
Regional cluster organisation
Most star regions in Europe in terms of employment in the traditional maritime sectors (Area 1) are represented by a national and/or regional maritime cluster organisation
Star-region is represented by national and/or regional cluster organisation
* The presence of cluster organisations in star-regions does not provide evidence for the causality between a star region and the presence of a cluster organisation

Policy Research Corporation 678 July 200813 November 2008
ANNEX 10: YEAR OF ESTABLISHMENT OF MARITIME CLUSTER ORGANISATIONS
Regional cluster
1987 1989 1991 1993 1995 1997 1999 2001 2003 2005 2007 2009
1987 1989 1991 1993 1995 1997 1999 2001 2003 2005 2007 2009
After the popularisation of the cluster concept in Porter’s ‘Competitive advantage of nations’ in 1990:
– Most maritime cluster organisations were established– Governments have become more reluctant on developing sector policies
* NO1 is MARUT and NO2 is Maritimt Forum; more information concerning the activities of these clusters is provided in the Background Country Report – NorwaySource: Policy Research Corporation based on questionnaires of maritime cluster organisations
National clusterES
FR
PL
UK-Sea Vision
FINLITSENO2*DK
European cluster
London OsloSchl.-Hol.Bergen Haug.-Sonn.S-E (NO)
S-W (UK)
Mersey
S-E (UK)
Bretagne
AquamarinaENMC
DENO1*
UK-One VoiceUK-Maritime UK
PACA
Haven Gateway
MIF
Waterborne

Policy Research Corporation 688 July 200813 November 2008
ANNEX 10: INITIATIVE TO SET UP A MARITIME CLUSTER ORGANISATION CAN BE TAKEN BY GOVERNMENT AND/OR INDUSTRY
Transparency, sound communication and dialogue and the commitment of leading individuals are fundamental in setting up a cluster organisation
Basically it does not matter who take the initiative, as long as some key elements are present:
– Transparency (e.g. through European Cluster Observatory) and communication/dialogue, both horizontally and vertically, on the mission, structure and activities of the cluster organisations
– The presence of leading individuals within the cluster organisation who can raise enthusiasm and set up concrete actions in view of a clear and supported vision
In case government does not take the initiative to set up a cluster organisation or does not provide incentives to do so, industry needs to take up its responsibility if it wishes to set up coordinated actions
Final structure depends on different climate/environment influenced by:– Traditions and history– Cultural differences– Governmental structure and initiative– Driving sectors

Policy Research Corporation 698 July 200813 November 2008
ANNEX 10: PRIMARY RATIONALE FOR ESTABLISHING MARITIME CLUSTER ORGANISATIONS
Source: Policy Research Corporation based on questionnaires amongst maritime cluster organisations
Main reasons for establishing a maritime cluster organisation are to increase competi-tiveness, to promote maritime sectors, and to improve coordination within the cluster
PromotionCompetitiveness
Coordination Other (e.g. education, framework)
National cluster organisationsNational cluster organisations Regional cluster organisationsRegional cluster organisations
44%
28%
25%
3%
38%
28%
28%
6%

Policy Research Corporation 708 July 200813 November 2008
ANNEX 10: MOST COMMON STRUCTURE OF NATIONAL AND REGIONAL TOP-DOWN AND BOTTOM-UP CLUSTER ORGANISATIONS
National government*
Non-governmental induced cluster
organisation
Regional cluster
organisation(s)Companies National sector
association(s)
Except for national top-down cluster organisations, companies and sector associations are involved as members in the activities of the cluster organisations
Mem
bers
Non-governmental induced cluster
organisation
Companies Sector association(s)
Mem
bersNational cluster
organisationNational cluster
organisationRegional cluster
organisationRegional cluster
organisation
Top
-dow
nT
op-d
own
Bot
tom
-up
Bot
tom
-up
Regional governmental induced organisation
Companies Sector association(s)
Mem
bers
* I.e. Germany and Denmark; the structure of the cluster organisation in Denmark (also a national top-down organisation) is explained on slide 87

Policy Research Corporation 718 July 200813 November 2008
ANNEX 10: SEA-RELATED SECTORS REPRESENTED BY NATIONAL MARITIME CLUSTER ORGANISATIONS
Shipping
Shipbuilding
Marine equipment
Seaports
Maritime services
Recreational boating
Offshore supply
Navy and coastguard
Inland waterways
Maritime works
UK* France Germany Italy Norway** Netherlands Spain Denmark Poland Sweden Finland
broa
dna
rrow
* All UK maritime sectors (except for marine aggregates which have not explicitly been taken into account in the questionnaires) are represented in one of the cluster programs SeaVision, Maritime UK and One Voice; more detailed information concerning the mission of these cluster programs is provided in the Background Country Report – UK**Membership for both Norwegian maritime cluster organisations MARUT and Maritimt ForumSource: Policy Research Corporation based on questionnaires amongst maritime cluster organisations
Sector is not represented in cluster organisation
Sector has no significant activities in country
Sector is represented in cluster organisation
National cluster organisations indicate that they (are eager to) capture most traditional maritime sectors, although in practice this seems not (yet) the case
2 Shipbuilding includes marine equipment
Considered as related industry
3
4
7
Includes logisticsMay be (partly) included in shipping or services
6 (Partly) included in services
1 Members of One Voice
7
7
4
2
43 61
1
1
5
5 Only member in MARUT

Policy Research Corporation 728 July 200813 November 2008
Except for Oslo and London, regional clusters capture almost every sector (from a narrow perspective) in the traditional maritime sectors
Shipping
Shipbuilding
Marine equipment
Seaports
Maritime services
Recreational boating
Offshore supply
Navy and coastguard
Inland waterways
Maritime works
London Schleswig-Holstein
Oslo Bergen Haug.-Sunn.
South-East(NO)
South-West(UK)
Mersey South-East(UK)
Bretagne
narr
owbr
oad
Sector is not represented in cluster organisation
Sector has no significant activities in region (note: marine aggregates have not explicitly been taken into account in the questionnaires)
Sector is represented in cluster organisation
Source: Policy Research Corporation based on questionnaires amongst maritime cluster organisations
ANNEX 10: TRADITIONAL MARITIME SECTORS (AREA 1) REPRESENTED BY REGIONAL MARITIME CLUSTER ORGANISATIONS
PACA HavenGateway

Policy Research Corporation 738 July 200813 November 2008
ANNEX 10: (LEVEL OF) RESOURCES OF NATIONAL CLUSTER ORGANISATIONS ARE DETERMINED BY INITIATOR
(Top-down vs. Bottom-up)
National government induced cluster organisations have the largest budgets (mainly public means); bottom-up organisations are mainly financed with private funding
DK DE NL FR SE ES NO2* FI IT UK
€ 54 mln. € 43.4 mln.
€ 1.46 mln.
€ 650 000
€ 423 000
€ 300 000€ 250 000
€ 120 000 € 80 000n.a. n.a.
Top-down Top-down and bottom-up Bottom-up
* NO1 is MARUT and NO2 is Maritimt ForumSource: Policy Research Corporation based on questionnaires amongst maritime cluster organisations
private funding
public funding
Cluster initiative taken by:– Government = top-down– Leader firms/sectors = bottom-up
0
200 000
400 000
600 000
800 000
1 000 000
1 200 000
1 400 000
1 600 000
Bud
get i
n E
UR
> 1 600 000
PL
€ 430 000
NO1*
Danish budget includes financing maritime education system; funding of
cluster organisations in Germany includes budget for RDI-activities

Policy Research Corporation 748 July 200813 November 2008
ANNEX 10: MAIN BUDGET COMPONENTS OF NATIONAL MARITIME CLUSTER ORGANISATIONS AS PERCENTAGE OF TOTAL BUDGET
The main budget components of national maritime cluster organisations are projects and studies, policy and framework measures and, data and information sharing
* NO1 is MARUT and NO2 is Maritimt ForumSource: Policy Research Corporation based on questionnaires amongst maritime cluster organisations
n.a.
Publicity/promotion
Meetings/events
Office management
Data and information sharing
Policy and framework measures
Projects/studies
0%
10%
20%
30%
40%
50%
60%
70%
80%
90%
100%
DK DE NL FR NO1 SE ES NO2 FI IT PLUK
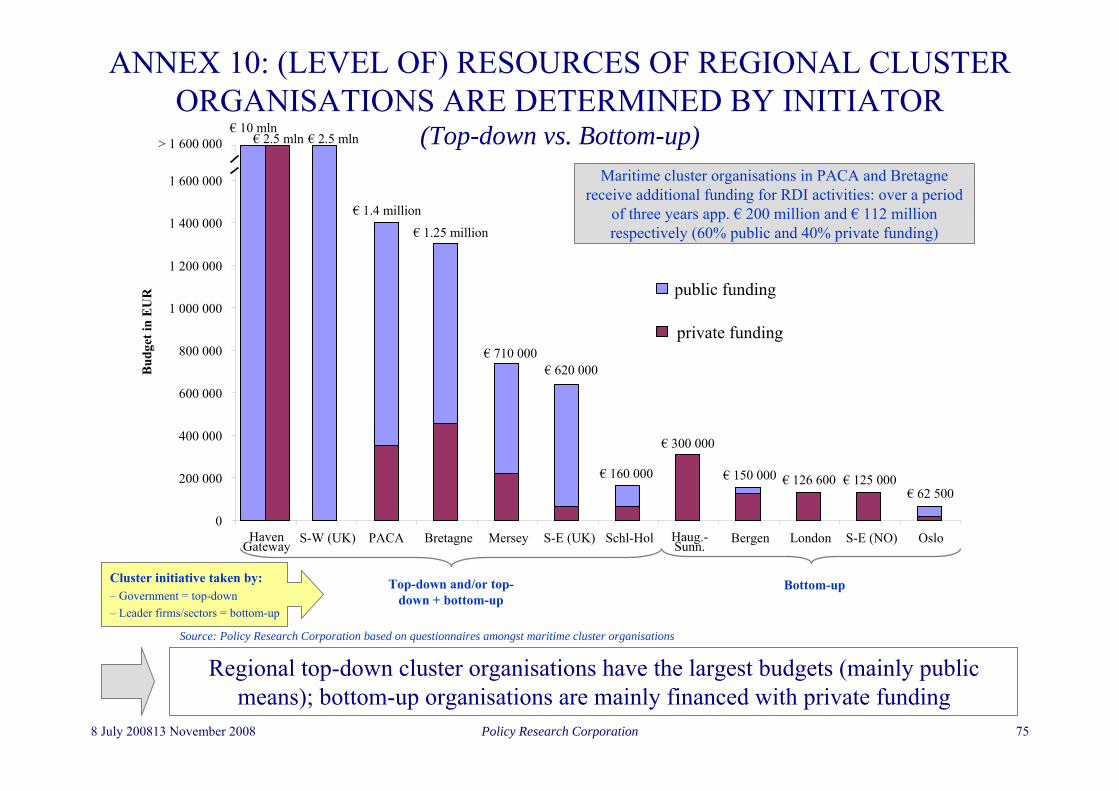
Policy Research Corporation 758 July 200813 November 2008
ANNEX 10: (LEVEL OF) RESOURCES OF REGIONAL CLUSTER ORGANISATIONS ARE DETERMINED BY INITIATOR
(Top-down vs. Bottom-up)
Top-down and/or top-down + bottom-up
Bottom-up
€ 2.5 mln
€ 1.25 million
€ 710 000€ 620 000
€ 300 000
€ 160 000 € 150 000 € 125 000€ 62 500
Regional top-down cluster organisations have the largest budgets (mainly public means); bottom-up organisations are mainly financed with private funding
€ 126 600
Cluster initiative taken by:– Government = top-down– Leader firms/sectors = bottom-up
Source: Policy Research Corporation based on questionnaires amongst maritime cluster organisations
S-W (UK) Bretagne Mersey S-E (UK) Schl-Hol Haug.-Sunn. Bergen London S-E (NO) Oslo
Bud
get i
n E
UR
0
200 000
400 000
600 000
800 000
1 000 000
1 200 000
1 400 000
1 600 000
> 1 600 000
€ 1.4 million
PACA
private funding
public funding
€ 10 mln€ 2.5 mln
HavenGateway
Maritime cluster organisations in PACA and Bretagne receive additional funding for RDI activities: over a period
of three years app. € 200 million and € 112 million respectively (60% public and 40% private funding)

Policy Research Corporation 768 July 200813 November 2008
ANNEX 10: MAIN BUDGET COMPONENTS OF REGIONAL MARITIME CLUSTER ORGANISATIONS AS PERCENTAGE OF TOTAL BUDGET
Source: Policy Research Corporation based on questionnaires amongst maritime cluster organisations
n.a.
Publicity/promotion
Meetings/events
Office management
Data and information sharing
Policy and framework measures
Projects/studies
The main budget components of regional maritime cluster organisations are projects and studies, policy and framework measures and, data and information sharing
0%
10%
20%
30%
40%
50%
60%
70%
80%
90%
100%
HavenGateway
S-W(UK)
PACA Bretagne Mersey S-E (UK) Schl.-Hol.
Haug.-Sonn.
Bergen London S-E (NO) Oslo

Policy Research Corporation 778 July 200813 November 2008
ANNEX 10: DIFFERENCES AND SIMILARITIES BETWEEN NATIONAL AND REGIONAL MARITIME CLUSTER ORGANISATIONS
Overview
National and regional cluster organisations differ from each other in their origin, purpose, topics covered and budget, but show similarities in size, scope, cooperation
and statistical monitoring
Origin: Mainly established after 1990 by small group of strong promoters (often located within Shipowner’s offices)Purpose:
– Bottom-up: Generate volume to improve lobbying position– Top-down: Create platform to enhance integrated maritime cluster
policyMain topics covered: Labour, exchange of know-how, innovation and research, image building, environment and, public affairsFinance:
– Bottom-up: Limited funding, basically for management and communi-cations (additional activities often requires additional member funding)
– Top-down: High budgets, mainly for RDI-programsSize:
– Bottom-up: Limited size (2-4 fte)– Top-down: Division of ministry
Scope: Capture almost every traditional maritime sector that is active in the countryCooperation:
– Cluster organisations: European national clusters and regional clusters– Non-cluster organisations: Private companies, sector associations,
government and research institutionsStatistical monitoring: Almost always statistically monitored by external organisation
National maritime cluster organisation Regional maritime cluster organisation
Origin: Mainly established after 2000 by sectoral and thematic groups (of companies) reflecting the regional situations and interestsPurpose:
– Bottom-up: Direct interest of local industry– Top-down: Focus on regional development and innovation
Main topics covered: Innovation and research, exchange of know-how and, business developmentFinance:
– Bottom-up: Limited funding, increasingly depending on project financing
– Top-down: High budget, mainly for regional developmentSize:
– Bottom-up: Limited size (1-2 fte)– Top-down: Part of development agency or technology centre
Scope: Capture almost every traditional maritime sector that is active in the regionCooperation:
– Cluster organisations: national cluster and regional clusters– Non-cluster organisations: Private companies, sector associations,
government and research institutionsStatistical monitoring: Almost always statistically monitored (sometimes by regional cluster organisation itself)
Differences
Similarities
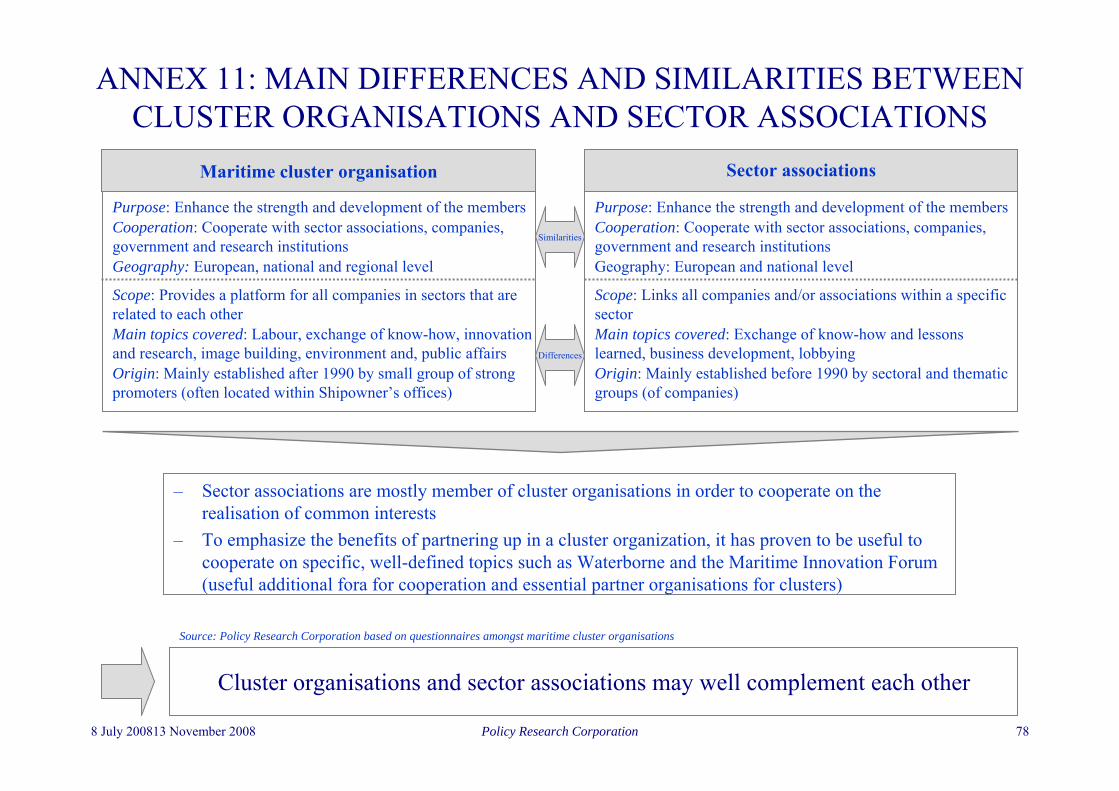
Policy Research Corporation 788 July 200813 November 2008
ANNEX 11: MAIN DIFFERENCES AND SIMILARITIES BETWEEN CLUSTER ORGANISATIONS AND SECTOR ASSOCIATIONS
Source: Policy Research Corporation based on questionnaires amongst maritime cluster organisations
Cluster organisations and sector associations may well complement each other
– Sector associations are mostly member of cluster organisations in order to cooperate on the realisation of common interests
– To emphasize the benefits of partnering up in a cluster organization, it has proven to be useful to cooperate on specific, well-defined topics such as Waterborne and the Maritime Innovation Forum (useful additional fora for cooperation and essential partner organisations for clusters)
Purpose: Enhance the strength and development of the membersCooperation: Cooperate with sector associations, companies, government and research institutionsGeography: European, national and regional level
Scope: Provides a platform for all companies in sectors that are related to each otherMain topics covered: Labour, exchange of know-how, innovation and research, image building, environment and, public affairsOrigin: Mainly established after 1990 by small group of strong promoters (often located within Shipowner’s offices)
Maritime cluster organisation Sector associations
Purpose: Enhance the strength and development of the membersCooperation: Cooperate with sector associations, companies, government and research institutionsGeography: European and national level
Scope: Links all companies and/or associations within a specific sectorMain topics covered: Exchange of know-how and lessons learned, business development, lobbyingOrigin: Mainly established before 1990 by sectoral and thematic groups (of companies)
Differences
Similarities

Policy Research Corporation 798 July 200813 November 2008
Economic prosperity is linked to the degree of cluster strength (European Cluster Observatory): regions with a higher rate of employment in industries that belong to strong clusters are generally more prosperous (higher GDP per capita)Innovation:
• Clusters provide a fertile environment for innovation (EC, DG Enterprise and Industry)• Clusters are a vital element of the Lisbon strategy (EC, DG Enterprise and Industry)• Cluster firms benefit from the flows of tacit knowledge and the presence of skilled labour (EC COM(2008)
652)• Cluster firms are more innovative than non-cluster firms (2006 Innobarometer)• Cluster firms register more trademarks (29% vs. 14%) and apply for more patents (29% vs. 12%) (2006
Innobarometer)• Clusters are well aligned with the modern approach of ‘open innovation’ (innovation is created in open
environments rather than by isolated organisations) (EC COM(2008) 652)Specialisation (EC COM(2008) 652) :
• 38% of all European employees work in enterprises that are part of a cluster• Individual cluster categories differ significantly in the level of employment concentration• Europe lags on average behind the US in terms of cluster strength (probably due to the remaining barriers
to cross-regional competition in Europe and differences in entrepreneurial cultures)Outsourcing:
• Cluster firms contract out more research (41% vs. 20%) and carry out less research in-house (44% vs. 53%) (2006 Innobarometer)
ANNEX 12: OVERVIEW OF KEY ASPECTS AND BENEFITS OF CLUSTERING
85% of cluster firms state that a cluster initiative has improved their competitiveness (Cluster Initiative Greenbook, 2003)

Policy Research Corporation 808 July 200813 November 2008
ANNEX 12: OVERVIEW OF THE MAIN BENEFITS OF CLUSTER ORGANISATIONS
Benefits of cluster organisations are mainly the increase of efficiency within the cluster, the increase in number of business formations and the higher level of innovation
*,** Sources: Policy Research based upon Europe Innova and Oxford Research (2008) – Cluster policy in Europe, European Commission (2008) – European Cluster Observatory, European Commission (2003) – Cluster initiative Greenbook, European Commission (2006) – Innobarometer 2006
Increase in efficiency
Higher level of innovation
Increase in level of business
formations
11
22
33
Companies can operate with a higher level of efficiency drawing on more specialised assets and suppliers with shorter reaction times than they would be able to in isolation
Increase internal and external communication on maritime cluster through promotion to enhance possibilities to cooperate efficiently
Knowledge spillovers and the close interaction with customers and other companies create more new ideas and provide intense pressure to innovate while the cluster environment lowers the cost of experimenting
Focus in maritime clusters on RDI
Start-ups are more reliant on external suppliers and partners, all of which they find in a cluster, which may reduce the costs of failure as entrepreneurs can fall back on local employment opportunities in the many other companies in the same field
Focus in maritime cluster organisation on education, training and the labour market
Cluster benefits in practice**
– Economic prosperity is linked to the degree of cluster strength
– Cluster firms register more trademarks (29% vs. 14%) and apply for more patents (29% vs. 12%)
– Cluster firms contract out more research (41% vs. 20%) and carry out less research in-house (44% vs. 53%)
– Cluster firms expect improved support services
– 85% of cluster firms state that a cluster initiative has improved their competitiveness
– Cluster firms benefit from the flows of tacit knowledge and the presence of a skilled labour
Cluster benefits in theory*
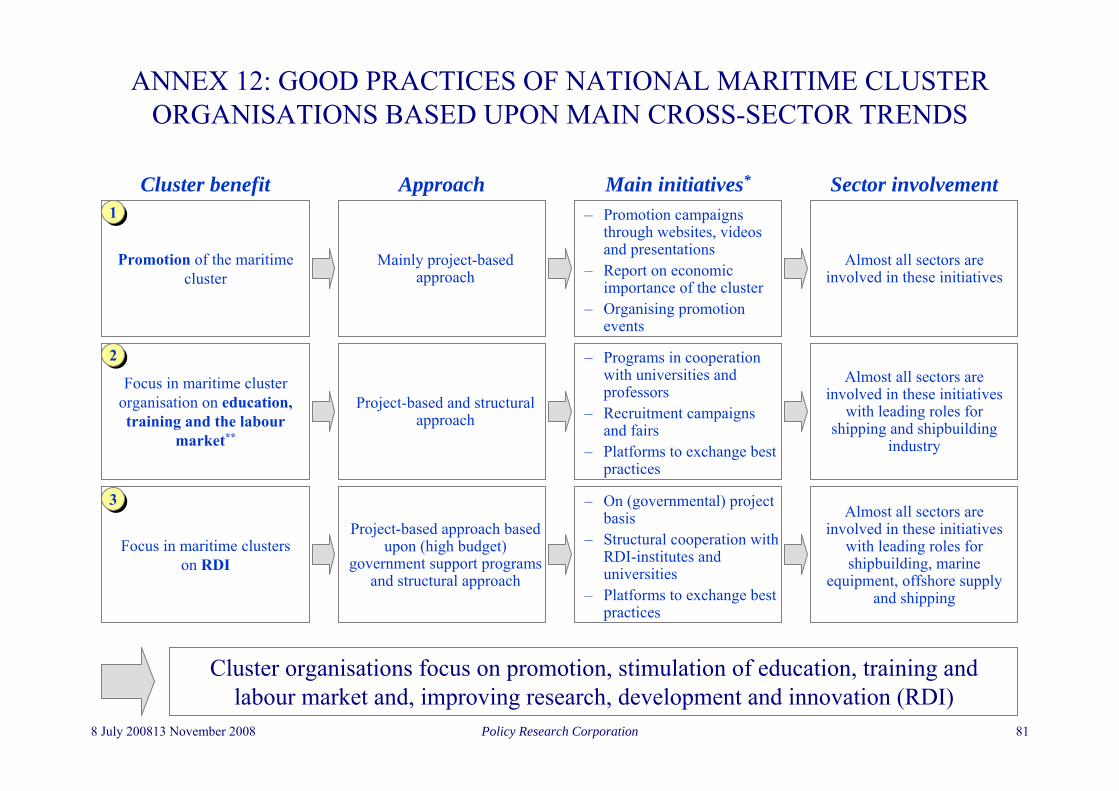
Policy Research Corporation 818 July 200813 November 2008
ANNEX 12: GOOD PRACTICES OF NATIONAL MARITIME CLUSTER ORGANISATIONS BASED UPON MAIN CROSS-SECTOR TRENDS
Cluster organisations focus on promotion, stimulation of education, training and labour market and, improving research, development and innovation (RDI)
Promotion of the maritime cluster
11
22
33
Cluster benefit Main initiatives*
– Promotion campaigns through websites, videos and presentations
– Report on economic importance of the cluster
– Organising promotion events
Almost all sectors are involved in these initiatives
Sector involvement
Focus in maritime cluster organisation on education, training and the labour
market**
Focus in maritime clusters on RDI
– Programs in cooperation with universities and professors
– Recruitment campaigns and fairs
– Platforms to exchange best practices
Almost all sectors are involved in these initiatives
with leading roles for shipping and shipbuilding
industry
– On (governmental) project basis
– Structural cooperation with RDI-institutes and universities
– Platforms to exchange best practices
Almost all sectors are involved in these initiatives
with leading roles for shipbuilding, marine
equipment, offshore supply and shipping
Mainly project-based approach
Project-based and structural approach
Project-based approach based upon (high budget)
government support programs and structural approach
Approach

Policy Research Corporation 828 July 200813 November 2008
Cluster organisations in the major maritime countries focus on promotion of the maritime cluster and improving education and training
Improvement of education and training
Denmark: A share of the former Shipping Credit Bank has been used to set up the Danish Maritime Fund, which finances ‘World Career’ promotion & recruitment activitiesItaly: Mercantile Academy Genova aims at 100 Deck / Machine OfficersThe Netherlands: Formal platform for education and trainingNorway: Maritime Training Program
– Funded by 20 companies– Mix MBA/maritime topics– 30 - 40 young professionals in 2 years
Norway: Professorship (i.e. individual companies contributing to (10) professors acting as company-ambassadors to increase quality of education and training on maritime topics)United Kingdom: The Maritime Skills Alliance to exchange lessons learned and best practices in training facilities of maritime servicing sectors (e.g. ports, shipping, Navy, recreational boating) and maritime manufacturing sectors (e.g. shipbuilding and marine equipment)
Promotion
Denmark: The Blue Denmark (and the blue movie) is a concept to raise public awareness and to promote working in the Danish maritime clusterFinland: Report on economic impact of the maritime clusterItaly: Report on economic impact of the maritime clusterThe Netherlands: Report on economic impact of the maritime cluster and promotion of maritime jobs and carreersNorway: Foundation Norwegian Maritime Competence (Contribution 500 NOK / employee)
– Maritime Providence– Recruiting Campaign ‘Not For All’
Spain: Report on economic impact of the maritime clusterUnited Kingdom: SeaVision is a partnership of app. 500 companies to upgrade the image and profile of the maritime sectors
ANNEX 12: GOOD PRACTICE-INITIATIVES OF NATIONAL MARITIME CLUSTER ORGANISATIONS BASED UPON MAIN CROSS-SECTOR TRENDS

Policy Research Corporation 838 July 200813 November 2008
Cluster organisations in the major maritime countries focus on stimulating research, development and innovation
Stimulation of RDI
Denmark: A share of the former Shipping Credit Bank has been used to set up the Danish Maritime Fund, which finances RDI-institute Maritime Centre of TechnologyDenmark: Innovative projects to sustainably develop the maritime sectors
– Green Ship project: Industry & Universities– Strategic Partnership for Climate Responsibility: Industry & Universities
France: Federal initiative to promote innovative regional sectors (Pôles de Compétitivité)France: Cluster Maritime Français has set up some 18 platforms, synergy groups to discuss various maritime aspects together with partnersGermany: Main goal of cluster organisation is increasing RDI in German maritime-related companies (mainly shipbuilding and marine equipment)Italy: PTNM (National Maritime Technology Platform)
– Integrated approach ‘Project Industry 2015 – Innovation for a Sustainable Mobility’ (budget of € 180 million)– Research on maritime ICT-application– Submission RITMARE, Research Framework Programme for the Sea (budget of € 500 million)
The Netherlands: Formal platform for export and innovationNorway: Change of cluster focus from ‘shipping cluster’ to ‘knowledge hubs’ with attention for the environment
ANNEX 12: GOOD PRACTICE-INITIATIVES OF NATIONAL MARITIME CLUSTER ORGANISATIONS BASED UPON MAIN CROSS-SECTOR TRENDS

Policy Research Corporation 848 July 200813 November 2008
ANNEX 12: IN THE DUTCH MARITIME CLUSTER, IN 2005, MORE THAN 30% OF A MARITIME SECTOR’S LABOUR INTAKE COMES FROM THE CLUSTER
Offshore
Maritime works
Fisheries
Recreational boating
Marine equipment
Inland navigation
Maritime services
Shipping Seaports
Labour intake within the Dutch maritime clusters indicates the benefits for the whole cluster of improving education and training
Source: Ecorys (2006) – Monitor maritime labour market
10%
25%
10%
25%
10%
10%
15%5%
10%
5% Ship-building
45%
29%
33%
70%
38%
15%
35%
21%
27%64% Intake within sectorIntake between sectors
Navy
unknown
10%

Policy Research Corporation 858 July 200813 November 2008
Offshore
Fisheries
Recreational boating
Marine equipment
Inland navigation
Maritime services
Shipping Seaports
Labour outflow within the Dutch maritime clusters indicates the benefits for the whole cluster of improving education and training
Source: Ecorys (2006) – Monitor maritime labour market
10%
25%
15%
10%
10%
10% Ship-building
47%
47%
34%
16%
29%
22%
18%
12%
23%42% Outflow within sectorOutflow between sectors
10%
10%
Maritime works
10%
ANNEX 12: IN THE DUTCH MARITIME CLUSTER ALMOST 40% OF A MARITIME SECTOR’S LABOUR OUTFLOW GOES TO THE CLUSTER
Navy
unknown
10%

Policy Research Corporation 868 July 200813 November 2008
ANNEX 12: BENEFITS OF A PUBLIC-PRIVATE INTEGRATED MARITIME CLUSTER ORGANISATION AS GOOD PRACTICE
Structure
Public-private integrated cluster organisations capture all relevant maritime stake-holders in order to have well-structured discussions between government and sector
* Sectors that have limited logical links and/or relations with other maritime sectors experience limited cluster benefits
A public-private integrated cluster organisation captures maritime stakeholders with logical links/relations* (i.e. government and sectors represented by trade associations, private persons on personal title and/or companies) as initiator or as member of that organisation (on the basis of equality relations)
Main benefits of a public-private integrated maritime cluster organisation:– Well-structured discussion between government and sector– Cluster-wide approach– Focus on long-term growth and development as well as on (often short-term) sectors’ interests– Ability to create a level playing field (through legislation)– Sector involvement in the evaluation of the cluster organisation (through membership
contribution)– Improved communication (horizontally and vertically)

Policy Research Corporation 878 July 200813 November 2008
ANNEX 12: THE STRUCTURE OF A PUBLIC-PRIVATE INTEGRATED MARITIME CLUSTER ORGANISATION
Examples of the Netherlands and Denmark
Public-private integrated cluster organisations as in the Netherlands and Denmark lead to improved cooperation between government and the maritime industry
Denmark
Dutch Maritime Network
Ministry of Transport
Independent representatives of sector associations
Companies
– The Netherlands have a public-private integrated cluster where government and companies can regularly interact through the cluster organisation and sector associations
– Dutch Maritime Network is the cluster organisation– The Ministry of Transport is directly involved in the activities
of the cluster organisation (through financing) – Independent representatives of sectors associations (on
personal title) are members of the cluster organisation
The Netherlands
European Maritime Development Centre
Danish Maritime Authority
Sector associations
Companies
– Denmark has a public-private integrated cluster where government and the sectors can regularly interact through the European Maritime Development Centre
– Danish Maritime Authority is (financially and operationally) leading in the organisation of the cluster
– European Maritime Development Centre acts as a representative of the maritime cluster (single-point-of-entry)

Policy Research Corporation 888 July 200813 November 2008
ANNEX 13: THE LINK BETWEEN CLUSTER POLICIES AND SECTOR PERFORMANCE
Three categories of cluster policies (EC COM(2008) 652):• Facilitating policies: create a favourable microeconomic business environment for growth
and innovation (indirect stimulation of the emergence and dynamics of clusters)• Traditional framework policies: industry and SME policies, research and innovation policies,
and regional policies• Development policies: aiming at creating, mobilising or strengthening a particular cluster
category resulting in specific sectoral cluster initiativesCluster policy area is still at an early stage:
• Use of the cluster policy concept started in 1990-1994• Around half of the countries used cluster policy for the first time in the period from 2000
until today• Over 68% of companies working in a cluster-like environment agree that public authorities
have a fundamental or important role to play to support the clusterDifficulty to measure the impact of cluster policies and programmes as most of their effects are only indirect and affected by many other factors => difficult to establish clear causal links between cluster policies and programmes and their (potential) impact
Source: EC, 2008, COM(2008) 652, The concept of clusters and cluster policies and their role for competitiveness and innovation: Main statistical results and lessons learned

Policy Research Corporation 898 July 200813 November 2008
ANNEX 14: SWOT-ANALYSIS OF NATIONAL TOP-DOWNINITIATED CLUSTER ORGANISATIONS
WeaknessesStrengths
ThreatsOpportunities
– Focus on long term strategy and policy– Increasing the growth of all sectors within the cluster– Strong focus on RDI– Ability to create a level playing field (through legislation)– High budgets to finance activities– Positively influence common interests (e.g. environment and
legislation)
– Difficult to define to which cluster(s) a sector belongs (e.g. ports: logistics or maritime cluster)
⇒ Not always clear which interests are at stake or how they can be aligned with other (maritime) sector interests
– Continuous balancing between interests of clusterorganisations and sector associations requires constant interaction
⇒ Surplus value of cluster organisations needs to be proved constantly
⇒ Widespread variety of interests leads to a focus on universal, softer themes
– Lack of an integrated cluster approach (several ministries involved without in-depth cooperation)
– Limited sector involvement could lead to suboptimal maritime cluster policy
– Focussing too much on long-term benefits for the maritime sectors may hamper or conflict with the clusters’ companies short term interests
National top-down organisations focus on increasing competitiveness and on strategy of the maritime cluster by balancing sector’s needs
– Increasing cooperation on European level to discuss best practices and lessons learned
– Maritime sectors could take the initiative (or be invited) to establish a single-point-of-entry to increase structural interactions with the government
– Involvement of sector opinion in the structural evaluation of cluster organisation’s activities

Policy Research Corporation 908 July 200813 November 2008
ANNEX 14: SWOT-ANALYSIS OF NATIONAL BOTTOM-UPINITIATED CLUSTER ORGANISATIONS
National bottom-up organisations often focus on softer and short-term operational issues from a narrow scope
WeaknessesStrengths
ThreatsOpportunities
– Cluster awareness contributes to enhancing business efficiency and opportunities
– Focus on operational problems– Structural evaluation of the cluster organisations by the
sector (e.g. membership contribution)– Ability to act as single-point-of-entry to the government to
discuss (often short-term) sectors’ interests (e.g. tax and regulation)
– Organisation of events (e.g. to promote working in the cluster)
– Differences in sector interests can lead to a difficult decision-making process within cluster organisations, often resulting in a rather narrow focus on softer themes (e.g. promotion)
– Unbalanced protection of company/sector interests:⇒ Limited cluster approach: in many cases, not all members or
supporting companies and sector (associations) have the same weight and influence within a cluster organisations
⇒ Strong impact of largest contributing members in the decision-making process could lead to an imbalance in the protection of (all) interests
– Limited focus on strategy and long-term growth of the involved sectors and the cluster as a whole
– Too narrow local focus may lead to the suboptimal functioning of a maritime cluster organisation
– Insufficient attention for the role of (relatively) smaller sectors and companies within the maritime cluster
– Increasing cooperation on European level to discuss good practices and lessons learned
– Increase government involvement (and budget) in the cluster organisation to improve mutual understanding and fine-tune policy making
– Focus on longer term maritime sector benefits (strategy and growth)

Policy Research Corporation 918 July 200813 November 2008
ANNEX 15: CONTACTED PERSONS
(available on demand)

Policy Research Corporation 928 July 200813 November 2008
ANNEX 16: LIST OF ABBREVIATIONS– CEDA: Central Dredging Association– CESA: Community of European Shipyards Associations– CMF: Cluster Maritime Français– DG ENTR: Directorate-General Enterprise and Industry (European Commission)– DG MARE: Directorate-General Maritime Affairs and Fisheries (European Commission)– DG TREN: Directorate-General Transport and Energy (European Commission)– ECNI: European Confederation of Nautical Industries– ECSA: European Community Shipowners' Associations– EFIP: European Federation of Inland Ports – EMEC: European Marine Equipment Council– ENMC: European Network of Maritime Cluster– ESPO: European Sea Ports Organisation– EuDA: European Dredging Association– EURMIG: European Union Recreational Marine Industry Group– FOD MOB: Federal public service Mobility and Transport (Belgium)– GICAN: Groupement Industriel des Constructions et Armements Navals– KBRV: Koninklijke Belgische Reders Vereniging (Royal Association of Belgian Shipowners)– KIGM: Polish Chamber of Maritime Commerce– KVNR: Koninklijke Vereniging Nederlandse Reders (Royal Association of Dutch Shipowners)– MARUT: Maritim Utvikling (Maritime Development)– Mer PACA: Mer Provence-Alpes-Côte d’Azur– MIF: Maritime Industries Forum– NOK: Norwegian Kroner– OLP: Piraeus Port Authority– RDI: Research, Development and Innovation– RITMARE: Italian Research for the Sea– Ro-ro: Roll on – roll off– SMC: Spanish Maritime Cluster (Cluster Maritimo Espanol)

Policy Research Corporation 938 July 200813 November 2008
ANNEX 17: LIST OF REFERENCES (1/4)– Adamowitsch, G.W. (2005) – Presentation at Maritimes Industrie Forum 2005 – Association of Finnish Maritime Industries (2003) – The Finnish maritime cluster – Assoporti and Censis (2008) – Analisi dell’ impatto economico e occupazionale dei porti commerciali italiani – La nautica in cifre– BIMCO/ISF (2005) – Manpower 2005 update – Bureau of Statistics Norway – CAB International, Cruise Ship Tourism, 2006 – CESA – Annual Report 2006-2007 – CESA (2008) – Draft version annual report 2007-2008 – Chamber of Shipping (2008) – Annual Report 2007-2008 – Cluster Maritimo Español (2005) – Quantification and economic impact of the maritime sector – Cluster Maritimo Español (2008) – Update of quantification and economic impact of the maritime sector – Danish Maritime Authority (2007) – Fakta om søfart– Departament d’Investigació i Estrategia de Mercats (2007) – Sports and Recreational Boating in Spain – DG MARE – Facts & Figures of countries – Directorate General for Internal Policies of the Union (DGIPU) (2008), The Impact of Tourism on Coastal Areas: Regional
Development Aspects– DTI (2001) – The UK marine equipment industry – Dutch Maritime Network & Maritimt Forum Norway (2006) – Dynamic European Maritime Clusters – Dutch Maritime Network (2005) - European Maritime Policy Conference: proceedings: Chapter 12 – Dutch Maritime Network (2007) – Annual Report 2007 – EAPO (2007) – Observations to the Green Paper “Towards a future maritime policy for the union”– EC (2001) – Transport White Paper (2001); legal framework: TEN-T Guidelines (2004)– EC (2003) – Cluster initiative Greenbook– EC (2006) – Council Regulation on the European Fisheries Fund, No. 1198/2006 European Foundation for the improvement of
living and working conditions (2008) – Article concerning port workers in Romania – EC (2006) – Innobarometer 2006

Policy Research Corporation 948 July 200813 November 2008
ANNEX 17: LIST OF REFERENCES (2/4)
– EC (2006) – “Keep Europe moving - Sustainable mobility for our continent”: mid-term review of the European Commission’s 2001 Transport White Paper
– EC (2006) - National Approaches to Maritime Affairs: Background Paper Nr 11 to the Green Paper on a future maritime policy for the Union
– EC (2007) – Commission staff working document (2007) SEC (2007) 1351– EC (2008) – European Cluster Observatory– EC (2008) – Press release European Commission-Fisheries (IP/08/960) – EC (2008) – The concept of clusters and cluster policies and their role for competitiveness and innovation: Main statistical results
and lessons learned – EC (2008) – Towards world-class clusters in the European Union: Implementing the broad-based innovation strategy– Ecorys (2006) – Monitor maritime labour market– Ecotec (2006) – Employment trends in all sectors related to the sea or using sea-resources– ESPO (2007) – Annual report 2006-2007– Europe Innova and Oxford Research (2008) – Cluster policy in Europe– European Cruise Council (2007), Contribution of cruise tourism to the economies of Europe– European Travel Commission (2006), Tourism Trends for Europe– Eurostat – Industry, Trade and Services (Annual enterprise statistics) 2005 – Eurostat – Maritime Transport 2005 – Eurostat – Tourism indicators 2005 – Federazione del Mare (2006) – The third maritime economy report – G.P. Wild and Business Research and Economic Advisors (2007) – Contribution of cruise tourism to the economies of Europe – Gican (2008) – Houthoff Buruma and Policy Research (2007) – IPR Shipbuilding study – KIGM (2008) – KVNR (2006) – De Nederlandse Scheepvaart: Door op vol vermogen

Policy Research Corporation 958 July 200813 November 2008
ANNEX 17: LIST OF REFERENCES (3/4)
– L’Insee (2006) – Ports Maritimes Autonomes– Leadership 2015, High-level advisory group to the European Commission (2003) – LEI (2006) – Employment in the fisheries sector– Marine Norway (2007) – Maritime Industries Forum (2006) – Facts & figures on the Norwegian Maritime Industry – Maritimt Forum (2007) – Maritim Verdiskapingsbok– Maritimt Forum (2007) – Value creation in the Norwegian Maritime Cluster – Ministry of Economic and Business Affairs (2006) – The Danish Maritime Cluster-An Agenda for Growth – Ministry of Education and Research (2000) – Shipping and marine technology for the 21st century – Nationale Bank van België (2007) – Het economisch belang van de Belgische zeehavens– Nationale Havenraad (2005) – Zeehavengerelateerde werkgelegenheid en toegevoegde waarde– Norwegian Ministry of Trade and Industry (2008) – Piraeus Port Authority (2008) – Pôles de compétitivité (2008) – Policy Research Corporation (2001) – Economic impact of the maritime industries in Europe – Policy Research Corporation (2006) – Economic Monitor of the Dutch Maritime Cluster – Puertos del Estado (2005) – Anuario Estadístico– Questionnaire of Federazione del Mare– Questionnaire of Maritimt Forum and Interviews with Maritimt Forum, Oslo Maritime Network, Menon, Norske Industri, Det
Norske Veritas and Kongsberg – Questionnaire of the Chamber of Shipping and Interviews with Chamber of Shipping, UK Major Ports Group, Brittish Ports
Association, Maritime London, The Baltic Exchange, Society of Maritime Industries, Department for Transport – Research in Germany (2008) – SeaVision UK – Statistics

Policy Research Corporation 968 July 200813 November 2008
ANNEX 17: LIST OF REFERENCES (4/4)
– UCINA (2007) – United Nations (2004) – Fishery country profile – Vlaamse Havencommissie (2005) – Jaaroverzicht van de Vlaamse Havens 2005 – Vlachos, G. (Greek Merchant Marine Ministry) (2006) – VNSI (2005) – Dutch LeaderSHIP 2015– Wondermar (2002) – Workshop 1 Gdansk: Meaning of RTD for the Polish Maritime Industry – Zentralverband der deutschen Seehafenbetriebe (2005) – Seegüterumschlag ausgewählter Häfen
Weblinks to Country Reports on maritime clusters– Overview http://www.european-network-of-maritime-clusters.eu/publications/4.pdf and http://www.european-network-of-maritime-
clusters.eu/publications/9.pdf– Finland http://www.european-network-of-maritime-clusters.eu/publications/13.pdf– France http://www.european-network-of-maritime-clusters.eu/publications/10.pdf– Italy http://www.european-network-of-maritime-clusters.eu/publications/11.pdf and http://www.european-network-of-maritime-
clusters.eu/publications/14.pdf– Spain http://www.european-network-of-maritime-clusters.eu/publications/15.pdf and http://www.european-network-of-maritime-
clusters.eu/publication/17?c=180– Netherlands/Norway http://www.european-network-of-maritime-clusters.eu/publications/2.pdf– Norway http://www.european-network-of-maritime-clusters.eu/publications/12.pdf and
http://www.regjeringen.no/upload/kilde/fid/rap/2004/0001/ddd/pdfv/220416-rmv_sluttrapport.pdf

Policy Research CorporationPolicy Research CorporationSOUNDSOUND SOLUTIONS BASED ON SCIENTIFIC RESEARCHSOLUTIONS BASED ON SCIENTIFIC RESEARCH
The Netherlands office: Policy Research Corporation Nederland B.V.
Parklaan 403016 BC Rotterdam (Nederland)tel : +31 10 436 0 364fax : +31 10 436 1 416e-mail : [email protected] : www.policyresearch.nl
Belgian office: Policy Research Corporation N.V.
Jan Moorkensstraat 682600 Antwerpen (België)tel : +32 3 286 94 94fax : +32 3 286 94 96e-mail : [email protected] : www.policyresearch.be