Annex “A” List of the Representatives of the Combined...
48
Annex “A” List of the Representatives of the Combined Fourth and Fifth Periodic Myanmar CEDAW Reports Writing Committee 1. Mr. SoeKyi Chair Person Director General Department of Social Welfare 2. Ms. NandarHmon Vice Chair Person Director General Department of Historical Research and National Library 3. Mr. AungTunKhaing Member Deputy Director General Department of Social Welfare 4. Police Colonel AungHtayMyint(Mr.) Member Transnational Organized Crime Division Myanmar Police Force Ministry of Home Affairs 5. Ms. SweSweNaing Member Director General Administration Department Ministry of Home Affairs 6. Ms. Nan Sandar San Member Director The Supreme Court of the Union 7. Ms. Tin Mar Htwe Member Director Department of Labour Ministry of Labour, Employment and Social Security
Transcript of Annex “A” List of the Representatives of the Combined...

Annex “A”
List of the Representatives of the Combined Fourth and Fifth Periodic
Myanmar CEDAW Reports Writing Committee
1. Mr. SoeKyi Chair Person
Director General
Department of Social Welfare
2. Ms. NandarHmon Vice Chair Person
Director General
Department of Historical Research and
National Library
3. Mr. AungTunKhaing Member
Deputy Director General
Department of Social Welfare
4. Police Colonel AungHtayMyint(Mr.) Member
Transnational Organized Crime Division
Myanmar Police Force
Ministry of Home Affairs
5. Ms. SweSweNaing Member
Director
General Administration Department
Ministry of Home Affairs
6. Ms. Nan Sandar San Member
Director
The Supreme Court of the Union
7. Ms. Tin Mar Htwe Member
Director
Department of Labour
Ministry of Labour, Employment and Social Security
Annex "A" - 1
8. Mr.ZinAung Aye Member
Director
Department of Education and Training
Ministry of Border Affairs
9. Ms. KyuKyuKhin Member
Director
Department of Rural Development
Ministry of Livestock, Fisheries and Rural Development
10. Police Lt. Colonel Ohnmar Rang Mi(Ms.) Member
Staff Officer (Grade-1)
Anti –Trafficking Police Force
Myanmar Police Force
Ministry of Home Affairs
11. Dr. ThidarOo(Ms.) Member
Director
The Attorney General Office of the Union
12. Mr.Kyaw Thu Nyein Member
Deputy Director
International Organizations and Economic Department
Ministry of Foreign Affairs
13. Mr. Tin Myint Member
Deputy Director, Planning Department
Ministry of National Planning and Economic Development
14. Ms.Mu Mu Aung Member
Deputy Director (Statistics and Computer)
Department of Educational Planning and Training
Ministry of Education
15. Dr. TheingiMyint(Ms.) Member
Deputy Director
Department of Health

Annex “A" –2
16. Ms. HmonShwe Yi Member
Deputy Director
Immigration and National Registration Department
Ministry of Immigration and Population
17. Mr. Kyaw Min Member
Deputy Director
Department of Progress of Border Areas and National Races
Ministry of Border Affairs
18. Mr.Myint Thu Member
Secretary
Social Development Committee
PyithuHluttaw
19. Ms.KhinThanMyint Member
Member
Social Development Committee
PyithuHluttaw
20. Colonel HtayNaing(Mr.) Member
Tatmadaw Representative
PyithuHluttaw
21. Major NaingNaingWin(Mr.) Member
Secretary
Women and Children Committee
AmyothaHluttaw
22. Mr. Win NaingShein Member
Member
Women and Children Committee
AmyothaHluttaw
23. Major AungKyawZaw(Mr.) Member
Member
Women and Children Committee

Annex "A" –3
24. Major HlaMyoKyaw(Mr.) Member
Deputy Assistant Judge Advocate General
Office of Judge Advocate General
25. Dr. Khin Mar Tun(Ms.) Member
Secretary General
Myanmar Women’s Affairs Federation
26. Ms. Tin Tin Win Member
Joint-Secretary -1
Myanmar Maternal and Child Welfare Association
27. Ms.KhinMya Win Member
Joint –Secretary
Myanmar Women and Children Development Association
28. Ms.HninWai Member
Secretary
Myanmar Women’s Entrepreneur Association
29. Ms. May SabaiPyu Member
Gender Equality Network (GEN)
30. Ms. May MayPyone Member
CEDAW Action Myanmar (CAM)
31. Mr. Saw Win Secretary
Director
Department of Social Welfare
32. Ms.NawThaWah Joint-Secretary
Deputy Director
Department of Social Welfare
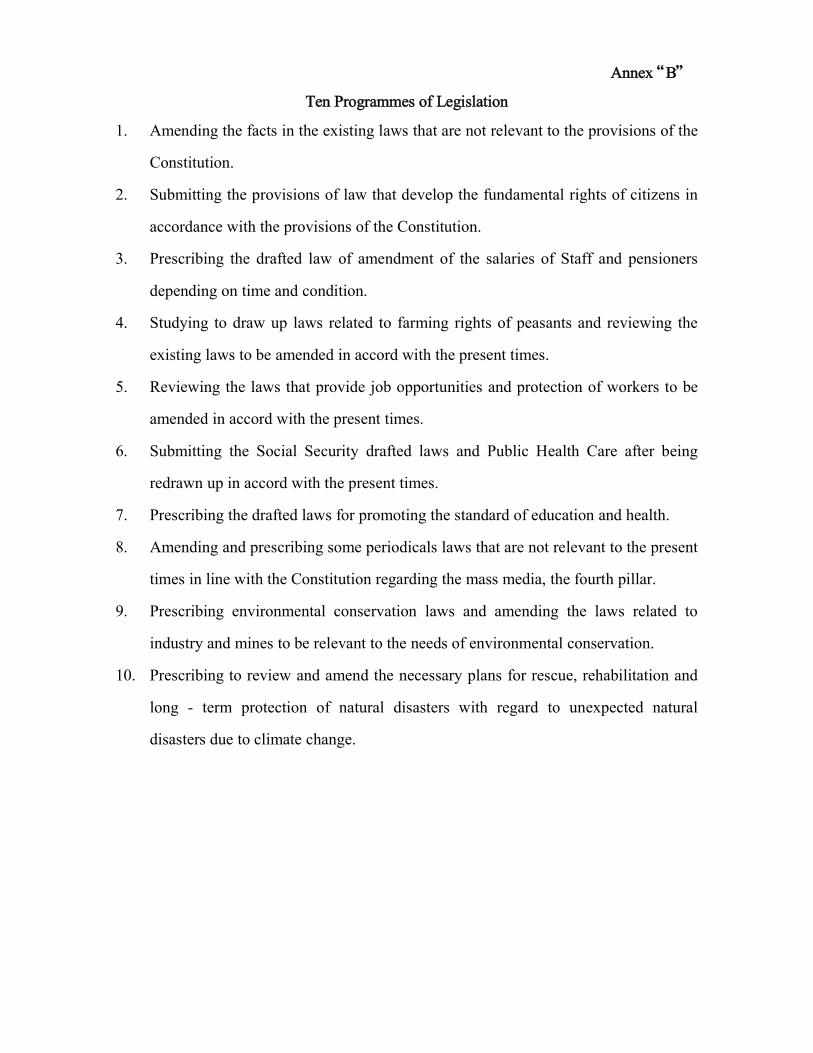
Annex “B”
Ten Programmes of Legislation
1. Amending the facts in the existing laws that are not relevant to the provisions of the
Constitution.
2. Submitting the provisions of law that develop the fundamental rights of citizens in
accordance with the provisions of the Constitution.
3. Prescribing the drafted law of amendment of the salaries of Staff and pensioners
depending on time and condition.
4. Studying to draw up laws related to farming rights of peasants and reviewing the
existing laws to be amended in accord with the present times.
5. Reviewing the laws that provide job opportunities and protection of workers to be
amended in accord with the present times.
6. Submitting the Social Security drafted laws and Public Health Care after being
redrawn up in accord with the present times.
7. Prescribing the drafted laws for promoting the standard of education and health.
8. Amending and prescribing some periodicals laws that are not relevant to the present
times in line with the Constitution regarding the mass media, the fourth pillar.
9. Prescribing environmental conservation laws and amending the laws related to
industry and mines to be relevant to the needs of environmental conservation.
10. Prescribing to review and amend the necessary plans for rescue, rehabilitation and
long - term protection of natural disasters with regard to unexpected natural
disasters due to climate change.

Annex “C”
Various Types of Violence of the Complaints received by Myanmar Women’s Affairs Federation (2008-2013)
Sr. Year
Types of Violence
Trafficking Oral abuse Threat Control Criticizing Family affairs Adultery Other Total
Physical Mental Sexual
1 2008 30 4 43 10 5 18 14 9 24 16 43 216
2 2009 52 2 37 11 4 26 18 5 37 19 39 250
3 2010 122 7 52 11 - 15 1 1 6 13 22 250
4 2011 - 54 - 4 9 38 2 32 33 13 7 192
5 2012 10 23 11 3 5 29 4 1 26 20 42 174
6 2013 9 9 13 2 8 20 2 2 15 23 67 170
Total 223 99 156 41 31 146 41 50 141 104 220 1252

Annex “C”-1
Indicators of Protecting Violence against Women in Regions and States (2008)
Sr.
no
Regions/
States
No of persons who
attended the Counselling
Training
Counselling
Center
No of persons who came
to the Counselling Center
for help
Taking Actions of complaint letters Legal Protection
Male Female Total No Male Female Total
Referring
to the
respective
Department
Taking
Record
Reply to the
complainants Total
Informing
to the
Police
Contact to
the Court
Providing
Lawyer
1 Kachin - 4 4 5 - 85 85 32 18 31 81 18 19 8
2 Kayar - 18 18 2 - 13 13 4 - - 4 - 4 -
3 Kayin 3 35 38 3 - 39 39 17 16 13 46 8 15 1
4 Chin 3 8 11 3 - 14 14 5 4 1 10 - 4 -
5 Sagaing 3 36 39 8 - 64 64 27 54 34 115 11 30 2
6 Tanintharyi - 2 2 3 4 21 25 - 27 39 66 1 12 -
7 Bago(East) - 25 25 2 1 21 22 52 48 12 112 9 21 5
8 Bago (West) - 30 30 2 - 18 18 12 26 32 70 7 5 -
9 Magway 5 32 37 5 - 5 5 18 16 37 71 - 3 -
10 Mandalay - 30 30 8 - 452 452 107 130 394 631 12 47 9
11 Mon - 32 32 2 - 55 55 16 18 21 55 4 12 1
12 Rakhine 2 257 259 4 - 22 22 6 - 20 26 3 3 -
13 Yangon - 27 27 4 - 230 230 10 7 213 240 - - -
14 Shan(South) 2 42 44 3 - 46 46 6 20 20 46 2 4 -
15 Shan(East) - 34 34 4 - 33 33 6 25 2 33 1 3 -
16 Shan(North) - - - 5 - 36 36 4 12 5 21 3 4 -
17 Ayeyarwaddy - 41 41 6 5 206 211 15 60 109 184 2 45 -
Total 18 653 671 69 10 1360 1370 337 481 983 1811 81 231 26

Annex “C”-2
Indicators of Protecting Violence against Women in Regions and States (2009)
Sr.
no
Regions/
States
No of persons who
attended the Counselling
Training
Counselling
Center
No of persons who came to
the Counselling Center for
help
Taking Actions of complaint letters Legal Protection
Male Female Total No Male Female Total
Referring to the
respective
Department
Taking
Record
Reply to the
complainants Total
Informing
to the Police
Contact
to the Court
Providing
Lawyer
1 Nay Pyi Taw - - - - - - - - - - - - - -
2 Kachin 4 4 8 5 - 67 67 15 16 31 62 12 11 -
3 Kayar - 12 12 2 - 4 4 - - 4 4 - 3 -
4 Kayin 3 35 38 3 1 30 31 11 11 15 37 8 11 1
5 Chin 3 8 11 2 - 6 6 3 2 6 11 - - -
6 Sagaing 3 36 39 8 - 47 47 43 53 17 113 10 32 2
7 Tanintharyi - 9 9 3 - 16 16 - 35 47 82 - 2 -
8 Bago - 72 72 4 - 36 36 39 53 23 115 19 6 5
9 Magway 5 32 37 5 5 7 12 27 38 8 73 - - -
10 Mandalay - 30 30 8 - 388 388 37 270 153 460 17 16 -
11 Mon - 32 32 2 - 59 59 12 14 33 59 5 7 2
12 Rakhine - 37 37 4 - 68 68 20 15 23 59 25 5 3
13 Yangon - 92 92 4 - 197 197 14 41 140 195 - - -
14 Shan 1 118 119 14 1 77 78 5 75 28 108 1 4 -
15 Ayeyarwaddy - 41 41 6 4 252 256 40 40 123 203 8 33 1
Total 19 558 577 70 11 1254 1265 266 663 651 1581 105 130 14
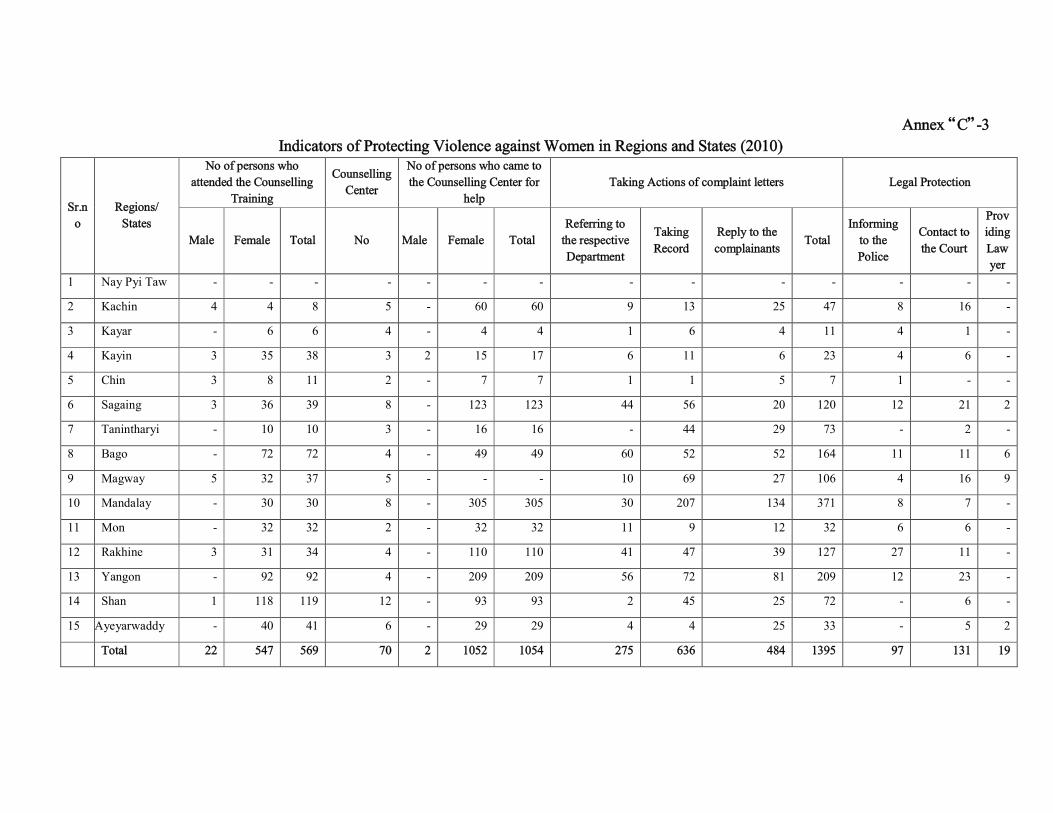
Annex “C”-3
Indicators of Protecting Violence against Women in Regions and States (2010)
Sr.n
o
Regions/
States
No of persons who
attended the Counselling
Training
Counselling
Center
No of persons who came to
the Counselling Center for
help
Taking Actions of complaint letters Legal Protection
Male Female Total No Male Female Total
Referring to
the respective
Department
Taking
Record
Reply to the
complainants Total
Informing
to the
Police
Contact to
the Court
Prov
iding
Law
yer
1 Nay Pyi Taw - - - - - - - - - - - - - -
2 Kachin 4 4 8 5 - 60 60 9 13 25 47 8 16 -
3 Kayar - 6 6 4 - 4 4 1 6 4 11 4 1 -
4 Kayin 3 35 38 3 2 15 17 6 11 6 23 4 6 -
5 Chin 3 8 11 2 - 7 7 1 1 5 7 1 - -
6 Sagaing 3 36 39 8 - 123 123 44 56 20 120 12 21 2
7 Tanintharyi - 10 10 3 - 16 16 - 44 29 73 - 2 -
8 Bago - 72 72 4 - 49 49 60 52 52 164 11 11 6
9 Magway 5 32 37 5 - - - 10 69 27 106 4 16 9
10 Mandalay - 30 30 8 - 305 305 30 207 134 371 8 7 -
11 Mon - 32 32 2 - 32 32 11 9 12 32 6 6 -
12 Rakhine 3 31 34 4 - 110 110 41 47 39 127 27 11 -
13 Yangon - 92 92 4 - 209 209 56 72 81 209 12 23 -
14 Shan 1 118 119 12 - 93 93 2 45 25 72 - 6 -
15 Ayeyarwaddy - 40 41 6 - 29 29 4 4 25 33 - 5 2
Total 22 547 569 70 2 1052 1054 275 636 484 1395 97 131 19

Annex “C”-4
Indicators of Protecting Violence against Women in Regions and States (2011)
Sr.
no
Regions/
States
No of persons who
attended the
Counselling Training
Counselling
Center
No of persons who came to
the Counselling Center for
help
Taking Actions of complaint letters Legal Protection
Male Female Total No Male Female Total
Referring to
the respective
Department
Taking
Record
Reply to the
complainants Total
Informing
to the
Police
Contact to
the Court
Providing
Lawyer
1 Nay Pyi Taw - - - - - - - - - - - - - -
2 Kachin 4 4 8 5 - 91 91 23 19 31 73 13 5 -
3 Kayar - - - 2 - 4 4 1 7 4 12 - - -
4 Kayin 3 35 38 3 - 10 10 - 6 3 9 - 2 -
5 Chin 3 8 11 2 - 9 9 1 3 5 9 1 - -
6 Sagaing 3 36 39 8 - 127 127 65 108 29 202 19 41 1
7 Tanintharyi - 9 9 3 - 12 12 - 41 22 63 - 2 -
8 Bago - 89 89 4 2 38 40 20 13 7 40 3 12 4
9 Magway 5 32 37 - - - - 12 88 13 113 - 23 8
10 Mandalay - 28 28 7 - 189 189 100 84 197 381 - - -
11 Mon - 32 32 2 - 24 24 6 8 10 24 3 5 2
12 Rakhine - - - 4 - 68 68 25 35 25 85 20 8 -
13 Yangon - 92 92 4 - 168 168 34 71 63 168 12 21 -
14 Shan 1 38 39 3 - 39 39 - 20 19 39 - - -
15 Ayeyarwaddy - 41 41 6 - 112 112 7 22 82 111 5 22 -
Total 19 444 463 53 2 891 893 294 525 510 1329 76 141 15
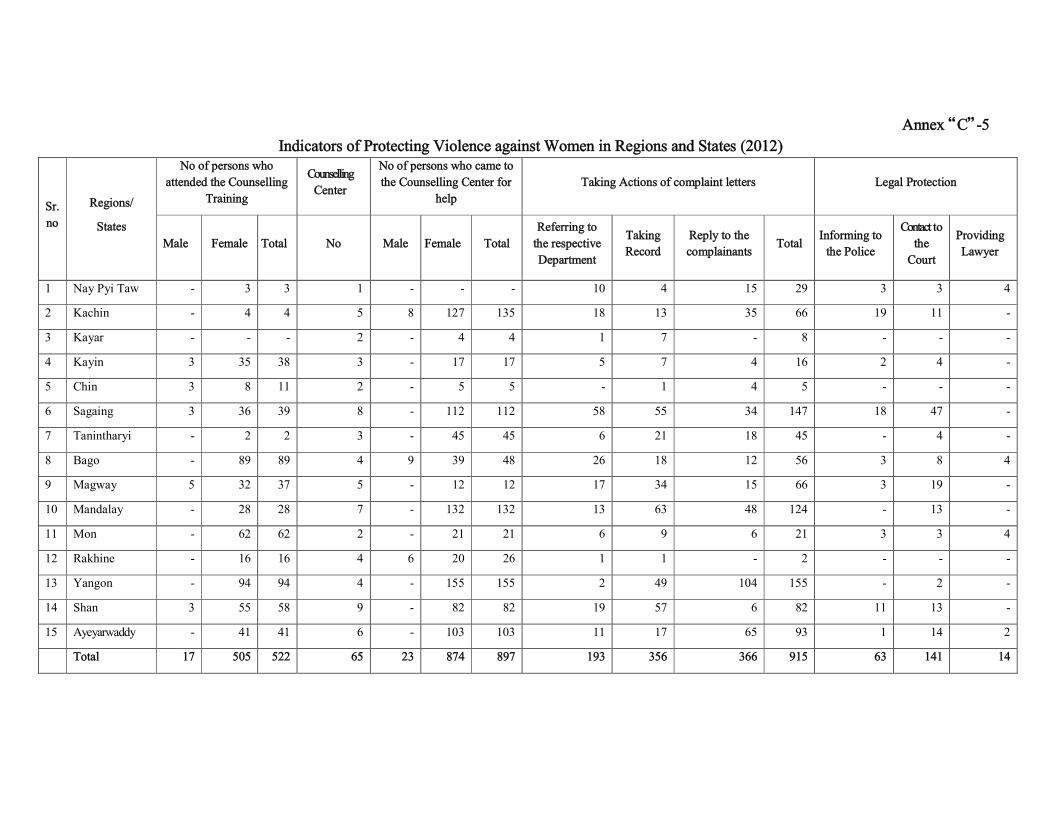
Annex “C”-5
Indicators of Protecting Violence against Women in Regions and States (2012)
Sr.
no
Regions/
States
No of persons who
attended the Counselling
Training
Counselling
Center
No of persons who came to
the Counselling Center for
help
Taking Actions of complaint letters Legal Protection
Male Female Total No Male Female Total
Referring to
the respective
Department
Taking
Record
Reply to the
complainants Total
Informing to
the Police
Contact to
the
Court
Providing
Lawyer
1 Nay Pyi Taw - 3 3 1 - - - 10 4 15 29 3 3 4
2 Kachin - 4 4 5 8 127 135 18 13 35 66 19 11 -
3 Kayar - - - 2 - 4 4 1 7 - 8 - - -
4 Kayin 3 35 38 3 - 17 17 5 7 4 16 2 4 -
5 Chin 3 8 11 2 - 5 5 - 1 4 5 - - -
6 Sagaing 3 36 39 8 - 112 112 58 55 34 147 18 47 -
7 Tanintharyi - 2 2 3 - 45 45 6 21 18 45 - 4 -
8 Bago - 89 89 4 9 39 48 26 18 12 56 3 8 4
9 Magway 5 32 37 5 - 12 12 17 34 15 66 3 19 -
10 Mandalay - 28 28 7 - 132 132 13 63 48 124 - 13 -
11 Mon - 62 62 2 - 21 21 6 9 6 21 3 3 4
12 Rakhine - 16 16 4 6 20 26 1 1 - 2 - - -
13 Yangon - 94 94 4 - 155 155 2 49 104 155 - 2 -
14 Shan 3 55 58 9 - 82 82 19 57 6 82 11 13 -
15 Ayeyarwaddy - 41 41 6 - 103 103 11 17 65 93 1 14 2
Total 17 505 522 65 23 874 897 193 356 366 915 63 141 14
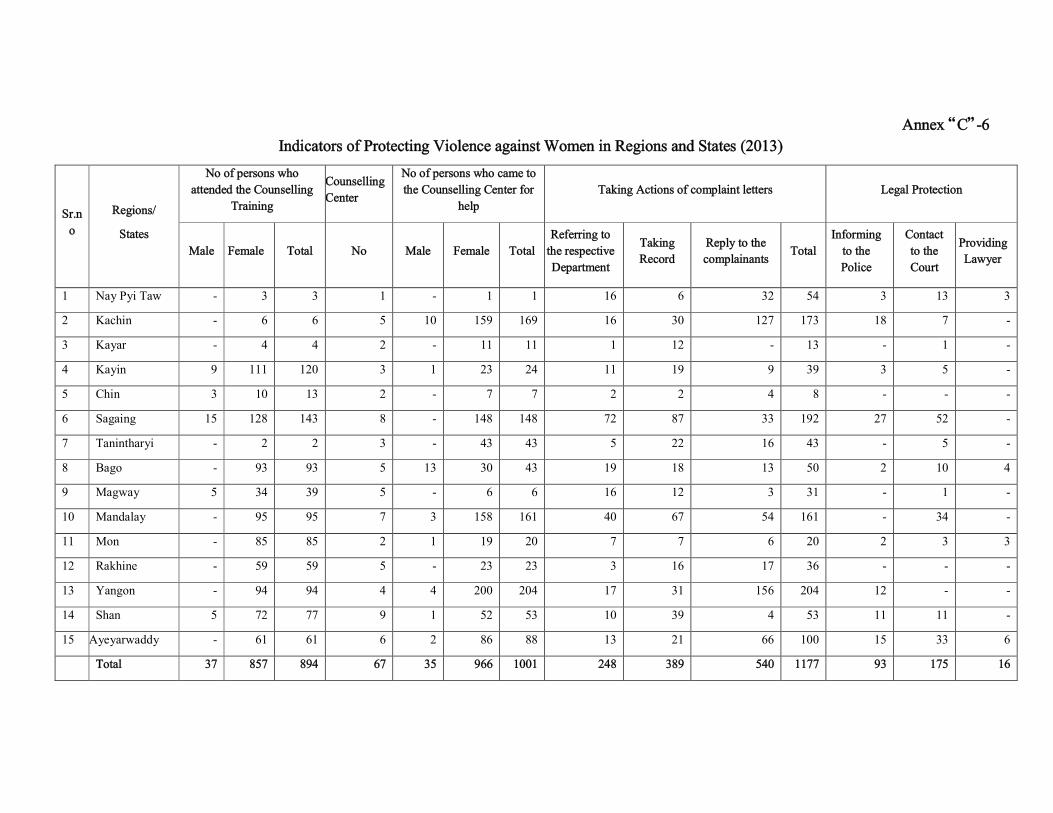
Annex “C”-6
Indicators of Protecting Violence against Women in Regions and States (2013)
Sr.n
o
Regions/
States
No of persons who
attended the Counselling
Training
Counselling
Center
No of persons who came to
the Counselling Center for
help
Taking Actions of complaint letters Legal Protection
Male Female Total No Male Female Total
Referring to
the respective
Department
Taking
Record
Reply to the
complainants Total
Informing
to the
Police
Contact
to the
Court
Providing
Lawyer
1 Nay Pyi Taw - 3 3 1 - 1 1 16 6 32 54 3 13 3
2 Kachin - 6 6 5 10 159 169 16 30 127 173 18 7 -
3 Kayar - 4 4 2 - 11 11 1 12 - 13 - 1 -
4 Kayin 9 111 120 3 1 23 24 11 19 9 39 3 5 -
5 Chin 3 10 13 2 - 7 7 2 2 4 8 - - -
6 Sagaing 15 128 143 8 - 148 148 72 87 33 192 27 52 -
7 Tanintharyi - 2 2 3 - 43 43 5 22 16 43 - 5 -
8 Bago - 93 93 5 13 30 43 19 18 13 50 2 10 4
9 Magway 5 34 39 5 - 6 6 16 12 3 31 - 1 -
10 Mandalay - 95 95 7 3 158 161 40 67 54 161 - 34 -
11 Mon - 85 85 2 1 19 20 7 7 6 20 2 3 3
12 Rakhine - 59 59 5 - 23 23 3 16 17 36 - - -
13 Yangon - 94 94 4 4 200 204 17 31 156 204 12 - -
14 Shan 5 72 77 9 1 52 53 10 39 4 53 11 11 -
15 Ayeyarwaddy - 61 61 6 2 86 88 13 21 66 100 15 33 6
Total 37 857 894 67 35 966 1001 248 389 540 1177 93 175 16

Annex “D”
Awareness-raising Activities on Violence against Women by Myanmar Women’s Affairs Federation (2008-2013)
Sr. Region/State 2008 2009 2010 2011 2012 2013
Frequency Attendants Frequency Attendants Frequency Attendants Frequency Attendants Frequency Attendants Frequency Attendants
1 Nay Pyi Taw - - - - - - - - 63 7461 211 10657
2 Kachin 131 20436 178 18714 119 16679 105 13974 124 21275 94 11938
3 Kayar 66 5380 134 9456 147 5637 114 3245 60 3857 68 4420
4 Kayin 246 36700 346 47940 372 33220 330 34330 165 30150 76 15986
5 Chin 60 4300 304 17079 369 21894 376 22005 82 3382 115 4745
6 Sagaing 1099 152388 1524 163975 1530 164374 1494 166391 894 113539 930 1193
7 Tanintharyi 216 20343 341 20382 341 20382 355 39381 234 19526 252 30240
8 Bago 133 6570 955 97010 911 104685 1025 90957 744 87635 778 93628
9 Bago(West) 114 15745 - - - - - - - - - -
10 Magway 594 121283 1236 127267 1379 160714 1573 188679 894 153086 848 153953
11 Mandalay 1325 258414 2108 309641 2028 224391 1991 291896 1182 220747 1211 226553
12 Mon 134 12587 175 18239 147 18266 196 20522 272 35303 174 24469
13 Rakhine 143 7841 230 12729 291 20925 230 15520 291 28383 291 34530
14 Yangon 284 22451 1250 74173 1256 75270 1482 80836 1065 99923 1080 102570
15 Shan(South) 89 1170 1396 118037 1674 192772 698 111331 1113 101060 997 99107
16 Shan(East) 287 22041 - - - - - - - - - -
17 Shan(North) 409 47018 - - - - - - - - - -
18 Ayeyarwaddy 863 138290 1358 164774 569 59674 1214 143983 598 69248 573 71655
Total 6193 892957 11535 1199416 11133 1118883 11183 1223050 7781 994575 7698 885644
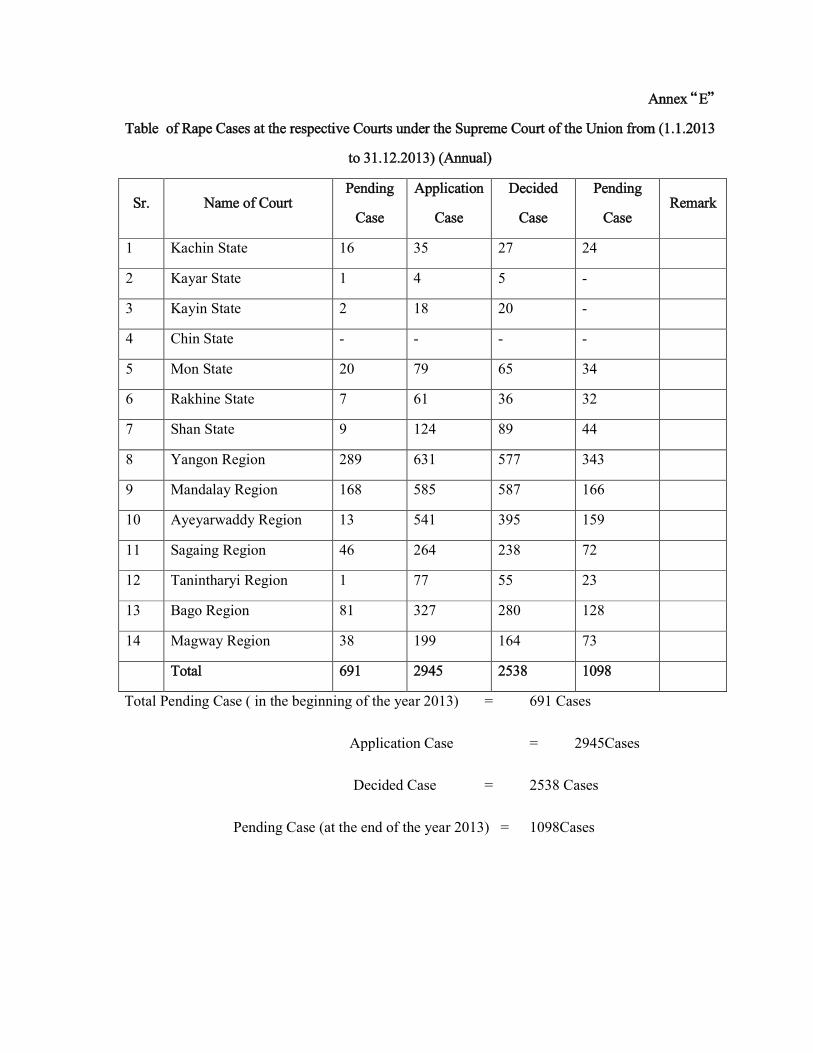
Annex “E”
Table of Rape Cases at the respective Courts under the Supreme Court of the Union from (1.1.2013
to 31.12.2013) (Annual)
Sr. Name of Court Pending
Case
Application
Case
Decided
Case
Pending
Case Remark
1 Kachin State 16 35 27 24
2 Kayar State 1 4 5 -
3 Kayin State 2 18 20 -
4 Chin State - - - -
5 Mon State 20 79 65 34
6 Rakhine State 7 61 36 32
7 Shan State 9 124 89 44
8 Yangon Region 289 631 577 343
9 Mandalay Region 168 585 587 166
10 Ayeyarwaddy Region 13 541 395 159
11 Sagaing Region 46 264 238 72
12 Tanintharyi Region 1 77 55 23
13 Bago Region 81 327 280 128
14 Magway Region 38 199 164 73
Total 691 2945 2538 1098
Total Pending Case ( in the beginning of the year 2013) = 691 Cases
Application Case = 2945Cases
Decided Case = 2538 Cases
Pending Case (at the end of the year 2013) = 1098Cases

Annex “E”-1
Table of Rape Cases at the Respective Courts under the Supreme Court of the Union from
(1.1.2014 to 31.3.2014)
Sr. Name of Court Pending
Case
Application
Case
Decided
Case
Pending
Case Remark
1 Kachin State 24 8 15 17
2 Kayar State - 2 - 2
3 Kayin State - 11 8 3
4 Chin State - - - -
5 Mon State 34 15 14 35
6 Rakhine State 32 20 21 31
7 Shan State 44 43 40 47
8 Yangon Region 343 120 119 344
9 Mandalay Region 166 90 114 142
10 Ayeyarwaddy Region 159 137 110 186
11 Sagaing Region 72 46 72 46
12 Tanintharyi Region 23 5 18 10
13 Bago Region 128 94 92 130
14 Magway Region 73 50 55 68
Total 1098 641 678 1061
Total Pending Case ( in the beginning of the year 2014) = 1098 Cases
Application Case = 641 Cases
Decided Case = 678 Cases
Pending Case (at the end of the year 2014) = 1061Cases
Annex – “F”
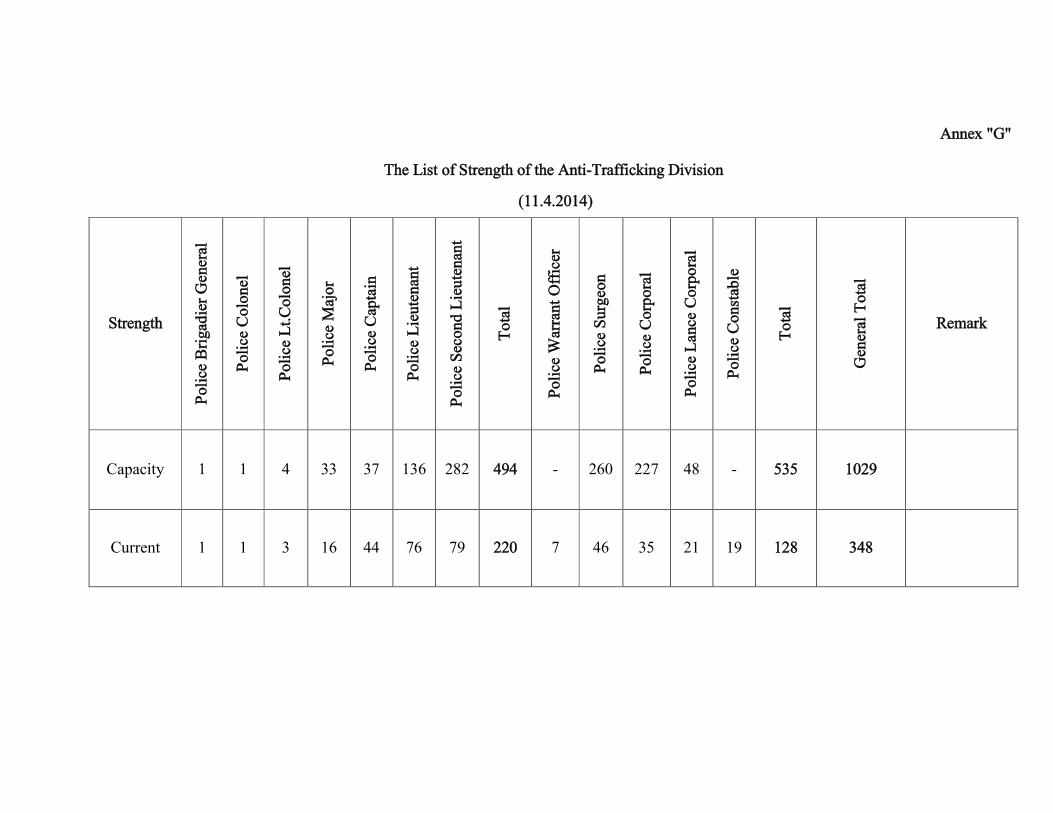
Annex "G"
The List of Strength of the Anti-Trafficking Division
(11.4.2014)
Strength
Pol
ice
Bri
gad
ier
Gen
eral
Pol
ice
Co
lon
el
Po
lice
Lt.
Co
lon
el
Po
lice
Maj
or
Po
lice
Cap
tain
Po
lice
Lie
ute
nan
t
Pol
ice
Sec
on
d L
ieu
ten
ant
To
tal
Po
lice
War
ran
t O
ffic
er
Po
lice
Su
rgeo
n
Po
lice
Co
rpo
ral
Pol
ice
Lan
ce C
orp
ora
l
Po
lice
Co
nst
able
To
tal
Gen
eral
To
tal
Remark
Capacity 1 1 4 33 37 136 282 494 - 260 227 48 - 535 1029
Current 1 1 3 16 44 76 79 220 7 46 35 21 19 128 348

Annex “H”
M F T M F T M F T M F T M F T
Th
ail
an
d
Ch
ina
Mala
ysia
Sin
gap
ore
In
do
nesia
Qu
arte
r
Am
eric
a
In
tern
al
To
tal
Sex
Wo
rk
Fo
rced
Marria
ge
Lab
or T
raffic
kin
g
Do
bt
Bo
nd
ag
e
Fo
rced
ad
op
tio
n
To
tal
2008 134 125 234 359 34 71 105 50 253 303 10 35 45 22 14 36 16 101 - - - - - 17 134 26 85 17 - 6 134
2009 155 190 274 464 59 64 123 37 265 302 13 35 48 16 66 82 14 130 - - - - - 11 155 25 104 16 - 10 155
2010 173 197 305 502 78 113 191 89 292 381 23 45 68 14 10 24 19 133 6 0 - - - 15 173 18 122 30 - 3 173
2011 136 126 225 351 55 65 120 45 220 265 6 31 37 31 57 88 23 94 - - - - - 19 136 29 89 16 1 1 136
2012 120 105 220 325 34 74 108 57 204 261 11 44 55 44 50 94 14 82 2 1 1 1 1 18 120 25 79 13 - 3 120
2013 102 81 188 269 30 56 86 81 175 256 5 30 35 7 29 36 21 59 - - - - - 22 102 24 55 20 1 2 102
Total 820 824 1446 2270 290 443 733 359 1409 1768 68 220 288 134 226 360 107 599 8 1 1 1 1 102 820 147 534 112 2 25 820
Year
No.
of
Case
Destination
San ction- A pp rov ed C ase From 20 08 to 20 13
Types of TraffickingVictimArrested Traffickers Abconders Victims(Under 18) Not being rescued

Annex “I”
Number and Percent of Employed Females in State Organization and Government Ministries 2008-2009
Sr.
No Description
No. of
Offices/
Departments
Supplying
Information
No. of Employed
No. of Employed at Deputy
Director or equal and above
posts
Female Employed at
Deputy Director or
equal and above posts
Total Female Female
percent Total Female
Female
percent
Percent of
Employed
Total
Percent
of
Employe
d Female
1. State Peace and
Development Council
1 154 95 61.69 7 2 28.57 1.30 2.11
2. State Peace and
DevelopmentCouncil,
Chairman’s Office
1 2 1 50.00 2 1 50.00 50.00 100.00
3. President’s Office 1 97 0 0.00 1 0 0.00 0.00 0.00
4. Office of the
PyithuHluttaw
1 82 43 52.44 8 3 37.50 3.66 6.98
5. Civil Services Selection
and Training Board
5 1507 784 52.02 36 10 27.78 0.66 1.28
6. Multi-Party
Democracy General
Election Commission
1 43 19 44.19 2 0 0.00 0.00 0.00
7. Supreme Court
(Yangon)
1 5344 2324 43.49 164 78 47.56 1.46 3.36
8. Supreme Court
(Mandalay)
1 143 78 54.55 15 6 40.00 4.20 7.69
9. Attorney General’s
Office
1 2392 1034 43.23 141 42 29.79 1.76 4.06
10. Auditor General’s
Office
1 6160 4564 74.09 70 40 57.14 0.65 0.88
11. Yangon City
Development
Committee
1 7569 3297 43.56 151 22 14.57 0.29 0.67
12. Mandalay City
Development
Committee
1 2130 930 43.66 14 1 7.14 0.05 0.11
13. Naypyitaw City
Development
Committee
1 737 260 35,28 41 3 7.32 0.41 1.15
14. The Government’s
Office
1 102 40 39.22 8 1 12.50 0.98 2.50

Annex " I " –1
Number and Percent of Employed Females in State Organization and Government Ministries 2008-2009
Sr.
No Description
No. of
Offices/
Departments
Supplying
Information
No. of Employed
No. of Employed at Deputy
Director or equal and above
posts
Female Employed at
Deputy Director or equal
and above posts
Total Female Female
percent Total Female
Female
percent
Percent of
Employed
Total
Percent of
Employed
Female
15. Ministry of Foreign
Affairs
9 758 325 42.88 134 23 17.16 3.03 7.08
16. Ministry of Home
Affairs
5 95981 13862 14.44 256 3 1.17 0.00 0.02
17. Ministry of Progress
of Border Areas and
National Races and
Development
Affairs
4 11415 4397 38.52 226 36 15.93 0.32 0.82
18 Ministry of
Religious Affairs
4 1503 685 45.58 51 2 3.92 0.13 0.29
19. Ministry of Social
Welfare, Relief and
Resettlement
4 4421 1688 38.18 39 4 10.26 0.09 0.24
20. Ministry of
Information
6 7403 3439 46.45 70 3 4.29 0.04 0.09
21. Ministry of Culture 4 2085 1167 55.97 74 17 22.97 0.82 1.46
22. Ministryof
Education
11 336567 257345 76.46 1800 1254 69.67 0.37 0.49
23. Ministry of Health 8 58107 37184 63.99 819 403 49.21 0.69 1.08
24. Ministry of Labour 6 3086 1961 63.55 33 10 30.30 0.32 0.51
25. Ministry of Forestry 6 34830 7066 20.29 189 13 6.88 0.04 0.18
26. Ministry of
Agriculture and
Irrigation
16 67768 24478 36.12 467 75 16.06 0.11 0.07
27. Ministry of
Livestock and
Fisheries
7 5385 2180 40.48 86 13 15.12 0.24 0.69
28. Ministry of Mines 8 7182 2424 33.75 120 7 5.83 0.10 0.29
29. Ministry of Industry
(1)
9 42889 25118 58.57 691 192 27.79 0.45 0.76

Annex" I "-2
Number and Percent of Employed Females in State Organization and Government Ministries 2008-2009
Sr.
No Description
No. of Offices/
Departments
Supplying
Information
No. of Employed No. of Employed at Deputy Director
or equal and above posts
Female Employed at Deputy
Director or equal and above
posts
Total Female Female
percent Total Female
Female
percent
Percent of
Employed
Total
Percent of
Employed
Female
30. Ministry of Industry (2) 7 8387 3856 45.98 160 46 28.75 0.55 1.19
31. Ministry of Energy 5 23106 3098 13.421 175 26 14.86 0.11 0.84
32. Ministry of Construction 3 13228 4266 32.25 101 16 15.84 0.`12 0.38
33. Ministry of Transport 13 17153 3418 19.93 367 19 5.18 0.11 0.56
34. Ministry of Rail
Transportation
6 28421 3335 11.73 120 13 10.83 0.05 0.39
35. Ministry of
Communications, Posts
and Telegraphs
3 13087 5507 42.08 45 6 13.33 0.05 0.11
36. Ministry of Commerce 4 3966 1245 31.39 106 14 13.21 0.35 1.12
37. Ministry of
Co-operatives
4 6930 3760 54.26 73 13 17.81 0.19 0.35
38. Ministry of Hotels and
Tourism
3 1542 765 49.61 55 4 7.27 0.26 0.52
39. Ministry of Finance
and Revenue
12 19079 10443 54.74 170 47 27.65 0.25 0.45
40. Ministry of National
Planning and Economic
Development
8 3173 2044 64.42 125 60 48.00 1.89 2.94
41. Ministry of Immigration
and Population
3 6609 2460 37.22 71 5 7.04 0.08 0.20
42. Ministry of Science and
Technology
16 11356 7726 68.03 412 35 8.50 0.31 0.45
43. Ministry of Electric
Power(1)
4 4943 1446 29.25 65 10 15.38 0.20 0.69
44. Ministry of Electric
Power(2)
5 14229 3131 22.00 217 28 12.90 0.20 0.89
45. Ministry of Sports 2 2164 902 41.68 36 0 0 0 0
Grand Total 223 883215 454190 51.42 8013 2606 32.52 0.30 0.57
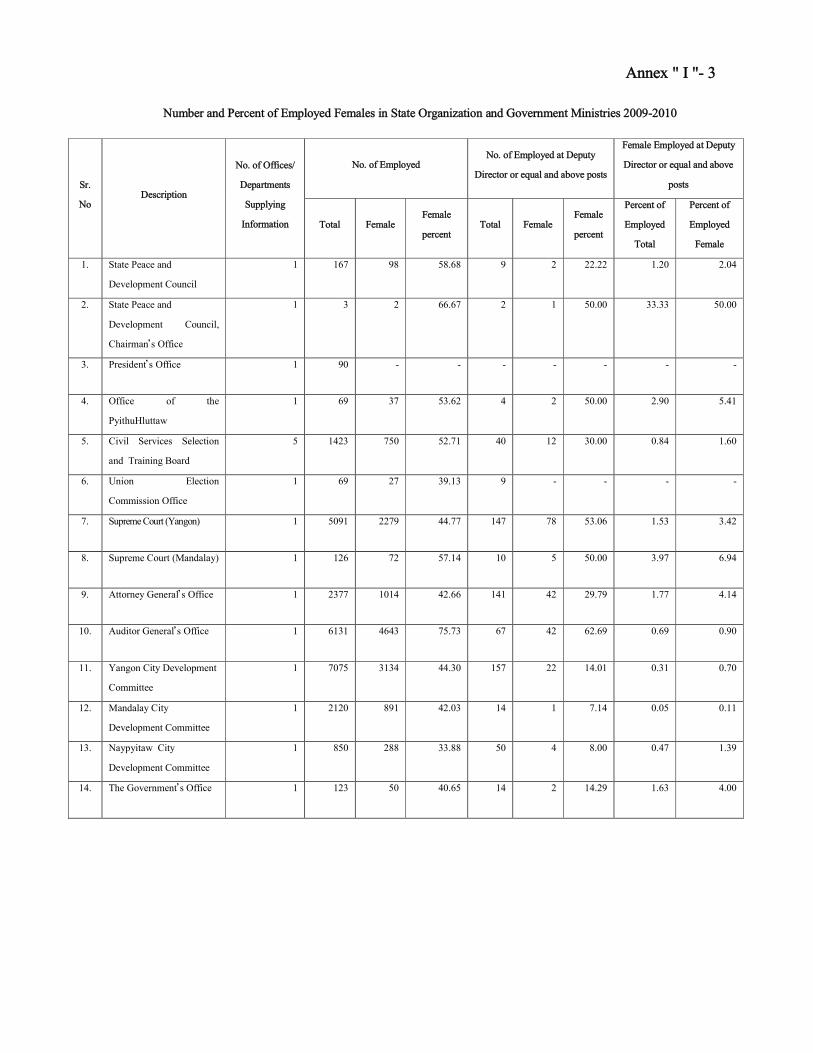
Annex " I "- 3
Number and Percent of Employed Females in State Organization and Government Ministries 2009-2010
Sr.
No Description
No. of Offices/
Departments
Supplying
Information
No. of Employed No. of Employed at Deputy
Director or equal and above posts
Female Employed at Deputy
Director or equal and above
posts
Total Female Female
percent Total Female
Female
percent
Percent of
Employed
Total
Percent of
Employed
Female
1. State Peace and
Development Council
1 167 98 58.68 9 2 22.22 1.20 2.04
2. State Peace and
Development Council,
Chairman’s Office
1 3 2 66.67 2 1 50.00 33.33 50.00
3. President’s Office 1 90 - - - - - - -
4. Office of the
PyithuHluttaw
1 69 37 53.62 4 2 50.00 2.90 5.41
5. Civil Services Selection
and Training Board
5 1423 750 52.71 40 12 30.00 0.84 1.60
6. Union Election
Commission Office
1 69 27 39.13 9 - - - -
7. Supreme Court (Yangon) 1 5091 2279 44.77 147 78 53.06 1.53 3.42
8. Supreme Court (Mandalay) 1 126 72 57.14 10 5 50.00 3.97 6.94
9. Attorney General’s Office 1 2377 1014 42.66 141 42 29.79 1.77 4.14
10. Auditor General’s Office 1 6131 4643 75.73 67 42 62.69 0.69 0.90
11. Yangon City Development
Committee
1 7075 3134 44.30 157 22 14.01 0.31 0.70
12. Mandalay City
Development Committee
1 2120 891 42.03 14 1 7.14 0.05 0.11
13. Naypyitaw City
Development Committee
1 850 288 33.88 50 4 8.00 0.47 1.39
14. The Government’s Office 1 123 50 40.65 14 2 14.29 1.63 4.00

Annex " I "- 4
Number and Percent of Employed Females in State Organization and Government Ministries 2009-2010
Sr.
No Description
No. of
Offices/
Departments
Supplying
Information
No. of Employed No. of Employed at Deputy
Director or equal and above posts
Female Employed at Deputy
Director or equal and above
posts
Total Female Female
percent Total Female
Female
percent
Percent of
Employed
Total
Percent of
Employed
Female
15. Ministry of Foreign
Affairs
9 782 320 40.92 146 25 17.12 3.20 7.81
16. Ministry of Home
Affairs
5 97700 13856 14.18 284 4 1.41 0.00 0.03
17. Ministry of Progress of
Border Areas and
National Races and
Development Affairs
4 11016 4358 93.56 224 42 18.75 0.38 0.96
18 Ministry of Religious
Affairs
4 1484 695 46.83 58 3 5.17 0.20 0.43
19. Ministry of Social
Welfare, Relief and
Resettlement
4 4521 1733 38.33 56 6 10.71 0.13 0.35
20. Ministry of Information 6 7314 3537 48.36 70 5 7.14 0.007 0.14
21. Ministry of Culture 4 2002 1129 56.39 100 33 33.00 1.65 2.92
22. Ministry of Education 11 330232 253700 76.82 1789 1269 70.93 0.38 0.50
23. Ministry of Health 8 58243 34882 59.89 832 384 46.15 0.66 1.10
24. Ministry of Labour 6 3036 1989 65.51 29 8 27.59 0.26 0.40
25. Ministry of Forestry 6 34432 6494 18.86 192 17 8.85 0.05 0.26
26. Ministry of Agriculture
and Irrigation
18 64980 23848 36.70 482 87 18.05 0.13 0.36
27. Ministry of Livestock
and Fisheries
7 5175 2136 41.28 91 16 17.58 0.31 0.75
28. Ministry of Mines 9 4210 1346 31.97 123 7 5.69 0.17 0.52
29. Ministry of Industry (1) 10 40776 24718 60.62 636 171 76.89 0.42 0.69
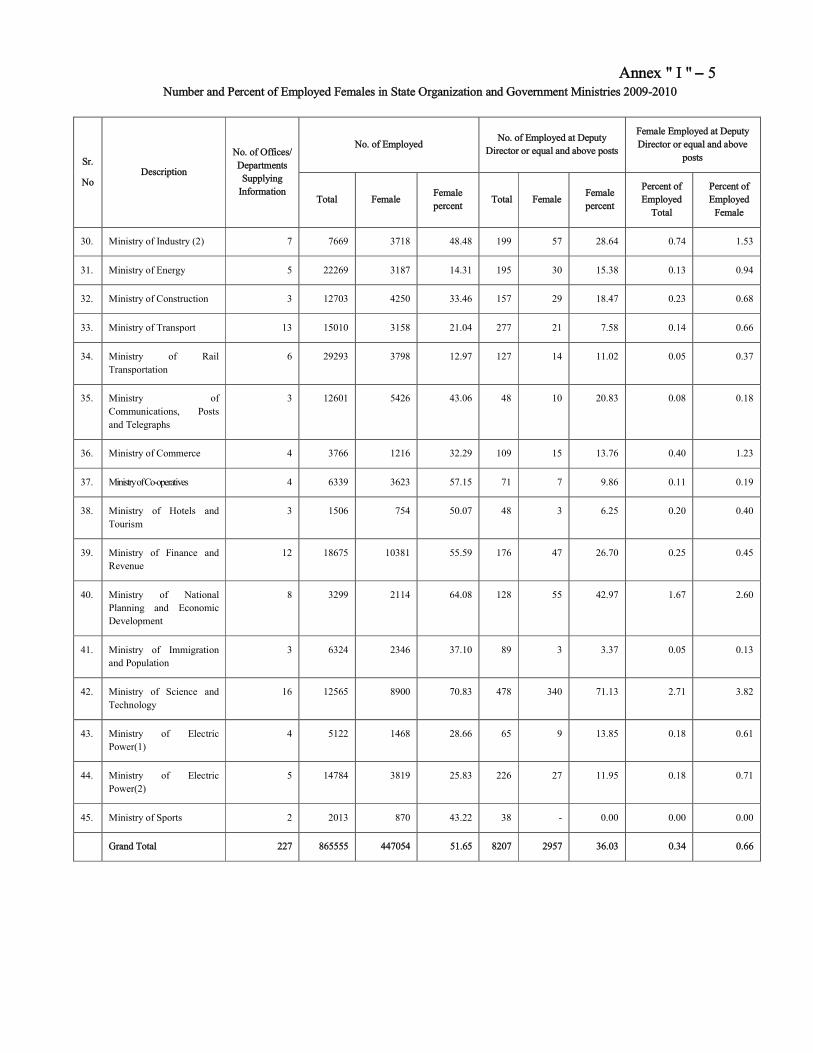
Annex " I " – 5 Number and Percent of Employed Females in State Organization and Government Ministries 2009-2010
Sr.
No Description
No. of Offices/
Departments
Supplying
Information
No. of Employed No. of Employed at Deputy
Director or equal and above posts
Female Employed at Deputy
Director or equal and above
posts
Total Female Female
percent Total Female
Female
percent
Percent of
Employed
Total
Percent of
Employed
Female
30. Ministry of Industry (2) 7 7669 3718 48.48 199 57 28.64 0.74 1.53
31. Ministry of Energy 5 22269 3187 14.31 195 30 15.38 0.13 0.94
32. Ministry of Construction 3 12703 4250 33.46 157 29 18.47 0.23 0.68
33. Ministry of Transport 13 15010 3158 21.04 277 21 7.58 0.14 0.66
34. Ministry of Rail
Transportation
6 29293 3798 12.97 127 14 11.02 0.05 0.37
35. Ministry of
Communications, Posts
and Telegraphs
3 12601 5426 43.06 48 10 20.83 0.08 0.18
36. Ministry of Commerce 4 3766 1216 32.29 109 15 13.76 0.40 1.23
37. Ministry of Co-operatives 4 6339 3623 57.15 71 7 9.86 0.11 0.19
38. Ministry of Hotels and
Tourism
3 1506 754 50.07 48 3 6.25 0.20 0.40
39. Ministry of Finance and
Revenue
12 18675 10381 55.59 176 47 26.70 0.25 0.45
40. Ministry of National
Planning and Economic
Development
8 3299 2114 64.08 128 55 42.97 1.67 2.60
41. Ministry of Immigration
and Population
3 6324 2346 37.10 89 3 3.37 0.05 0.13
42. Ministry of Science and
Technology
16 12565 8900 70.83 478 340 71.13 2.71 3.82
43. Ministry of Electric
Power(1)
4 5122 1468 28.66 65 9 13.85 0.18 0.61
44. Ministry of Electric
Power(2)
5 14784 3819 25.83 226 27 11.95 0.18 0.71
45. Ministry of Sports 2 2013 870 43.22 38 - 0.00 0.00 0.00
Grand Total 227 865555 447054 51.65 8207 2957 36.03 0.34 0.66

Annex " I "-6
Number and Percent of Employed Females in State Organization and Government Ministries 2010-2011
Sr.
No Description
No. of Offices/
Departments
Supplying
Information
No. of Employed
No. of Employed at Deputy
Director or equal and above
posts
Female Employed at
Deputy Director or equal
and above posts
Total Female Female
percent Total Female
Female
percent
Percent of
Employed
Total
Percent of
Employed
Female
1. The President Office 1 349 187 53.58 36 6 16.67 1.72 3.21
2. Hluttaw Office 1 391 259 66.24 22 5 22.73 1.28 1.93
3. Union Civil Services Board 5 1427 760 53.26 42 13 30.95 0.91 1.71
4. Union Election Commission
Office
1 79 31 39.24 9 - - - -
5. Supreme Court of the Union 1 4960 2244 45.24 96 62 64.58 1.25 2.76
6. Union Attorney General’s
Office
1 2299 1082 47.06 155 65 41.94 2.83 6.01
7. Office of the Auditor
General of the Union
1 6328 4867 76.91 76 55 72.37 0.87 1.13
8. Yangon City Development
Committee
1 6935 3099 44.69 174 28 16.09 0.40 0.90
9. Mandalay City
Development Committee
1 2164 967 44.69 15 2 13.33 0.09 0.21
10. Naypyitaw City
Development Committee
1 1183 396 33.47 74 5 6.76 0.42 1.26
11. Union Government’s Office 1 148 66 44.59 17 3 17.65 2.03 4.55
12. Ministry of Foreign Affairs 9 806 341 42.31 101 22 21.78 2.73 6.45
13. Ministry of Home Affairs 5 101529 13922 13.71 337 8 2.37 0.01 0.06
14. Ministry of Border Affairs 4 10984 4378 39.86 214 42 19.63 0.38 0.96
15. Ministry of Religious
Affairs
4 1537 727 47.30 55 3 5.45 0.20 0.41

Annex " I " –7
Number and Percent of Employed Females in State Organization and Government Ministries 2010-2011
Sr.
No Description
No. of Offices/
Departments
Supplying
Information
No. of Employed No. of Employed at Deputy Director
or equal and above posts
Female Employed at
Deputy Director or
equal and above posts
Total Female Female
percent Total Female
Female
percent
Percent of
Employed
Total
Percent
of
Employe
d Female
16. Ministry of Social
Welfare, Relief and
Resettlement
4 4795 1813 37.81 57 7 12.28 0.15 0.39
17. Ministry of Information 6 7188 3519 48.96 67 5 7.46 0.07 0.14
18. Ministry of Culture 4 1968 1110 56.40 97 33 34.02 1.68 2.97
19. Ministry of Education 11 343074 264318 77.04 1698 1209 71.20 0.35 0.46
20. Ministry of Health 8 59021 34369 58.23 807 369 45.72 0.63 1.07
21. Ministry of Labour 6 3003 1960 65.27 33 10 30.30 0.33 0.51
22. Ministry of Forestry 6 33033 6612 20.02 195 17 8.72 0.05 0.26
23. Ministry of Agriculture
and Irrigation
18 63777 23596 37.00 452 82 18.14 0.13 0.35
24. Ministry of Livestock
and Fisheries
7 5058 2112 41.76 91 18 19.78 0.36 0.85
25. Ministry of Mines 9 3417 1226 35.88 125 8 6.4 0.23 0.65
26. Ministry of Industry (1) 10 39009 23994 61.51 623 180 28.89 0.46 0.75
27. Ministry of Industry (2) 4 7866 3943 50.13 204 65 31.86 0.83 1.65
28. Ministry of Energy 5 20699 3098 14.97 203 28 13.79 0.14 0.90
29. Ministry of
Construction
3 12348 4694 38.01 177 32 18.08 0.26 0.68
30. Ministry of Transport 12 13888 3027 21.80 283 19 6.71 0.14 0.63
31. Ministry of Rail
Transportation
6 28859 3748 12.99 122 16 13.11 0.06 0.43
32. MinistryofCommu-
nications, Posts and
Telegraphs
3 12421 5441 43.80 48 11 22.92 0.09 0.20

Annex " I " –8
Number and Percent of Employed Females in State Organization and Government Ministries 2010-2011
Sr.
No Description
No. of Offices/
Departments
Supplying
Information
No. of Employed No. of Employed at Deputy Director
or equal and above posts
Female Employed at
Deputy Director or
equal and above posts
Total Female Female
percent Total Female
Female
percent
Percent of
Employed
Total
Percent
of
Employ
ed
Female
33. Ministry of Commerce 4 3379 1170 34.63 108 15 13.89 0.44 1.28
34. Ministry of
Co-operatives
4 6381 3745 58.69 74 21 28.38 0.33 0.56
35. Ministry of Hotels and
Tourism
3 1491 759 50.91 41 2 4.88 0.13 0.26
36. Ministryof Finance and
Revenue
12 18548 10490 56.56 189 57 30.16 0.31 0.54
37. Ministry of National
Planning and Economic
Development
8 3360 2146 63.87 126 59 46.83 1.76 2.75
38. Ministry of Immigration
and Population
3 6284 2328 37.05 93 4 4.30 0.06 0.17
39. Ministry of Science and
Technology
8 13919 10312 74.09 644 420 65.22 3.02 4.09
40. Ministry of Electric
Power(1)
4 5408 1535 28.38 68 8 11.76 0.15 0.52
41. Ministry of Electric
Power(2)
5 15744 4226 26.84 218 25 11.47 0.16 0.59
42. Ministry of Sports 2 1999 867 43.37 38 1 2.63 0.05 0.12
Grand Total 211 877056 459484 52.39 8304 3040 36.61 0.35 0.66
Source: Statistical Profile of Children and Women in Myanmar (2009) published by Central Statistical
Organization.

Annex “J”
Maternal Mortality Rate (Per 100000 live births)
(1990 to 2010)
Maternal Mortality Ratio in Myanmar
Source: UN interagency estimate, 2010
520
380
300
230 200
130
0
100
200
300
400
500
600
1990 1995 2000 2005 2010 2015
Per
100,0
00lb
31
11.39.9
4.25.6
8.5
4.2
7
1.4 16.9
Causes of Maternal Death postnatal haemorrhage
Pregnancy induced hypertension
Abortion
tructed labor
Hypertension
uterine rupture
Pre-natal hoemorrhage
Infection
Athrosclerosis
Non-direct cause

Annex “J”-1

Annex “K”
Micro-credit Business implemented by Myanmar Women’s Affairs Federation (From 2008 to 2013)
Sr
No
Regions/S
tates
2008 2009 2010 2011 2012 2013 Total
No of
Persons Loan(Kyat)
No of
Persons Loan(Kyat)
No of
Persons
Loan
(Kyat)
No of
Persons Loan(Kyat)
No of
Persons
Loan
(Kyat)
No of
Persons
Loan
(Kyat)
No of
Perso
ns
Loan(Kyat)
1 Kachin 80 7200000 105 9390000 146 12048500 158 14200000 170 16100000 170 17000000 990 75938500
2 Kayar 123 8250000 248 1180000 268 1440000 287 20100000 206 15650000 206 18600000 1358 65220000
3 Kayin 359 7300000 681 8900000 290 13000000 128 12000000 130 12720000 135 13520000 2403 67440000
4 Chin 106 6600000 158 8650000 26 1300000 184 8000000 230 12000000 250 12700000 1084 49250000
5 Sagaing 293 1858000 191 18610000 248 18230000 219 18500000 460 18500000 420 17500000 2150 93198000
6 Taninthar
yi
120 6000000 140 7000000 140 7000000 160 8000000 268 13400000 285 14250000 1353 55650000
7 Bago 447 18600000 470 23000000 40 2000000 199 15600000 231 28200000 131 10000000 2530 97400000
8 Magway 562 7650000 873 10210000 760 16050000 1289 12800000 128 13568000 135 14380000 4471 74658000
9 Mandalay 285 3360348 589 7448862.30 121 2558586.56 289 22200000 186 14500000 185 15370000 1999 65437796.8
6
10 Mon 164 7000000 214 7000000 151 8000000 105 5600000 112 10600000 137 12600000 1033 50800000
11 Rakhine 190 6960000 230 9084000 153 10740000 179 11296000 169 12062800 177 12786556 2538 62929356
12 Yangon 908 7000000 208 3000000 20 1000000 376 18800000 756 19440650 431 21550000 3049 70790650
13 Shan 1153 24551200 1624 21948000 1423 39400000 372 30700000 407 34000000 422 34500000 6628 185099200
14 Ayeyarwa
ddy
312 9594000 596 10964000 1620 20180000 506 26060000 520 26060000 525 27630000 4829 120488000
15 Nay Pyi
Taw
- - - - - - - 65 4000000 64 4240000 129 8240000
Total 5102 121923548 6327 146384862.30 5406 152947086.56 4451 223856000 4038 250801450 3673 246626556 36544 1142539502.86

Annex “K”-1
Income-generating programmes provided by Myanmar Women's Affairs Federation
(From 2008 to 2013)
Sr.
Nay Pyi Taw
and States/
Regions
2009 2009 2010 2011 2012 2013 Total
Number
of
Persons
Amount
Number
of
Persons
Amount
Number
of
Persons
Amount Number
of Persons Amount
Number
of Persons Amount
Number
of Persons Amount
Number of
Persons Amount
1 Nay Pyi Taw - - - - - - - - - 210000 - - 210000
2 Ka Chin 65 2800000 75 3780000 99 5370000 115 230000 215 12160000 221 11550000 790 35890000
3 Kayar 170 6667000 244 13201400 - - - - - - - - 414 19868400
4 Kayin 431 12304800 735 15663800 543 14000000 320 340000000 145 12720000 135 13520000 2309 408208600
5 Chin 85 4688000 97 4575000 117 2955000 117 2955000 67 3350000 80 3400000 563 21923000
6 Sagain 778 16334800 771 12295000 841 14040000 1088 16585000 1179 19320000 1267 19495000 5924 98069800
7 Tanintharyi 155 5195000 272 8800000 434 21664400 59 3790000 34 3400000 16 1600000 970 44449400
8 Bago 57 1239000 61 4229500 76 5070000 170 12960000 124 11300000 113 8170000 601 42968500
9 Magway 652 6000000 853 7000000 189 8000000 445 33600000 128 1356800 135 14380000 1402 70336800
10 Madalay 171 4590000 145 2615000 58 1740000 47 1375000 40 1050000 48 1275000 509 12645000
11 Mon 85 8500000 115 9760000 16 550000 51 1770000 17 590000 15 800000 299 21970000
12 Rakhine 20 6000000 200 7000000 153 10700000 507 33292000 169 12062800 177 12786556 1226 81841356
13 Yangon 1435 14945000 85 910000 115 1150000 280 2900000 17 850000 19 1450000 1951 22205000
14 Shan 167 2049500 49 3215000 87 6190000 123 3800000 89 4477500 83 3277500 598 23009800
15 Ayeyarwaddy 384 6460000 283 7133000 168 3030000 134 2930000 33 570000 33 570000 1035 20693000
Total 4655 97773100 3985 100177700 2896 94459400 3456 456187000 2257 83207100 2342 92484056 19591 924288356
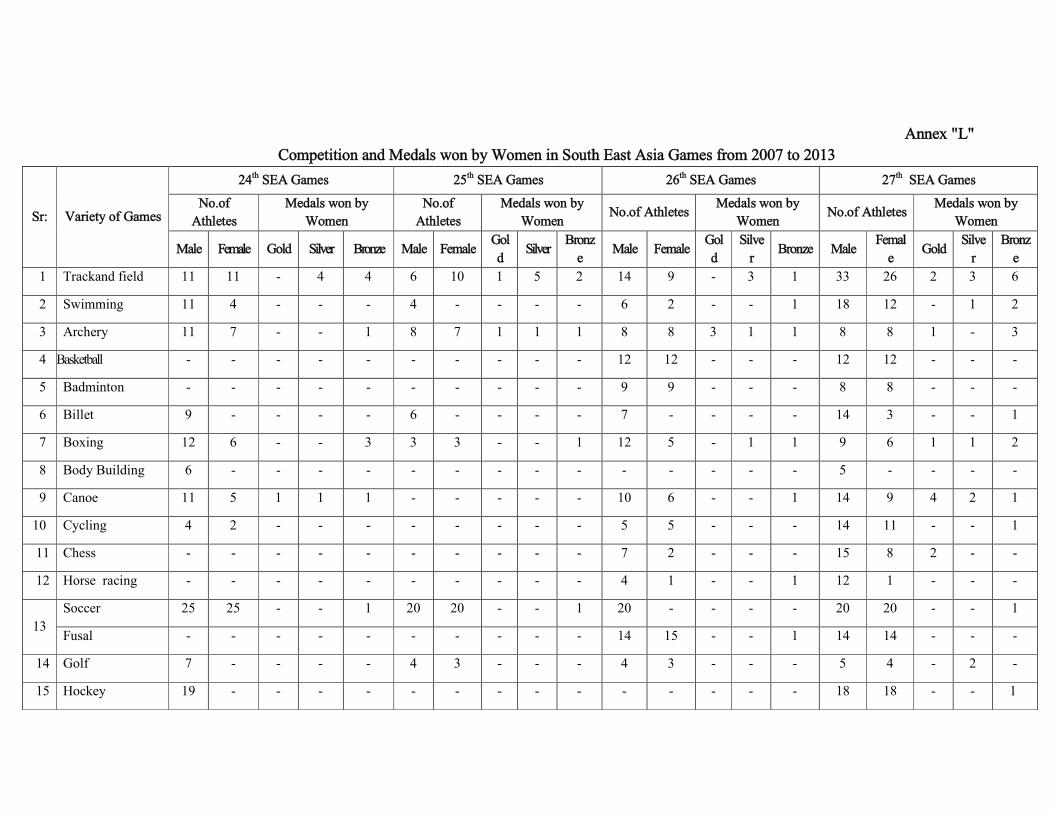
Annex "L"
Competition and Medals won by Women in South East Asia Games from 2007 to 2013
Sr: Variety of Games
24th SEA Games 25th SEA Games 26th SEA Games 27th SEA Games
No.of
Athletes
Medals won by
Women
No.of
Athletes
Medals won by
Women No.of Athletes
Medals won by
Women No.of Athletes
Medals won by
Women
Male Female Gold Silver Bronze Male Female Gol
d Silver
Bronz
e Male Female
Gol
d
Silve
r Bronze Male
Femal
e Gold
Silve
r
Bronz
e
1 Trackand field 11 11 - 4 4 6 10 1 5 2 14 9 - 3 1 33 26 2 3 6
2 Swimming 11 4 - - - 4 - - - - 6 2 - - 1 18 12 - 1 2
3 Archery 11 7 - - 1 8 7 1 1 1 8 8 3 1 1 8 8 1 - 3
4 Basketball - - - - - - - - - - 12 12 - - - 12 12 - - -
5 Badminton - - - - - - - - - - 9 9 - - - 8 8 - - -
6 Billet 9 - - - - 6 - - - - 7 - - - - 14 3 - - 1
7 Boxing 12 6 - - 3 3 3 - - 1 12 5 - 1 1 9 6 1 1 2
8 Body Building 6 - - - - - - - - - - - - - - 5 - - - -
9 Canoe 11 5 1 1 1 - - - - - 10 6 - - 1 14 9 4 2 1
10 Cycling 4 2 - - - - - - - - 5 5 - - - 14 11 - - 1
11 Chess - - - - - - - - - - 7 2 - - - 15 8 2 - -
12 Horse racing - - - - - - - - - - 4 1 - - 1 12 1 - - -
13
Soccer 25 25 - - 1 20 20 - - 1 20 - - - - 20 20 - - 1
Fusal - - - - - - - - - - 14 15 - - 1 14 14 - - -
14 Golf 7 - - - - 4 3 - - - 4 3 - - - 5 4 - 2 -
15 Hockey 19 - - - - - - - - - - - - - - 18 18 - - 1
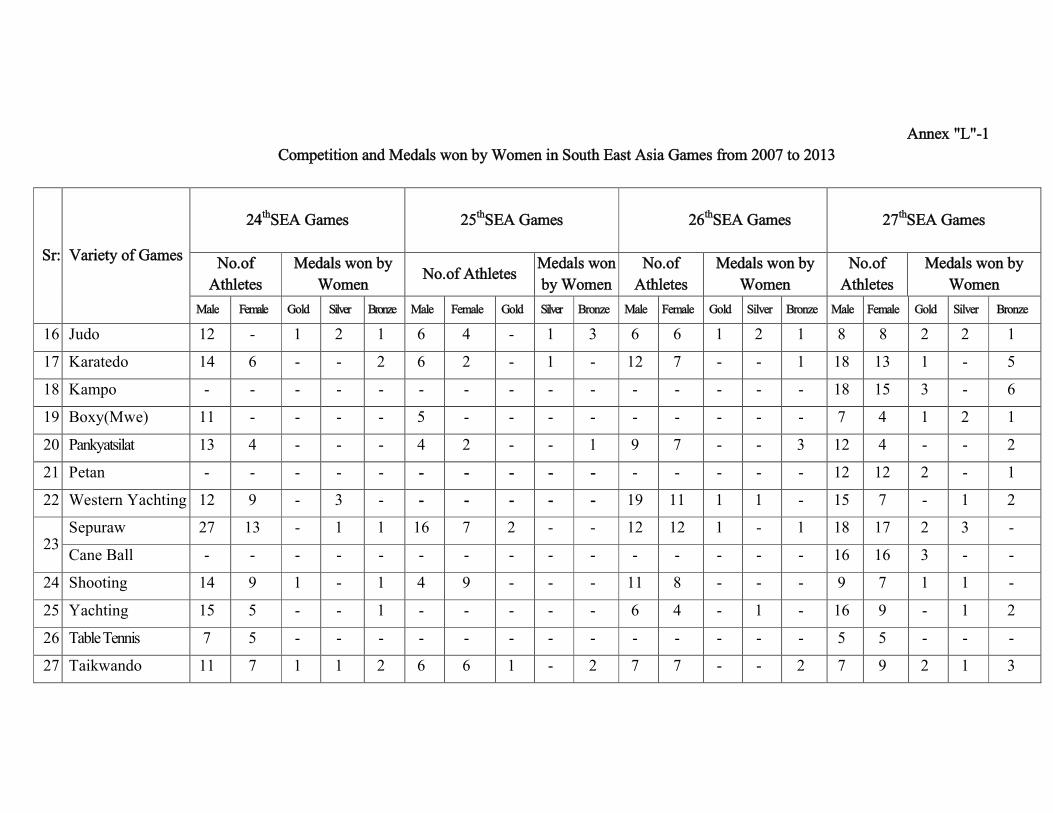
Annex "L"-1
Competition and Medals won by Women in South East Asia Games from 2007 to 2013
Sr: Variety of Games
24thSEA Games 25thSEA Games
26thSEA Games
27thSEA Games
No.of
Athletes
Medals won by
Women No.of Athletes
Medals won
by Women
No.of
Athletes
Medals won by
Women
No.of
Athletes
Medals won by
Women
Male Female Gold Silver Bronze Male Female Gold Silver Bronze Male Female Gold Silver Bronze Male Female Gold Silver Bronze
16 Judo 12 - 1 2 1 6 4 - 1 3 6 6 1 2 1 8 8 2 2 1
17 Karatedo 14 6 - - 2 6 2 - 1 - 12 7 - - 1 18 13 1 - 5
18 Kampo - - - - - - - - - - - - - - - 18 15 3 - 6
19 Boxy(Mwe) 11 - - - - 5 - - - - - - - - - 7 4 1 2 1
20 Pankyatsilat 13 4 - - - 4 2 - - 1 9 7 - - 3 12 4 - - 2
21 Petan - - - - - - - - - - - - - - - 12 12 2 - 1
22 Western Yachting 12 9 - 3 - - - - - - 19 11 1 1 - 15 7 - 1 2
23 Sepuraw 27 13 - 1 1 16 7 2 - - 12 12 1 - 1 18 17 2 3 -
Cane Ball - - - - - - - - - - - - - - - 16 16 3 - -
24 Shooting 14 9 1 - 1 4 9 - - - 11 8 - - - 9 7 1 1 -
25 Yachting 15 5 - - 1 - - - - - 6 4 - 1 - 16 9 - 1 2
26 Table Tennis 7 5 - - - - - - - - - - - - - 5 5 - - -
27 Taikwando 11 7 1 1 2 6 6 1 - 2 7 7 - - 2 7 9 2 1 3

Annex "L"-2
Competition and Medals won by Women in South East Asia Games from 2007 to 2013
Sr: Variety of
Games
24thSEA Games 25thSEA Games 26thSEA Games 27thSEA Games
No .of
Athletes
Medals won by
Women
No. of
Athletes
Medals won by
Women
No .of
Athletes
Medals won by
Women
No. of
Athletes
Medals won by
Women
Male Female Gold Silver Bronze Male Female Gold Silver Bronze Male Female Gold Silver Bronze Male Female Gold Silver Bronze
28 Traditional
Rowing
14 14 1 - - - - - - - 26 21 6 - - 26 26 10 - 1
29 Volley Ball 16 - - - - 12 - - - - 12 12 - - - 12 12 - - -
30 Bobinam - - - - - - - - - - - - - - - 21 12 4 1 3
31 Weight Lift - - - - - 3 4 1 - 3 6 5 - - - 6 6 1 1 -
32 Wrestliy - - - - - - - - - - 5 - - - - 11 4 1 - 3
33 Wushu 12 5 - 1 1 7 5 - 2 2 8 5 - 2 1 12 7 - 3 2
34 Baseball 18 - - - - - - - - - - - - - - - - - - -
35 Gymnastic 3 1 - - - - - - - - 3 4 - - - - - - - -
36 Tennis 6 4 - - - - - - - - 4 4 - - - - - - - -
Total 326 137 5 13 19 120 82 6 10 16 278 190 12 11 16 468 354 43 25 50

Annex "L" -3
Competition and Medals won by women in ASEAN Para Games
Sr: Variety of
Games
4th Para Games 5th Para Games 6th Para Games 7th Para Games
No.of
Athletes
Medals won by
Women
No.of
Athletes
Medals won
by Women
No.of
Athletes
Medals won by
Women
No.of
Athletes
Medals won by
Women
Male Female Gold Silver Bronze Male Female Gold Silver Bronze Male Female Gold Silver Bronze Male Female Gold Silver Bronze
21 10 23 13 27 11 161 55
1 Track and
Field
1 4 4 3 5 - 3 5 5
2 Swimming - 2 4 1 2 - - - 1 4 3 5
3 Chees 13 5 -

Annex "M"
(A)The Situatin of estimated and finished construction of rural roads and bridges
Sr: Year
Estimation Finished
Road Bridge Expense Road Bridge Expense
(mile) (foot) (million) (mile) (foot) (million)
1 2011-2012 to 9660 159157 345197.4
2015-2016
2 2011-2012 867 11346 9832.978 867 11346 9832.978
3 2012-2013 1069 13849 45671.842 1069 13849 45671.842
4 2013-2014 2705 43063 94640.338 2705 43063 94640.338
Total (3) Years 4641 68258 150145.158 4641 68258 150145.158
48% 43% 43.5%
Remark: The rural roads include tarred roads, stone-roads and earth roads. The bridges
are built with concrete, wood and drain-pipes. Some construction tasks are being
implemented in 2013-2014.
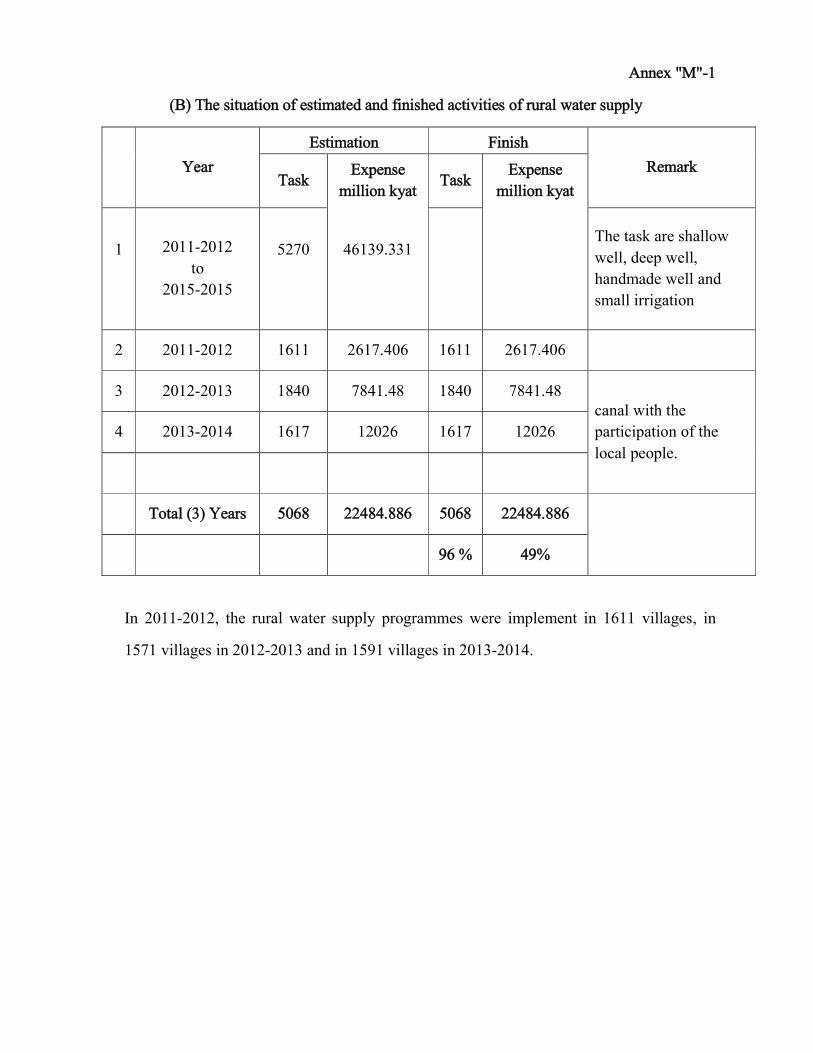
Annex "M"-1
(B) The situation of estimated and finished activities of rural water supply
Year
Estimation Finish
Remark Task
Expense
million kyat Task
Expense
million kyat
1
2011-2012
to
2015-2015
5270
46139.331
The task are shallow
well, deep well,
handmade well and
small irrigation
2 2011-2012 1611 2617.406 1611 2617.406
3 2012-2013 1840 7841.48 1840 7841.48 canal with the
participation of the
local people.
4 2013-2014 1617 12026 1617 12026
Total (3) Years 5068 22484.886 5068 22484.886
96 % 49%
In 2011-2012, the rural water supply programmes were implement in 1611 villages, in
1571 villages in 2012-2013 and in 1591 villages in 2013-2014.

Annex "M"-2
(C) Income-generating activities and livelihood support
Sr: Year Activities Time and Trainees
Estimated
Budget
(million
ks)
Spent
Budget
(million
ks)
Remark
1
2012-
2013
1.Traditional foods
Cooking training
2 times of 2 week
course/20 trainees 10.0
10.0
Bago Region
2.Traditional foods
Cooking training
4 times of 5 day
course/220 trainees 10.0
10.0
Ayeyarwaddy
Region
3.Livestock breeding
and treatment training
2 times of 3 week
course/100 trainees 6.0
6.0
Bago Region
4.Livestock breeding
and treatment training
2 times of 5 day 6.0 6.0 Ayeyarwaddy
course/240 trainees Region
5.Technical production
Training (eg.food stuffs,
commodity,toilet goods,
bamboo hand crafts)
4 times of 15 day
course/120 trainees
10.409
10.409
Bago Region
6.Technical Production
training (eg.pickled,
fish, pickled prawn,
Dried fish.
2 times of 7 day
course
15.00
15.00
Ayeyarwaddy
Region

Annex “M”-3
Sr: Year Activities Time and Trainees
Estimated
Budget
(million ks)
Spent
Budget
(million
ks)
Remark
7.Agricultrual Training
(natural fertilizer
production training)
2 times of 7 day
course/420 trainees
from 2 villages
16.00
16.00
Bago Region
8. Agricultural Training
(applied soil, seeds,
prevention of agricultural
products, natural
fertilizer production)
3 times of 1 day
course/300 trainees
6.00
6.00
Ayeyarwaddy
Region
9.Carpentry, masonry,
iron-rim trainings
-Making latrine used
concrete-rim
30 day course for
2 villages/
120 trainees
29.591
29.591
Bago Region
10.Carpentry, masonry,
iron-rim trainings,
-Making latrine used
concrete postshole
2 times of 21 day
course/180 trainees
12.00
12.00
Ayeyarwaddy
Region
2 times of 21 day
course/220 trainees
11.Creating fund-fair 2 times for 7 day
event/100 trainees 10.00 10.00 Bago Region
12. Creating fund-fair 2 times for 3 day
event/200 trainees 10.00 10.00
Ayeyarwaddy
Region
Total 154.00 154.00
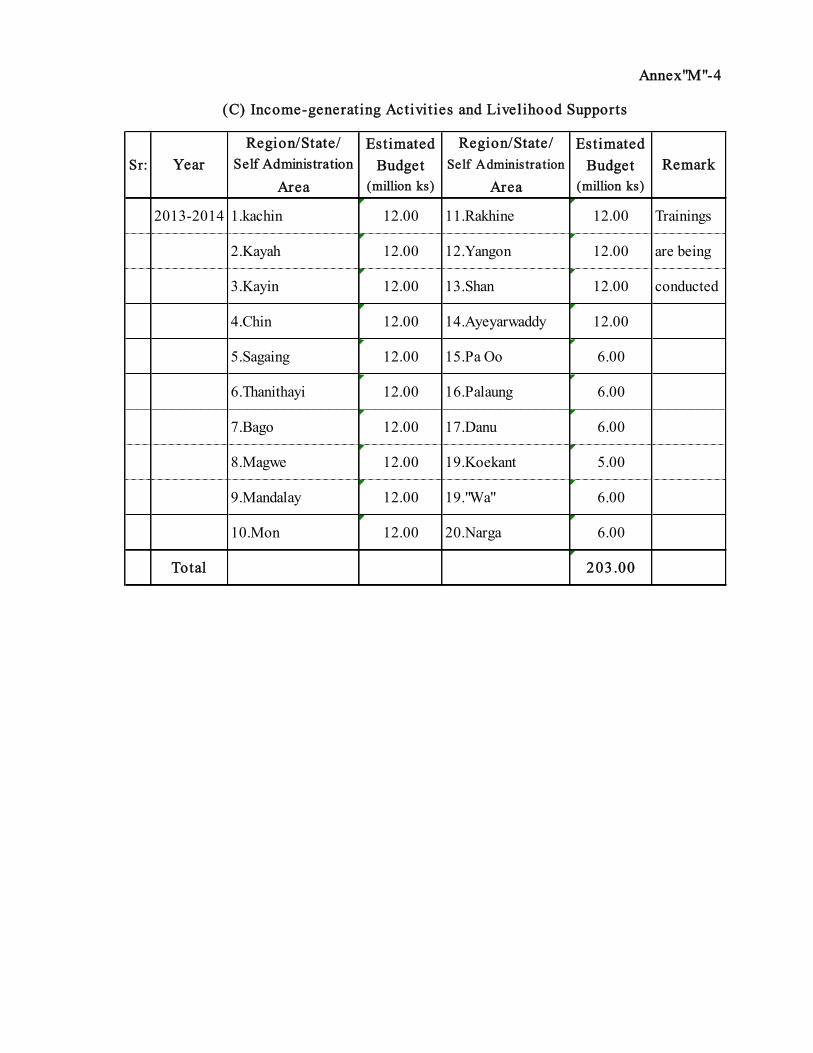
Region/State/ Region/State/
Self Administration Self Administration
Area Area
2013-2014 1.kachin 12.00 11.Rakhine 12.00 Trainings
2.Kayah 12.00 12.Yangon 12.00 are being
3.Kayin 12.00 13.Shan 12.00 conducted
4.Chin 12.00 14.Ayeyarwaddy 12.00
5.Sagaing 12.00 15.Pa Oo 6.00
6.Thanithayi 12.00 16.Palaung 6.00
7.Bago 12.00 17.Danu 6.00
8.Magwe 12.00 19.Koekant 5.00
9.Mandalay 12.00 19."Wa" 6.00
10.Mon 12.00 20.Narga 6.00
Total 203.00
Annex"M"-4
YearSr: Remark
(C) Income-generating Activities and Livelihood Supports
Estimated
Budget
(million ks)
Estimated
Budget
(million ks)

12% interest Repay 24%
interest + Principal
Micro- Pedalar Female/
Rural Loan credit Loan Male
Development services
Bank 12% interest (Forming 24% interest Slow moving
committee) Vehicle driver
12% interest
Annex"M"-5
borrowing groups for their
children's schooling
(D) Function of Micro-Credit Business
(Repay interest every 3 month)
Region/State
Proving school uniforms
and exercise books to the
Male
Saving Book(guarantee)
Township Development Affairs

Annex "M"-6
(E) Rural Electricity Supply Programmes
Sr: Year
Target supplied Target 5 Year Plan Finished
Remark villages villages village task
expense
villages task
expense
2012-2013
(million
ks)
(million
ks)
1
2012-2013
64917
21675
-
-
-
-
-
-
43242
villages left
2
2011-2012 to
2015-2016 -
-
1792
179200
25062
3 2011-2012 - - - - - -
4 2012-2013 448 44800 6234 188 17616 2955.4
domestic
5 2013-2014 448 44800 62776 273 18428 4250.4
Solar system/
Hydro-power
Total - - 94072 461 36044 7205.8
Percentage of 5 year - plan targets 26% 20% 29%
Remark : The measures are made in accord with the budget allotment of the State. It is planned
that electricity supply programmes will be provided to over 1400 villages in the year
2014-2015.
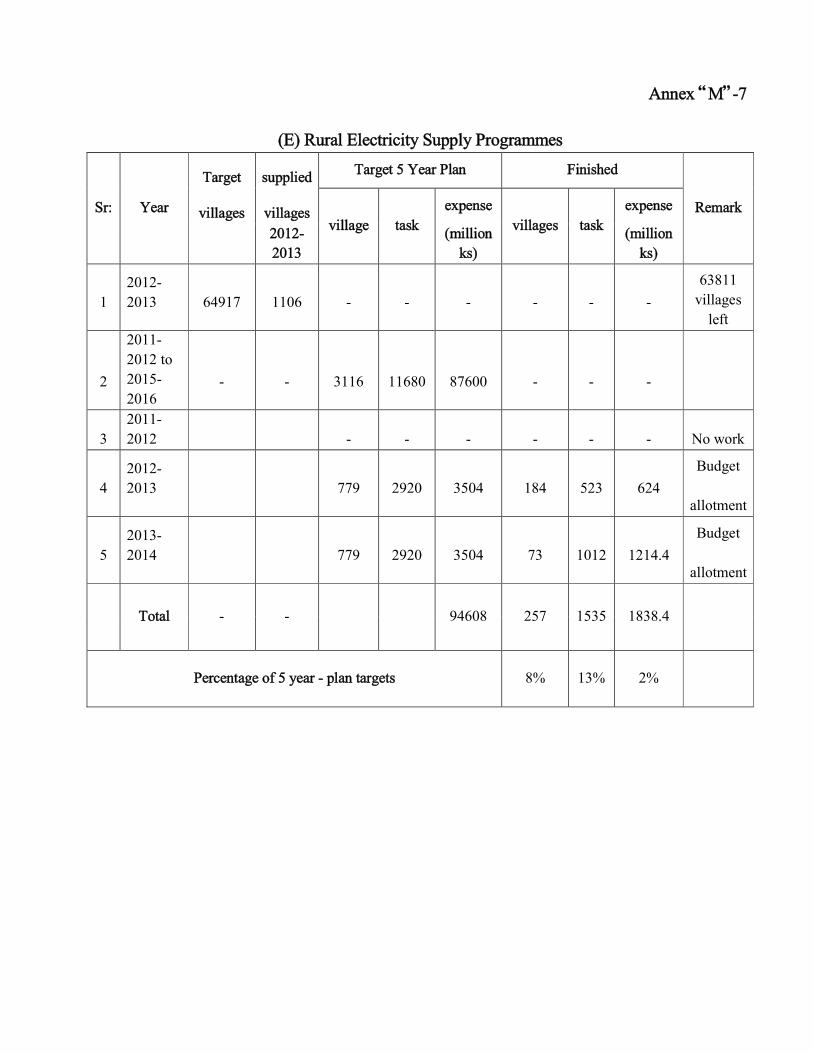
Annex “M”-7
(E) Rural Electricity Supply Programmes
Sr: Year
Target supplied Target 5 Year Plan Finished
Remark villages villages village task
expense
villages task
expense
2012-
2013
(million
ks)
(million
ks)
1
2012-
2013
64917
1106
-
-
-
-
-
-
63811
villages
left
2
2011-
2012 to
2015-
2016 -
-
3116
11680
87600
-
-
-
3
2011-
2012 - - - - - - No work
4
2012-
2013
779
2920
3504
184
523
624
Budget
allotment
5
2013-
2014
779
2920
3504
73
1012
1214.4
Budget
allotment
Total - - 94608 257 1535 1838.4
Percentage of 5 year - plan targets 8% 13% 2%
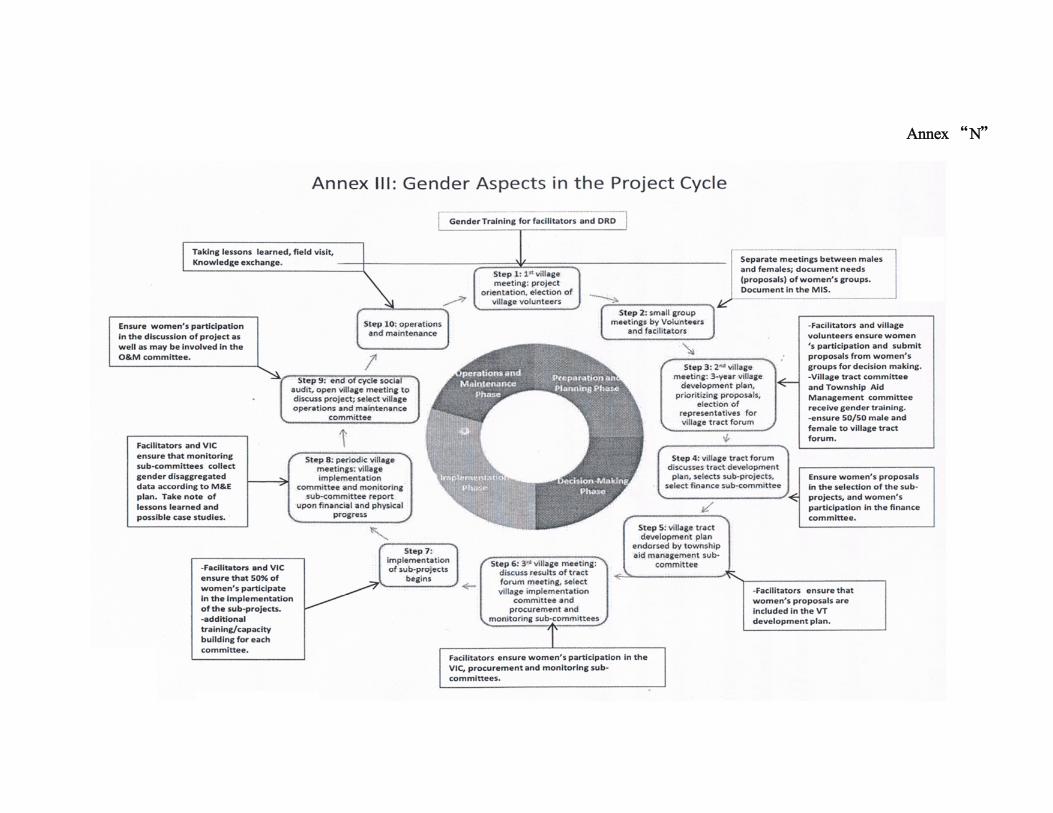
Annex “N”
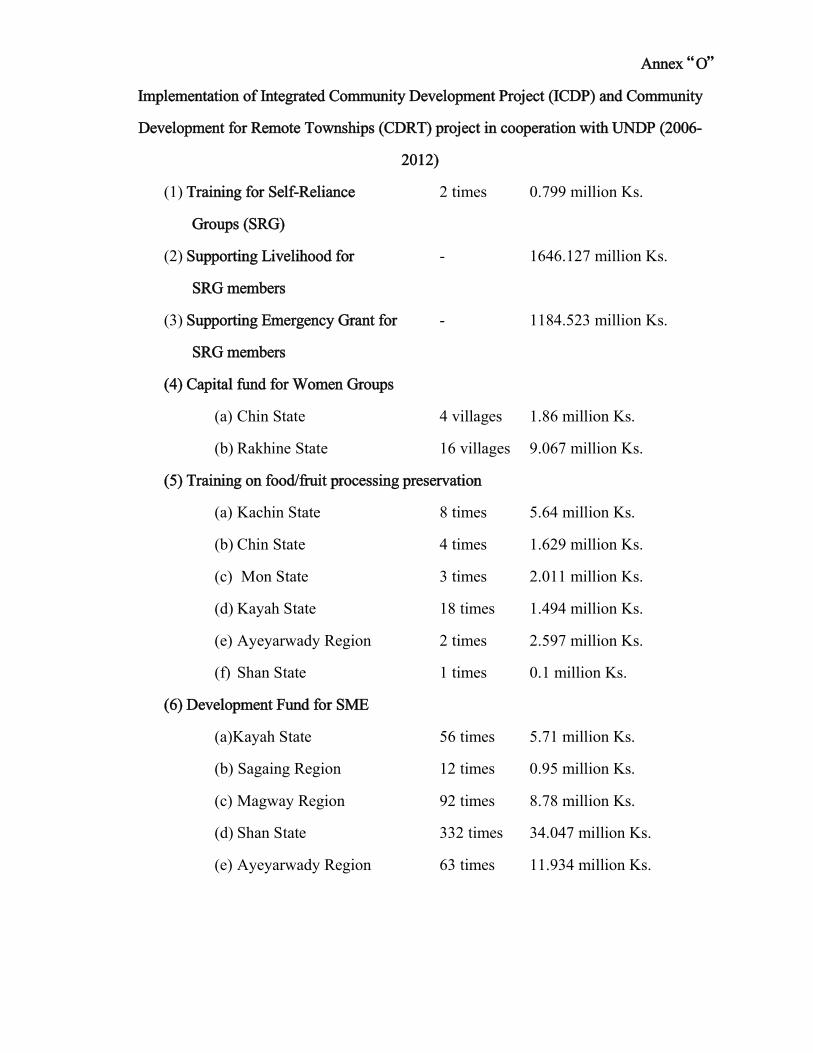
Annex “O”
Implementation of Integrated Community Development Project (ICDP) and Community
Development for Remote Townships (CDRT) project in cooperation with UNDP (2006-
2012)
(1) Training for Self-Reliance 2 times 0.799 million Ks.
Groups (SRG)
(2) Supporting Livelihood for - 1646.127 million Ks.
SRG members
(3) Supporting Emergency Grant for - 1184.523 million Ks.
SRG members
(4) Capital fund for Women Groups
(a) Chin State 4 villages 1.86 million Ks.
(b) Rakhine State 16 villages 9.067 million Ks.
(5) Training on food/fruit processing preservation
(a) Kachin State 8 times 5.64 million Ks.
(b) Chin State 4 times 1.629 million Ks.
(c) Mon State 3 times 2.011 million Ks.
(d) Kayah State 18 times 1.494 million Ks.
(e) Ayeyarwady Region 2 times 2.597 million Ks.
(f) Shan State 1 times 0.1 million Ks.
(6) Development Fund for SME
(a)Kayah State 56 times 5.71 million Ks.
(b) Sagaing Region 12 times 0.95 million Ks.
(c) Magway Region 92 times 8.78 million Ks.
(d) Shan State 332 times 34.047 million Ks.
(e) Ayeyarwady Region 63 times 11.934 million Ks.

Annex "O" -1
(7) SRG Advanced Concept Modules
(a) Kayah State 4 times 3.06 million Ks.
(b) Sagaing Region 16 times 12.14 million Ks.
(c) Shan State 49 times 4.134 million Ks
(d) Ayeyarwady Region 6 times 1.494 million Ks.
(8) Vocational Training (Sewing/Weaving/Basket making)
(a) Kachin State 8 times 17.767 million Ks.
(b) Chin State 8 times 30.844 million Ks.
(c) Rakhine State 14 times 18.194million Ks.
(d) Mon State 5 times 6.076 million Ks.
(e) Kayin State 1 time 2.15 million Ks.
(f) Magway Region 1 time 0.878 million Ks.
(g) Ayeyarwady Region 1 time 1.81 million Ks.
(9) Training on Cotton Weaving
- Chin State 1 time 0.68 million Ks.
(10) Hair dressing training
(a )Magway Region 1 time 1.184 million Ks.
(b) Shan State 2 times 2.149 million Ks.
(11) First Aid Training
(a) Kayah State 10 times 0.733 million Ks.
(b) Sagaing Region 10 times 0.632 million Ks.
(c) Magway Region 42 times 2.929 million Ks.
(d) Ayeyarwady Region 35 times 0.948 million Ks.
(e) Shan State 60 times 4.006 million Ks.
(12) Vocational Training (knitting)
- Shan State 2 times 2.499 million Ks.
(13) Auxiliary Midwife Training
- Ayeyarwady Region 1 time 9.445 million Ks.

Annex “O"- 2
(14) Training for SRG
(a) Magway Region 17 times 28.6 million Ks.
(b) Ayeyarwady Region 1 time 1.5 million Ks.
(15) Supporting for SRGs
- Ayeyarwady Region 12 times 10.615 million Ks.
(16) SRGs fund for working capital
(a) Kachin State 174 villages 46.125 million Ks.
(b) Chin State 409 villages 169.253 million Ks.
(c) Rakhine State 611 villages 104.12 million Ks.
(17) Material Support for SRGs
- Rakhine State 5 villages 2.596 million Ks.
(18) Micro financing Training
(a) Kachin State 599 times 79.108 million Ks.
(b) Chin State 192times 99.378 million Ks.
(c) Rakhine State 440times 155.73 million Ks.
(d) Mon State 33 times 18.632 million Ks.
(e) Kayin State 18 times 24.557 million Ks.
Annex “P”
Annex"R"
Sr: Sch o o l
Ka
Do
Ko
Kan
t
Kac
hin
Ka
Nga
n
Kay
a
Kay
an
Kay
aw
Kay
in
Kal
a
Chi
n
Kh
ami
Dan
u
Pala
ung
Pa a
ing
Bam
ar
Mo
n
My
o
Man
aw
Yin
baw
Yin
tala
e
Rak
hin
e
Raw
on
Sha
n
Tau
ngy
o
Tai
ng
Lw
ae
Die
Net
Les
u
Les
haw
Lar
hue
Lw
ela
Nar
ga
Wa
The
t
Inn
Tha
r
Ahk
ar
Pad
aun
g
Law
war
e
Jain
g P
haw
Tot
al
1 P ut aro 88 2 2 - 25 1 563 95 3 237 17 9 10 4 2
2 Ban m aw 291 3 2 5 2 234 5 187 - 1 98 7
3 Dun Ban 663 3 4 - 81 2 3 56 2 - 20 50 6
4 Daut P h o n e Yan 215 3 - 3 - 489 - 183 4 5 12 98 4
5 Muse 397 16 28 233 1 319 2 278 5 1 12 8 0
6 Lash io 53 429 2 27 38 37 288 2 839 1 16 1091 171 7 78 104 2 2 31 8 7
7 Ky ain e T o ne 29 5 24 20 4 22 36 897 10 28 657 21 18 280 35 495 25 8 1
8 Min eset 3 1 8 7 490 2 12 216 6 6 131 3 6 1 20 91 2
9 T arch ile ik 1 19 4 21 125 9 5 14 988 4 21 3 580 4 1 194 7 13 4 367 23 8 4
1 0 Lo ik aw 2 25 973 403 68 166 14 8 105 871 1 4 3 4 19 312 2 46 7 4 30 3 7
1 1 P h an 1 1 1 980 5 2 5 96 498 68 9 19 16 8 5
1 2 My awaddy 101 432 2 73 919 261 7 106 19 0 1
1 3 Mudo n 1 162 1 31 501 597 2 7 13 0 2
1 4 Yae 7 2 175 1 6 16 928 1058 9 4 2 22 0 8
1 5 My eik 22 2749 27 7 1
1 6 Kawt h aun g 6 2308 6 6 5 23 3 1
1 7 Maun gt aw 1 3 1 36 227 2 12 1160 5 3 79 9 4 6 21 15 6 9
1 8 Har Kh ar 2308 5 143 24 5 6
1 9 P h alam 1013 205 2 1 1 12 2 2
2 0 T ae T ain g 1557 44 16 0 1
2 1 Min T et 946 89 10 3 5
2 2 Mat up i 1155 267 14 2 2
2 3 Kan p et le t 1 2 1 985 182 1 11 7 2
2 4 P ak h uk h u 1 3 1151 1 11 5 6
2 5 Yaesak y o 1082 10 8 2
2 6 My ain g 1018 10 1 8
2 7 P auk 1035 10 3 5
2 8 Seik p h y u 12 1332 13 4 4
2 9 Yin m arp in 4 1 1386 5 13 9 6
3 0 P alea 3 2 29 1299 3 13 3 6
3 1 Sar lin k y i 8 18 1 1245 1 10 12 8 3
3 2 Laesh ie 36 10 5 23 521 59 5
3 3 Le h ae 5 33 12 31 14 536 63 1
3 4 Nan Yo n 2 26 28 22 415 49 3
3 5 My ain Gy i Ngu 342 10 85 29 46 6
3 6 Kh an t i 3 1 21 123 7 115 39 181 49 0
T o t al 1 1 5 7 2 1 4 7 2 6 9 8 8 4 0 6 16 9 2 3 9 9 7 8 3 4 4 36 5 8 5 6 2 3 9 2 2 4 1 1 8 2 0 0 8 1 4 4 3 4 1 3 1 0 5 7 5 3 9 7 9 5 2 1 1 3 8 50 2 4 9 7 2 5 1 0 1 6 8 6 1 6 3 6 74 8 8 9 4 2 9 5 19 0 0
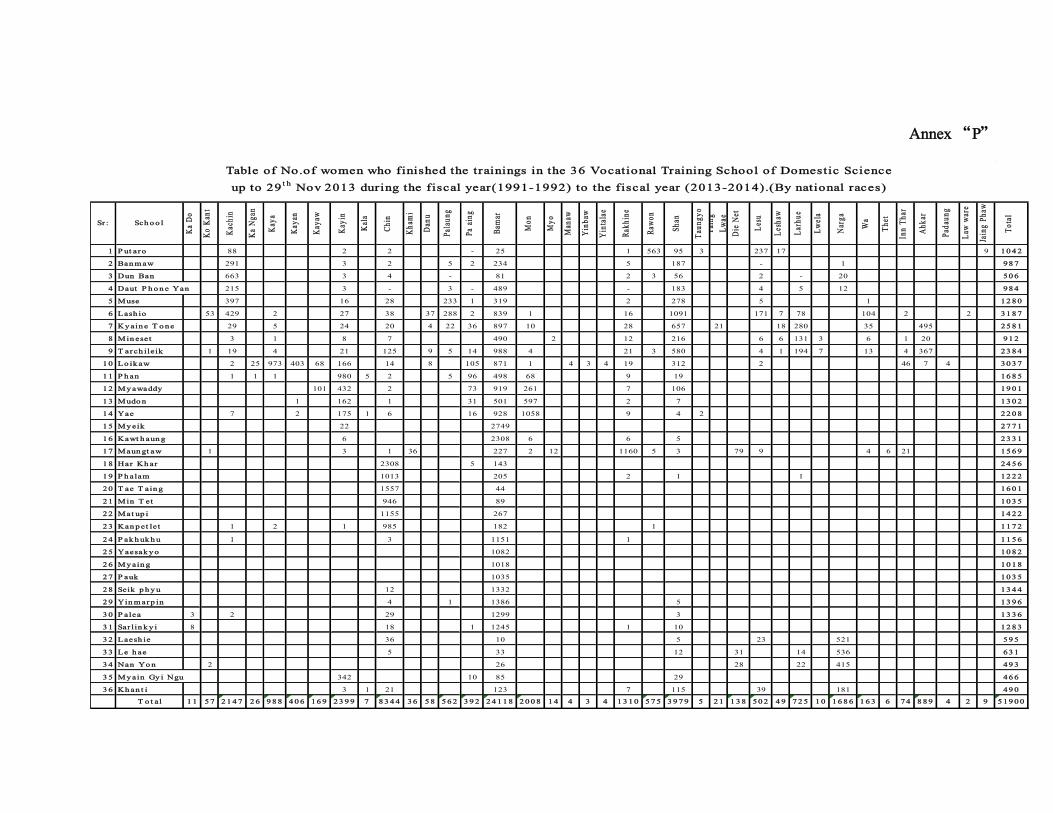
Table of No.of women who finished the trainings in the 36 Vocational Training School of Domestic Science
up to 29t h Nov 2013 during the fiscal year(1991-1992) to the fiscal year (2013-2014).(By national races)