Annex 1: Process trees and system...
96
"Evaluation of costs and benefits for the achievement of reuse and recycling targets for the different packaging materials in the frame of the packaging and packaging waste directive 94/62/EC" – Final consolidated report, RDC-Environment & Pira International, March 2003 Annex 1: Process trees and system descriptions - 1 -
Transcript of Annex 1: Process trees and system...
"Evaluation of costs and benefits for the achievement of reuse and recycling targets for the different packaging materials in the frame of the packaging and packaging waste directive 94/62/EC" – Final consolidated report,
RDC-Environment & Pira International, March 2003
Annex 1: Process trees and system descriptions
- 1 -

"Evaluation of costs and benefits for the achievement of reuse and recycling targets for the different packaging materials in the frame of the packaging and packaging waste directive 94/62/EC" – Final consolidated report,
RDC-Environment & Pira International, March 2003
1 GENERAL SYSTEM PARAMETERS
1.1 Optimised recycling chains
In this paragraph, optimised recycling chains are described for the different scenarios for which a
CBA is performed. Final system flow diagrams are given in chapter 2 of this annex.
1.2 Industrial packaging approach
For the 2 industrial case studies, i.e. LDPE plastic films and cardboard, we calculated the
minimum packaging waste production under which the selective collection is not beneficial.
The external benefits (EB) of collecting and recycling industrial packaging waste has been
calculated as 11.7 EURO/t (corrugated board) and 208 EURO/t (PE film).
Collecting and transporting corrugated board and PE films as mixed waste is often cheaper than
collecting and transporting source sorted packaging. There is thus an additional collection cost
(ACC) to collect selectively.
The annual production of industrial packaging waste for which the ACC = EB is
5.5 t/year for cardboard
0.01 t/year for LDPE plastic films.
Above this waste production the environmental benefits outweigh the additional internal cost for
the selective collection.
This means that, from a cost-benefit viewpoint, the companies who produce more waste than
0.01 t of plastic film or 5.5 t of corrugated board per year should have a selective collection
scheme to recycle it. As the "break-even" amount is very low for PE films, it can be concluded
that selective collection of industrial packaging should be systematic throughout the EU. As
there are limits to the modelling, it has been assumed for this study that 95% of the industrial
sites (percentage in packaging weight) should make the selective collection of packaging.
- 2 -

"Evaluation of costs and benefits for the achievement of reuse and recycling targets for the different packaging materials in the frame of the packaging and packaging waste directive 94/62/EC" – Final consolidated report,
RDC-Environment & Pira International, March 2003
1.3 Kerbside collection
For PMC, it is assumed that the material is placed by the householder in a PMC selective
collection bag.
The selective collection bag may contain "light packaging" : plastic bottles, metals and LBC. It is
collected twice a month in high and low population density areas.
Collection vehicle is a truck with a volume of 16m³. The collected material is transported
directly to the sorting facility. Distance to sorting plant is about :
Truck Vehicle type High population density Low population density
Paper & board 17-25t truck 8 – 71,1 km/t 86,1 – 176,1 km/t
light packaging 17-25t truck 21,1 – 107,7 km/t 74,4 – 227,8 km/t
Employment and internal costs were determined based on Beture Environnement and FOST Plus
data. Air emissions from trucks are based on Corinair. Transport distances were provided by Eco-
emballages.
The paper and board selective collection happens once a month in high and low population
density areas. Packaging and magazines are collected together without any condition on the
conditioning (packaging).
Collection vehicle is a truck with a volume of 16m³.
Sources:[46], [48], [49], [66]
Note : The cost for selective collection is assumed to be independent from the amount of material
to be collected separately because the collection frequency is adapted to the amount of waste.
However, this is not true anymore for very low amounts (and frequencies) because there is a
minimum frequency under which the system is not efficient anymore.
- 3 -

"Evaluation of costs and benefits for the achievement of reuse and recycling targets for the different packaging materials in the frame of the packaging and packaging waste directive 94/62/EC" – Final consolidated report,
RDC-Environment & Pira International, March 2003
1.4 Bring scheme
Consumers bring their sorted1 packaging waste and other waste to the bring scheme.
Assumptions on the distance which has to be attributed to “packaging collection” has be given by
Eco-Emballages..
In the bring scheme, packaging are collected in container of about 30m³. These containers are
transported to the sorting plant or the recycling facility about once a week for light packaging and
for paper & board packaging in high and low population density areas. The collected material is
taken directly to the sorting facility. Distance to sorting plant is about :
Truck High population density Low population density
Paper & board 3,8 – 10,5 km/t 11,1 – 20,2 km/t
Light packaging 18 – 37,2 km/t 42,2 – 123,9 km/t
Sources:[46], [48], [66]
1.5 Sorting
Only limited data for the environmental impacts at a sorting plant was sourced. Data for energy
consumption at the sorting plant (electricity to power conveyors and space heating) has been
collected. For residual material arising at the sorting plant, the following assumption has been
made:
• Waste arising at sorting plant from materials collected by separate kerbside collection –
20%
• Waste arising at sorting plant from materials collected by bring bank – 10%
The sorted material is baled. Energy consumption for baling has been included in the model.
1 packaging waste are sorted in 2 fractions: light packaging on the first hand and paper & board + magazines on the other hand.
- 4 -
"Evaluation of costs and benefits for the achievement of reuse and recycling targets for the different packaging materials in the frame of the packaging and packaging waste directive 94/62/EC" – Final consolidated report,
RDC-Environment & Pira International, March 2003
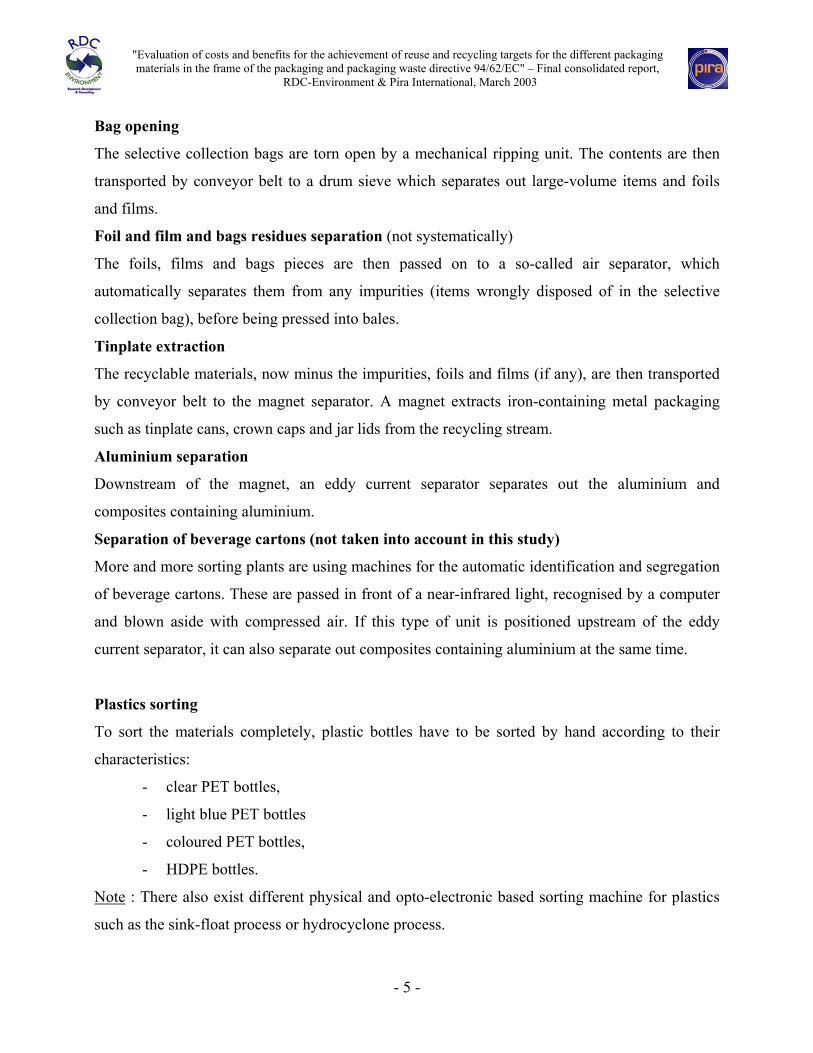
Bag opening
The selective collection bags are torn open by a mechanical ripping unit. The contents are then
transported by conveyor belt to a drum sieve which separates out large-volume items and foils
and films.
Foil and film and bags residues separation (not systematically)
The foils, films and bags pieces are then passed on to a so-called air separator, which
automatically separates them from any impurities (items wrongly disposed of in the selective
collection bag), before being pressed into bales.
Tinplate extraction
The recyclable materials, now minus the impurities, foils and films (if any), are then transported
by conveyor belt to the magnet separator. A magnet extracts iron-containing metal packaging
such as tinplate cans, crown caps and jar lids from the recycling stream.
Aluminium separation
Downstream of the magnet, an eddy current separator separates out the aluminium and
composites containing aluminium.
Separation of beverage cartons (not taken into account in this study)
More and more sorting plants are using machines for the automatic identification and segregation
of beverage cartons. These are passed in front of a near-infrared light, recognised by a computer
and blown aside with compressed air. If this type of unit is positioned upstream of the eddy
current separator, it can also separate out composites containing aluminium at the same time.
Plastics sorting
To sort the materials completely, plastic bottles have to be sorted by hand according to their
characteristics:
- clear PET bottles,
- light blue PET bottles
- coloured PET bottles,
- HDPE bottles.
Note : There also exist different physical and opto-electronic based sorting machine for plastics
such as the sink-float process or hydrocyclone process.
- 5 -
"Evaluation of costs and benefits for the achievement of reuse and recycling targets for the different packaging materials in the frame of the packaging and packaging waste directive 94/62/EC" – Final consolidated report,
RDC-Environment & Pira International, March 2003
Sources :[47], [53], [63], [66]
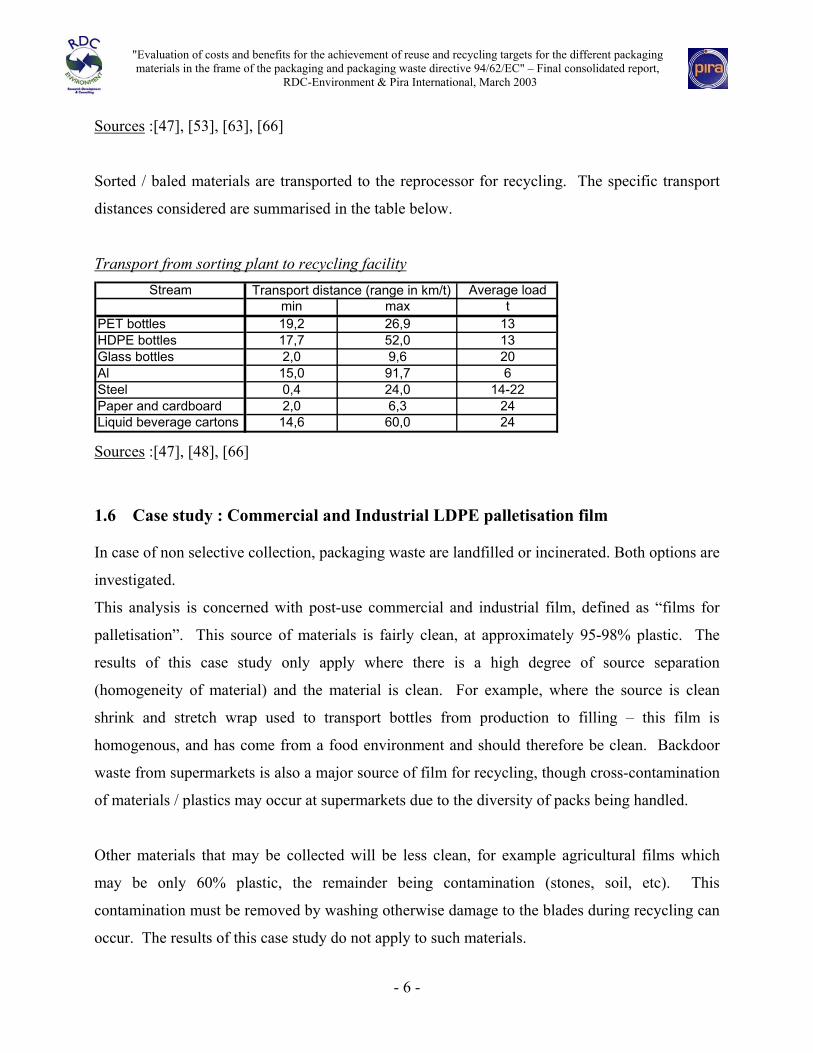
Sorted / baled materials are transported to the reprocessor for recycling. The specific transport
distances considered are summarised in the table below.
Transport from sorting plant to recycling facility Stream Average load
min max tPET bottles 19,2 26,9 13HDPE bottles 17,7 52,0 13Glass bottles 2,0 9,6 20Al 15,0 91,7 6Steel 0,4 24,0 14-22Paper and cardboard 2,0 6,3 24Liquid beverage cartons 14,6 60,0 24
Transport distance (range in km/t)
Sources :[47], [48], [66]
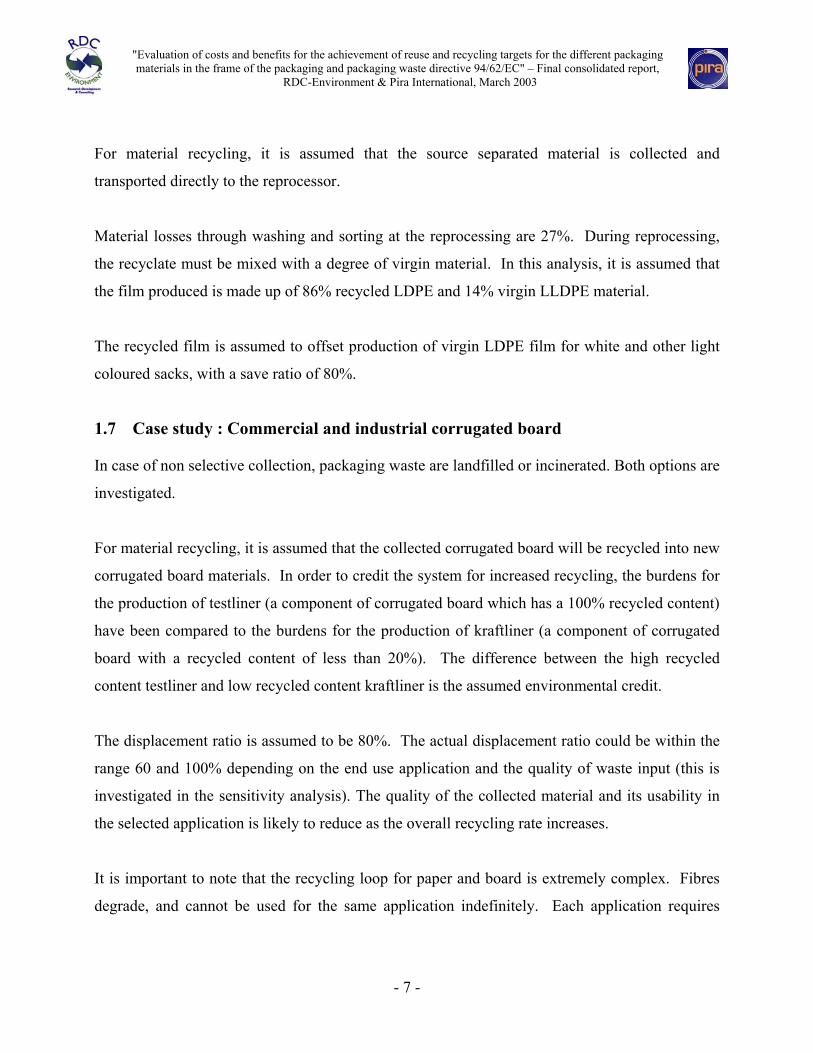
1.6 Case study : Commercial and Industrial LDPE palletisation film
In case of non selective collection, packaging waste are landfilled or incinerated. Both options are
investigated.
This analysis is concerned with post-use commercial and industrial film, defined as “films for
palletisation”. This source of materials is fairly clean, at approximately 95-98% plastic. The
results of this case study only apply where there is a high degree of source separation
(homogeneity of material) and the material is clean. For example, where the source is clean
shrink and stretch wrap used to transport bottles from production to filling – this film is
homogenous, and has come from a food environment and should therefore be clean. Backdoor
waste from supermarkets is also a major source of film for recycling, though cross-contamination
of materials / plastics may occur at supermarkets due to the diversity of packs being handled.
Other materials that may be collected will be less clean, for example agricultural films which
may be only 60% plastic, the remainder being contamination (stones, soil, etc). This
contamination must be removed by washing otherwise damage to the blades during recycling can
occur. The results of this case study do not apply to such materials.
- 6 -
"Evaluation of costs and benefits for the achievement of reuse and recycling targets for the different packaging materials in the frame of the packaging and packaging waste directive 94/62/EC" – Final consolidated report,
RDC-Environment & Pira International, March 2003
For material recycling, it is assumed that the source separated material is collected and
transported directly to the reprocessor.
Material losses through washing and sorting at the reprocessing are 27%. During reprocessing,
the recyclate must be mixed with a degree of virgin material. In this analysis, it is assumed that
the film produced is made up of 86% recycled LDPE and 14% virgin LLDPE material.
The recycled film is assumed to offset production of virgin LDPE film for white and other light
coloured sacks, with a save ratio of 80%.
1.7 Case study : Commercial and industrial corrugated board
In case of non selective collection, packaging waste are landfilled or incinerated. Both options are
investigated.
For material recycling, it is assumed that the collected corrugated board will be recycled into new
corrugated board materials. In order to credit the system for increased recycling, the burdens for
the production of testliner (a component of corrugated board which has a 100% recycled content)
have been compared to the burdens for the production of kraftliner (a component of corrugated
board with a recycled content of less than 20%). The difference between the high recycled
content testliner and low recycled content kraftliner is the assumed environmental credit.
The displacement ratio is assumed to be 80%. The actual displacement ratio could be within the
range 60 and 100% depending on the end use application and the quality of waste input (this is
investigated in the sensitivity analysis). The quality of the collected material and its usability in
the selected application is likely to reduce as the overall recycling rate increases.
It is important to note that the recycling loop for paper and board is extremely complex. Fibres
degrade, and cannot be used for the same application indefinitely. Each application requires
- 7 -
"Evaluation of costs and benefits for the achievement of reuse and recycling targets for the different packaging materials in the frame of the packaging and packaging waste directive 94/62/EC" – Final consolidated report,
RDC-Environment & Pira International, March 2003
specific properties, and therefore specific mixes of fibres from different sources. Increasing the
recycled content of corrugated board may reduce the properties of the board.
Therefore, the situation modelled in this analysis is a theoretical situation, which illustrates the
range of costs and benefits that may be incurred where corrugated cases are recycled.
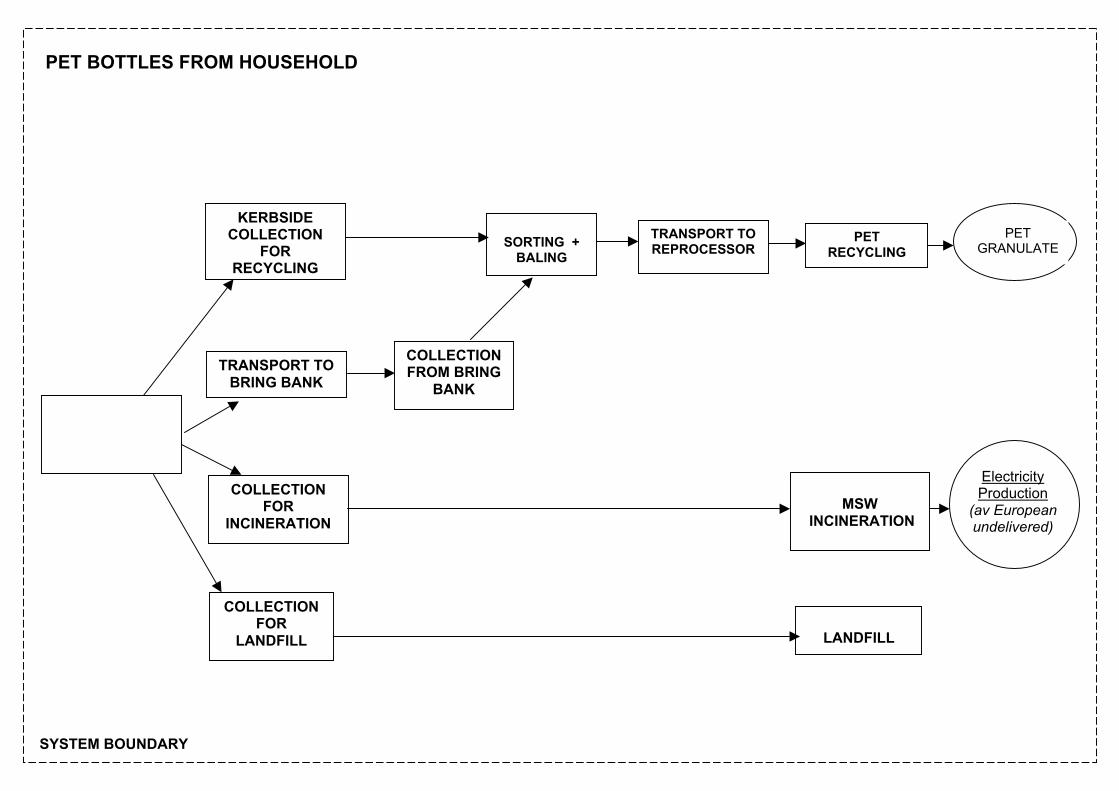
1.8 Case study : PET bottles
PET bottles can be
- collected with MSW and then landfilled or incinerated with energy recovery, according to
the scenario
- selectively collected with aluminium, steel and LBC by kerbside collection
- selectively collected with aluminium, steel and LBC within a bring scheme
In case of selective collection, plastic bottles are transported to the sorting plant where they are
manually sorted according to their characteristics (colour and polymer), crushed and baled.
Bales are transported to the recycling facility.
In the mechanical recycling facility, PET bottles are unbaled and PVC is separated. Then PET is
ground, washed and dried. Mechanical recycling into granulate for use in bottle production has
been considered in this study. The recycled material produced has been credited against the
production of virgin PET. The displacement save ratio assumed is 100%. For PET bottles, other
reprocessing routes are also available (for example fibre production or TBI process). These
routes have not been considered in detail in this analysis.
Interpretation and application of the results should take into account the following limitations:
The sorted/baled material sent to the reprocessor must meet required bale specifications in
order to be recycled by this technology. Therefore, results only apply to clear PET bottles
and baled materials that meet the required specifications.
Internal and external costs for other reprocessing routes will be different from those
considered in the analysis
- 8 -

"Evaluation of costs and benefits for the achievement of reuse and recycling targets for the different packaging materials in the frame of the packaging and packaging waste directive 94/62/EC" – Final consolidated report,
RDC-Environment & Pira International, March 2003
The sensitivity analysis considers feedstock process as recycling alternative.
Sources :[55], [57], [63], [64], [65]
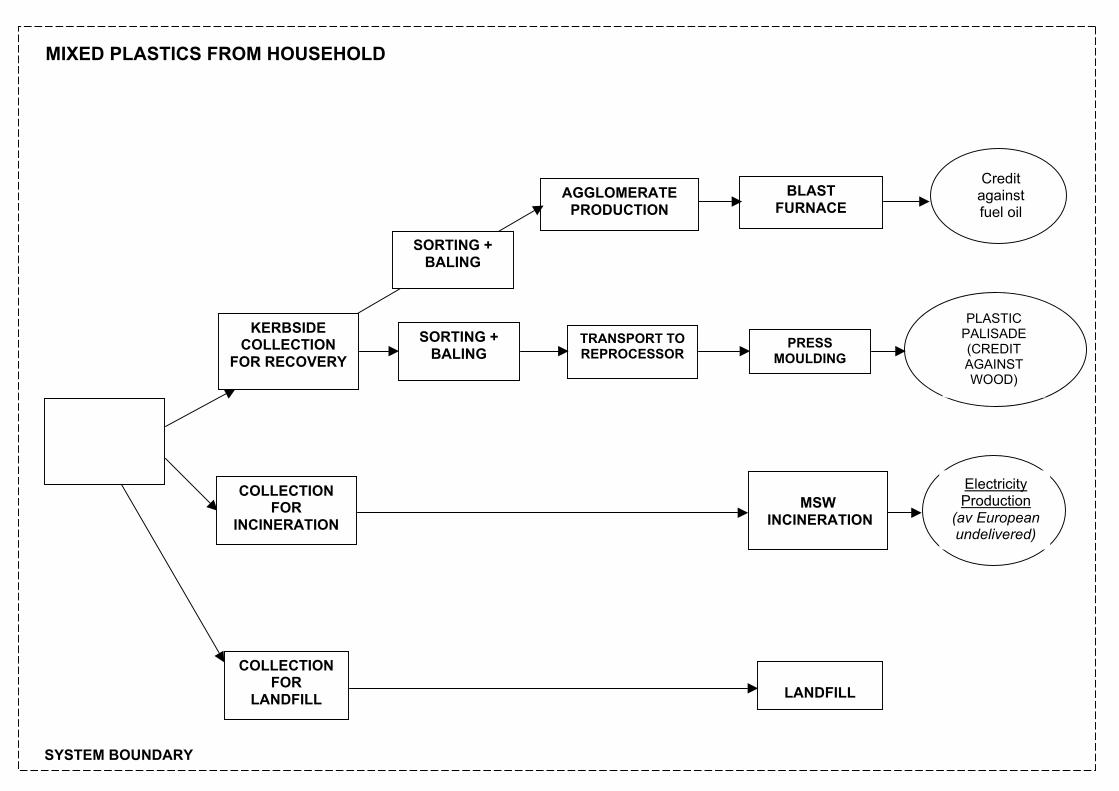
1.9 Case study : Mixed plastics from household sources
Four waste management options are considered for mixed plastics from household sources:
• Landfill
• Incineration with energy recovery
• Mechanical recycling (press forming) via separate kerbside collection
• Recovery in a blast furnace via separate kerbside collection.
In case of selective collection, mix plastic packaging waste are transported to the sorting plant
where they are sorted, crushed and baled.
Bales are transported to the mechanical recycling facility or to the agglomeration plant (in case of
use in cement kilns or in blast furnace), according to the scenario.
In the mechanical recycling facility, mix plastic packaging are unbaled. After a dry process,
plastic is extruded in order to be used as palisade. The recovered material from mechanical
recycling is used for plastic palisade, and is assumed to offset production of wood. A
displacement save ratio of 100% is assumed, although in reality this is highly variable (it is
therefore investigated in the sensitivity analysis). The recycling consists of a number of steps.
Firstly, there is a dry treatment stage. The output of this process is ground plastics. Losses at this
stage are 20%. The ground plastics are then press extruded into a product (in this case, palisade).
In the agglomeration plant the plastics mixture is processed in order to meet defined quality
criteria as regards bulk density, grain size, chlorine and dust content and residual moisture.
In technical terms, agglomeration consists of a sequence of shredding and separating processes,
followed by compacting of the plastic material. During the pelletisation process the shredded
waste plastic is compacted by means of pressure. The material is forced through the drilled holes
of a pelletiser and cut off with cutters : the process delivers agglomerate.
- 9 -

"Evaluation of costs and benefits for the achievement of reuse and recycling targets for the different packaging materials in the frame of the packaging and packaging waste directive 94/62/EC" – Final consolidated report,
RDC-Environment & Pira International, March 2003
The so-called agglomerate is then transported or not to blast furnace or cement kiln where it is
used as a partial substitute for heavy oil (reduction process in blast furnace) or as secondary fuel
(cement kiln).
For recovery via the blast furnace, the system is credited against fuel oil (low sulphur). It is
assumed that 1 tonne of agglomerate entering the blast furnace offset 964kg of fuel oil. The blast
furnace recovery route consists of a number of steps. Firstly, agglomerate is produced. Losses at
this stage are 24%. The agglomerate is then injected into the blast furnace, where it is assumed to
offset fuel oil.
Interpretation of the results of the cost benefit analysis should consider the following:
Other recovery routes are also available (for example, recovery in a cement kiln). These
options have not been considered in this analysis. The internal and external costs for these
options will be different.
Sources :[55], [57], [63]
Note : the bring system has not been analysed because there is no data available for such a
system.
1.10 Case study : household steel applications
Five waste management options are considered for steel packaging arising from households
• Landfill
• Incineration with energy recovery
• Incineration with energy recovery and extraction of steel from slags
• Material recycling via separate kerbside collection, selectively collected with aluminium,
plastic bottles and LBC
• Material recycling via bring scheme, selectively collected with aluminium, plastic bottles and
LBC.
In case of selective collection, steel packaging are transported to the sorting plant where they are
automatically sorted with magnetic separator and baled.
- 10 -

"Evaluation of costs and benefits for the achievement of reuse and recycling targets for the different packaging materials in the frame of the packaging and packaging waste directive 94/62/EC" – Final consolidated report,
RDC-Environment & Pira International, March 2003
Bales are transported to the recycling facilities (blast furnace) where they are melt (after
shredding or not).
Two production routes are assumed for production of packing steel. These are the oxygen
furnace using principally iron ore as the raw material and the electric arc furnace using scrap
steel. Increased recycling increases electric arc steel production whilst reducing blast furnace
production, thereby yielding an environmental credit.
For incineration with extraction of slags it is assumed that 80% of the steel entering the
incinerator is recovered and sent for recycling.
A save ratio of 100% is considered for the recycled steel.
1.11 Case study : Aluminium beverage packaging
Household aluminium packaging waste can be
- collected with MSW and then landfilled or incinerated with aluminium recovery,
according to the scenario
- selectively collected with steel, plastic bottles and LBC by kerbside collection
- selectively collected with steel, plastic bottles and LBC within a bring scheme
Five waste management options are considered for aluminium beverage packaging arising from
households
• Landfill
• Incineration with energy recovery
• Incineration with energy recovery and extraction of aluminium from slags
• Material recycling via separate kerbside collection, selectively collected with steel, plastic
bottles and LBC
• Material recycling via bring scheme, selectively collected with steel, plastic bottles and
LBC.
For incineration with extraction of aluminium from slags, it is assumed that 76% of the
aluminium beverage packaging entering the incinerator is recovered and sent for recycling.
- 11 -

"Evaluation of costs and benefits for the achievement of reuse and recycling targets for the different packaging materials in the frame of the packaging and packaging waste directive 94/62/EC" – Final consolidated report,
RDC-Environment & Pira International, March 2003
In case of selective collection, aluminium packaging are transported to the sorting plant where
they are automatically sorted with Eddy current separator and baled.
Baled aluminium beverage cans from the sorting plant go through a scrap preparation stage.
Losses at the scrap preparation stage are 19%. The material is then melted and alloyed. The
recycled aluminium ingots are assumed to offset production of virgin aluminium ingots. A save
ratio of 100% is assumed.
1.12 Case study : Other rigid and semi-rigid aluminium packaging
Five waste management options are considered for other rigid and semi-rigid aluminium
packaging arising from households:
• Landfill
• Incineration with energy recovery
• Incineration with energy recovery and extraction of aluminium from slags
• Material recycling via separate kerbside collection, selectively collected with steel, plastic
bottles and LBC
• Material recycling via bring scheme, selectively collected with steel, plastic bottles and LBC.
For incineration with extraction of aluminium from slags, it is assumed that 50% of the rigid and
semi-rigid aluminium packaging except beverage cans entering the incinerator is recovered and
sent for recycling.
Baled aluminium from the sorting plant go through a scrap preparation stage. Losses at the scrap
preparation stage are 19%. The material is then melted and alloyed. The recycled aluminium
ingots are assumed to offset production of virgin aluminium ingots. A save ratio of 100% is
assumed.
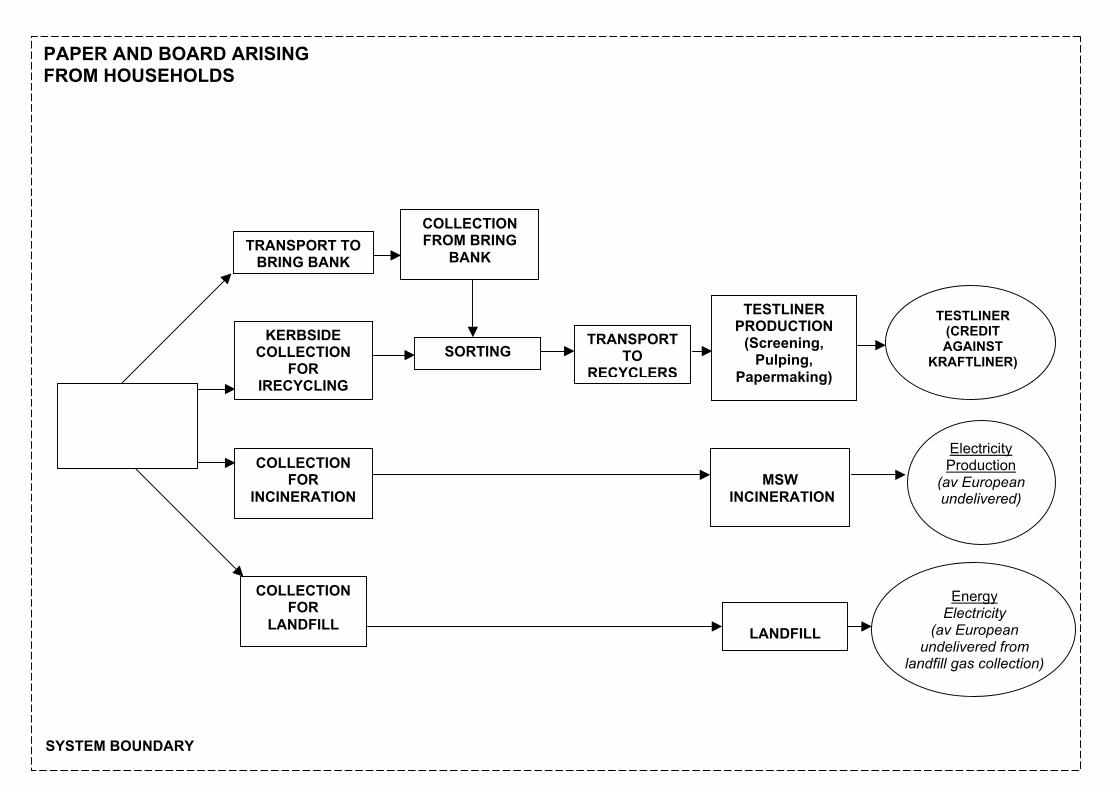
1.13 Case study : household paper & board
Household Paper & Board packaging waste can be
- 12 -

"Evaluation of costs and benefits for the achievement of reuse and recycling targets for the different packaging materials in the frame of the packaging and packaging waste directive 94/62/EC" – Final consolidated report,
RDC-Environment & Pira International, March 2003
- collected with MSW and then landfilled or incinerated with energy recovery, according to
the scenario
- selectively collected with magazines by kerbside collection
- selectively collected with magazines within a bring scheme
Paper & board selectively collected are first purified and manually sorted into various qualities.
They are then baled and transported to the pulp and paper plant.
At the pulp & paper plant, paper and board waste are pulped (after shredding or not). After
screening or centrifugal cleaning the pulp is purified and is ridded of all undesirable elements.
Fibbers are dried on a conveyer belt (Filtration - water is extracted and fibres remain).
Fibres are recovered and the rejects are incinerated or landfilled.
For material recycling, limited life cycle inventory data or internal cost data for recycling
processes specific to household paper and cardboard packaging was available to the consultants.
Therefore the following limitations to the model should be recognised:
• It is assumed that the recovered fibre is reprocessed into testliner, and that the testliner
offsets the production of kraftliner (a save ratio of 80% has been assumed). This is a considerable
limitation of the model. The assumption has been made to facilitate a comparison of the burdens
associated with the production of a high recycled content substrate with the production of a low
recycled content substrate. In reality, recovered fibre from household paper and board packaging
will be mixed with virgin fibre and recovered fibre from other sources. The final application of
the substrate determines the properties required and therefore dictates the necessary pulp furnish.
This therefore also dictates the achievable recycling rate in the paper and board sector as a whole.
Increasing the recycling rate of paper and board packaging from household sources may not
increase the recycling rate of fibre overall. Increased recycling of paper and board packaging
from household sources may reduce recycling from other sectors such as newsprint. This has not
been addressed in this study, and should be recognised as a further limitation of the model.
- 13 -
"Evaluation of costs and benefits for the achievement of reuse and recycling targets for the different packaging materials in the frame of the packaging and packaging waste directive 94/62/EC" – Final consolidated report,
RDC-Environment & Pira International, March 2003
Therefore, the situation modelled in this analysis is a theoretical situation, which illustrates the
range of costs and benefits that may be incurred where paper and cardboard packaging from
household sources are recycled.
Sources: [66], [67]
1.14 Case study : liquid beverage cartons
Six waste management options are considered for liquid beverage cartons:
• Landfill
• Incineration with energy recovery
• Material recycling of the fibre via separate kerbside collection (rejected aluminium and PE
to landfill)
• Material recycling of the fibre via separate kerbside collection (rejected aluminium and PE
to incineration)
• Material recycling of fibre via bring scheme (rejected aluminium and PE to landfill)
• Material recycling of fibre via bring scheme (rejected aluminium and PE to incineration)
It is assumed that LBC is selectively collected with aluminium, plastic bottles and steel
packaging.
In case of selective collection, LBC are transported to the sorting plant where they are
automatically sorted with Eddy current separator, crushed and baled. Other sorting techniques are
described in paragraph “Sorting ”, but are not included in the CBA.
Bales are transported to the recycling facilities (pulp & paper plant) where they are pulped (after
shredding or not). After screening or centrifugal cleaning pulp is purified and is ridded of all
undesirable elements. Fibbers are dried on a conveyer belt (Filtration - water is extracted and
fibres remain).
As with the household paper and cardboard packaging model, it is assumed that the recovered
fibre is reprocessed into testliner, and that the testliner offsets the production of kraftliner (with a
save ratio of 80% assumed). The same limitations therefore apply as in the household paper and
card model.
- 14 -

"Evaluation of costs and benefits for the achievement of reuse and recycling targets for the different packaging materials in the frame of the packaging and packaging waste directive 94/62/EC" – Final consolidated report,
RDC-Environment & Pira International, March 2003
The Al/PE fraction can be energetically valorised in cement kilns/incinerators or used in
pyrolysis. Both landfill and incineration routes are analysed in this study.
Source :[66], [68]
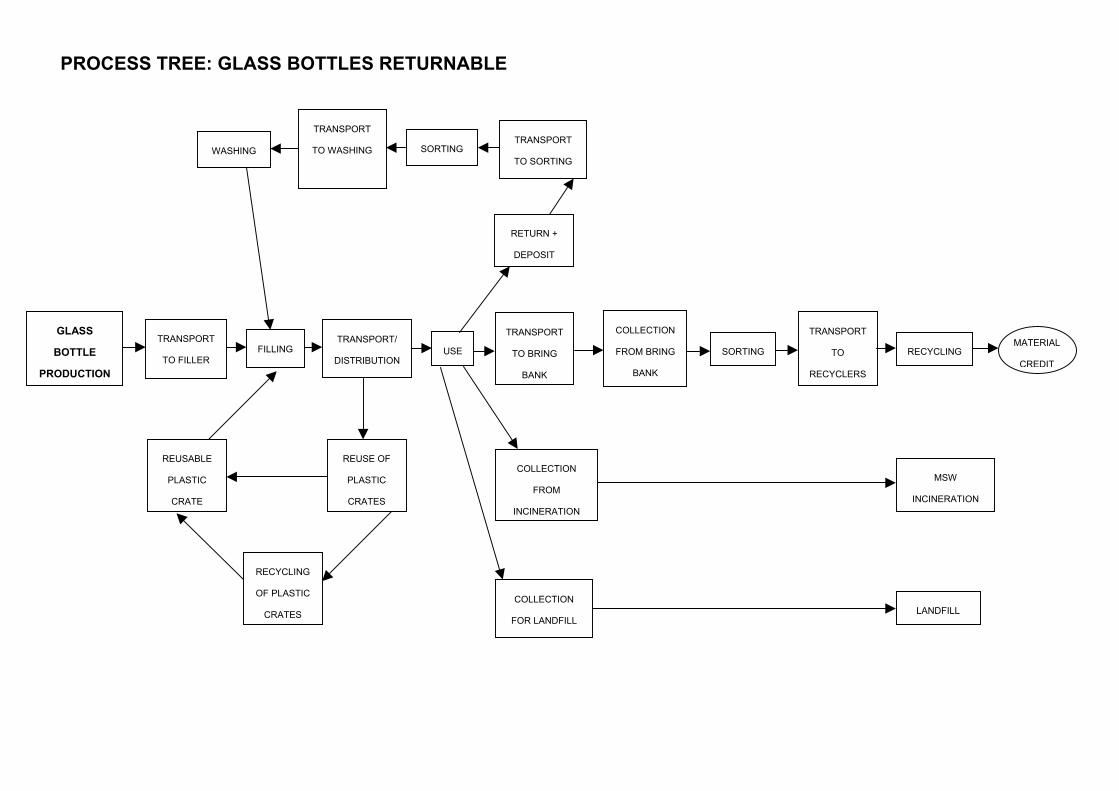
1.15 Case study Glass bottles
Three waste management options are considered for household glass beverage packaging:
• Landfill
• Incineration with energy recovery
• Material recycling via a bring scheme
The LCI data available to the consultants is lacking in transparency. The data aggregates the
reprocessing steps and environmental credit, but no description of the assumptions made and
conditions under which the data is applicable are provided. No indication of the type of cullet
being recycled is given.
Therefore, the results of this case study should be considered only as indicative to the possible
costs and benefits that may be incurred when glass bottles from household sources are recycled.
- 15 -

"Evaluation of costs and benefits for the achievement of reuse and recycling targets for the different packaging materials in the frame of the packaging and packaging waste directive 94/62/EC" – Final consolidated report,
RDC-Environment & Pira International, March 2003
2 CASE STUDY PROCESS TREES
- 16 -
MIXED
PLASTICS
SORTING + BALING
SORTING + BALING
PLASTIC PALISADE (CREDIT AGAINST WOOD)
KERBSIDE COLLECTION
FOR RECOVERYPRESS
MOULDING TRANSPORT TO REPROCESSOR
Electricity Production
(av European undelivered)
MSW
INCINERATION
COLLECTION FOR
INCINERATION
Credit against fuel oil
BLAST FURNACE
AGGLOMERATE PRODUCTION
MIXED PLASTICS FROM HOUSEHOLD
LANDFILL
COLLECTION FOR
LANDFILL
SYSTEM BOUNDARY
MIXED PAPER PACKAGING
TESTLINER (CREDIT AGAINST
KRAFTLINER)
Energy Electricity
(av European undelivered from
landfill gas collection)
COLLECTION FROM BRING
BANK
KERBSIDE COLLECTION
FOR IRECYCLING
COLLECTION FOR
INCINERATION
COLLECTION FOR
LANDFILL
TRANSPORT TO
RECYCLERSSORTING
TESTLINER PRODUCTION
(Screening, Pulping,
Papermaking)
TRANSPORT TO BRING BANK
PAPER AND BOARD ARISING FROM HOUSEHOLDS
Electricity Production
(av European undelivered)
MSW
INCINERATION
SYSTEM BOUNDARY
LANDFILL

STEEL
PACKAGING
TRANSPORT TO BRING
BANK
COLLECTION FROM BRING
BANK
KERBSIDE COLLECTION
FOR RECYCLING
SORTING + BALING
TRANSPORT TO REPROCESSOR
(STEEL MILL)
COLLECTION FOR
LANDFILL
COLLECTION FOR
INCINERATION
TRANSPORT TO REPROCESSOR
METALS RECOVERY FROM INCINERATION
STEEL PACKAGING FROM HOUSEHOLD
CREDIT AGAINST VIRGIN
PRODUCTION
STEEL PRODUCTION (ELECTRIC ARC OR OXYGEN FURNACE
MSW
INCINERATION
LANDFILL
SYSTEM BOUNDARY

WASTE BEVERAGE
CARTONS
TESTLINER (CREDIT AGAINST KRAFTLINER)
TESTLINER PRODUCTION
REJECTS (PE + AL) TO
LANDFILL
SORTING + BALING
Energy Electricity
(av European undelivered from landfill
gas collection)
LANDFILL
COLLECTION FOR
LANDFILL
REJECTS (PE + AL) TO MSW
INCINERATION
REPULPING PROCESS
COLLECTION FROM BRING
BANK
KERBSIDE COLLECTION
FOR RECYCLING
CONSUMER TRANSPORT
TO BRING BANK
COMPOSITE BEVERAGE CARTONS FROM HOUSEHOLD
Electricity Production
(av European undelivered)
MSW
INCINERATION
COLLECTION FOR
INCINERATION
SYSTEM BOUNDARY

RIGID + SEMI-RIGID
ALUMINIUM PACKAGING
CREDIT AGAINST VIRGIN
PRODUCTION
MATERIALS RECOVERY FROM
INCINERATION
MSW
INCINERATION
LANDFILL
RIGID AND SEMI-RIGID ALUMINIUM PACKAGING FROM HOUSEHOLD
COLLECTION FROM BRING
BANK
TRANSPORT TO BRING
BANK
RECYCLING + PRODUCTION
(SCRAP PREPARATIONSMELTING AND
ALLOYING)
SORTING + BALING
TRANSPORT TO REPROCESSOR
KERBSIDE COLLECTION
FOR RECYCLING
COLLECTION FOR
INCINERATION
COLLECTION FOR
LANDFILL
SYSTEM BOUNDARY

LDPE FILMS
LDPE FILMS ARISING FROM INDUSTRIAL SOURCES
Credit to LDPE FILM
FILM RECYCLING
TRANSPORT TO REPROCESSOR
COLLECTION AND BALING
FOR RECYCLING
Electricity Production
(av European undelivered)
MSW
INCINERATION
COLLECTION FOR
INCINERATION
LANDFILL
COLLECTION FOR
LANDFILL
SYSTEM BOUNDARY

CORRUGATEDBOARD
Energy Electricity
(av European undelivered from landfill gas collection)
Electricity Production
(av European undelivered)
CORRUGATED BOARD ARISING FROM INDUSTRIAL SOURCES
TESTLINER (CREDIT AGAINST KRAFTLINER)
TESTLINER PRODUCTION
(Screening, Pulping,
Papermaking)
COLLECTION FOR
RECYCLING
MSW
INCINERATION
COLLECTION FOR
INCINERATION
SYSTEM BOUNDARY
LANDFILL
COLLECTION FOR
LANDFILL
WASTE PET
BOTTLES
COLLECTION FROM BRING
BANK TRANSPORT TO
BRING BANK
PET GRANULATE
PET RECYCLING
SORTING +
BALING
TRANSPORT TO REPROCESSOR
KERBSIDE COLLECTION
FOR RECYCLING
Electricity Production
(av European undelivered)
MSW
INCINERATION
LANDFILL
COLLECTION FOR
LANDFILL
COLLECTION FOR
INCINERATION
PET BOTTLES FROM HOUSEHOLD
SYSTEM BOUNDARY

GLASS
SORTING
GLASS BOTTLES FROM HOUSEHOLD
COLLECTION FROM BRING
BANK
TRANSPORT TO BRING
BANK GLASS
RECYCLING TRANSPORT TO REPROCESSOR
CREDIT AGAINST
LOW
MSW
INCINERATION
COLLECTION FOR
INCINERATION
LANDFILL
COLLECTION FOR
LANDFILL
SYSTEM BOUNDARY
GLASS
BOTTLE
PRODUCTION
TRANSPORT
TO FILLER FILLING
TRANSPORT/
DISTRIBUTION
WASHING
TRANSPORT
TO WASHING SOR
RECYCLING
OF PLASTIC
CRATES
REUSE OF
PLASTIC
CRATES
REUSABLE
PLASTIC
CRATE
PROCESS TREE: GLASS BOTTLES RETUR E
NABL
USE
TRANSPORT
TO BRING
BANK
COLLECTION
FROM
INCINERATION
COLLECTION
FROM BRING
BANK
SORTING
TRANSPORT
TO
RECYCLERS
RECYCLING
MSW
INCINERATION
TINGTRANSPORT
TO SORTING
RETURN +
DEPOSIT
MATERIAL
CREDIT
COLLECTION
FOR LANDFILL LANDFILL

GLASS
BOTTLE
PRODUCTION
TRANSPORT
TO FILLER FILLING
TRANSPORT/
DISTRIBUTION
RECYCLING
OF
SECONDARY
PACKAGING
SECONDARY
PACKAGING –
CORRUGATED
BOAR
MATERIAL
CREDITS
PROCESS TREE: GLASS BOTTLES SIN RIP
GLE T
USE
TRANSPORT
TO BRING
BANK
COLLECTION
FROM
INCINERATION
COLLECTION
FROM BRING
BANK
SORTING
TRANSPORT
TO
RECYCLERS
RECYCLING
MSW
INCINERATION
MATERIAL
CREDIT
D
COLLECTION
FOR LANDFILL LANDFILL

PET BOTTLE
PRODUCTION TRANSPORT
TO FILLER
TRANSPORT/
DISTRIBUTIONUSE
COLLECTION
FROM
INCINERATION
SEPARATE
KERSIDE
COLLECTION
SORTING
TRANSPORT
TO
RECYCLERS
RECYCLING
MSW
INCINERATION
RECYCLING
OF
SECONDARY
PACKAGING
SECONDARY
PACKAGING –
CARTONBOARD,
FILM
PROCESS TREE: PET BOTTLES SINGLE TRIP
MATERIAL
CREDIT
COLLECTION
FOR LANDFILL LANDFILL MATERIAL
CREDITS
FILLING

MATERIAL
CREDIT
PET BOTTLE
PRODUCTION TRANSPORT
TO FILLER FILLING
TRANSPORT/
DISTRIBUTIONUSE
COLLECTION
FROM
INCINERATION
SORTING
TRANSPORT
TO
RECYCLERS
RECYCLING
MSW
INCINERATION
WASHING
TRANSPORT
TO WASHING SORTINGTRANSPORT
TO SORTING
RETURN +
DEPOSIT
SEPARATE
KERBSIDE
COLLECTION
RECYCL
OF PLAS
CRATE
REUSE OF
PLASTIC
CRATES
PLASTIC
CRATES
PROCESS TREE: PET BOTTLES RETURNABLE
ING
COLLECTION
FOR LANDFILL LANDFILL
TIC
S
"Evaluation of costs and benefits for the achievement of reuse and recycling targets for the different packaging materials in the frame of the packaging and packaging waste directive 94/62/EC" – Final consolidated report,
RDC-Environment & Pira International, March 2003
Annex 2: Incineration and landfill models
- 17 -

"Evaluation of costs and benefits for the achievement of reuse and recycling targets for the different packaging materials in the frame of the packaging and packaging waste directive 94/62/EC" – Final consolidated report,
RDC-Environment & Pira International, March 2003
1 NON SELECTIVELY COLLECTED MSW COLLECTION SYSTEM
The grey bag is collected
• twice a week in high population density areas and
• once a week in low population density areas.
Collection vehicle is a truck with a volume of 16m³.
Employment and internal costs were determined by Beture Environnement [46].
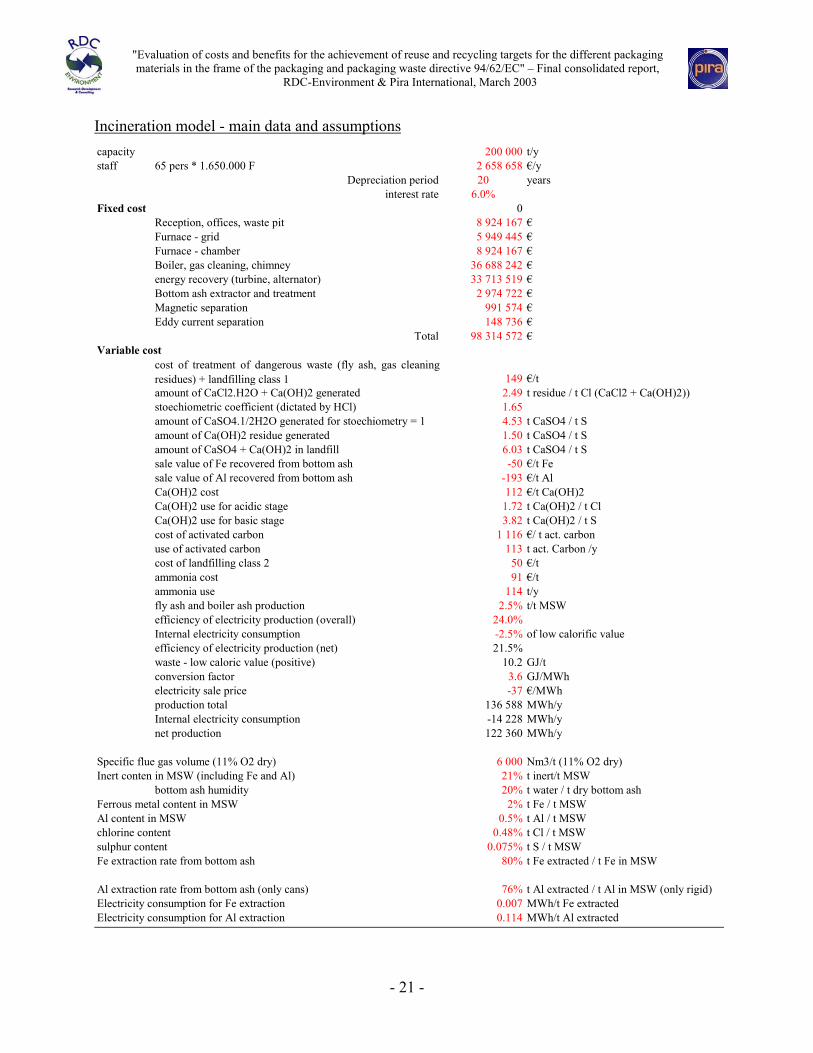
2 INCINERATION MODEL
Pira Int. developed the incineration model shown in Figure 1.
Figure 1 : Incineration model
Activated carbonOn Site
vehical
Waste to Incineration
hydrogen chloride as HCl
HCl Acid
Sodium Hydroxide
electricity to grid
fly ash
ammonia
bottom ash
Sludge/cake
Incineration (Paper &
Board)General
Waste water treatment
Energy Conversion
Use of Heat
HEAT, natural
gas
HEAT, Heating oil
Gas, natural, delivered,
Europe
Oil, heating,
low sulphur,
Incinerator Capital
- 18 -

"Evaluation of costs and benefits for the achievement of reuse and recycling targets for the different packaging materials in the frame of the packaging and packaging waste directive 94/62/EC" – Final consolidated report,
RDC-Environment & Pira International, March 2003
2.1 Internal costs data
Allocation rules for the incineration cost
The allocation principle is to find a causal link between the waste composition and the
incineration cost.
The possible bases for the allocation are :
*
*
*
*
The waste volume (or mass when only mass data are available and it is difficult to determine
the density) : to be used for the processes concerned when the waste is transported and stored
The stoechiometric oxygen demand for full combustion (or fume volume or waste calorific
value) : to be used for the processes concerned when the waste produces heat and flue gas
The waste inert content : to be used for the processes concerning the waste combustion
residues
The pollutant concentration : to be used for the flue gas cleaning
Next tables give the allocation rules and the data and assumptions.
- 19 -

"Evaluation of costs and benefits for the achievement of reuse and recycling targets for the different packaging materials in the frame of the packaging and packaging waste directive 94/62/EC" – Final consolidated report,
RDC-Environment & Pira International, March 2003
Allocation baseA. Fixed cost
Construction
Reception, offices, waste pit mass
Furnace
grid mass
chamber stoichiometric oxygen demand for full combustion
Boiler, gas cleaning, chimney stoichiometric oxygen demand for full combustion
energy recovery (turbine, alternator) caloric value
Bottom ash extractor and treatment inert content
Magnetic separation Ferrous metal content
Eddy current separation Non ferrous metal content
Maintenance and replacement of pieces proportional to construction cost
Personnel proportional to construction cost
B. Variable costElectricity consumption stoichiometric oxygen demand for full combustion
Disposal of
Fly ash ash content
Boiler ash ash content
Bottom ash inert content
Gas cleaning residues
for acidic stage chlorine content
for basic stage sulphur content
activated carbon stoichiometric oxygen demand for full combustion
Consumption of additives
Activated carbon stoichiometric oxygen demand for full combustion
CaO for acidic stage chlorine content
CaO for basic stage sulphur content
Ammonia De-Nox stoichiometric oxygen demand for full combustion
C. Variable revenuesElectricity production calorific valueFerrous metals Ferrous metal contentNon Ferrous metals (Al) Non ferrous metal content
Cost Item
should be volume but very complicated to apply
- 20 -
"Evaluation of costs and benefits for the achievement of reuse and recycling targets for the different packaging materials in the frame of the packaging and packaging waste directive 94/62/EC" – Final consolidated report,
RDC-Environment & Pira International, March 2003
Incineration model - main data and assumptions capacity t/ystaff 65 pers * 1.650.000 F €/y
Depreciation period yearsinterest rate
Fixed cost 0Reception, offices, waste pit €Furnace - grid €Furnace - chamber €Boiler, gas cleaning, chimney €energy recovery (turbine, alternator) €Bottom ash extractor and treatment €Magnetic separation €Eddy current separation €
Total €Variable cost
cost of treatment of dangerous waste (fly ash, gas cleaningresidues) + landfilling class 1 €/tamount of CaCl2.H2O + Ca(OH)2 generated t residue / t Cl (CaCl2 + Ca(OH)2))stoechiometric coefficient (dictated by HCl)amount of CaSO4.1/2H2O generated for stoechiometry = 1 t CaSO4 / t Samount of Ca(OH)2 residue generated t CaSO4 / t Samount of CaSO4 + Ca(OH)2 in landfill t CaSO4 / t Ssale value of Fe recovered from bottom ash €/t Fesale value of Al recovered from bottom ash €/t AlCa(OH)2 cost €/t Ca(OH)2Ca(OH)2 use for acidic stage t Ca(OH)2 / t ClCa(OH)2 use for basic stage t Ca(OH)2 / t Scost of activated carbon €/ t act. carbonuse of activated carbon t act. Carbon /ycost of landfilling class 2 €/tammonia cost €/tammonia use t/yfly ash and boiler ash production t/t MSWefficiency of electricity production (overall)Internal electricity consumption of low calorific valueefficiency of electricity production (net) 21.5%waste - low caloric value (positive) 10.2 GJ/tconversion factor GJ/MWhelectricity sale price €/MWhproduction total 136 588 MWh/yInternal electricity consumption -14 228 MWh/ynet production 122 360 MWh/y
Specific flue gas volume (11% O2 dry) Nm3/t (11% O2 dry)Inert contentin MSW (including Fe and Al) t inert/t MSW
bottom ash humidity t water / t dry bottom ashFerrous metal content in MSW t Fe / t MSWAl content in MSW t Al / t MSWchlorine content t Cl / t MSWsulphur content t S / t MSWFe extraction rate from bottom ash t Fe extracted / t Fe in MSW
Al extraction rate from bottom ash (only cans) t Al extracted / t Al in MSW (only rigid)Electricity consumption for Fe extraction MWh/t Fe extractedElectricity consumption for Al extraction MWh/t Al extracted
200 0002 658 65820
6.0%
8 924 1675 949 4458 924 167
36 688 24233 713 519
2 974 722991 574148 736
98 314 572
1492.491.654.531.506.03-50
-193112
1.723.82
1 116113
5091
1142.5%
24.0%-2.5%
3.6-37
6 00021%20%
2%0.5%
0.48%0.075%
80%
76%0.0070.114
- 21 -
"Evaluation of costs and benefits for the achievement of reuse and recycling targets for the different packaging materials in the frame of the packaging and packaging waste directive 94/62/EC" – Final consolidated report,
RDC-Environment & Pira International, March 2003
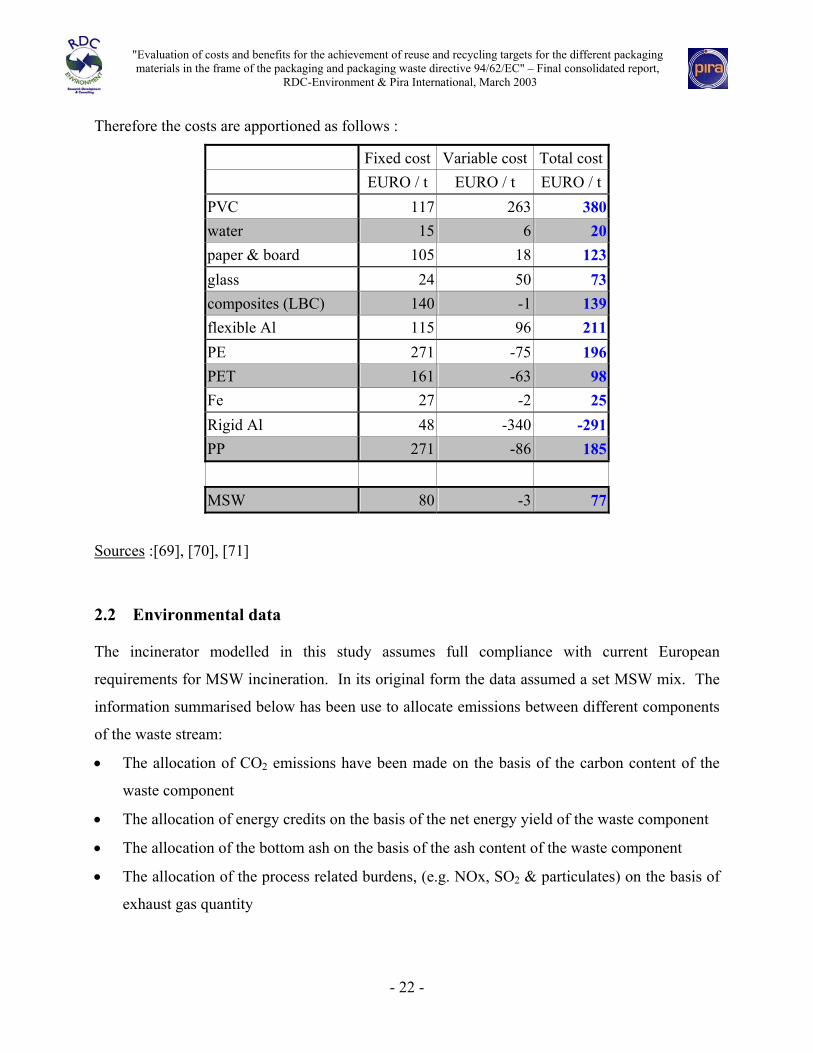
Therefore the costs are apportioned as follows :
Fixed cost Variable cost Total cost EURO / t EURO / t EURO / t
PVC 117 263 380 water 15 6 20 paper & board 105 18 123 glass 24 50 73 composites (LBC) 140 -1 139 flexible Al 115 96 211 PE 271 -75 196 PET 161 -63 98 Fe 27 -2 25 Rigid Al 48 -340 -291 PP 271 -86 185
MSW 80 -3 77
Sources :[69], [70], [71]
2.2 Environmental data
The incinerator modelled in this study assumes full compliance with current European
requirements for MSW incineration. In its original form the data assumed a set MSW mix. The
information summarised below has been use to allocate emissions between different components
of the waste stream:
• The allocation of CO2 emissions have been made on the basis of the carbon content of the
waste component
• The allocation of energy credits on the basis of the net energy yield of the waste component
• The allocation of the bottom ash on the basis of the ash content of the waste component
• The allocation of the process related burdens, (e.g. NOx, SO2 & particulates) on the basis of
exhaust gas quantity
- 22 -
"Evaluation of costs and benefits for the achievement of reuse and recycling targets for the different packaging materials in the frame of the packaging and packaging waste directive 94/62/EC" – Final consolidated report,
RDC-Environment & Pira International, March 2003
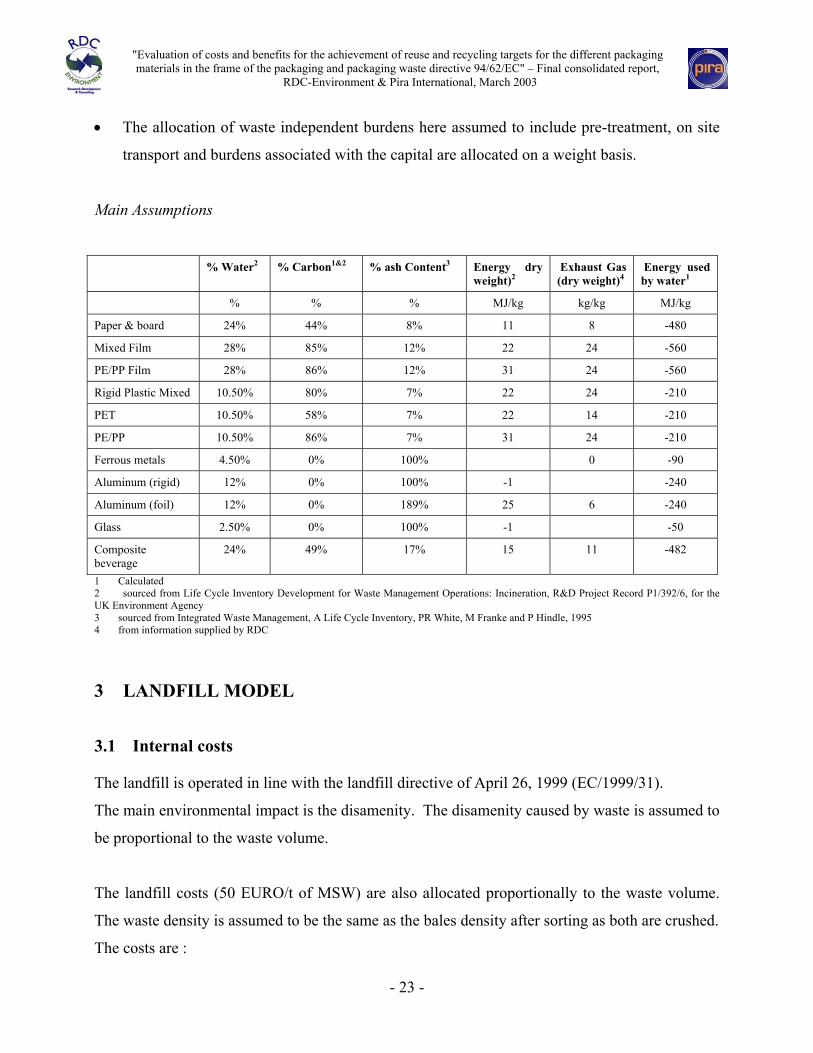
• The allocation of waste independent burdens here assumed to include pre-treatment, on site
transport and burdens associated with the capital are allocated on a weight basis.
Main Assumptions
% Water2 % Carbon1&2 % ash Content3 Energy dry weight)2
Exhaust Gas (dry weight)4
Energy used by water1
% % % MJ/kg kg/kg MJ/kg
Paper & board 24% 44% 8% 11 8 -480
Mixed Film 28% 85% 12% 22 24 -560
PE/PP Film 28% 86% 12% 31 24 -560
Rigid Plastic Mixed 10.50% 80% 7% 22 24 -210
PET 10.50% 58% 7% 22 14 -210
PE/PP 10.50% 86% 7% 31 24 -210
Ferrous metals 4.50% 0% 100% 0 -90
Aluminum (rigid) 12% 0% 100% -1 -240
Aluminum (foil) 12% 0% 189% 25 6 -240
Glass 2.50% 0% 100% -1 -50
Composite beverage
24% 49% 17% 15 11 -482
1 Calculated 2 sourced from Life Cycle Inventory Development for Waste Management Operations: Incineration, R&D Project Record P1/392/6, for the UK Environment Agency 3 sourced from Integrated Waste Management, A Life Cycle Inventory, PR White, M Franke and P Hindle, 1995 4 from information supplied by RDC
3 LANDFILL MODEL
3.1 Internal costs
The landfill is operated in line with the landfill directive of April 26, 1999 (EC/1999/31).
The main environmental impact is the disamenity. The disamenity caused by waste is assumed to
be proportional to the waste volume.
The landfill costs (50 EURO/t of MSW) are also allocated proportionally to the waste volume.
The waste density is assumed to be the same as the bales density after sorting as both are crushed.
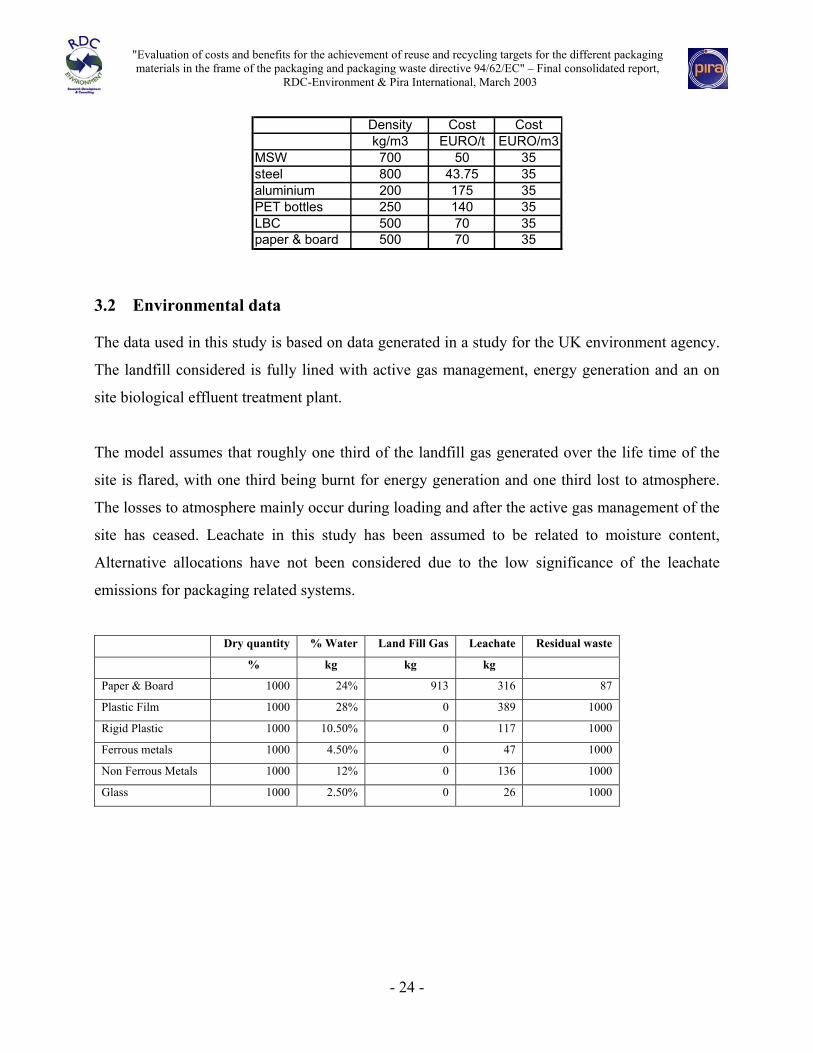
The costs are :
- 23 -
"Evaluation of costs and benefits for the achievement of reuse and recycling targets for the different packaging materials in the frame of the packaging and packaging waste directive 94/62/EC" – Final consolidated report,
RDC-Environment & Pira International, March 2003
Density Cost Costkg/m3 EURO/t EURO/m3
MSW 700 50 35steel 800 43.75 35aluminium 200 175 35PET bottles 250 140 35LBC 500 70 35paper & board 500 70 35
3.2 Environmental data
The data used in this study is based on data generated in a study for the UK environment agency.
The landfill considered is fully lined with active gas management, energy generation and an on
site biological effluent treatment plant.
The model assumes that roughly one third of the landfill gas generated over the life time of the
site is flared, with one third being burnt for energy generation and one third lost to atmosphere.
The losses to atmosphere mainly occur during loading and after the active gas management of the
site has ceased. Leachate in this study has been assumed to be related to moisture content,
Alternative allocations have not been considered due to the low significance of the leachate
emissions for packaging related systems.
Dry quantity % Water Land Fill Gas Leachate Residual waste
% kg kg kg
Paper & Board 1000 24% 913 316 87
Plastic Film 1000 28% 0 389 1000
Rigid Plastic 1000 10.50% 0 117 1000
Ferrous metals 1000 4.50% 0 47 1000
Non Ferrous Metals 1000 12% 0 136 1000
Glass 1000 2.50% 0 26 1000
- 24 -

"Evaluation of costs and benefits for the achievement of reuse and recycling targets for the different packaging materials in the frame of the packaging and packaging waste directive 94/62/EC" – Final consolidated report,
RDC-Environment & Pira International, March 2003
Annex 3: Internal cost data
- 25 -

"Evaluation of costs and benefits for the achievement of reuse and recycling targets for the different packaging materials in the frame of the packaging and packaging waste directive 94/62/EC" – Final consolidated report,
RDC-Environment & Pira International, March 2003
Costs for Landfilling 1 tonne PET bottles
Euro per tonne of packaging Collection costs Landfill costs Total internal costs
High population density 294 140 434
Low population density 234 140 374
Costs for Landfilling 1 tonne glass bottles
Euro per tonne of packaging Collection costs Landfill costs Total internal costs
High population density 99.3 73.1 172.5
Low population density 79.1 73.1 152.2
Costs for Landfilling 1 tonne steel packaging
Euro per tonne of packaging Collection costs Landfill costs Total internal costs
High population density 88.2 43.8 132
Low population density 68.4 43.8 112.2
Costs for Landfilling 1 tonne rigid and semi - rigid aluminium packaging
Euro per tonne of packaging Collection costs Landfill costs Total internal costs
High population density 490 175 665
Low population density 380 175 555
Costs for Landfilling 1 tonne paper & board packaging
Euro per tonne of packaging Collection costs Landfill costs Total internal costs
High population density 78.8 70 148.8
Low population density 61.1 70 131.1
Costs for Landfilling 1 tonne Liquid Beverage Cartons
Euro per tonne of packaging Collection costs Landfill costs Total internal costs
High population density 126 70 196
Low population density 98 70 168
- 26 -

"Evaluation of costs and benefits for the achievement of reuse and recycling targets for the different packaging materials in the frame of the packaging and packaging waste directive 94/62/EC" – Final consolidated report,
RDC-Environment & Pira International, March 2003
Costs for Landfilling 1 tonne mix plastics packaging
Euro per tonne of packaging Collection costs Landfill costs Total internal costs
High population density 294 140 434
Low population density 228 140 368
Costs for Incineration of 1 tonne PET bottles
Euro per tonne of packaging
Collection costs Incineration – fixed costs
Incineration – variable costs
Total internal costs
High pop. density 294 161 -63 392 Low pop. density 228 161 -63 326
Costs for Incineration of 1 tonne glass bottles
Euro per tonne of packaging
Collection costs Incineration – fixed costs
Incineration – variable costs
Total internal costs
High pop. density 99.3 24 50 173.3 Low pop. density 79.1 24 50 152.1
Costs for Incineration of 1 tonne steel packaging
Euro per tonne of packaging
Collection costs Incineration – fixed costs
Incineration – variable costs
Total internal costs
High pop. density - no slag recovery
88.2 73* 161.2
High pop. density - slag recovery
88.2 27 -2 113.2
Low pop. density - slag recovery
68.4 73* 141.4
Low pop. density - slag recovery
68.4 27 -2 93.4
- 27 -

"Evaluation of costs and benefits for the achievement of reuse and recycling targets for the different packaging materials in the frame of the packaging and packaging waste directive 94/62/EC" – Final consolidated report,
RDC-Environment & Pira International, March 2003
Costs for Incineration of 1 tonne rigid and semi-rigid aluminium packaging
Euro per tonne of packaging
Collection costs
Incineration – fixed costs
Incineration – variable costs
Total internal costs
High pop. density with no slag recovery
490 73* 563
High pop. density with slag recovery (cans)
490 48 -340 198
High pop. density with slag recovery (rigid/semi rigid)
490 48 -206 332
Low pop. density with no slag recovery
380 73* 453
Low pop. density with slag recovery (cans)
380 48 -340 88
Low pop. density with slag recovery (rigid/semi rigid)
380 48 -206 222
Costs for Incineration of 1 tonne Paper & Board packaging
Euro per tonne of packaging
Collection costs Incineration – fixed costs
Incineration – variable costs
Total internal costs
High pop. density 78.8 105 18 201.8 Low pop. density 61.1 105 18 184.1
Costs for Incineration of 1 tonne Liquid Beverage Cartons
Euro per tonne of packaging
Collection costs Incineration – fixed costs
Incineration – variable costs
Total internal costs
High pop. density 126 140 -1 265 Low pop. density 98 140 -1 237
Costs for Incineration of 1 tonne mix plastics packaging
Euro per tonne of packaging
Collection costs Incineration – fixed costs
Incineration – variable costs
Total internal costs
High pop. density 294 271 -75 490 Low pop. density 228 271 -75 424
- 28 -

"Evaluation of costs and benefits for the achievement of reuse and recycling targets for the different packaging materials in the frame of the packaging and packaging waste directive 94/62/EC" – Final consolidated report,
RDC-Environment & Pira International, March 2003
Costs for Recycling 1 tonne of PET bottles via separate kerbside collection
Collection costs (Euro per tonne of PET bottles recycled)
Sorting costs (Euro per tonne of PET bottles recycled)
Transport from sorting plant to reprocessor (Euro per tonne of PET bottles recycled)
Reprocessing cost (Euro per tonne of output)
Revenue received for reprocessed material
Total internal cost per tonne PET bottles recycled
High pop. density 255 474 46 332 -540* 566 Low pop. density 306 474 46 332 -540 618 *corresponding to a 540-332-46 = 162 EURO/t at the outlet of the sorting plant. This value is representative for the 2001 market situation. It is supposed to be more representative of the situation in 2006 than the average value over the last years (1998-2000) because the market has not been stable and prices did not reflect the real cost in an efficient market.
Costs for Recycling 1 tonne PET bottles via bring bank collection
Transport costs from bring bank to sorting plant (Euro per tonne of PET bottles recycled)
Sorting costs (Euro per tonne of PET bottles recycled)
Transport from sorting plant to reprocessor (Euro per tonne of PET bottles recycled)
Reprocessing cost (Euro per tonne of output)
Revenue received for reprocessed material
Total internal cost per tonne PET bottles recycled
High pop. density 196 474 46 332 -540 508 Low pop. density 242 474 46 332 -540 553
Costs for Recycling 1 tonne glass bottles via bring bank collection
transport from bring bank to sorting plant recycling (cullets preparation) transport from recycling to glass factory Total internal cost per tonne Glass bottles recycled
High pop. density 31 20.6 4.9 56.5 Low pop. density 37 20.6 4.9 62.5
Costs for Recycling 1 tonne of steel packaging via separate kerbside collection
Euro per tonne of steel recycled Collection costs Sorting costs Transport from sorting plant to reprocessor Revenue received for material ready for use in steel production
Total internal cost
High population density 83.5 75.4 22.9 -34 147.8 Low population density 100.5 75.4 22.9 -34 164.8
- 29 -

"Evaluation of costs and benefits for the achievement of reuse and recycling targets for the different packaging materials in the frame of the packaging and packaging waste directive 94/62/EC" – Final consolidated report,
RDC-Environment & Pira International, March 2003
Costs for Recycling 1 tonne steel packaging via bring bank collection
Euro per tonne of steel recycled Transport costs from bring bank to sorting plant
Sorting costs Transport from sorting plant to reprocessor
Revenue received for material ready for use in steel production
Total internal cost
High population density 64.4 75.4 22.9 -34 128.7 Low population density 79.2 75.4 22.9 -34 143.5
Costs for Recycling 1 tonne of rigid and semi-rigid aluminium packaging via separate kerbside collection
Euro per tonne of aluminium sorted Collection costs Sorting costs Transport from sorting plant to reprocessor Revenue received for material ready for use in Al production
Total internal cost
High population density 178.3 571.9 53.4 -316 487.6 Low population density 214.6 571.9 53.4 -316 523.9
Costs for Recycling 1 tonne rigid and semi-rigid aluminium packaging via bring bank collection
Euro per tonne of aluminium sorted
Transport costs from bring bank to sorting plant
Sorting costs Transport from sorting plant to reprocessor Revenue received for material ready for use in Al production
Total internal cost
High population density 137.4 571.9 53.4 -316 446.7 Low population density 169.1 571.9 53.4 -316 478.4
Costs for Recycling 1 tonne of Paper & Board packaging via separate kerbside collection
Euro per tonne of paper & board Collection costs Sorting costs Transport from sorting plant to reprocessor Revenue received for baled paper Total internal cost
High population density 41.2 35 22.9 -21.6 77.5 Low population density 49.6 35 22.9 -21.6 85.9
- 30 -

"Evaluation of costs and benefits for the achievement of reuse and recycling targets for the different packaging materials in the frame of the packaging and packaging waste directive 94/62/EC" – Final consolidated report,
RDC-Environment & Pira International, March 2003
Costs for Recycling 1 tonne Paper & Board packaging via bring bank collection
Euro per tonne of paper & board
Transport costs from bring bank to sorting plant
Sorting costs Transport from sorting plant to reprocessor
Revenue received for baled paper Total internal cost
High population density 34 35 22.9 -21.6 70.3 Low population density 41 35 22.9 -21.6 77.3
Costs for Recycling 1 tonne of Liquid Beverage Cartons via separate kerbside collection (incineration of rejects)
Euro per tonne of LBC sorted
Collection costs Sorting costs Transport fromsorting plant to reprocessor
Revenues from bales
Reprocessing costs
Revenues from paper product
Costs - revenues of incineration of rejects (euro/t rejects)
Total internal cost
High pop. density 146.2 302.3 22.9 -20 433 -455 57 486.4 Low population density
175.9 302.3 22.9 -20 433 -455 57 516.1
Costs for Recycling 1 tonne Liquid Beverage Cartons via bring bank collection (incineration of rejects)
Euro per tonne of LBC sorted
Transport costs from bring bank to sorting plant
Sorting costs
Transport from sorting plant to reprocessor
Revenues from bales
Reprocessing costs
Revenues frompaper product
Costs - revenues of incineration of rejects (euro/t rejects)
Total internal cost
High pop. density 112.6 302.3 22.9 -20 433 -455 57 452.8 Low pop. density 138.6 302.3 22.9 -20 433 -455 57 478.8
Costs for Recycling 1 tonne of Liquid Beverage Cartons via separate kerbside collection (landfilling of rejects)
Euro per tonne of LBC sorted
Collection costs
Sorting costs
Transport from sorting plant to reprocessor
Revenues fromrecycling
Reprocessing costs
Revenues from paper product
Costs - revenues of landfilling of rejects (euro/t rejects)
Total internal cost
High population density
146.2 302.3 22.9 -20 433 -455 38.2 467.6
Low population density
175.9 302.3 22.9 -20 433 -455 38.2 497.3
- 31 -
"Evaluation of costs and benefits for the achievement of reuse and recycling targets for the different packaging materials in the frame of the packaging and packaging waste directive 94/62/EC" – Final consolidated report,
RDC-Environment & Pira International, March 2003
- 32 -
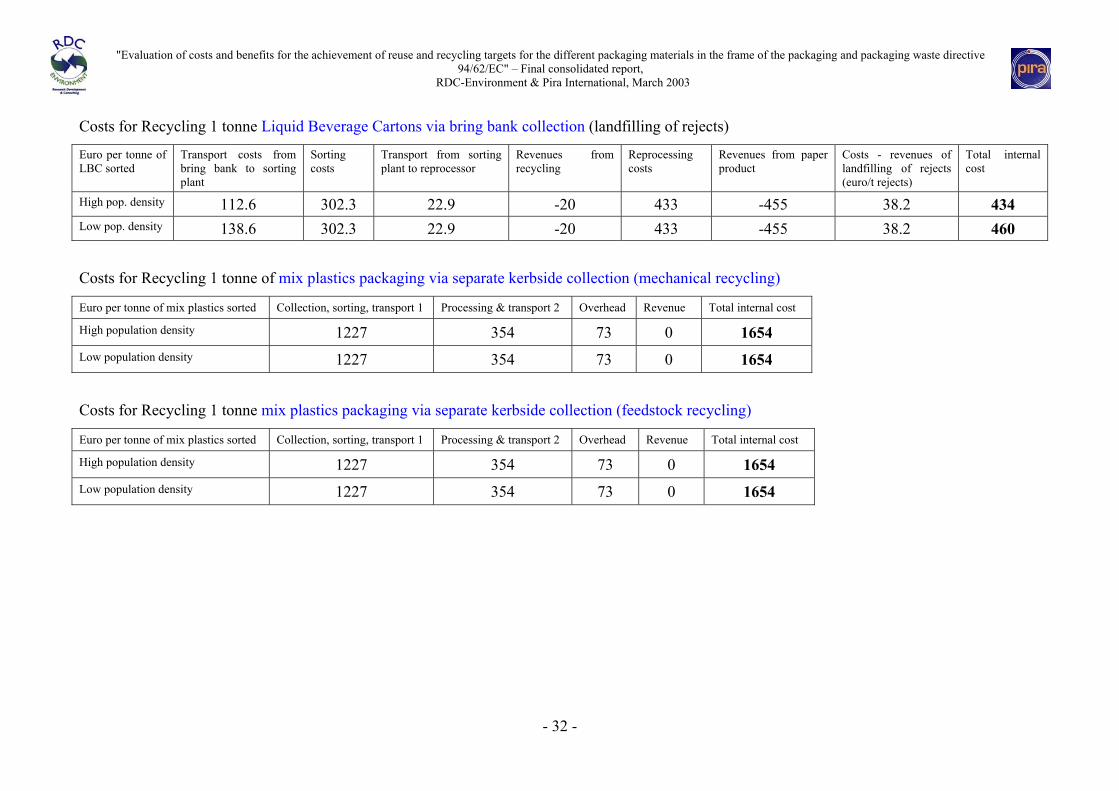
Costs for Recycling 1 tonne Liquid Beverage Cartons via bring bank collection (landfilling of rejects)
Euro per tonne of LBC sorted
Transport costs from bring bank to sorting plant
Sorting costs
Transport from sorting plant to reprocessor
Revenues fromrecycling
Reprocessing costs
Revenues from paper product
Costs - revenues of landfilling of rejects (euro/t rejects)
Total internal cost
High pop. density 112.6 302.3 22.9 -20 433 -455 38.2 434 Low pop. density 138.6 302.3 22.9 -20 433 -455 38.2 460
Costs for Recycling 1 tonne of mix plastics packaging via separate kerbside collection (mechanical recycling)
Euro per tonne of mix plastics sorted Collection, sorting, transport 1 Processing & transport 2 Overhead Revenue Total internal cost
High population density 1227 354 73 0 1654 Low population density 1227 354 73 0 1654
Costs for Recycling 1 tonne mix plastics packaging via separate kerbside collection (feedstock recycling)
Euro per tonne of mix plastics sorted Collection, sorting, transport 1 Processing & transport 2 Overhead Revenue Total internal cost
High population density 1227 354 73 0 1654 Low population density 1227 354 73 0 1654
"Evaluation of costs and benefits for the achievement of reuse and recycling targets for the different packaging materials in the frame of the packaging and packaging waste directive 94/62/EC" – Final consolidated report,
RDC-Environment & Pira International, March 2003
Annex 4: Economic valuations applied – sources and
derivation
- 33 -

"Evaluation of costs and benefits for the achievement of reuse and recycling targets for the different packaging materials in the frame of the packaging and packaging waste directive 94/62/EC" – Final consolidated report,
RDC-Environment & Pira International, March 2003
1 INTRODUCTION
The cost benefit analysis methodology used in the study is based on a life cycle assessment to
determine the environmental impacts of the selected systems, and economic valuation to
convert these environmental impacts into monetary values. The underlying characterisation
tables used are included in Table 1 (annex 4bis). Table 2 (annex 4bis) contains data on a range
of valuation and moneterisation methods, including the values applied in this study.
The environmental costs and benefits are summed to determine the total externality.
In parallel to this, the internal costs of the system are determined. The internal costs of the
system are the total costs minus the total revenues.
The externalities and internal costs of the system are summed to determine the total social
cost of the system.
The detail of determining environmental costs is discussed in the sections below.
The economic valuations applied in this study have been sourced by Pieter van Beukering of
IVM (Institute for Environmental Studies, University of Amsterdam) unless otherwise
indicated. The economic valuations have been sourced from a variety of reports and
documents. As far as possible, damage cost values are applied. However, where necessary
prevention costs have been used.
2 ENVIRONMENTAL IMPACTS
LCA is used to determine the environmental impacts of the system. The quantitative life
cycle inventory is generated. Characterisation and classification is then applied to the
inventory data. Characterisation assigns each environmental input and output (the inventory
data) to the environmental impacts to which it may potentially contribute. Classification then
applies a weighting factor according to the potential level of impact relative to a specific
reference emission. For example, the reference emission for global warming is CO2. The
weighting applied to CO2 is therefore 1. All other emissions which contribute to CO2 are
weighted relative to their CO2 equivalence. For example, the effect of global warming caused
- 34 -

"Evaluation of costs and benefits for the achievement of reuse and recycling targets for the different packaging materials in the frame of the packaging and packaging waste directive 94/62/EC" – Final consolidated report,
RDC-Environment & Pira International, March 2003
by a 1kg emission of methane is 21 times greater than the effect caused by 1kg of CO2.
Therefore methane is given a classification of 21.
The impact assessment data is then converted to monetary values through the application of
economic valuations to each individual impact category. The impact categories considered
and the impact assessment methodology applied have been developed with a consideration of
the needs of the economic valuations then applied. In some cases, this influences the type of
inventory data that is required in order to make a complete external economic analysis.
The sections below and accompanying tables detail the classification values and economic
valuations applied.
2.1 Global warming
Global warming is characterised in CO2 equivalents. The classification values applied -Time
Horizon 100 years - are taken from figures given in Climate Change 1995 (Contribution of
WG1 to IPPC second assessment report). The two principal contributors to this category are
carbon dioxide and methane with a GWP of 1 and 21 respectively.
The valuation stage is based on the most recent estimates from the FUND II model (Tol and
Downing 2000, FUND2 model, forthcoming).
Tol and Downing report the following marginal damages expressed per tonne of carbon (tC
not tCO2):
Pure time preference rate = 0% $75
Pure time preference rate = 1% $46
Pure time preference rate = 3% $16
Applying a 5% pure time preference rate, a value for GWP of US$46 tC, or US$12.5tCO2
(converted to 13.44 Euro per tonne CO2) is considered for this study.
As global warming is not site specific, the emissions from different processes can be directly
summed. Overlap with other environmental effects can be ignored. One issue of potential
importance is that of the time horizon over which the emissions occur (i.e. in incineration
immediately and in landfill over many years). This issue has not been addressed directly in
- 35 -
"Evaluation of costs and benefits for the achievement of reuse and recycling targets for the different packaging materials in the frame of the packaging and packaging waste directive 94/62/EC" – Final consolidated report,
RDC-Environment & Pira International, March 2003
the method applied, however previous studies suggest that application of a time dependant
analysis is of low significance. Where global warming is critical in the results and time issues
might be significant then the issue will be addressed in sensitivity analysis.
New classification figures are due to be released shortly from the IPPC’s Third assessment
report but these were not available in time to be included in this study.
2.2 Ozone depletion
This category is typically unimportant for packaging waste systems, it is quantified in CFC 11
equivalents : The classification values applied are based on those in Climate Change 1995
and are listed in Annex 4 bis. The economic valuation applied to the impact assessment data
is 680 Euro per tonne of CFC 11 equivalents. This is based on an estimated cost, associated
with increased radiation, of 177 billion dollars and cumulative emissions of an estimated 200
billion kg and should be considered as very approximate. This value has been derived by Pira
International specifically for inclusion in this study.
2.3 Human toxicity (Carcinogens)
Toxicity (carcinogens) refers to carcinogenic airborne emissions. Toxicity (carcinogens) is
quantified in Cd equivalents. The classification values applied to carcinogenic emissions are
listed in Annex 4 bis. The economic valuation applied to the impact assessment data is 22
140 Euro per tonne of Cd equivalents. This value is the average of the range of damage costs
reported by Dorland et al, 2000. The range reported is 5774 – 38498 Euro per tonne.
The range applies to damages to human health by emissions of cadmium arising from
production processes and electricity production.
2.4 Human toxicity (Smog)
Toxicity (smog) relates to the production of ozone in the troposphere and is characterised in
Ethylene equivalents based on the values developed by Harwell Laboratories (Derwent &
Jenkin, 1990). NOx which also contributes to the formation of low level ozone is given a
- 36 -

"Evaluation of costs and benefits for the achievement of reuse and recycling targets for the different packaging materials in the frame of the packaging and packaging waste directive 94/62/EC" – Final consolidated report,
RDC-Environment & Pira International, March 2003
value equivalent to 1.19kg ethylene/kg. The classification values applied to emissions that
contribute to Toxicity (smog) are listed in Annex 4 bis.
The economic valuation applied to the impact assessment data is 734 Euro per tonne of
Ethylene equivalents. The valuation is for VOC indirect impacts through ozone formation, as
reported in Dorland et al, (2000). The value refers to damages to human health by emissions
of production processes and electricity generation.
2.5 Human Toxicity (particulates)
Toxicity (particulates) refers to airborne emissions typically generated and measured directly,
such as PM10 or indirectly through the production of aerosols (Sulphate & Nitrate). Toxicity
(particulates) is measured in PM10 equivalents. The classification values applied to
emissions that contribute to Toxicity (particulates) are listed in Annex 4 bis. The economic
valuation applied to the impact assessment data is 23686 Euro per tonne of PM10 equivalents,
as reported in Dorland et al, (2000). This value is for emissions of PM10 (directly emitted).
The value refers to damages to human health by emissions arising from production processes
and electricity generation.
2.6 Human toxicity (Other air)
Toxicity (Other air) refers to airborne emissions which have toxic effects, other than
carcinogenic effects or effects caused by smog or particulates. Toxicity (other air) is
quantified in SO2 equivalents. The classification values applied to emissions that contribute
to this category are based on their relative human toxicity value and are listed in Annex 4 bis.
The economic valuation applied to the impact assessment data is 1002 Euro per tonne of SO2
equivalents. This value is non-specific and based on general non-transport related emissions.
Should this category prove important then a sensitivity analysis will be conducted to consider
the significantly higher burden associated with SO2 emitted from vehicles (over 2000
Euro/tonne).
- 37 -

"Evaluation of costs and benefits for the achievement of reuse and recycling targets for the different packaging materials in the frame of the packaging and packaging waste directive 94/62/EC" – Final consolidated report,
RDC-Environment & Pira International, March 2003
2.7 Acidification
Acidification is quantified in Acid equivalents (H+). The classification values applied to
emissions that contribute to acidification are listed in Annex 4 bis. The economic valuation
applied to the impact assessment data is 8.7 Euro per kg of Acid equivalents equivalent to
0.27 Euro/kg of SO2. This value excludes the costs due to damage to buildings but includes
damage to crops, forestry and lakes (see Table 1).
Table 1
Crop Damage Dorland et al. (2000)
Forests (EC 1995)
Lakes (EC 1995)
Total
0.215 0.036 0.015 0.27/kg SO2 = 8.7/kg H+ equiv.
2.8 Damage to structures
Damage to structures refers to soiling of buildings caused by black smoke. The definition of
black smoke is based on chemical properties of particles rather than on particle size, so the
size composition of black smoke can vary considerably. However, roughly speaking black
smoke consists of particles with a diameter of less than 15µm.
Damage to structures is measured in dust equivalents: The classification values applied to
emissions that contribute to Damage to structures are listed in Annex 4 bis. The economic
valuation applied to the impact assessment data is 662 Euro per tonne of dust equivalents.
This value is sourced from Dorland et al 2000 who determine a damage cost of 662 Euro per
tonne of particulate emitted in the form of black smoke. This value is calculated by Pieter van
Beukering, estimated based on the total UK emissions of black smoke and an assessment of
the size of the UK market for cleaning buildings that is completely attributable to soiling from
particle pollution (as reported in Newby et al 1991).
In the methodology applied in this analysis, no distinction is made between emissions arising
from processes and emissions arising from transport.
- 38 -
"Evaluation of costs and benefits for the achievement of reuse and recycling targets for the different packaging materials in the frame of the packaging and packaging waste directive 94/62/EC" – Final consolidated report,
RDC-Environment & Pira International, March 2003
2.9 Fertilisation
Deposited nitrogen has a beneficial effect on crop yields because it acts as a fertiliser. The
level of this externality is determined by the value of the yield increase due to the deposited
nitrogen. Pieter van Beukering provides a value of –697 Euro per tonne of NOx (expressed as
NO2 mass equivalents). It is uncertain whether these fertilisation effects are sustainable in the
long term.
The classification values applied to emissions that contribute to Fertilisation are listed in
Annex 4 bis.
2.10 Traffic accidents
The economic valuation applied to traffic accidents in this study has been calculated by Pira
International specifically for this project.
Traffic accidents is quantified in Car km equivalents. The classification values applied to
different road types are listed in Annex 4 bis and based on UK transport statistics. Little
evidence was found in these statistics of a difference between HGV/Commercial vehicles and
passenger cars in terms of the accidents or deaths/km driven (see Table 2).
- 39 -

"Evaluation of costs and benefits for the achievement of reuse and recycling targets for the different packaging materials in the frame of the packaging and packaging waste directive 94/62/EC" – Final consolidated report,
RDC-Environment & Pira International, March 2003
Table 2
Rate of Serious & Fatal Accidents/ 100 million vehicle km Car 12 Light Van 10 Goods Vehicle 12
Road type however is significant - motorways being considerably safer. The higher value for
rural roads seems counter intuitive - however Rural roads are defined here as roads with a
speed restriction above 40 mph (~64 km/h). The overall accident rate goes counter to this with
urban roads having a rate more than twice as high. (See Table 3)
Table 3
Fatalities 1999
Serious Accidents
Total road traffic billion vehicle km
Deaths /billion vehicle km
Serious Accidents /billion vehicle km
Characterisation (fatality equivalent)
Characterisation - Serious accident equivalent.
Motorway 176 1218 83.6 2.1 14.6 0.31 0.19 Urban 1338 23011 200.2 6.7 114.9 1.00 1.47 Rural 1621 12176 183.3 8.8 66.4 1.32 0.85 All 3135 36405 467.1 6.7 77.9 1.00 1.00
The methodology assumes that the average European situation follows the UK situation and
uses the characterisation values above to combine the different road types.
The serious accident figures are being excluded; firstly because the low valuation of injury
versus fatality means that it becomes insignificant and secondly because there is a risk of
double counting as the statistics for serious accidents include accidents, which led to fatalities.
The economic valuation applied to the impact assessment data is 16.9 Euro per 1000 km
travelled on an average road.
2.11 Traffic congestion
The external costs of congestion result from various effects. The most important costs are the
time costs of delay. Indirect effects include increased emissions levels and danger in traffic.
Traffic congestion is quantified in Car km equivalents with a HGV or van equivalent to 2
cars. The differentiation between road types is based on UK data. The classification values
- 40 -

"Evaluation of costs and benefits for the achievement of reuse and recycling targets for the different packaging materials in the frame of the packaging and packaging waste directive 94/62/EC" – Final consolidated report,
RDC-Environment & Pira International, March 2003
applied are listed in Annex 4 bis. The economic valuation applied to the impact assessment
data is 85.5 Euro per 1000 car km equivalents.
Brossier (1996) estimates the marginal congestion costs of trucks averaged over a year on
“National roads” at 17.1 Euro per 100 HGV km. No description of the term “national roads”
is provided, but assuming that this refers to a typical UK A road (rather than an urban road)
this gives an economic value of 8.55 Euro per 100 car km equivalents.
2.12 Traffic Noise
Noise is any unwanted sound. The main source of noise in recycling systems is transport and
disposal sites. The noise externality of landfill sites is included in the disamenity value of
landfilling (Section 2.14), so the focus of this impact category is transport related noise. In
many EU countries, transport is the most pervasive source of noise in the environment
(Houghton 1994).
It is difficult to relate noise or noise nuisance to a parameter that is quantifiable in a life cycle
study. The impact pathway is complex with many influencing factors. However, as waste
disposal and recycling activities involve a considerable amount of transport. The disamenity
of noise from transport cannot be neglected. Therefore, an attempt to quantify this important
impact has been made for the purposes of this study.
Two types of noise exist:
♦ Acute noise – arising from the operation of heavy machinery, and therefore mainly related
to occupational health
♦ Nuisance noise – less sudden noise, such as that experienced by people living near a main
road or rail track. The effects can include impairment of communication, loss of
concentration and loss of sleep.
The actual damage of noise has three forms:
♦ Property value reductions
♦ Productivity loss resulting due to medical complaints of workers
♦ Damage to ecosystems (frightened wildlife)
- 41 -

"Evaluation of costs and benefits for the achievement of reuse and recycling targets for the different packaging materials in the frame of the packaging and packaging waste directive 94/62/EC" – Final consolidated report,
RDC-Environment & Pira International, March 2003
An overview of available hedonic and contingent valuations is presented in Table 4.
Table 4 : Summary of studies on the WTP to halve the noise exposure level
Study Hedonic valuation (in Euro) Contingent valuation (in Euro) Pommerehne (1988) 51 46 Iten and Maggi (1988) 43 - Willeke et al (1990) - 81 Soguel (1994) 37 35-42
Source: Soguel 1994
Even though two different techniques are applied, the estimates are within the same range.
Assuming a linear relationship between WTP and noise exposure, the average WTP for a
reduction of noise exposure is 3.8 Euro per dB(A).
Kageson (1993) determines the noise costs for road transport at 2-3 Euro per 1000 km and
passenger km, and rail transport at 0.5 – 0.7 Euro per 1000 km.
For this study, “Traffic noise” is quantified in Car km equivalents, using the economic value
of 3 Euro per 1000 car km equivalents. The classification values applied to different
transportation modes are listed in Annex 4 bis.
2.13 Water Quality – Eutrophication
Several difficulties exist in transferring the external effects of surface water pollution for
externalities occurring in recycling processes. Firstly, most values are presented in an
aggregated manner, whereas waste related and recycling processes are valued on a marginal
basis. Secondly, transferability is hampered by demographic differences. Most water
pollution studies have been conducted in Scandinavian countries. Thirdly, the type of water
pollution may differ from the type of water contamination. Forth, there remains a lack of
reliable dose-response function information.
In this study, Water Quality – Eutrophication is quantified in P equivalents. The classification
values applied to water borne emissions that contribute to Eutrophication are listed in Annex
4 bis. The economic valuation applied to the impact assessment data is 4700 Euro per tonne P
- 42 -

"Evaluation of costs and benefits for the achievement of reuse and recycling targets for the different packaging materials in the frame of the packaging and packaging waste directive 94/62/EC" – Final consolidated report,
RDC-Environment & Pira International, March 2003
equivalents. This is derived from Gren et al (1996), and is based on the costs of increased
abatement capacity at sewage or industrial plants necessary to reduce these emissions.
2.14 Disamenity
Disamenity effects of waste management processes are likely to make up a significant share
of the externalities caused. In particular, landfill sites and incineration facilities generate
substantial social costs to their neighbouring population. The disamenity may take a number
of forms:
♦ Increased traffic noise (see Section 2.12 for details of valuation applied)
♦ Increased traffic congestion (see Section 2.11 for details of valuation applied)
♦ Odour and visual pollution
♦ (Perceived) increased health risk
A common approach to determine disamenity effects is to use variations in house prices
(hedonic price method). In this study, the externality of increased traffic noise and congestion
are valued separately. Changes in house price are assumed to relate to odour and visual
disamenity only, as these aspects are not valued elsewhere in the methodology. It should be
highlighted that this approach may lead to potential double counting of some of the
externalities.
Several hedonic price method studies on the value of disamenity effects of landfill have been
performed. Landfilling and incineration produce different effects, and therefore should be
assigned different externalities. Households are reluctant to live near an incinerator due to the
perceived health effects of emissions. Disamenity of landfill is caused by the perception of
groundwater pollution, and the visual pollution and odour nuisance. However, as no
valuation data have been found to distinguish between their waste management practices the
overall disamenity value for landfilling and incineration has been assumed to be equal.
All studies identify a significant house price reduction due to the existence of waste sites
nearby. House prices increase approximately 3-4% per kilometre distance from a landfill site,
within a radius of approximately 5.5 km.
- 43 -

"Evaluation of costs and benefits for the achievement of reuse and recycling targets for the different packaging materials in the frame of the packaging and packaging waste directive 94/62/EC" – Final consolidated report,
RDC-Environment & Pira International, March 2003
Similarly, Contingent valuation studies demonstrate that WTP1 declines with distance to the
facility. An important determinant of WTP is income and perception of the risk of leachate
pollution of water supplies. Households with a high income whose water supplies were at
risk are willing to pay substantially more than low-income households dependent on piped
city-water. However, the CVM2 findings are generally consistent with the findings of the
HPM3.
Based on the literature, the following linear regression equation is determined (Brisson and
Pearce 1995): ∆ HP = 12.8 – 2.34 * D
(∆ HP = the percentage change in house price, D = distance in km from facility)
This suggests a maximum house price depreciation of 12.8% at the site of the facility, with no
price differential beyond 5.5 km.
Based on the disamenity function, the annual value of reduction in the real estate prices can be
calculated. Graph 1 shows how this varies substantially considering five categories of
household density and five levels of average house price. The overall values are converted to
annual values by taking 8% of the total reduction.
Graph 1
To link variations in the life cycle and economic valuation, external costs are then calculated
on a per unit basis. This step in the analysis is uncommon – in reality the disamenity is not
1 Willingness To Pay 2 Contingent Valuation Method 3 Hedonic Price Method
- 44 -

"Evaluation of costs and benefits for the achievement of reuse and recycling targets for the different packaging materials in the frame of the packaging and packaging waste directive 94/62/EC" – Final consolidated report,
RDC-Environment & Pira International, March 2003
determined by the quantity of waste processed by the facility, but by the simple existence of
the facility. However, to facilitate a link disamenity value is assumed to be proportional to
the total amount of waste processed. Values reported in the literature vary from 1.2 Euro per
tonne for a study relating to landfilling in Minnesota (IIED 1996) to 10.6 Euro per tonne for a
study in Milan, Italy (Ascari and Cernischi 1996). These differences may arise due to the
processing capacities of the facilities.
Table 5 determines the annual disamenity value of 1 tonne of landfilled and incinerated solid
waste. However, due to the potential influence of the simplifying assumptions, such as the
uniform disamentiy value for landfill and incinerator, and the neglect of income elasticity,
these values should be treated with caution. Ideally, the values should be determined on a
marginal basis and considering local circumstances such as average house price, population
density and processing capacity.
- 45 -

"Evaluation of costs and benefits for the achievement of reuse and recycling targets for the different packaging materials in the frame of the packaging and packaging waste directive 94/62/EC" – Final consolidated report,
RDC-Environment & Pira International, March 2003
Table 5 : Calculation of disamenity valuation per tonne of solid waste
Annual processing capacity (ton / annum)
Total disamenity (million Euro)***
Disamenity per unit of waste (Euro per tonne)
Landfill* 200000 7.4 37 Incinerator** 730000 7.4 10
* Total capacity estimated at 4 million tonnes over 20 year life time ** Total capacity estimated at 10 million tonnes over a 14 year life time *** Based on an average house price of Euro 100000 and a density of 250 houses per km2
2.15 Heavy metals (airborne)
An accurate valuation is not available for this category. However a crude approximation has
been generated by Pira International specifically for this study, by dividing the estimated total
damage cost by the total emissions. Dubourg (1996) estimates that airborne Pb was
responsible for 62 deaths in England & Wales in 1987. Taking this figure and multiplying by
3.1 million Euro (the value for a statistical life assumed for this calculation) gives us a total
cost of 192.2 million Euro. Another publication (The Environment in Europe and North
America, Annotated Statistics 1992, Economic Commission for Europe, United Nations
Publication) gives the total emissions of lead in the UK as 3100 tonnes in 1988. This gives us
an economic value of 62 Euro/kg of Pb emitted.
2.16 Employment
Standard economic theory says that it is not possible to create a job without displacing other
employment. The argument is that for every job that is created, some other job is lost – the
reason being that economics assumes full employment in the economy. Any one not in
employment is in a transitional stage between one job and another, rather than being
“involuntarily unemployed”, and has therefore internalised the costs of unemployment in their
decision-making. If you now create a job for this person in recycling, it means that this
person is now not available for the job he/she would have taken if this job hadn’t been
created. There is therefore no social value in creating employment.
However, the fact is that a proportion of the unemployed in Europe are not unemployed
voluntarily (i.e. they are not in a transitional stage, and have not internalised the costs of
- 46 -
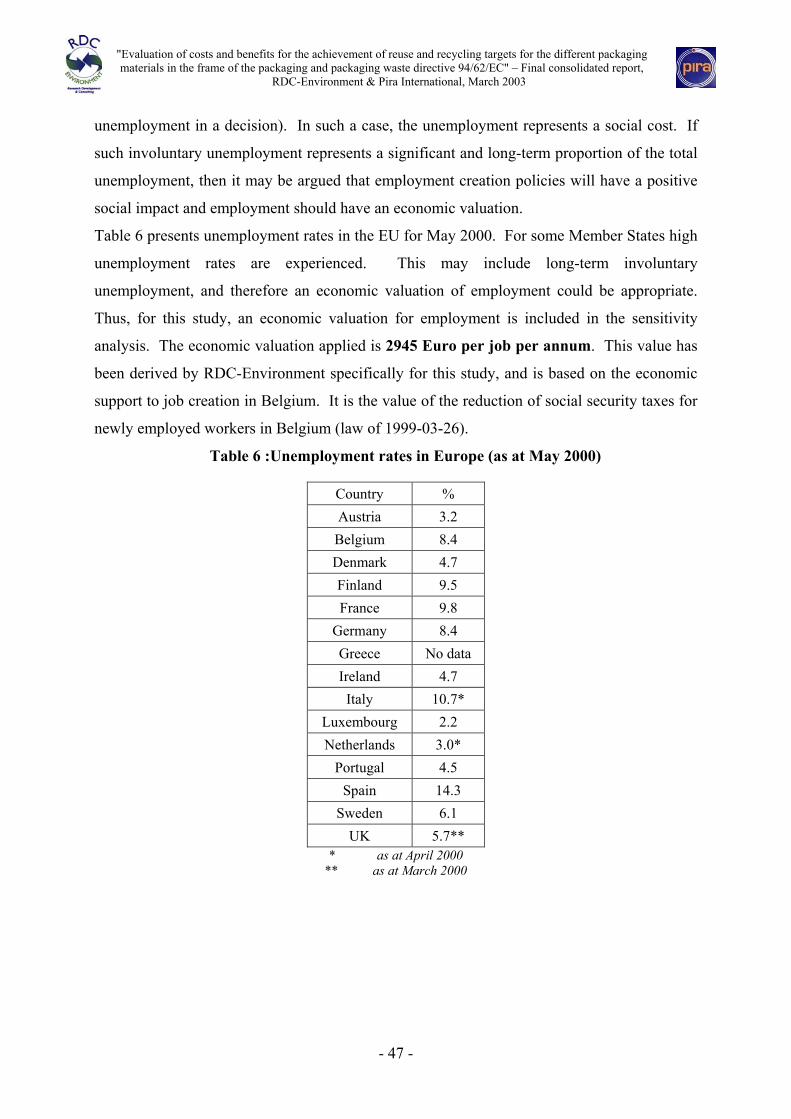
"Evaluation of costs and benefits for the achievement of reuse and recycling targets for the different packaging materials in the frame of the packaging and packaging waste directive 94/62/EC" – Final consolidated report,
RDC-Environment & Pira International, March 2003
unemployment in a decision). In such a case, the unemployment represents a social cost. If
such involuntary unemployment represents a significant and long-term proportion of the total
unemployment, then it may be argued that employment creation policies will have a positive
social impact and employment should have an economic valuation.
Table 6 presents unemployment rates in the EU for May 2000. For some Member States high
unemployment rates are experienced. This may include long-term involuntary
unemployment, and therefore an economic valuation of employment could be appropriate.
Thus, for this study, an economic valuation for employment is included in the sensitivity
analysis. The economic valuation applied is 2945 Euro per job per annum. This value has
been derived by RDC-Environment specifically for this study, and is based on the economic
support to job creation in Belgium. It is the value of the reduction of social security taxes for
newly employed workers in Belgium (law of 1999-03-26).
Table 6 :Unemployment rates in Europe (as at May 2000)
Country % Austria 3.2
Belgium 8.4 Denmark 4.7 Finland 9.5 France 9.8
Germany 8.4 Greece No data Ireland 4.7 Italy 10.7*
Luxembourg 2.2 Netherlands 3.0*
Portugal 4.5 Spain 14.3
Sweden 6.1 UK 5.7**
* as at April 2000 ** as at March 2000
- 47 -

"Evaluation of costs and benefits for the achievement of reuse and recycling targets for the different packaging materials in the frame of the packaging and packaging waste directive 94/62/EC" – Final consolidated report,
RDC-Environment & Pira International, March 2003
3 ALTERNATIVE ECONOMIC VALUATIONS
Economic valuation and cost benefit analysis are developing disciplines. Different
practitioners apply different economic valuations. Some alternative economic valuations are
list in annex 4 bis.
4 REFERENCES
Ascari, S and S Cernischi (1996) Integration of pollutant dispersion modelling and hedonoc
pricing techniques for the evaluation of external costs of waste disposal sites. In: A Baranzini
and F Carlevaro (eds) Econometrics of Environment and Transdisciplinarity (Volume I).
Preceeding of the LIst International Conference of the Applied Econometrics Association
(AEA), Lisbon, April 1-12 1996, 156-173
Brisson IE and D Pearce (1995) Benefits transfer for Disamenity from Waste Disposal. .
CSERGE Working Paper WM95-06. London, Centre for Social and Economic Research of
the Global Environment (CSERGE), University College London
Brossier, C (1996) Mise a jour de l’etude de l’implication des couts d’infrastrucre de
transports, Report for the Ministry of Transport, Paris
Derwent & Jenkin, 1990
Dorland C, AQA Omtzight and AA Olsthoorn (2000), Marginal Costs – The Netherlands, In:
R Friedrich and P Bickel (eds), External Environmental Costs of Transport, University of
Stuttgart
Gren, I-M, T Soderqvist, F Wulff, S Langrass and C Folke (1996) Reduced nutrient loads to
the Baltic Sea: Ecological consequences, costs and benefits. Beijer Discussion Paper Series
No 83, Beijer International Institute of Ecological Ecomonics, The Royal Swedish Academy
of Science, Stockholm
- 48 -

"Evaluation of costs and benefits for the achievement of reuse and recycling targets for the different packaging materials in the frame of the packaging and packaging waste directive 94/62/EC" – Final consolidated report,
RDC-Environment & Pira International, March 2003
Houghton, Sir John (1994) Eighteenth Report Transport and the Environment, Royal
Commission on Environmental Pollution. HMSO, London
IIED (1996), Towards a Sustainable Paper Cycle, International Institute for Environment and
Development / World Business Council for Sustainable Development, London
Intergovernmental Panel on Climate Change (1995) Climate Change 1995 The science of
Climate Change, Contribution of Woking Group 1 to the Second Assessment Report of the
Intergovernmental Panel on Climate Change, Cambridge University Press
Kageson (1993) Getting the Prices Right: a European Scheme for Making Transport Pay its
True Costs. European Federation of Transport and the Environment, T&E 93/6, Stockholm
Newby P T, T A Mandfield and RS Hamilton (1991) Sources and economic implications of
building soiling in urban areas, The Science of the Total Environment, 100, 347
Newbery, DM (1995) Royal Commission Report on Transport and the Environment:
Economic Effects of Recommendations, The Economic Journal. Sept, Oxford, UK
Soguel N, (1994) Measuring benefits from traffic noise reduction using a contingent market.
CSERGE Working Paper WM94-03. London, Centre for Social and Economic Research of
the Global Environment (CSERGE), University College London
R Tol and T Downing, (2000) The Marginal Cost of Climate Changing Gases, Paper 00-08,
Institute for Environmental Studies, Free University of Amsterdam.
- 49 -

Appendix 1 - Characterisation Tables
Burden Name: Multiplier: Notes:
GWP (kg CO2 eq.)carbon tetrachloride -225CFC (unspecified) 1320 assumed as CFC-11CFC-11 1320CO2 (non renewable) 1CO2 (renewable) 1CO2 (unspecified) 1dichloromethane 9haloginated HC (unspecified) 4halon -1301 -49750halons (unspecified) -49750 assumed as halon-1301HCFC (unspecified) 1350 assumed as HFC-22HCFC-22 1350hexafluoroethane 9200HFC (unspecified) 1000methane 21N2O 310tetrafluoromethane 6500tetrafluroethylene 1300trichloroethane -1525trichloromethane 4
Ozone depletion (kg CFC 11 eq.)carbon tetrachloride 1.08CFC (unspecified) 1 assumed as for CFC 11CFC-11 1halon -1301 16halons (unspecified) 0.14 assumed as for Halon-2311HCFC (unspecified) 0.055 assumed as for HCFC 22HCFC-22 0.055trichloroethane 0.12
Acidification (Acid equiv.)acid as H+ (waterborne) 1HCl 0.0274348HF 0.050005NH3 0.0294118NOx 0.0108696SO2 0.03125
Toxicity Carcinogens (Cd equiv)acetaldehyde 0.0000016 acetaldehyde aromatics (unspecified) 0.000019 assumed as benzeneAs 0.18 Arsenic As (soil) 0.098 Arsenic (ind.) As (waterborne) 0.49 Arsenic benzene 0.000019 benzene benzene (waterborne) 0.000031 benzene benzo(a)pyrene 0.029 benzo(a)pyrene benzo(a)pyrene (waterborne) 22butadiene 0.00012 1,3-butadiene carbon tetrachloride 0.0062 carbontetrachloride Cd 1 Cadmium Cd (soil) 0.029 Cadmium (ind.) Cd (waterborne) 0.53 Cadmium
1

Appendix 1 - Characterisation Tables
Burden Name: Multiplier: Notes:Cr (IV) 13 assumed as Cr (6+)Cr (unspecified) 13Cr (unspecified) (soil) 2 Chromium (ind.) Cr (unspecified) (waterborne) 2.5 as Cr IVCr-VI (waterborne) 0.029 Chromium (VI) dichloroethane 0.00022 1-2 dichloroethanedichloromethane 0.0000032 dichloromethane dioxins and furanes (unspecified) 1300 assumed as 2,3,7,8-TCDD Dioxinethylene oxide 0.0014 ethylene oxide formaldehyde 0.0000073 formaldehyde formaldehyde (waterborne) 0.000037 formaldehyde haloginated HC (unspecified) 0.0000032 assumed as dichloromethaneheavy metals (air) 0.039 assumed as metalsinsecticide (unspecified) 0.0026 as lindanelindane 0.0026 gamma-HCH (Lindane) metals (unspecified) 0.039 metals Ni 0.17 Nickel Ni (soil) 0.029 Nickel (ind.) Ni (waterborne) 0.23 Nickel PAH (unspecified) 0.43 as Benzo(a) anthracenePAH (waterborne) 4.9 as Benzo(a) anthraceneparticulate (diesel) 0.000072 particles diesel soot pesticides (unspecified) (waterborn 0.031 gamma-HCH (Lindane) styrene 1.8E-07 styrene tetrachloride-dibenzo-dioxin 1300 2,3,7,8-TCDD Dioxin tetrachloroethene 0.0000036 perchloroethylenetrichloromethane 0.00019 chloroform vinyl chloride 0.0000015 vinyl chloride
Toxicity Metals non carcinogens (Pb equiv.) Relative toxicities taken from Ecoindicator 95B (waterborne) 0.03Ba (waterborne) 0.14Cu (waterborne) 0.005heavy metals (air) 1heavy metals (waterborne) 1 assumed as PbHg 1Hg (waterborne) 10metals (unspecified) 1 assumed as Pbmetals (unspecified) (waterborne) 1 assumed as PbMn 1Mn (waterborne) 0.02Mo (waterborne) 0.14Pb 1Pb (waterborne) 1
Toxicity Gaseous non carcinogens (SO2 equiv.)CO 0.67 Value based on EI99 (Respirotary effects - Egalitarian)H2S 43.59NH3 1.12SO2 1.00
Toxicity Particulates & aerosols (PM10 equiv)NOx 0.2particulate (diesel) 15.7PM10 1SO2 0.24TSP 0.7 Assumed as PM10 *.7
2

Appendix 1 - Characterisation Tables
Burden Name: Multiplier: Notes:
Toxicity Smog (ethylene equiv.)acetaldehyde 1.4acetic acid 1.1 assumed as for Non Methane hydrocarbons (average)acetone 0.47acrolein 1.1 assumed as for Non Methane hydrocarbons (average)alcohols (unspecified) 0.52aldehydes (unspecified) 1.2alkanes (unspecified) 1.1alkenes (unspecified) 2.4aromatics (unspecified) 2benzene 0.5benzo(a)pyrene 1.1 assumed as for Non Methane hydrocarbons (average)butadiene 1.1 assumed as for Non Methane hydrocarbons (average)butane (i) 0.84butane (n) 1.1butane (unspecified) 0.84 assumed as for i-butanebutene 2.6carbon tetrachloride 0.056 assumed as for halogenated hydrocarbons (average)CFC (unspecified) 0.056 assumed as for halogenated hydrocarbons (average)CFC-11 0.056 assumed as for halogenated hydrocarbons (average)cyclic alkanes (unspecified) 1.1 assumed as for Non Methane hydrocarbons (average)dichloromethane 0.027dioxins and furanes (unspecified) 0.056 assumed as for halogenated hydrocarbons (average)esters (unspecified) 0.59ethane 0.22ethanol 0.71ethene 2.7ethers (unspecified) 1.1 assumed as for Non Methane hydrocarbons (average)ethylbenzene 1.6ethylene dichloride 1.1 assumed as for Non Methane hydrocarbons (average)ethylene oxide 1.1 assumed as for Non Methane hydrocarbons (average)ethyne 0.45formaldehyde 1.1haloginated HC (unspecified) 0.056halon -1301 0.056 assumed as for halogenated hydrocarbons (average)halons (unspecified) 0.056 assumed as for halogenated hydrocarbons (average)HC (unspecified) 1HC excl CH4 (unspecified) 1.1HCFC (unspecified) 0.056 assumed as for halogenated hydrocarbons (average)HCFC-22 0.056 assumed as for halogenated hydrocarbons (average)heptane 1.4hexafluoroethane 0.056 assumed as for halogenated hydrocarbons (average)hexane 1.1 assumed as for n-hexaneHFC (unspecified) 0.056 assumed as for halogenated hydrocarbons (average)ketone 0.86mercaptans/smell gas (unspecified 1.1 assumed as for Non Methane hydrocarbons (average)methane 0.019methanol 0.33methyl tert-butyl ether 1.1 assumed as for Non Methane hydrocarbons (average)naphthalene 1.1 assumed as for Non Methane hydrocarbons (average)non methane VOC (unspecified) 1.1 assumed as for Non Methane hydrocarbons (average)NOx 1.2organic acids (unspecified) 1.1 assumed as for Non Methane hydrocarbons (average)PAH (unspecified) 1.1 assumed as for Non Methane hydrocarbons (average)pentane 0.93phenol 1.1 assumed as for Non Methane hydrocarbons (average)phenols (unspecified) 1.1 assumed as for Non Methane hydrocarbons (average)phthalates (unspecified) 1.1 assumed as for Non Methane hydrocarbons (average)propane 1.1propene 2.7propionaldehyde 1.6propionic acid 1.1 assumed as for Non Methane hydrocarbons (average)styrene 1.1 assumed as for Non Methane hydrocarbons (average)tetrachloride-dibenzo-dioxin 0.056 assumed as for halogenated hydrocarbons (average)
3

Appendix 1 - Characterisation Tables
Burden Name: Multiplier: Notes:tetrafluoromethane 0.056 assumed as for halogenated hydrocarbons (average)tetrafluroethylene 0.056 assumed as for halogenated hydrocarbons (average)toluene 1.5trichloroethane 0.056 assumed as for halogenated hydrocarbons (average)trichloromethane 0.056 assumed as for halogenated hydrocarbons (average)VOC 1xylene (unspecified) 2.3 assumed as average xylenexylene(m-) 2.6xylene(o-) 1.8xylene(p-) 2.4
Damage to Structures (kg dust eq.)NOx 0.37particulate (diesel) 1PM10 1SO2 1.06 702 ecu/662 ecuTSP 1 assumed as particulates
FertilisationNOx 1
Traffic accidentsCar (motorway) 0.31 impact supposé en kmCar (rural) 1.32Car (unspecified) 1Car (urban) 1HGV (motorway) 0.31HGV (rural) 1.32HGV (unspecified) 1HGV (urban) 1Road transport (rural) 0.31Road transport (unspecified) 1Road transport (urban) 1
Traffic Congestion (car km equiv.)Car (motorway) 0.08Car (rural) 0.03Car (unspecified) 1Car (urban) 4.9HGV (motorway) 0.15HGV (rural) 0.06HGV (unspecified) 2HGV (urban) 9.8Road transport (rural) 0.06 Car km congestion equiv.Road transport (unspecified) 2 Car km congestion equiv.Road transport (urban) 9.8 Car km congestion equiv.
Traffic Noise (car km equiv.)Car (motorway) 1Car (rural) 1Car (unspecified) 1Car (urban) 1HGV (motorway) 6HGV (rural) 6HGV (unspecified) 6HGV (urban) 6Road transport (rural) 6 Car km noise equiv.Road transport (unspecified) 6 Car km noise equiv.Road transport (urban) 6 Car km noise equiv.
4
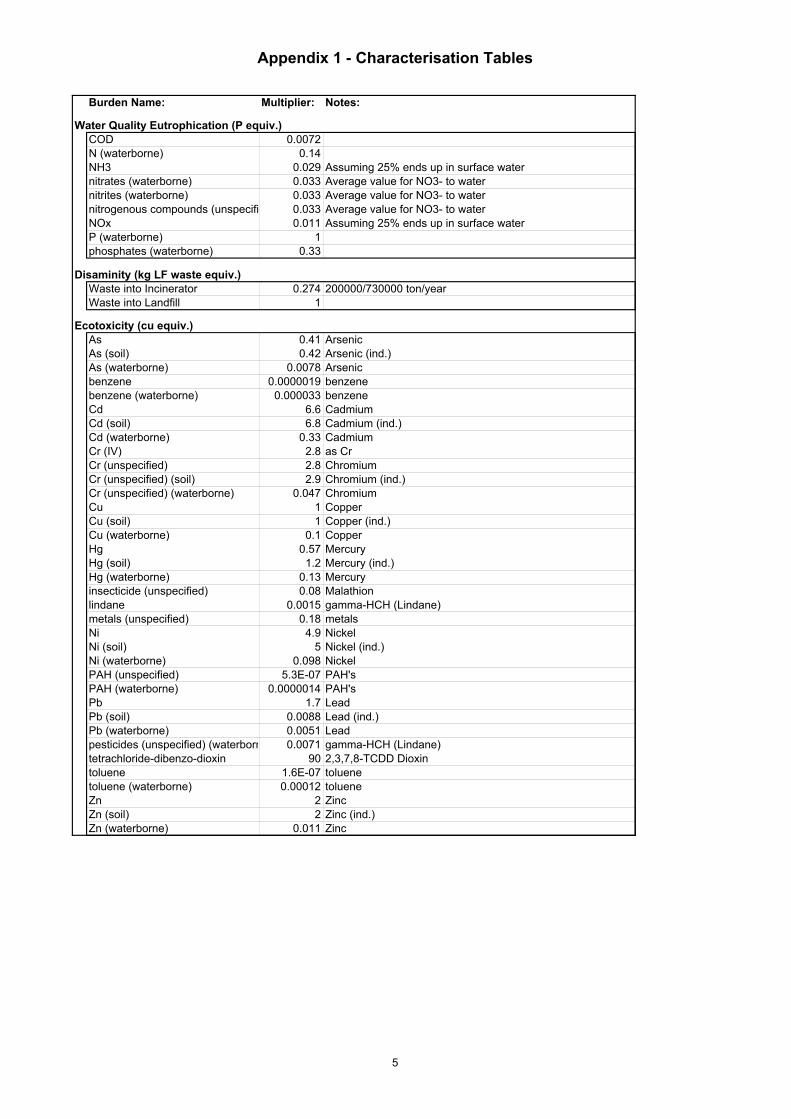
Appendix 1 - Characterisation Tables
Burden Name: Multiplier: Notes:
Water Quality Eutrophication (P equiv.)COD 0.0072N (waterborne) 0.14NH3 0.029 Assuming 25% ends up in surface waternitrates (waterborne) 0.033 Average value for NO3- to waternitrites (waterborne) 0.033 Average value for NO3- to waternitrogenous compounds (unspecifi 0.033 Average value for NO3- to waterNOx 0.011 Assuming 25% ends up in surface waterP (waterborne) 1phosphates (waterborne) 0.33
Disaminity (kg LF waste equiv.)Waste into Incinerator 0.274 200000/730000 ton/yearWaste into Landfill 1
Ecotoxicity (cu equiv.)As 0.41 Arsenic As (soil) 0.42 Arsenic (ind.) As (waterborne) 0.0078 Arsenic benzene 0.0000019 benzene benzene (waterborne) 0.000033 benzene Cd 6.6 Cadmium Cd (soil) 6.8 Cadmium (ind.) Cd (waterborne) 0.33 Cadmium Cr (IV) 2.8 as CrCr (unspecified) 2.8 Chromium Cr (unspecified) (soil) 2.9 Chromium (ind.) Cr (unspecified) (waterborne) 0.047 Chromium Cu 1 Copper Cu (soil) 1 Copper (ind.) Cu (waterborne) 0.1 Copper Hg 0.57 Mercury Hg (soil) 1.2 Mercury (ind.) Hg (waterborne) 0.13 Mercury insecticide (unspecified) 0.08 Malathion lindane 0.0015 gamma-HCH (Lindane) metals (unspecified) 0.18 metals Ni 4.9 Nickel Ni (soil) 5 Nickel (ind.) Ni (waterborne) 0.098 Nickel PAH (unspecified) 5.3E-07 PAH's PAH (waterborne) 0.0000014 PAH's Pb 1.7 Lead Pb (soil) 0.0088 Lead (ind.) Pb (waterborne) 0.0051 Lead pesticides (unspecified) (waterborn 0.0071 gamma-HCH (Lindane) tetrachloride-dibenzo-dioxin 90 2,3,7,8-TCDD Dioxin toluene 1.6E-07 toluene toluene (waterborne) 0.00012 toluene Zn 2 Zinc Zn (soil) 2 Zinc (ind.) Zn (waterborne) 0.011 Zinc
5

Appendix 2 - Moneterisation/Valuation
Avoidance cost from Delft university
(Vogtlander et al 1999)
Avoidance cost from Delft university
(Vogtlander et al 1999)
Ec--Indicator 95
marginal cost (1) average cost (1)
Global Warming Potential /kg CO2 e 0.114 0.08 0.01344
CO2 0.0632 0.0014 0.0018 0.01375 0.003 0.193
CH4 1.548
Acidification 204.8 22.857 1.86 3.27 8.73
SOx 6.4 2.5435 1.03 1.4 0.47 0.06 0.10
NOx 2.0348 0.911 1.16 2.3 16
Photochemical pollution due to VOC 50 3.5 2.0348 3.55 0.734
O3 0.44 0.58 2.5 2.5
Ozone depletion (CFC11) 4.459 0.68
Toxicity : other emissions to air (SO2 equ.) 1.002
CO NA NA 0.0763 NA NA 0.01002
Eutrophication kg Phosphate equi. 3.05 0.0009 NA 2.357 NA 1.5369
COD in water 0.7122 NA NA
Eutrophication kg P equi. 9.327217125 0.002752294 NA NA 4.7
Winter Smog
Particulates (<10 µm) 12.3 5 0.5087 0.39 0.51 1.43 17 29 23.686
SO2
TSP
NOx
Heavy metals (Pb) NA 1571 62
Zn 680 0.3
Toxicity : carcinogenic substances NA NA
PAH 12.3 3837 6022.08
Dioxines NA 2000000 19720319
Arsenic 33 1571.4 44 6.642
Cadnium 9100 12000 78571 81 22.14
Chromium 330 440 314.2 820 128
Nickel 330 1688 17 7.08
Damages to structures (S02) 0.662
Disamenity Landfill 0.037
Disamenity Incinerator 0.01
Traffic accident /1000 km 16.9
Traffic congestion/1000km 86
Traffic noise/1000km 3
Fertilisation (N02 equ.) 0 -0.697
Ecotoxicity
Resource depletion (MJ) 0
Resources - fossil (MJ) 0
Land Use (m2.a) 0
Pira International economic valuation
Environmental damage cost
(Krewitt et al. 1997 and Eyres et al
1997) (max)
Eco-INDICATOR 95 (max)
Impact / Flux Avoidance cost GUA méthodology (CBA) (1)
Eco-INDICATOR 95 (min)
Environmental damage cost
(Krewitt et al. 1997 and Eyres et al
1997) (min)
1
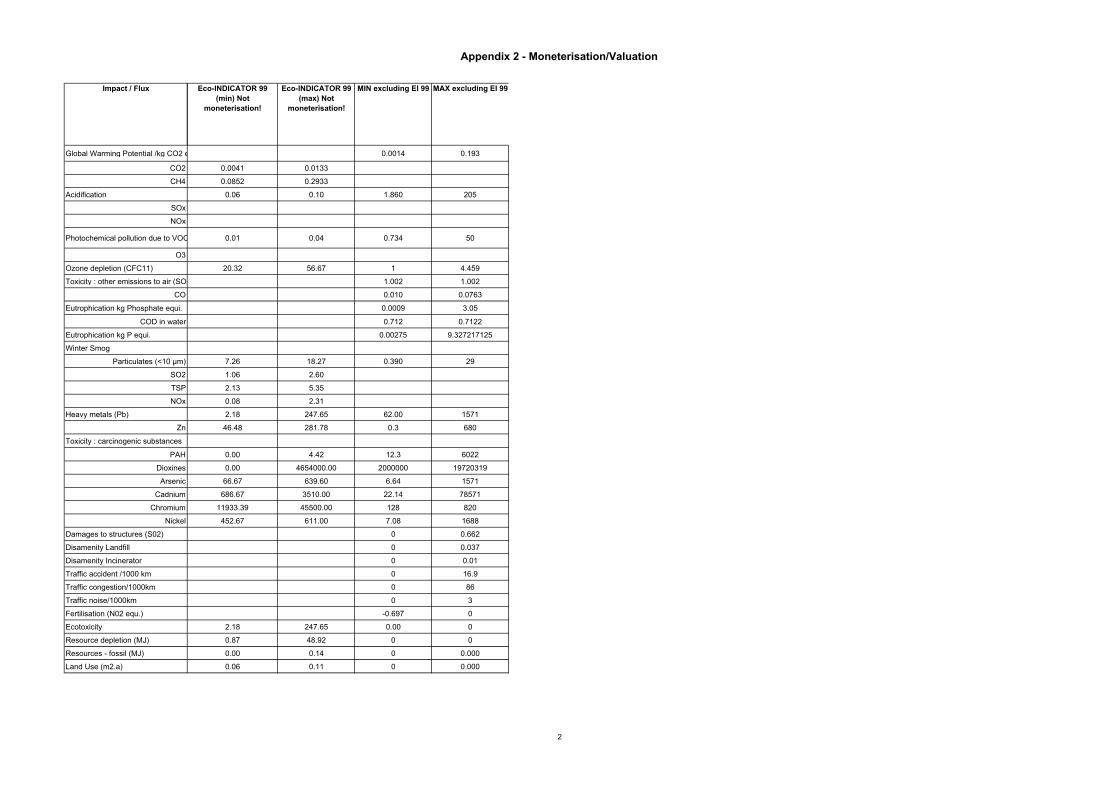
Appendix 2 - Moneterisation/Valuation
Global Warming Potential /kg CO2 e
CO2
CH4
Acidification
SOx
NOx
Photochemical pollution due to VOC
O3
Ozone depletion (CFC11)
Toxicity : other emissions to air (SO2
CO
Eutrophication kg Phosphate equi.
COD in water
Eutrophication kg P equi.
Winter Smog
Particulates (<10 µm)
SO2
TSP
NOx
Heavy metals (Pb)
Zn
Toxicity : carcinogenic substances
PAH
Dioxines
Arsenic
Cadnium
Chromium
Nickel
Damages to structures (S02)
Disamenity Landfill
Disamenity Incinerator
Traffic accident /1000 km
Traffic congestion/1000km
Traffic noise/1000km
Fertilisation (N02 equ.)
Ecotoxicity
Resource depletion (MJ)
Resources - fossil (MJ)
Land Use (m2.a)
Impact / Flux
0.0014 0.193
0.0041 0.0133
0.0852 0.2933
0.06 0.10 1.860 205
0.01 0.04 0.734 50
20.32 56.67 1 4.459
1.002 1.002
0.010 0.0763
0.0009 3.05
0.712 0.7122
0.00275 9.327217125
7.26 18.27 0.390 29
1.06 2.60
2.13 5.35
0.08 2.31
2.18 247.65 62.00 1571
46.48 281.78 0.3 680
0.00 4.42 12.3 6022
0.00 4654000.00 2000000 19720319
66.67 639.60 6.64 1571
686.67 3510.00 22.14 78571
11933.39 45500.00 128 820
452.67 611.00 7.08 1688
0 0.662
0 0.037
0 0.01
0 16.9
0 86
0 3
-0.697 0
2.18 247.65 0.00 0
0.87 48.92 0 0
0.00 0.14 0 0.000
0.06 0.11 0 0.000
Eco-INDICATOR 99 (max) Not
moneterisation!
MAX excluding EI 99MIN excluding EI 99Eco-INDICATOR 99 (min) Not
moneterisation!
2

Appendix 3 - Valuation table
Unit Valuation Min MaxGWP (kg CO2 eq.) € /kg CO2 0.01344 0.0014 0.19Ozone depletion (kg CFC 11 eq.) € /kg CFC11 0.68 0.68 0.68Acidification € /kg H+ 8.70 1.9 200Toxicity Carcinogens (Cd equiv) € /kg Cadmium (carcinogenic effects only) from e 22 22 12000Toxicity Gaseous non carcinogens (SO2 equiv.) € /kg SO2 from electricity production 1 0 1Toxicity Metals non carcinogens (Pb equiv.) € /kg Pb 62 0 62Toxicity Particulates & aerosols (PM10 equiv) € /kg PM10 from electricity production 24 0.39 29Smog (ethylene equiv.) € /kg VOC indirect impacts through ozone formati 0.73 0.73 50Black smoke (kg dust eq.) [damage to structure] €/kg smoke 0.66 0 0.66Fertilisation €/kg expressed as NO2 mass equivalents -0.7 -0.7 0Traffic accidents (risk equiv.) euro/1000 km travelled on an average road 17 0 17Traffic Congestion (car km equiv.) Euro per 1000 car km equivalents 86 0 86Traffic Noise (car km equiv.) Euro per 1000 car km equivalents 3 0 3Water Quality Eutrophication (P equiv.) € /kg P 4.7 0.0028 9.3Disaminity (kg LF waste equiv.) € /kg landfill 0.037 0 0.037
1

"Evaluation of costs and benefits for the achievement of reuse and recycling targets for the different packaging materials in the frame of the packaging and packaging waste directive 94/62/EC" – Final consolidated report,
RDC-Environment & Pira International, March 2003
Annex 5: Employment data –jobs for waste
management activities
- 50 -

"Evaluation of costs and benefits for the achievement of reuse and recycling targets for the different packaging materials in the frame of the packaging and packaging waste directive 94/62/EC" – Final consolidated report,
RDC-Environment & Pira International, March 2003
1 PACKAGING FROM HOUSEHOLD SOURCES
Gross Employment, Landfilling 1 tonne PET bottles
Jobs per 1000 tonne per annum Collection Landfill management / operation Total High population density 1.2 0.1 1.3 Low population density 1.15 0.1 1.25
Gross Employment for Landfilling 1 tonne steel packaging
Jobs per 1000 tonne per annum Collection Landfill management / operation Total High population density 1.2 0.1 1.3 Low population density 1.15 0.1 1.25
Gross Employment for Landfilling 1 tonne rigid and semi - rigid aluminium packaging
Jobs per 1000 tonne per annum Collection Landfill management / operation Total High population density 1.2 0.1 1.3 Low population density 1.15 0.1 1.25
Gross Employment for Landfilling 1 tonne paper & board packaging
Jobs per 1000 tonne per annum Collection Landfill management / operation Total High population density 1.2 0.1 1.3 Low population density 1.15 0.1 1.25
Gross Employment for Landfilling 1 tonne Liquid Beverage Cartons
Jobs per 1000 tonne per annum Collection Landfill management / operation Total High population density 1.2 0.1 1.3 Low population density 1.15 0.1 1.25
Gross Employment for Landfilling 1 tonne mix plastics packaging
Jobs per 1000 tonne per annum Collection Landfill management / operation Total High population density 1.2 0.1 1.3 Low population density 1.15 0.1 1.25
Gross Employment for Landfilling 1 tonne glass
Jobs per 1000 tonne per annum Collection Landfill management / operation Total High population density 1.2 0.1 1.3 Low population density 1.15 0.1 1.25
- 51 -

"Evaluation of costs and benefits for the achievement of reuse and recycling targets for the different packaging materials in the frame of the packaging and packaging waste directive 94/62/EC" – Final consolidated report,
RDC-Environment & Pira International, March 2003
Gross Employment for Incineration of 1 tonne PET bottles
Jobs per 1000 tonne per annum Collection Incinerator management / operation Total High pop. density 1.2 0.27 1.47 Low pop. density 1.15 0.27 1.42
Gross Employment for Incineration of 1 tonne steel packaging
Jobs per 1000 tonne per annum Collection Incinerator management / operation Total High pop. density 1.2 0.27 1.47 Low pop. density 1.15 0.27 1.42
Gross Employment for Incineration of 1 tonne rigid and semi-rigid aluminium packaging
Jobs per 1000 tonne per annum Collection Incinerator management / operation Total High pop. density 1.2 0.27 1.47 Low pop. density 1.15 0.27 1.42
Gross Employment for Incineration of 1 tonne Paper & Board packaging
Jobs per 1000 tonne per annum Collection Incinerator management / operation Total High pop. density 1.2 0.27 1.47 Low pop. density 1.15 0.27 1.42
Gross Employment for Incineration of 1 tonne Liquid Beverage Cartons
Jobs per 1000 tonne per annum Collection Incinerator management / operation Total High pop. density 1.2 0.27 1.47 Low pop. density 1.15 0.27 1.42
Gross Employment for Incineration of 1 tonne mix plastics packaging
Jobs per 1000 tonne per annum Collection Incinerator management / operation Total High pop. density 1.2 0.27 1.47 Low pop. density 1.15 0.27 1.42
Gross Employment for Incineration of 1 tonne glass
Jobs per 1000 tonne per annum Collection Incinerator management / operation Total High pop. density 1.2 0.27 1.47 Low pop. density 1.15 0.27 1.42
- 52 -
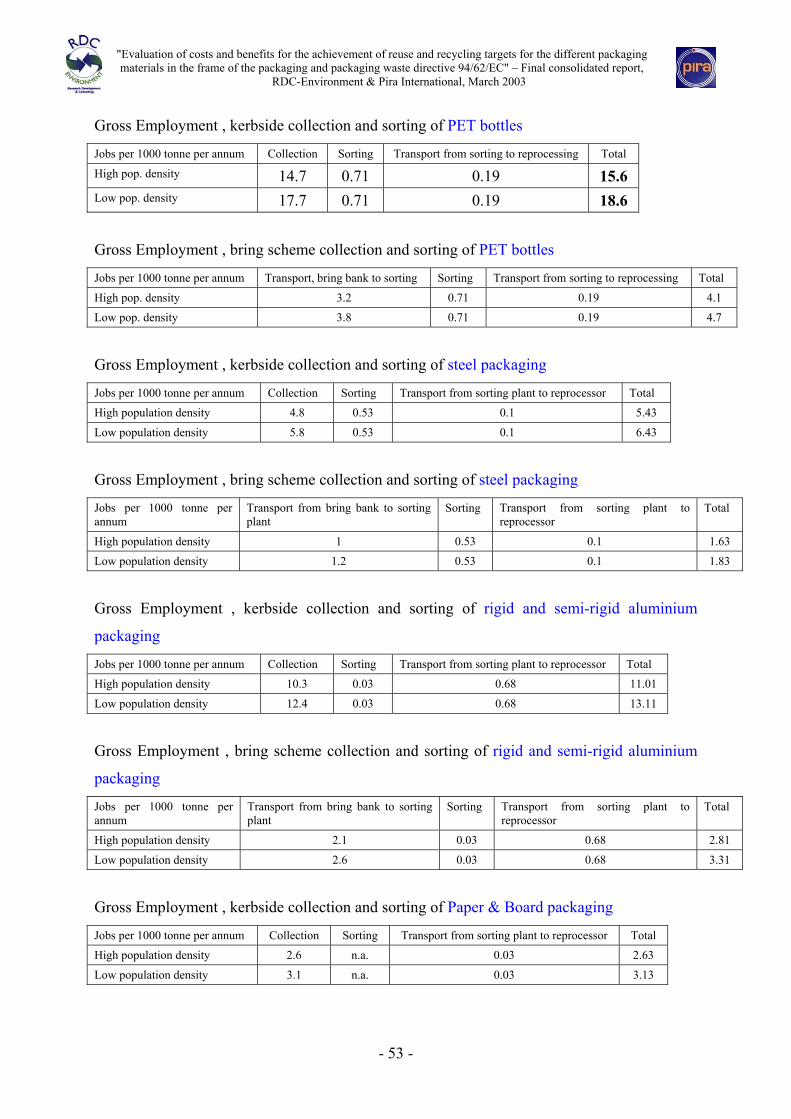
"Evaluation of costs and benefits for the achievement of reuse and recycling targets for the different packaging materials in the frame of the packaging and packaging waste directive 94/62/EC" – Final consolidated report,
RDC-Environment & Pira International, March 2003
Gross Employment , kerbside collection and sorting of PET bottles
Jobs per 1000 tonne per annum Collection Sorting Transport from sorting to reprocessing Total
High pop. density 14.7 0.71 0.19 15.6 Low pop. density 17.7 0.71 0.19 18.6
Gross Employment , bring scheme collection and sorting of PET bottles
Jobs per 1000 tonne per annum Transport, bring bank to sorting Sorting Transport from sorting to reprocessing Total
High pop. density 3.2 0.71 0.19 4.1
Low pop. density 3.8 0.71 0.19 4.7
Gross Employment , kerbside collection and sorting of steel packaging
Jobs per 1000 tonne per annum Collection Sorting Transport from sorting plant to reprocessor Total
High population density 4.8 0.53 0.1 5.43
Low population density 5.8 0.53 0.1 6.43
Gross Employment , bring scheme collection and sorting of steel packaging
Jobs per 1000 tonne per annum
Transport from bring bank to sorting plant
Sorting Transport from sorting plant to reprocessor
Total
High population density 1 0.53 0.1 1.63
Low population density 1.2 0.53 0.1 1.83
Gross Employment , kerbside collection and sorting of rigid and semi-rigid aluminium
packaging
Jobs per 1000 tonne per annum Collection Sorting Transport from sorting plant to reprocessor Total
High population density 10.3 0.03 0.68 11.01
Low population density 12.4 0.03 0.68 13.11
Gross Employment , bring scheme collection and sorting of rigid and semi-rigid aluminium
packaging
Jobs per 1000 tonne per annum
Transport from bring bank to sorting plant
Sorting Transport from sorting plant to reprocessor
Total
High population density 2.1 0.03 0.68 2.81
Low population density 2.6 0.03 0.68 3.31
Gross Employment , kerbside collection and sorting of Paper & Board packaging
Jobs per 1000 tonne per annum Collection Sorting Transport from sorting plant to reprocessor Total
High population density 2.6 n.a. 0.03 2.63
Low population density 3.1 n.a. 0.03 3.13
- 53 -

"Evaluation of costs and benefits for the achievement of reuse and recycling targets for the different packaging materials in the frame of the packaging and packaging waste directive 94/62/EC" – Final consolidated report,
RDC-Environment & Pira International, March 2003
Gross Employment , bring scheme collection and sorting of Paper & Board packaging
Jobs per 1000 tonne per annum
Transport from bring bank to sorting plant
Sorting Transport from sorting plant to reprocessor
Total
High population density 0.3 n.a. 0.03 0.33
Low population density 0.4 n.a. 0.03 0.43
Gross Employment , kerbside collection and sorting of Liquid Beverage Cartons (incineration
of rejects)
Jobs per 1000 tonne per annum
Collection Sorting Transport from sorting plant to reprocessor
incineration of rejects (jobs/1000t rejects per annum)
Total
High population density 8.4 0.7 0.14 0.07 9.31
Low population density 10.1 0.7 0.14 0.07 11.01
Gross Employment , bring scheme collection and sorting of Liquid Beverage Cartons
(incineration of rejects)
Jobs per 1000 tonne per annum
Transport from bring bank to sorting plant
Sorting Transport from sorting plant to reprocessor
incineration of rejects (jobs/1000t rejects per annum)
Total
High pop. density 1.8 0.7 0.14 0.07 2.71
Low pop. density 2.2 0.7 0.14 0.07 3.11
Gross Employment , kerbside collection and sorting of Liquid Beverage Cartons (landfilling
of rejects)
Jobs per 1000 tonne of LBC per annum
Collection Sorting Transport from sorting plant to reprocessor
landfilling of rejects (jobs/1000t rejects per annum)
Total
High population density 8.4 0.7 0.14 0.03 9.27
Low population density 10.1 0.7 0.14 0.03 10.97
Gross Employment , bring scheme collection and sorting of Liquid Beverage Cartons
(landfilling of rejects)
Jobs per 1000 tonne of LBC per annum
Transport from bring bank to sorting plant
Sorting Transport from sorting plant to reprocessor
landfilling of rejects (jobs/1000t rejects per annum)
Total
High pop. density 1.8 0.7 0.14 0.03 2.67
Low pop. density 2.2 0.7 0.14 0.03 3.07
Gross Employment , bring scheme collection and sorting of Glass (landfilling of rejects)
Jobs per 1000 tonne per annum Transport from bring bank to sorting plant
Transport from sorting plant to reprocessor
Total
High pop. density 0.3 0.061 0.036
Low pop. density 0.3 0.061 0.036
- 54 -

"Evaluation of costs and benefits for the achievement of reuse and recycling targets for the different packaging materials in the frame of the packaging and packaging waste directive 94/62/EC" – Final consolidated report,
RDC-Environment & Pira International, March 2003
2 COMMERCIAL AND INDUSTRIAL CASE STUDIES
Gross Employment, Landfilling 1 tonne C&I films
Collection Landfill management / operation Total Jobs per 1000 tonne per annum 1.2 0.1 1.3
Gross Employment for Incineration of 1 tonne C&I films
Collection Incinerator management / operation Total Jobs per 1000 tonne per annum 1.2 0.27 1.47
Gross Employment for Recycling of 1 tonne C&I films
Collection Total Jobs per 1000 tonne per annum 1.2 1.2
Gross Employment, Landfilling 1 tonne C&I corrugated board
Collection Landfill management / operation Total Jobs per 1000 tonne per annum 1.2 0.1 1.3
Gross Employment for Incineration of 1 tonne C&I corrugated board
Collection Incinerator management / operation Total Jobs per 1000 tonne per annum 1.2 0.27 1.47
Gross Employment for Recycling of 1 tonne C&I corrugated board
Collection Total Jobs per 1000 tonne per annum 1.2 1.2
- 55 -

"Evaluation of costs and benefits for the achievement of reuse and recycling targets for the different packaging materials in the frame of the packaging and packaging waste directive 94/62/EC" – Final consolidated report,
RDC-Environment & Pira International, March 2003
Annex 6: Packaging mix by Member State
- 56 -

"Evaluation of costs and benefits for the achievement of reuse and recycling targets for the different packaging materials in the frame of the packaging and packaging waste directive 94/62/EC" – Final consolidated report,
RDC-Environment & Pira International, March 2003
1 INTRODUCTION
It is assumed that the optimal recycling rate in a Member State is a function of the packaging
mix in that Member State, as some packaging materials/applications will be easier to recycle
than others. Therefore the packaging mix in each Member State must be determined in order
to calculate the Member State’s optimal recycling target.
2 DATA SOURCES AND EXTRAPOLATION RULES
The main data sources are:
Member State’s official declarations for 1997 and 1998
Data provided by the national compliance schemes (1998-1999-2000)
Reports and interview from/of European Material Federations (APME, FEVE)
Additional input from local consultants where possible
Where data are missing, extrapolation rules are derived from the report “The Facts: A
European cost/benefit perspective” commissioned by ERRA in 1998, e.g. for the split
between industrial & commercial packaging and household packaging. The following
assumptions are made
the ratios between industrial and household packaging applications remain unchanged up
to 2000
the ratios between material applications are the best forecast where no other data is
available
for industrial packaging, distribution between packaging material applications is assumed
to be the same in the south countries (Italy, Greece, Portugal and Spain)
data for 1998 or 1999 provide a reasonable forecast for 2000
- 57 -

"Evaluation of costs and benefits for the achievement of reuse and recycling targets for the different packaging materials in the frame of the packaging and packaging waste directive 94/62/EC" – Final consolidated report,
RDC-Environment & Pira International, March 2003
- 58 -
Member State Source Comment Austria "Bundesabfallwirtschaftsplan"
1998 Member State declaration, 1998
Data reviewed by the Compliance Scheme
Belgium Fost Plus, 2000 Val-I-Pac, 1999
Data provided and reviewed by Compliance Scheme Extrapolation from Annual report and interview
Denmark DEPA = Miljostyrelsen, 1998 Data provided by COWI Finland PYR, 2000 Data reviewed by the Compliance Scheme
Shops packaging waste are considered as industrial packaging waste Extrapolation based on ERRA and APME reports when no data available.
France Eco-Emballages, 1998 Data reviewed by Eco-emballages Germany GVM Gesallschaft für
Verpackungsmarktforschung mbH, 1998
Data reviewed by the Compliance Scheme
Greece Forecast for 2000 Data provided by Ecopolis Ireland National Waste database report
1998, Environmental Protection Agency
Data reviewed by the Compliance Scheme
Italy CONAI, 2000 Data reviewed by the Compliance Scheme Luxembourg Valorlux Data reviewed by the Compliance Scheme The Netherlands Data reviewed by the Compliance Scheme Portugal Sociedade Ponto Verde, 1999
PLASTVAL, 1999 Data collected by IDOM
Spain ECOEMBALAJES ESPAÑA, S.AECOVIDRIO
Data reviewed by the Compliance Scheme Data collected by IDOM and interview of Ecoembes.
Sweden Member State declaration, 1998 Interview of RVF Svenska Renhållningsverksföreningen, The Swedish Association of Waste Management
UK Increasing recovery and recycling of packaging waste in the UK The Challenge Ahead: A forward Look for Planning Purposes, DETR (version under production)
Plastic packaging amount are split between application according to APME ratios Data reviewed by the Compliance Scheme
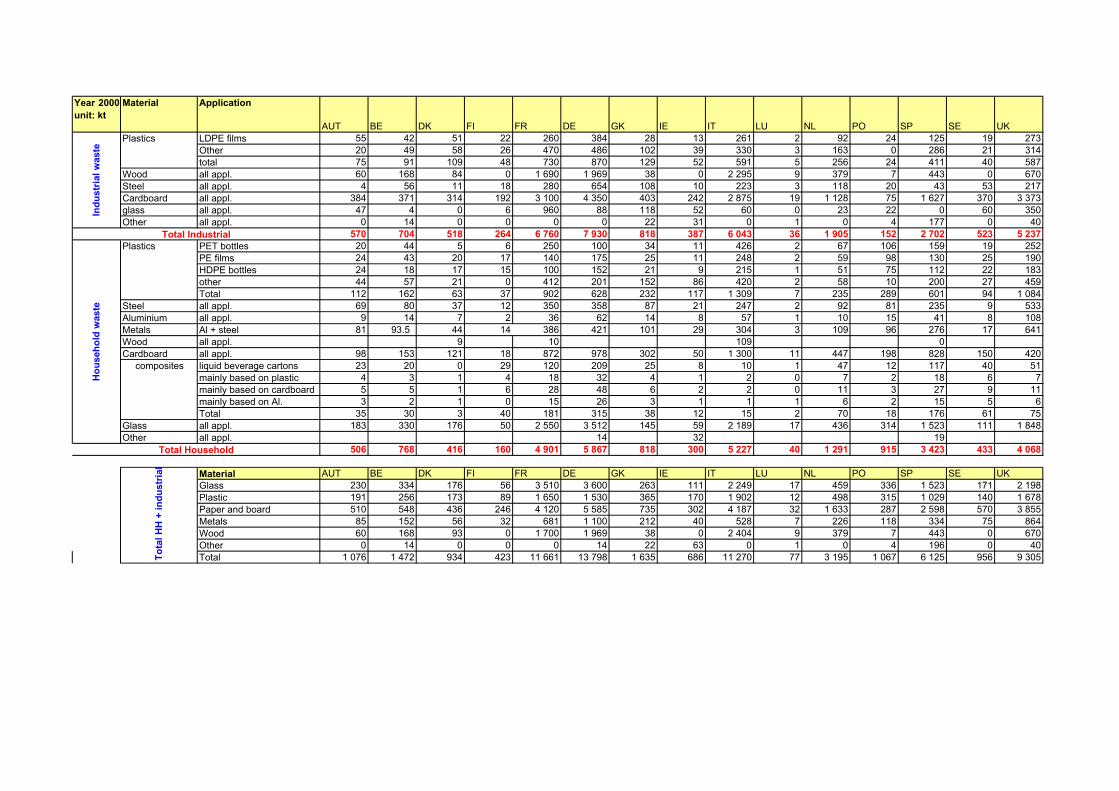
Year 2000unit: kt
Material Application
AUT BE DK FI FR DE GK IE IT LU NL PO SP SE UKLDPE films 55 42 51 22 260 384 28 13 261 2 92 24 125 19 273Other 20 49 58 26 470 486 102 39 330 3 163 0 286 21 314total 75 91 109 48 730 870 129 52 591 5 256 24 411 40 587
Wood all appl. 60 168 84 0 1 690 1 969 38 0 2 295 9 379 7 443 0 670Steel all appl. 4 56 11 18 280 654 108 10 223 3 118 20 43 53 217Cardboard all appl. 384 371 314 192 3 100 4 350 403 242 2 875 19 1 128 75 1 627 370 3 373glass all appl. 47 4 0 6 960 88 118 52 60 0 23 22 0 60 350Other all appl. 0 14 0 0 0 0 22 31 0 1 0 4 177 0 40
570 704 518 264 6 760 7 930 818 387 6 043 36 1 905 152 2 702 523 5 237PET bottles 20 44 5 6 250 100 34 11 426 2 67 106 159 19 252PE films 24 43 20 17 140 175 25 11 248 2 59 98 130 25 190HDPE bottles 24 18 17 15 100 152 21 9 215 1 51 75 112 22 183other 44 57 21 0 412 201 152 86 420 2 58 10 200 27 459Total 112 162 63 37 902 628 232 117 1 309 7 235 289 601 94 1 084
Steel all appl. 69 80 37 12 350 358 87 21 247 2 92 81 235 9 533Aluminium all appl. 9 14 7 2 36 62 14 8 57 1 10 15 41 8 108Metals Al + steel 81 93.5 44 14 386 421 101 29 304 3 109 96 276 17 641Wood all appl. 9 10 109 0Cardboard all appl. 98 153 121 18 872 978 302 50 1 300 11 447 198 828 150 420
liquid beverage cartons 23 20 0 29 120 209 25 8 10 1 47 12 117 40 51mainly based on plastic 4 3 1 4 18 32 4 1 2 0 7 2 18 6 7mainly based on cardboard 5 5 1 6 28 48 6 2 2 0 11 3 27 9 11mainly based on Al. 3 2 1 0 15 26 3 1 1 1 6 2 15 5 6Total 35 30 3 40 181 315 38 12 15 2 70 18 176 61 75
Glass all appl. 183 330 176 50 2 550 3 512 145 59 2 189 17 436 314 1 523 111 1 848Other all appl. 14 32 19
506 768 416 160 4 901 5 867 818 300 5 227 40 1 291 915 3 423 433 4 068
Material AUT BE DK FI FR DE GK IE IT LU NL PO SP SE UKGlass 230 334 176 56 3 510 3 600 263 111 2 249 17 459 336 1 523 171 2 198Plastic 191 256 173 89 1 650 1 530 365 170 1 902 12 498 315 1 029 140 1 678Paper and board 510 548 436 246 4 120 5 585 735 302 4 187 32 1 633 287 2 598 570 3 855Metals 85 152 56 32 681 1 100 212 40 528 7 226 118 334 75 864Wood 60 168 93 0 1 700 1 969 38 0 2 404 9 379 7 443 0 670Other 0 14 0 0 0 14 22 63 0 1 0 4 196 0 40Total 1 076 1 472 934 423 11 661 13 798 1 635 686 11 270 77 3 195 1 067 6 125 956 9 305
Total Household
Tota
l HH
+ in
dust
rial
composites
Indu
stria
l was
te Plastics
Plastics
Hou
seho
ld w
aste
Total Industrial

"Evaluation of costs and benefits for the achievement of reuse and recycling targets for the different packaging materials in the frame of the packaging and packaging waste directive 94/62/EC" – Final consolidated report,
RDC-Environment & Pira International, March 2003
Annex 7: Environmental data sources
- 59 -

"Evaluation of costs and benefits for the achievement of reuse and recycling targets for the different packaging materials in the frame of the packaging and packaging waste directive 94/62/EC" – Final consolidated report,
RDC-Environment & Pira International, March 2003
Environmental data for background systems
LCI data for the environmental analysis has been derived from the following sources: Data Source Comments
Transport steps Vehicle emissions
“Life Cycle Inventory Development for Waste Management Operations: Waste Transport and Other Vehicle Use”, UK Environment Agency 2000
Data collected and reported by Latham S & Mudge G (Transport Research Laboratory), 1997 as research contractors to the UK Environment Agency
Electricity and other energies
Calculated from “Life cycle inventories of energy systems”, ETH, Zurich, 1994
Raw materials Various sources including: “Life cycle inventories of energy systems”, ETH, Zurich, 1994
- 60 -

"Evaluation of costs and benefits for the achievement of reuse and recycling targets for the different packaging materials in the frame of the packaging and packaging waste directive 94/62/EC" – Final consolidated report,
RDC-Environment & Pira International, March 2003
Environmental data related to PET bottles from household sources
LCI data for the environmental analysis has been derived from the following sources: Original Data Source Comments
Waste management Landfilling of rigid plastics
Derived from “Life Cycle Inventory Development for Waste Management Operations: Landfill”, UK Environment Agency 2000
Data collected and reported by RG Gregory, AJ Revans & G Attenborough (WS Atkins Consultants Ltd), 1997 as research contractors to the UK Environment Agency
Rigid plastics incineration
RDC and Pira International 2000
Data reworked by P Dobson, Pira International, and Bernard de Caevel, RDC from various sources: “Life Cycle Inventory Development for Waste Management Operations: Incineration”, UK Environment Agency 2000 “Integrated Solid Waste Management: A Life cycle inventory”, PR White, M Franke and P Hindle, 1995 "Specific processing costs of waste materials in a MSWcombustion facility", ir. L.P.M Rijpkema and Dr.ir.J.A. Zeevalkink,TNO 1996
Material recycling Sorting Derived from “Life Cycle
Inventory Development for Waste Management Operations: Waste Collection and Separation”, UK Environment Agency 2000
Data collected and reported by Vip Patel (Aspinwall and Co.), 1997 as research contractors to the UK Environment Agency
Baling Derived from “Life Cycle Assessment of Packaging Systems for Beer and Soft Drinks, Disposable PET Bottles”, Danish Environmental Protection Agency, 1998
Recycling – Regranulation
“Life Cycle Assessment of Packaging Systems for Beer and Soft Drinks, Disposable PET Bottles”, Danish Environmental Protection Agency, 1998
PET (bottle grade and amorphous)
"Ecoprofiles of the European plastics industry Report 8: Polyethylene terephthalate", APME, 1995
- 61 -

"Evaluation of costs and benefits for the achievement of reuse and recycling targets for the different packaging materials in the frame of the packaging and packaging waste directive 94/62/EC" – Final consolidated report,
RDC-Environment & Pira International, March 2003
Environmental data related to Paper & board packaging from household sources
LCI data for the environmental analysis has been derived from the following sources: Data Source Comments
Waste mangement Landfilling of paper
Derived from “Life Cycle Inventory Development for Waste Management Operations: Landfill”, UK Environment Agency 2000
Data collected and reported by RG Gregory, AJ Revans & G Attenborough (WS Atkins Consultants Ltd), 1997 as research contractors to the UK Environment Agency
Paper incineration
RDC and Pira International 2000 Data reworked by P Dobson, Pira International, and Bernard de Caevel, RDC from various sources: “Life Cycle Inventory Development for Waste Management Operations: Incineration”, UK Environment Agency 2000 “Integrated Solid Waste Management: A Life cycle inventory”, PR White, M Franke and P Hindle, 1995
Material recycling Sorting Derived from “Life Cycle
Inventory Development for Waste Management Operations: Waste Collection and Separation”, UK Environment Agency 2000
Data collected and reported by Vip Patel (Aspinwall and Co.), 1997 as research contractors to the Environment Agency
Testliner production
Derived from “European Database for Corrugated Board Life Cycle Studies”, FEFCO, Groupemont Ondule and Kraft Institute, 1997
Kraftliner production
Derived from “European Database for Corrugated Board Life Cycle Studies”, FEFCO, Groupemont Ondule and Kraft Institute, 1997
- 62 -

"Evaluation of costs and benefits for the achievement of reuse and recycling targets for the different packaging materials in the frame of the packaging and packaging waste directive 94/62/EC" – Final consolidated report,
RDC-Environment & Pira International, March 2003 Environmental data related to corrugated board packaging from industrial
sources LCI data for the environmental analysis has been derived from the following sources: Data Source Comments
Waste management Landfilling of paper
Derived from “Life Cycle Inventory Development for Waste Management Operations: Landfill”, UK Environment Agency 2000
Data collected and reported by RG Gregory, AJ Revans & G Attenborough (WS Atkins Consultants Ltd), 1997 as research contractors to the UK Environment Agency
Paper incineration
RDC and Pira International 2000 Data reworked by P Dobson, Pira International, and Bernard de Caevel, RDC from various sources: “Life Cycle Inventory Development for Waste Management Operations: Incineration”, UK Environment Agency 2000 “Integrated Solid Waste Management: A Life cycle inventory”, PR White, M Franke and P Hindle, 1995
Material recycling Testliner production
Derived from “European Database for Corrugated Board Life Cycle Studies”, FEFCO, Groupemont Ondule and Kraft Institute, 1997
Kraftliner production
Derived from “European Database for Corrugated Board Life Cycle Studies”, FEFCO, Groupemont Ondule and Kraft Institute, 1997
- 63 -
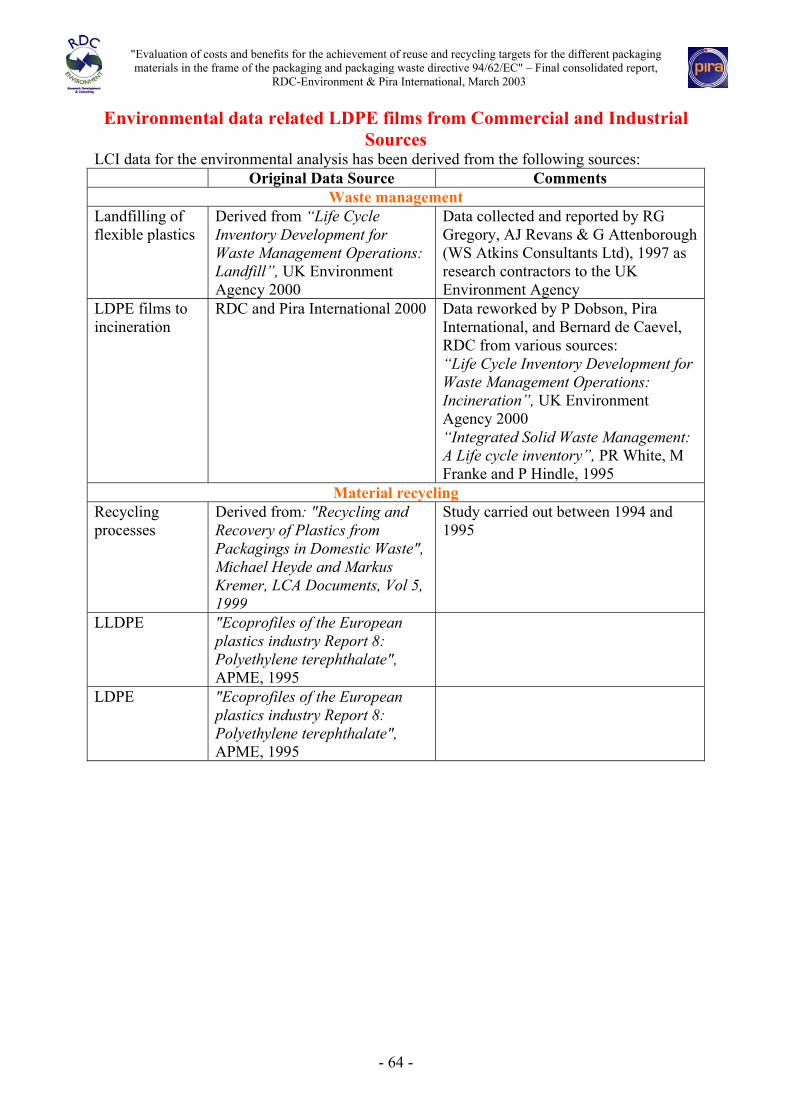
"Evaluation of costs and benefits for the achievement of reuse and recycling targets for the different packaging materials in the frame of the packaging and packaging waste directive 94/62/EC" – Final consolidated report,
RDC-Environment & Pira International, March 2003
Environmental data related LDPE films from Commercial and Industrial Sources
LCI data for the environmental analysis has been derived from the following sources: Original Data Source Comments
Waste management Landfilling of flexible plastics
Derived from “Life Cycle Inventory Development for Waste Management Operations: Landfill”, UK Environment Agency 2000
Data collected and reported by RG Gregory, AJ Revans & G Attenborough (WS Atkins Consultants Ltd), 1997 as research contractors to the UK Environment Agency
LDPE films to incineration
RDC and Pira International 2000 Data reworked by P Dobson, Pira International, and Bernard de Caevel, RDC from various sources: “Life Cycle Inventory Development for Waste Management Operations: Incineration”, UK Environment Agency 2000 “Integrated Solid Waste Management: A Life cycle inventory”, PR White, M Franke and P Hindle, 1995
Material recycling Recycling processes
Derived from: "Recycling and Recovery of Plastics from Packagings in Domestic Waste", Michael Heyde and Markus Kremer, LCA Documents, Vol 5, 1999
Study carried out between 1994 and 1995
LLDPE "Ecoprofiles of the European plastics industry Report 8: Polyethylene terephthalate", APME, 1995
LDPE "Ecoprofiles of the European plastics industry Report 8: Polyethylene terephthalate", APME, 1995
- 64 -

"Evaluation of costs and benefits for the achievement of reuse and recycling targets for the different packaging materials in the frame of the packaging and packaging waste directive 94/62/EC" – Final consolidated report,
RDC-Environment & Pira International, March 2003
Environmental data related Mixed plastics from household sources LCI data for the environmental analysis has been derived from the following sources: Original Data Source Comments
Waste management Landfilling of mixed plastics
Derived from “Life Cycle Inventory Development for Waste Management Operations: Landfill”, UK Environment Agency 2000
Data collected and reported by RG Gregory, AJ Revans & G Attenborough (WS Atkins Consultants Ltd), 1997 as research contractors to the UK Environment Agency
Mixed plastics to incineration
RDC and Pira International 2000 Data reworked by P Dobson, Pira International, and Bernard de Caevel, RDC from various sources: “Life Cycle Inventory Development for Waste Management Operations: Incineration”, UK Environment Agency 2000 “Integrated Solid Waste Management: A Life cycle inventory”, PR White, M Franke and P Hindle, 1995
Material recycling Sorting and recycling processes
Derived from: "Recycling and Recovery of Plastics from Packagings in Domestic Waste", Michael Heyde and Markus Kremer, LCA Documents, Vol 5, 1999
Study carried out between 1994 and 1995
Pallisade (assumed to be wood construction material)
“Life cycle inventories of energy systems”, ETH, Zurich, 1994
Other reprocessing Agglomeration and Blast furnace
Derived from: "Recycling and Recovery of Plastics from Packagings in Domestic Waste", Michael Heyde and Markus Kremer, LCA Documents, Vol 5, 1999
Study carried out between 1994 and 1995
Heating oil “Life cycle inventories of energy systems”, ETH, Zurich, 1994
- 65 -

"Evaluation of costs and benefits for the achievement of reuse and recycling targets for the different packaging materials in the frame of the packaging and packaging waste directive 94/62/EC" – Final consolidated report,
RDC-Environment & Pira International, March 2003
Environmental data related to Glass beverage bottles from household sources
LCI data for the environmental analysis has been derived from the following sources: Original Data Source Comments
Waste management Landfilling of glass
Derived from “Life Cycle Inventory Development for Waste Management Operations: Landfill”, UK Environment Agency 2000
Data collected and reported by RG Gregory, AJ Revans & G Attenborough (WS Atkins Consultants Ltd), 1997 as research contractors to the UK Environment Agency
Glass to incineration
RDC and Pira International 2000 Data reworked by P Dobson, Pira International, and Bernard de Caevel, RDC from various sources: “Life Cycle Inventory Development for Waste Management Operations: Incineration”, UK Environment Agency 2000 “Integrated Solid Waste Management: A Life cycle inventory”, PR White, M Franke and P Hindle, 1995
Material recycling Recycling processes and credit
Derived from “Life Cycle Inventory Development for Waste Management Operations: Recycling”, UK Environment Agency 2000
Sorting Derived from “Life Cycle Inventory Development for Waste Management Operations: Waste Collection and Separation”, UK Environment Agency 2000
Data collected and reported by Vip Patel (Aspinwall and Co.), 1997 as research contractors to the UK Environment Agency Data collected and reported by Vip Patel (Aspinwall and Co.), 1997 as research contractors to the Environment Agency
- 66 -

"Evaluation of costs and benefits for the achievement of reuse and recycling targets for the different packaging materials in the frame of the packaging and packaging waste directive 94/62/EC" – Final consolidated report,
RDC-Environment & Pira International, March 2003
Environmental data related to aluminium beverage, rigid and semi-rigid from household sources
LCI data for the environmental analysis has been derived from the following sources: Original Data Source Comments
Waste management Landfilling of aluminium
Derived from “Life Cycle Inventory Development for Waste Management Operations: Landfill”, UK Environment Agency 2000
Data collected and reported by RG Gregory, AJ Revans & G Attenborough (WS Atkins Consultants Ltd), 1997 as research contractors to the UK Environment Agency
Aluminium to incineration
RDC and Pira International 2000 Data reworked by P Dobson, Pira International, and Bernard de Caevel, RDC from various sources: “Life Cycle Inventory Development for Waste Management Operations: Incineration”, UK Environment Agency 2000 “Integrated Solid Waste Management: A Life cycle inventory”, PR White, M Franke and P Hindle, 1995
Material recycling Recycling processes and virgin production
Derived from “Environmental Profile Report for the European Aluminium Industry”, European Aluminium Association, April 2000
Sorting and baling
Derived from “Life Cycle Inventory Development for Waste Management Operations: Waste Collection and Separation”, UK Environment Agency 2000
Data collected and reported by Vip Patel (Aspinwall and Co.), 1997 as research contractors to the UK Environment Agency
- 67 -
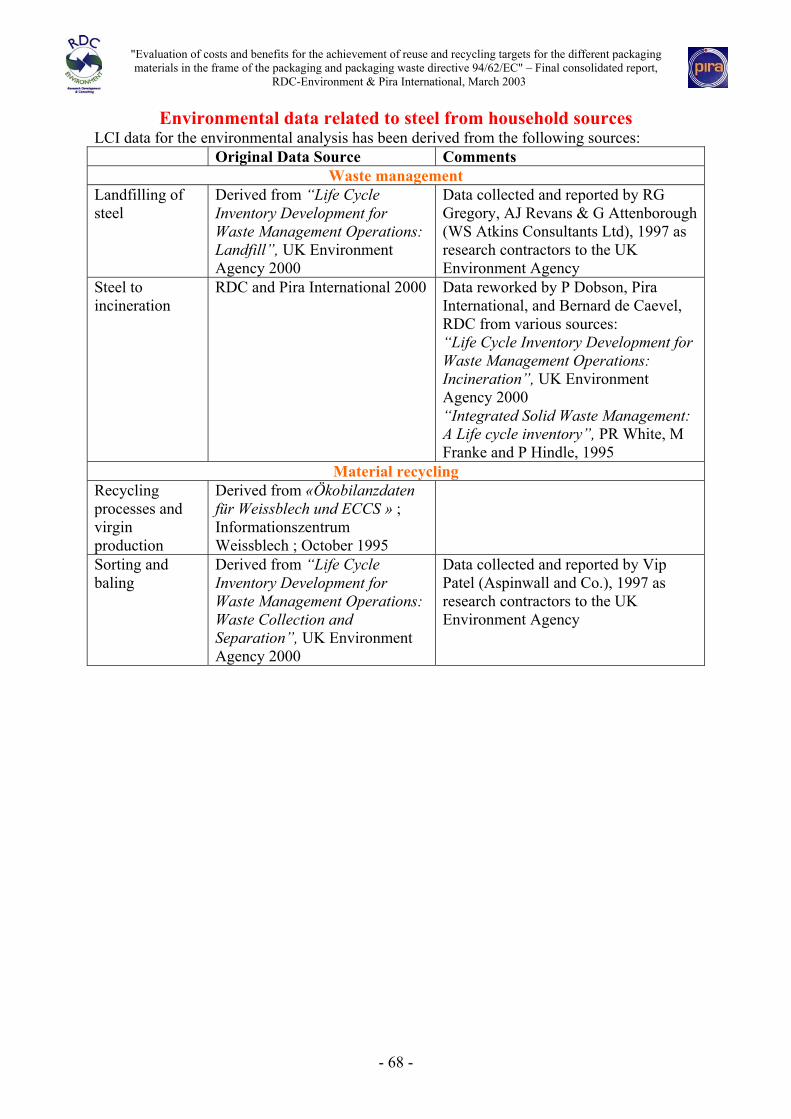
"Evaluation of costs and benefits for the achievement of reuse and recycling targets for the different packaging materials in the frame of the packaging and packaging waste directive 94/62/EC" – Final consolidated report,
RDC-Environment & Pira International, March 2003
Environmental data related to steel from household sources LCI data for the environmental analysis has been derived from the following sources: Original Data Source Comments
Waste management Landfilling of steel
Derived from “Life Cycle Inventory Development for Waste Management Operations: Landfill”, UK Environment Agency 2000
Data collected and reported by RG Gregory, AJ Revans & G Attenborough (WS Atkins Consultants Ltd), 1997 as research contractors to the UK Environment Agency
Steel to incineration
RDC and Pira International 2000 Data reworked by P Dobson, Pira International, and Bernard de Caevel, RDC from various sources: “Life Cycle Inventory Development for Waste Management Operations: Incineration”, UK Environment Agency 2000 “Integrated Solid Waste Management: A Life cycle inventory”, PR White, M Franke and P Hindle, 1995
Material recycling Recycling processes and virgin production
Derived from «Ökobilanzdaten für Weissblech und ECCS » ; Informationszentrum Weissblech ; October 1995
Sorting and baling
Derived from “Life Cycle Inventory Development for Waste Management Operations: Waste Collection and Separation”, UK Environment Agency 2000
Data collected and reported by Vip Patel (Aspinwall and Co.), 1997 as research contractors to the UK Environment Agency
- 68 -

"Evaluation of costs and benefits for the achievement of reuse and recycling targets for the different packaging materials in the frame of the packaging and packaging waste directive 94/62/EC" – Final consolidated report,
RDC-Environment & Pira International, March 2003
Environmental data related to LBC from household sources
LCI data for the environmental analysis has been derived from the following sources:
Original Data Source Comments Waste management
Landfilling of LBC
Derived from “Life Cycle Inventory Development for Waste Management Operations: Landfill”, UK Environment Agency 2000
Data collected and reported by RG Gregory, AJ Revans & G Attenborough (WS Atkins Consultants Ltd), 1997 as research contractors to the UK Environment Agency The data for paper, aluminium and plastic film has been combined to represent LBC
LBC to incineration
RDC and Pira International 2000 Data reworked by P Dobson, Pira International, and Bernard de Caevel, RDC from various sources: “Life Cycle Inventory Development for Waste Management Operations: Incineration”, UK Environment Agency 2000 “Integrated Solid Waste Management: A Life cycle inventory”, PR White, M Franke and P Hindle, 1995 The data for paper, aluminium foil and plastic film has been combined to represent LBC
Material recycling Fibre recycling processes and credit
Derived from “European Database for Corrugated Board Life Cycle Studies”, FEFCO, Groupemont Ondule and Kraft Institute, 1997
Based on comparison of kraftliner production and testliner production
Incineration of rejects
RDC and Pira International 2000 Data reworked by P Dobson, Pira International, and Bernard de Caevel, RDC from various sources: “Life Cycle Inventory Development for Waste Management Operations: Incineration”, UK Environment Agency 2000 “Integrated Solid Waste Management: A Life cycle inventory”, PR White, M Franke and P Hindle, 1995 The data for aluminium foil and plastic film has been combined to represent LBC
- 69 -

"Evaluation of costs and benefits for the achievement of reuse and recycling targets for the different packaging materials in the frame of the packaging and packaging waste directive 94/62/EC" – Final consolidated report,
RDC-Environment & Pira International, March 2003 Landfilling of rejects
Derived from “Life Cycle Inventory Development for Waste Management Operations: Landfill”, UK Environment Agency 2000
The data for aluminium and plastic film has been combined to represent LBC
Sorting and baling
Derived from “Life Cycle Inventory Development for Waste Management Operations: Waste Collection and Separation”, UK Environment Agency 2000
Data collected and reported by Vip Patel (Aspinwall and Co.), 1997 as research contractors to the UK Environment Agency
- 70 -
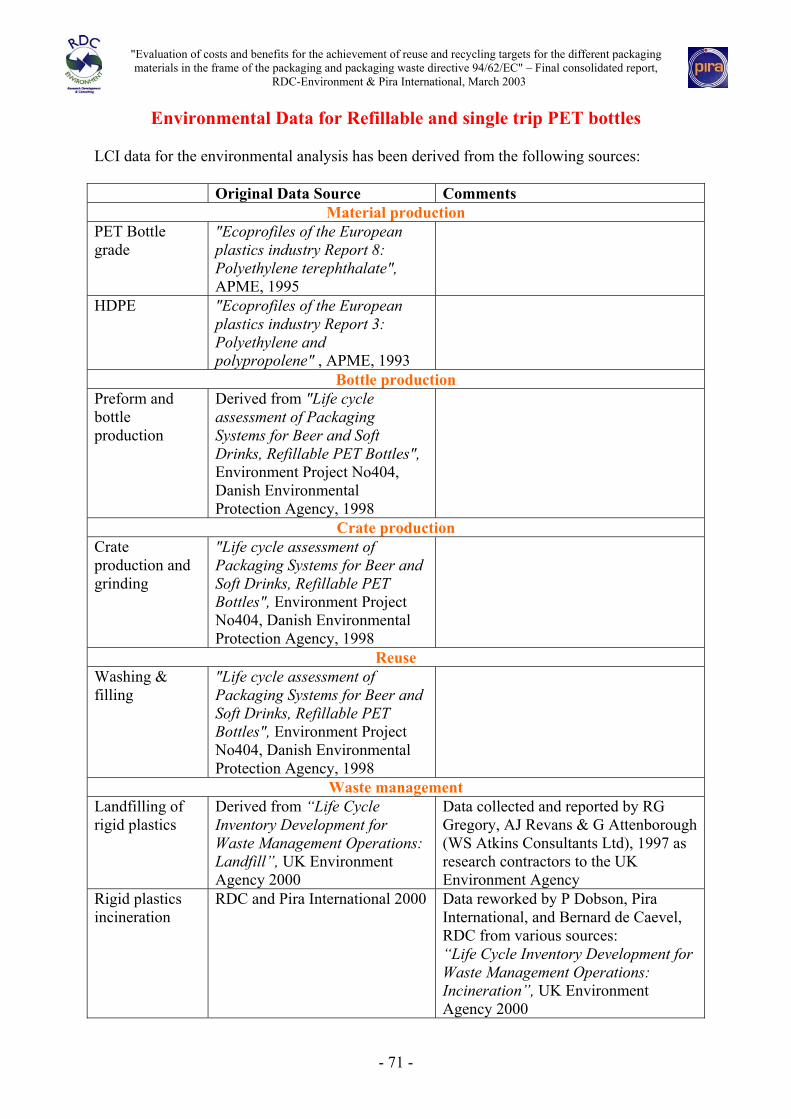
"Evaluation of costs and benefits for the achievement of reuse and recycling targets for the different packaging materials in the frame of the packaging and packaging waste directive 94/62/EC" – Final consolidated report,
RDC-Environment & Pira International, March 2003
Environmental Data for Refillable and single trip PET bottles
LCI data for the environmental analysis has been derived from the following sources: Original Data Source Comments
Material production PET Bottle grade
"Ecoprofiles of the European plastics industry Report 8: Polyethylene terephthalate", APME, 1995
HDPE "Ecoprofiles of the European plastics industry Report 3: Polyethylene and polypropolene" , APME, 1993
Bottle production Preform and bottle production
Derived from "Life cycle assessment of Packaging Systems for Beer and Soft Drinks, Refillable PET Bottles", Environment Project No404, Danish Environmental Protection Agency, 1998
Crate production Crate production and grinding
"Life cycle assessment of Packaging Systems for Beer and Soft Drinks, Refillable PET Bottles", Environment Project No404, Danish Environmental Protection Agency, 1998
Reuse Washing & filling
"Life cycle assessment of Packaging Systems for Beer and Soft Drinks, Refillable PET Bottles", Environment Project No404, Danish Environmental Protection Agency, 1998
Waste management Landfilling of rigid plastics
Derived from “Life Cycle Inventory Development for Waste Management Operations: Landfill”, UK Environment Agency 2000
Data collected and reported by RG Gregory, AJ Revans & G Attenborough (WS Atkins Consultants Ltd), 1997 as research contractors to the UK Environment Agency
Rigid plastics incineration
RDC and Pira International 2000 Data reworked by P Dobson, Pira International, and Bernard de Caevel, RDC from various sources: “Life Cycle Inventory Development for Waste Management Operations: Incineration”, UK Environment Agency 2000
- 71 -
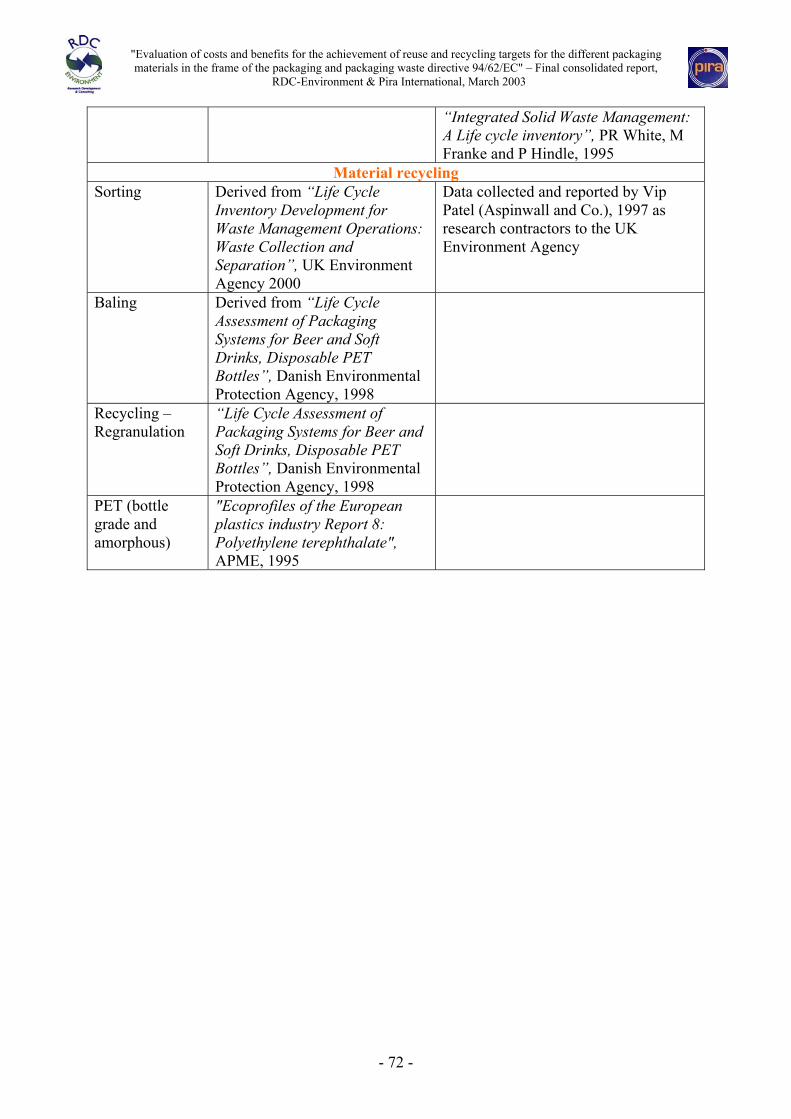
"Evaluation of costs and benefits for the achievement of reuse and recycling targets for the different packaging materials in the frame of the packaging and packaging waste directive 94/62/EC" – Final consolidated report,
RDC-Environment & Pira International, March 2003
“Integrated Solid Waste Management: A Life cycle inventory”, PR White, M Franke and P Hindle, 1995
Material recycling Sorting Derived from “Life Cycle
Inventory Development for Waste Management Operations: Waste Collection and Separation”, UK Environment Agency 2000
Data collected and reported by Vip Patel (Aspinwall and Co.), 1997 as research contractors to the UK Environment Agency
Baling Derived from “Life Cycle Assessment of Packaging Systems for Beer and Soft Drinks, Disposable PET Bottles”, Danish Environmental Protection Agency, 1998
Recycling – Regranulation
“Life Cycle Assessment of Packaging Systems for Beer and Soft Drinks, Disposable PET Bottles”, Danish Environmental Protection Agency, 1998
PET (bottle grade and amorphous)
"Ecoprofiles of the European plastics industry Report 8: Polyethylene terephthalate", APME, 1995
- 72 -

"Evaluation of costs and benefits for the achievement of reuse and recycling targets for the different packaging materials in the frame of the packaging and packaging waste directive 94/62/EC" – Final consolidated report,
RDC-Environment & Pira International, March 2003
Environmental Data for Refillable and single trip Glass bottles
LCI data for the environmental analysis has been derived from the following sources: Original Data Source Comments
Material production HDPE "Ecoprofiles of the European
plastics industry Report 3: Polyethylene and polypropolene" , APME, 1993
Bottle production Glass bottle production
Derived from "BUWAL Env Series 250: Life Cycle Inventories for Packaging, BUWAL", BUWAL, 1999
Crate production Crate production and grinding
"Life cycle assessment of Packaging Systems for Beer and Soft Drinks, Refillable Glass Bottles", Environment Project No400, Danish Environmental Protection Agency, 1998
Reuse Washing & filling
"Life cycle assessment of Packaging Systems for Beer and Soft Drinks, Refillable Glass Bottles", Environment Project No400, Danish Environmental Protection Agency, 1998
Waste management Landfilling of glass
Derived from “Life Cycle Inventory Development for Waste Management Operations: Landfill”, UK Environment Agency 2000
Data collected and reported by RG Gregory, AJ Revans & G Attenborough (WS Atkins Consultants Ltd), 1997 as research contractors to the UK Environment Agency
Glass to incineration
RDC and Pira International 2000 Data reworked by P Dobson, Pira International, and Bernard de Caevel, RDC from various sources: “Life Cycle Inventory Development for Waste Management Operations: Incineration”, UK Environment Agency 2000 “Integrated Solid Waste Management: A Life cycle inventory”, PR White, M Franke and P Hindle, 1995
- 73 -
"Evaluation of costs and benefits for the achievement of reuse and recycling targets for the different packaging materials in the frame of the packaging and packaging waste directive 94/62/EC" – Final consolidated report,
RDC-Environment & Pira International, March 2003
- 74 -
Material recycling
Recycling processes and credit
Derived from “Life Cycle Inventory Development for Waste Management Operations: Recycling”, UK Environment Agency 2000
Sorting Derived from “Life Cycle Inventory Development for Waste Management Operations: Waste Collection and Separation”, UK Environment Agency 2000
Data collected and reported by Vip Patel (Aspinwall and Co.), 1997 as research contractors to the UK Environment Agency