Annette;Sector Capital Funds plc;Sector Capital Funds Word ...
44
SECTOR CAPITAL FUNDS PLC (A company incorporated with limited liability as an open-ended umbrella investment company with variable capital under the laws of Ireland) UNAUDITED INTERIM FINANCIAL STATEMENTS FOR THE PERIOD 1 JANUARY 2015 TO 30 JUNE 2015 Registration No. 489443
Transcript of Annette;Sector Capital Funds plc;Sector Capital Funds Word ...
SECTOR CAPITAL FUNDS PLC (A company incorporated with limited liability as an open-ended umbrella investment company
with variable capital under the laws of Ireland)
UNAUDITED INTERIM FINANCIAL STATEMENTS
FOR THE PERIOD 1 JANUARY 2015 TO 30 JUNE 2015
Registration No. 489443
SECTOR CAPITAL FUNDS PLC Unaudited Interim Financial Statements
For the period 1 January 2015 to 30 June 2015
TABLE OF CONTENTS
1
Page
General Information ....................................................................................................................................................................................................2
Investment Managers’ Reports ....................................................................................................................................................................................3
Balance Sheet ..............................................................................................................................................................................................................4
Profit and Loss Account ..............................................................................................................................................................................................7
Statement of Changes in Net Assets attributable to holders of Redeemable Participating Shares ...............................................................................9
Schedules of Investments .......................................................................................................................................................................................... 11
Notes to the Financial Statements.............................................................................................................................................................................. 19
Significant Portfolio Movements............................................................................................................................................................................... 41

SECTOR CAPITAL FUNDS PLC Unaudited Interim Financial Statements
For the period 1 January 2015 to 30 June 2015
GENERAL INFORMATION
2
Directors Michael Boyce (Irish)^ Peter Murray (Irish)^ Lars Tell (Swedish) ^Independent non-executive Director
Registered Office 2nd Floor, Beaux Lane House Mercer Street Lower Dublin 2 Ireland
Investment Manager Sector Global Equity Kernel Fund Sector Omega AS Filipstad Brygge 2 PO Box 1994 Vika N - 0125 Oslo Norway
Independent Auditors Deloitte & Touche Chartered Accountants and Statutory Audit Firm Deloitte & Touche House Earlsfort Terrace Dublin 2 Ireland
Investment Manager Sector Healthcare Value Fund Sector Gamma AS Filipstad Brygge 2 PO Box 1994 Vika N - 0125 Oslo Norway
Legal Advisers to the Company (advisers as to Norwegian law) Bugge, Arentz-Hansen & Rasmussen Advokatfirma (BA-HR) Tjuvholmen allé 16 NO-0252 Oslo PO Box 1524 Vika NO - 0117 Oslo Norway
Investment Manager Sector Sigma Nordic Fund Sigma Fondsforvaltning AS Filipstad Brygge 2 PO Box 1994 Vika N - 0125 Oslo Norway
Legal Advisers to the Company (advisers as to Irish law) Maples and Calder 75 St. Stephen's Green Dublin 2 Ireland
Administrator, Registrar and Transfer Agent BNY Mellon Investment Servicing (International) Limited Riverside Two Sir John Rogerson’s Quay Grand Canal Dock Dublin 2 Ireland
Sponsoring Brokers Maples and Calder 75 St. Stephen's Green Dublin 2 Ireland
Custodian BNY Mellon Trust Company (Ireland) Limited Guild House Guild Street IFSC Dublin 1 Ireland
Company Secretary MFD Secretaries Limited 2nd Floor, Beaux Lane House Mercer Street Lower Dublin 2 Ireland

SECTOR CAPITAL FUNDS PLC Unaudited Interim Financial Statements
For the period 1 January 2015 to 30 June 2015
INVESTMENT MANAGERS’ REPORTS
3
Sector Global Equity Kernel Fund
During the first half year of 2015, the global equity market (as measured by the MSCI ACWI) was up nearly 2.7%. However, it has been a rollercoaster ride from one month to the other as the markets registered losses in January, March, May and June, and rising sharply in February and April.
The Sector Global Equity Kernel Fund has outperformed its index by more than 5.3%, logging a total return for the first six months of the year of nearly 8% (Class P USD). In particular, the Fund’s investment style and active bets contributed with excess returns, outperforming the market during the first half year of 2015. Within investment style, the largest contributors were the size factor as well as momentum, whilst company goodness (or quality) represented the largest drag. The portfolio’s outperformance from active bets was led by stock selection, whilst sector selection contributed negatively.
Sector Healthcare Value Fund
As things stand at the mid-point of the year, the healthcare sector is on track to outperform the broader market for an unprecedented fifth consecutive year. On a sub-sector basis, biotech continues to lead the way and is up 21.9% to date compared to 9.9% for the healthcare sector as a whole and 3.0% for the broader market. Healthcare has also outperformed the other defensive sectors as well as decoupling from interest rates.
The Sector Healthcare Value Fund has outperformed both the broader market and the healthcare sector, and is up 12.5% during the first half of the year. On a single stock level, the attribution to the performance over the last six months has been broad based and led by Ironwood, Hospira and Eli Lilly. Only a handful of positions has contributed negatively to the returns during the first half year of 2015, with Ironwood and Glaxosmithkline representing the largest drag.
Sector Sigma Nordic Fund
The Nordic market, as measured by the VINX, has returned nearly 10.6% during the first half of 2015. The market had a strong start to the year and rose all three months of the first quarter. However, during the second quarter, the picture has been more mixed, with both April and June logging negative returns.
Sector Sigma Nordic Fund followed much of the same pattern as the overall Nordic market, and was up all three months of the first quarter, but logging losses in April and June. Overall, the Fund was up 0.62% as at the end of June. On a single stock level, the largest contributors to the H1-returns all came from the long book, led by Finish sporting goods company Amer Sports, Danish pharmaceutical company Novo Nordisk and the Norwegian Fertilizer company Yara. Electrolux, Coloplast and Ericsson represented the largest drag on performance during the first half year of 2015.

SECTOR CAPITAL FUNDS PLC Unaudited Interim Financial Statements
For the period 1 January 2015 to 30 June 2015
BALANCE SHEET As at 30 June 2015
The accompanying notes form an integral part of the financial statements 4
Note
Sector Global Equity Kernel
FundSector Healthcare
Value Fund Sector Sigma Nordic Fund
Sector Capital Funds PLC
USD USD NOK USDCurrent Assets Investments in financial assets held at fair value through profit or loss 26,367,910 49,925,118 443,942,912 132,718,172Cash at bank and brokers 6 2,061,860 2,261,683 122,601,406 19,906,182Amounts due from broker 1,178,119 – 4,007,511 1,687,473Receivable for securities sold 246,345 – – 246,345Interest receivable – – 430 55Dividends receivable 19,949 71,679 – 91,628Other assets 39,196 15,443 314,437 94,604Total Assets 29,913,379 52,273,923 570,866,696 154,744,459 Current Liabilities Investments in financial liabilities held at fair value through profit or loss – – 2,371,341 301,397Amounts due to broker 83,348 55,681 – 139,029Payable for securities purchased 1,780,606 – – 1,780,606Payable to investment manager 9 4,991 45,509 983,906 175,554Incentive fee 10 1,161 473,357 372,154 521,819Administration fee 11 6,012 24,792 245,992 62,070Directors' fees and expenses 12 775 2,078 16,454 4,944Auditors' fee 13 8,186 7,729 38,354 20,790Custodian fee 11 3,761 4,617 48,112 14,493Legal fee – 4,121 7,436 5,066Interest payable 856 – 7 857Equalisation credit payable – 400,593 152,220 419,940Other creditors 10,355 24,679 141,353 53,000Total Liabilities (excluding net assets attributable to holders of Redeemable Participating Shares) 1,900,051 1,043,156 4,377,329 3,499,565 Net assets attributable to holders of Redeemable Participating Shares 28,013,328 51,230,767 566,489,367 151,244,894 Shares outstanding 8 Class A EUR – 61,401 49,159Class A NOK – 16,299 182,349Class A USD – 68,888 48,599Class B EUR – – 7,056Class B NOK – 94,306 89,536Class B SEK – 118 –Class C NOK – – 2,415Class C SEK – – 41,269Class L NOK – 25,492 20,260Class O NOK 1,748 – –Class P NOK Hedged 52,308 – –Class P NOK Unhedged 82,274 – –Class P USD 125,080 – – Net Asset Value per Share Class A EUR – 190.83 110.09Class A NOK – 1,643.65 1,461.53Class A USD – 262.57 111.27Class B EUR – – 134.11Class B NOK – 907.73 1,412.69Class B SEK – 914.58 –Class C NOK – – 1,380.35Class C SEK – – 1,004.09Class L NOK – 1,786.54 1,608.51Class O NOK 830.04 – –Class P NOK Hedged 794.00 – –Class P NOK Unhedged 800.16 – –Class P USD 113.39 – – Sector Sigma Nordic Fund is translated in the Company total column at the Balance Sheet exchange rate of 0.1271.

SECTOR CAPITAL FUNDS PLC Unaudited Interim Financial Statements
For the period 1 January 2015 to 30 June 2015
BALANCE SHEET (Continued) As at 30 June 2014
The accompanying notes form an integral part of the financial statements 5
Note
Sector Global Equity Kernel
FundSector Healthcare
Value Fund Sector Sigma Nordic Fund
Sector Capital Funds PLC
USD USD NOK USDCurrent Assets Investments in financial assets held at fair value through profit or loss 10,395,452 84,304,081 226,114,588 131,556,211Cash at bank and brokers 6 586,788 3,924,819 36,734,947 10,499,403Amounts due from broker – – 1,268,858 206,824Receivable for securities sold 167,339 829,394 1,502,669 1,241,668Interest receivable – – 120 20Dividends receivable 3,724 33,649 – 37,373Other assets 42,642 46,420 484,647 168,059Total Assets 11,195,945 89,138,363 266,105,829 143,709,558 Current Liabilities Investments in financial liabilities held at fair value through profit or loss – 14,709 2,372,178 401,374Amounts due to broker – 468,534 – 468,534Payable for securities purchased 618,793 – 2,727,973 1,063,452Payable to investment manager 9 8,925 71,693 530,145 167,032Incentive fee 10 3,919 732,155 2,014,706 1,064,471Administration fee 11 12,269 29,343 168,735 69,116Directors' fees and expenses 12 360 4,231 12,325 6,600Auditors' fee 13 3,063 5,748 39,492 15,248Custodian fee 11 7,471 5,053 30,911 17,562Legal fee 3,589 2,274 14,927 8,296Interest payable 151 – 44 158Equalisation credit payable 760 677,210 354,778 735,799Other creditors 3,543 11,055 46,740 22,217Total Liabilities (excluding net assets attributable to holders of Redeemable Participating Shares) 662,843 2,022,005 8,312,954 4,039,859 Net assets attributable to holders of Redeemable Participating Shares 10,533,102 87,116,358 257,792,875 139,669,699 Shares outstanding 8 Class A EUR – 136,556 25,360Class A NOK – 15,692 67,138Class A USD – 186,314 9,577Class B EUR – – 18,192Class B NOK – 64,847 84,032Class B USD – – 19Class C NOK – – 3,653Class L NOK – 25,492 7,411Class O NOK 12,874 – –Class P USD 86,440 – – Net Asset Value per Share Class A EUR – 157.60 100.82Class A NOK – 1,341.32 1,315.28Class A USD – 217.03 102.30Class B EUR – – 124.55Class B NOK – 742.22 1,284.19Class B USD – – 125.46Class C NOK – – 1,259.81Class L NOK – 1,429.86 1,407.40Class O NOK 628.59 – –Class P USD 106.60 – – Sector Global Equity Kernel Fund commenced operations on 19 March 2014. Sector Sigma Nordic Fund is translated in the Company total column at the Balance Sheet exchange rate of 0.1630.

SECTOR CAPITAL FUNDS PLC Unaudited Interim Financial Statements
For the period 1 January 2015 to 30 June 2015
BALANCE SHEET (Continued) As at 31 December 2014
The accompanying notes form an integral part of the financial statements 6
Sector Global
Equity Kernel FundSector Healthcare
Value FundSector Sigma Nordic
Fund USD USD NOK Total Net Asset Value 10,152,525 58,586,309 328,500,775 Shares outstanding 8 Class A EUR – 97,848 47,121 Class A NOK – 15,692 74,103 Class A USD – 85,070 1,355 Class B EUR – – 10,416 Class B NOK – 96,094 88,301 Class C NOK – – 2,498 Class L NOK 4,000 25,492 20,184 Class O NOK 1,623 – – Class P USD 90,075 – – Net Asset Value per Share Class A EUR – 169.75 110.34 Class A NOK – 1,454.91 1,452.59 Class A USD – 233.38 111.61 Class B EUR – – 135.20 Class B NOK – 802.06 1,407.23 Class C NOK – – 1,377.75 Class L NOK 1,004.45 1,561.53 1,589.47 Class O NOK 728.02 – – Class P USD 105.01 – –
SECTOR CAPITAL FUNDS PLC Unaudited Interim Financial Statements
For the period 1 January 2015 to 30 June 2015
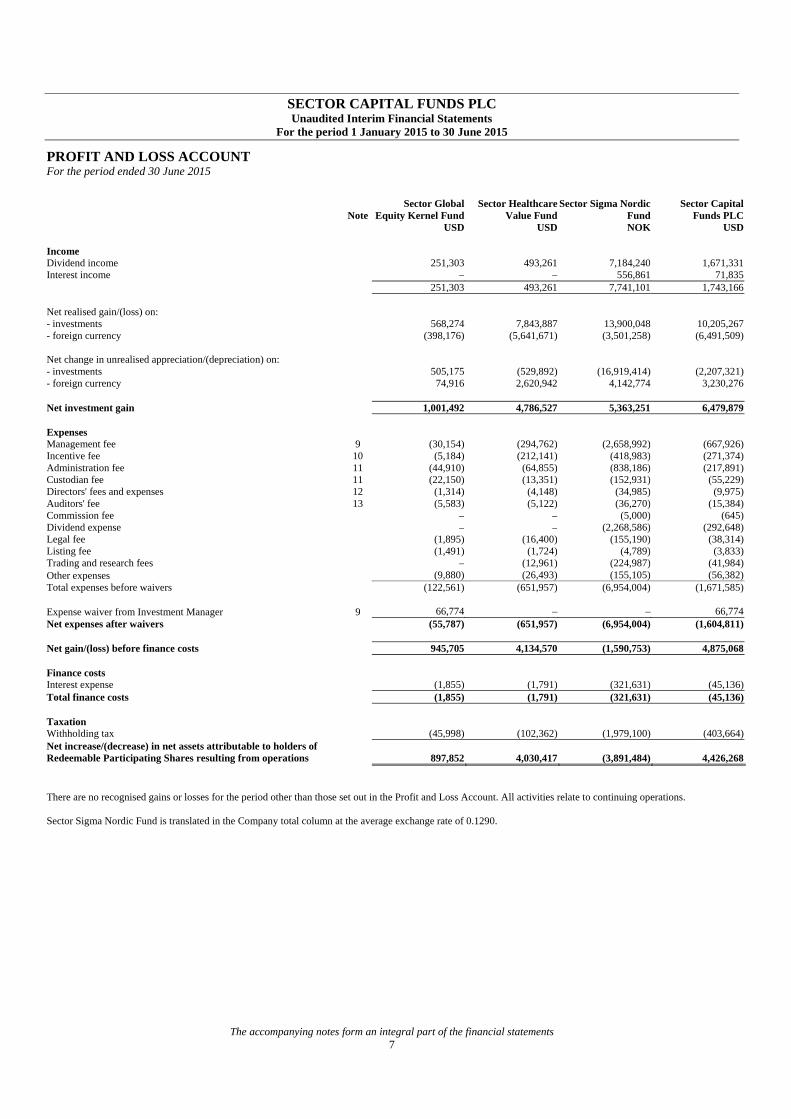
PROFIT AND LOSS ACCOUNT For the period ended 30 June 2015
The accompanying notes form an integral part of the financial statements 7
NoteSector Global
Equity Kernel FundSector Healthcare
Value FundSector Sigma Nordic
Fund Sector Capital
Funds PLC USD USD NOK USD Income Dividend income 251,303 493,261 7,184,240 1,671,331Interest income – – 556,861 71,835 251,303 493,261 7,741,101 1,743,166 Net realised gain/(loss) on: - investments 568,274 7,843,887 13,900,048 10,205,267- foreign currency (398,176) (5,641,671) (3,501,258) (6,491,509) Net change in unrealised appreciation/(depreciation) on: - investments 505,175 (529,892) (16,919,414) (2,207,321)- foreign currency 74,916 2,620,942 4,142,774 3,230,276 Net investment gain 1,001,492 4,786,527 5,363,251 6,479,879 Expenses Management fee 9 (30,154) (294,762) (2,658,992) (667,926)Incentive fee 10 (5,184) (212,141) (418,983) (271,374)Administration fee 11 (44,910) (64,855) (838,186) (217,891)Custodian fee 11 (22,150) (13,351) (152,931) (55,229)Directors' fees and expenses 12 (1,314) (4,148) (34,985) (9,975)Auditors' fee 13 (5,583) (5,122) (36,270) (15,384)Commission fee – – (5,000) (645)Dividend expense – – (2,268,586) (292,648)Legal fee (1,895) (16,400) (155,190) (38,314)Listing fee (1,491) (1,724) (4,789) (3,833)Trading and research fees – (12,961) (224,987) (41,984)Other expenses (9,880) (26,493) (155,105) (56,382)Total expenses before waivers (122,561) (651,957) (6,954,004) (1,671,585) Expense waiver from Investment Manager 9 66,774 – – 66,774Net expenses after waivers (55,787) (651,957) (6,954,004) (1,604,811) Net gain/(loss) before finance costs 945,705 4,134,570 (1,590,753) 4,875,068 Finance costs Interest expense (1,855) (1,791) (321,631) (45,136)Total finance costs (1,855) (1,791) (321,631) (45,136) Taxation Withholding tax (45,998) (102,362) (1,979,100) (403,664)Net increase/(decrease) in net assets attributable to holders of Redeemable Participating Shares resulting from operations 897,852 4,030,417 (3,891,484) 4,426,268 August 2010. There are no recognised gains or losses for the period other than those set out in the Profit and Loss Account. All activities relate to continuing operations. Sector Sigma Nordic Fund is translated in the Company total column at the average exchange rate of 0.1290.

SECTOR CAPITAL FUNDS PLC Unaudited Interim Financial Statements
For the period 1 January 2015 to 30 June 2015
PROFIT AND LOSS ACCOUNT (Continued) For the period ended 30 June 2014
The accompanying notes form an integral part of the financial statements 8
NoteSector Global
Equity Kernel FundSector Healthcare
Value FundSector Sigma Nordic
Fund Sector Capital
Funds PLC USD USD NOK USD Income Dividend income 81,093 904,493 3,528,863 1,569,966Interest income 6 – 266,886 44,202Other income – 4,944 – 4,944 81,099 909,437 3,795,749 1,619,112 Net realised gain/(loss) on: - investments (29,852) 9,631,686 10,793,916 11,389,306- foreign currency 1,409 635,986 495,777 719,496 Net change in unrealised appreciation/(depreciation) on: - investments 458,737 (498,797) 5,701,063 904,036- foreign currency 16,113 (690,597) (709,905) (792,044) Net investment gain 527,506 9,987,715 20,076,600 13,839,906 Expenses Management fee 9 (10,086) (444,722) (1,520,244) (706,560)Incentive fee 10 (3,919) (139,939) (2,118,182) (494,629)Administration fee 11 (16,634) (74,364) (482,983) (170,980)Custodian fee 11 (8,471) (18,135) (100,962) (43,325)Directors' fees and expenses 12 (399) (9,023) (24,811) (13,531)Auditors' fee 13 (3,063) (6,372) (21,514) (12,998)Commission fee – – (26,860) (4,448)Dividend expense – – (2,441,140) (404,253)Legal fee (3,589) (13,381) (148,924) (41,632)Listing fee (784) (1,941) (4,339) (3,443)Trading and research fees – (23,541) (157,214) (49,576)Other expenses (7,510) (30,685) (153,164) (63,559)Total expenses before waivers (54,455) (762,103) (7,200,337) (2,008,934) Expense waiver from Investment Manager 9 34,294 – – 34,294Net expenses after waivers (20,161) (762,103) (7,200,337) (1,974,640) Net gain before finance costs 507,345 9,225,612 12,876,263 11,865,266 Finance costs Interest expense (160) (382) (228,906) (38,449)Total finance costs (160) (382) (228,906) (38,449) Taxation Withholding tax (19,996) (220,803) (934,070) (395,481)Net increase in net assets attributable to holders of Redeemable Participating Shares resulting from operations 487,189 9,004,427 11,713,287 11,431,336 There are no recognised gains or losses for the period other than those set out in the Profit and Loss Account. All activities relate to continuing operations. Sector Global Equity Kernel Fund commenced operations on 19 March 2014. Sector Sigma Nordic Fund is translated in the Company total column at the average exchange rate of 0.1656.

SECTOR CAPITAL FUNDS PLC Unaudited Interim Financial Statements
For the period 1 January 2015 to 30 June 2015
STATEMENT OF CHANGES IN NET ASSETS ATTRIBUTABLE TO HOLDERS OF REDEEMABLE PARTICIPATING SHARES For the period ended 30 June 2015
The accompanying notes form an integral part of the financial statements 9
Sector Global
Equity Kernel FundSector Healthcare
Value FundSector Sigma Nordic
Fund Sector Capital
Funds PLC USD USD NOK USD Net Assets attributable to holders of Redeemable Participating Shares at beginning of period 10,152,525 58,586,309 328,500,775 112,560,837 Capital transactions: Issue of Redeemable Participating Shares 25,923,985 6,638,489 318,599,141 73,661,763Redemption of Redeemable Participating Shares (8,959,924) (17,936,235) (76,539,382) (36,769,739)Equalisation applied (1,110) (88,213) (179,683) (112,502)Net increase/(decrease) in net assets resulting from capital transactions of Redeemable Participating Shares 16,962,951 (11,385,959) 241,880,076 36,779,522 Currency adjustment – – – (2,521,733) Net increase/(decrease) in net assets attributable to holders of Redeemable Participating Shares resulting from operations 897,852 4,030,417 (3,891,484) 4,426,268 Net Assets attributable to holders of Redeemable Participating Shares at end of period 28,013,328 51,230,767 566,489,367 151,244,894 Sector Sigma Nordic Fund is translated in the Company total column at the average exchange rate of 0.1290.

SECTOR CAPITAL FUNDS PLC Unaudited Interim Financial Statements
For the period 1 January 2015 to 30 June 2015
STATEMENT OF CHANGES IN NET ASSETS ATTRIBUTABLE TO HOLDERS OF REDEEMABLE PARTICIPATING SHARES (Continued) For the period ended 30 June 2014
The accompanying notes form an integral part of the financial statements 10
Sector Global
Equity Kernel FundSector Healthcare
Value FundSector Sigma Nordic
Fund Sector Capital
Funds PLC USD USD NOK USD Net Assets attributable to holders of Redeemable Participating Shares at beginning of period – 78,419,435 197,363,561 110,944,950 Capital transactions: Issue of Redeemable Participating Shares 10,046,673 15,569,227 80,993,927 39,028,494Redemption of Redeemable Participating Shares – (15,611,003) (31,915,828) (20,896,264)Equalisation applied (760) (265,728) (362,072) (326,447)Net increase/(decrease) in net assets resulting from capital transactions of Redeemable Participating Shares 10,045,913 (307,504) 48,716,027 17,805,783 Currency adjustment – – – (512,370) Net increase in net assets attributable to holders of Redeemable Participating Shares resulting from operations 487,189 9,004,427 11,713,287 11,431,336 Net Assets attributable to holders of Redeemable Participating Shares at end of period 10,533,102 87,116,358 257,792,875 139,669,699 Sector Sigma Nordic Fund is translated in the total column at the average exchange rate of 0.1656.

SECTOR CAPITAL FUNDS PLC Unaudited Interim Financial Statements
For the period 1 January 2015 to 30 June 2015
The accompanying notes form an integral part of the financial statements 11
SCHEDULES OF INVESTMENTS
As at 30 June 2015
Sector Global Equity Kernel Fund
Investment Units Fair Value as a % of
Net Assets Fair Value USD
Financial Assets at Fair Value through profit or loss Equities
Australia JB Hi-Fi Ltd. 15,610 0.83% 233,718 Telstra Corp Ltd. 54,913 0.92% 259,146
Total Australia 1.75% 492,864
Austria Andritz AG 3,600 0.71% 199,152
Total Austria 0.71% 199,152
China Guangzhou Development Group, Inc. 115,220 0.93% 260,690 Sino Biopharmaceutical Ltd. 228,000 0.94% 264,687
Total China 1.87% 525,377
Denmark Pandora A/S 2,580 0.99% 277,063 Schouw & Co. 4,360 0.81% 227,595
Total Denmark 1.80% 504,658
France Cap Gemini S.A. 2,880 0.91% 254,690 Cie Generale des Etablissements Michelin SCA 2,010 0.75% 210,494 Ipsen S.A. 4,700 0.92% 259,140 Orange S.A. 16,241 0.89% 249,902 Societe BIC S.A. 1,605 0.91% 255,726 Valeo S.A. 1,560 0.88% 245,688
Total France 5.26% 1,475,640
Germany Aurubis AG 4,230 0.89% 248,379 Bayer AG 1,750 0.87% 244,804 Freenet AG 6,400 0.77% 215,459 Infineon Technologies AG 20,360 0.90% 252,486 SAP AG 3,540 0.88% 246,911 Siemens AG 2,467 0.89% 248,348 Software AG 7,430 0.73% 203,486
Total Germany 5.93% 1,659,873
Hong Kong CLP Holdings Ltd. 30,000 0.91% 255,013 Guangdong Investments Ltd. 138,000 0.69% 193,314 Hang Seng Bank Ltd. 13,300 0.93% 259,908
Total Hong Kong 2.53% 708,235
Ireland XL Group PLC 7,070 0.94% 263,004
Total Ireland 0.94% 263,004
Japan Alfresa Holdings Corp. 16,800 0.93% 261,683 Dydo Drinco, Inc. 6,300 0.98% 273,902 FUJIFILM Holdings Corp. 6,700 0.85% 239,468 Kyowa Exeo Corp. 22,000 0.91% 256,380 Maeda Road Construction Co. Ltd. 13,000 0.85% 239,464 Mitsubishi Electric Corp. 20,000 0.92% 258,571 NHK Spring Co. Ltd. 22,800 0.90% 251,356 Nippon Telegraph & Telephone Corp. 7,400 0.96% 268,115 NTT DoCoMo, Inc. 14,500 0.99% 277,759 Osaka Gas Co. Ltd. 64,000 0.90% 252,778 Seven & I Holdings Co. Ltd. 6,200 0.95% 266,514
SECTOR CAPITAL FUNDS PLC Unaudited Interim Financial Statements
For the period 1 January 2015 to 30 June 2015
The accompanying notes form an integral part of the financial statements 12
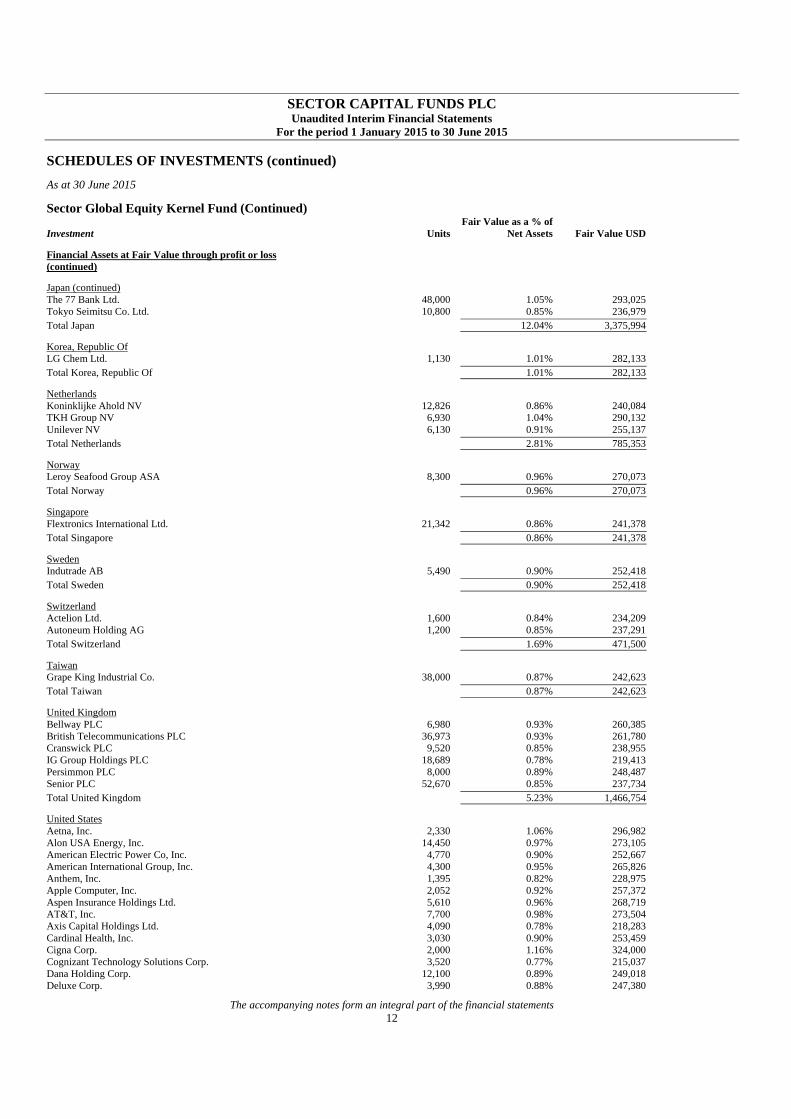
SCHEDULES OF INVESTMENTS (continued)
As at 30 June 2015
Sector Global Equity Kernel Fund (Continued)
Investment Units Fair Value as a % of
Net Assets Fair Value USD
Financial Assets at Fair Value through profit or loss (continued)
Japan (continued) The 77 Bank Ltd. 48,000 1.05% 293,025 Tokyo Seimitsu Co. Ltd. 10,800 0.85% 236,979
Total Japan 12.04% 3,375,994
Korea, Republic Of LG Chem Ltd. 1,130 1.01% 282,133
Total Korea, Republic Of 1.01% 282,133
Netherlands Koninklijke Ahold NV 12,826 0.86% 240,084 TKH Group NV 6,930 1.04% 290,132 Unilever NV 6,130 0.91% 255,137
Total Netherlands 2.81% 785,353
Norway Leroy Seafood Group ASA 8,300 0.96% 270,073
Total Norway 0.96% 270,073
Singapore Flextronics International Ltd. 21,342 0.86% 241,378
Total Singapore 0.86% 241,378
Sweden Indutrade AB 5,490 0.90% 252,418
Total Sweden 0.90% 252,418
Switzerland Actelion Ltd. 1,600 0.84% 234,209 Autoneum Holding AG 1,200 0.85% 237,291
Total Switzerland 1.69% 471,500
Taiwan Grape King Industrial Co. 38,000 0.87% 242,623
Total Taiwan 0.87% 242,623
United Kingdom Bellway PLC 6,980 0.93% 260,385 British Telecommunications PLC 36,973 0.93% 261,780 Cranswick PLC 9,520 0.85% 238,955 IG Group Holdings PLC 18,689 0.78% 219,413 Persimmon PLC 8,000 0.89% 248,487 Senior PLC 52,670 0.85% 237,734
Total United Kingdom 5.23% 1,466,754
United States Aetna, Inc. 2,330 1.06% 296,982 Alon USA Energy, Inc. 14,450 0.97% 273,105 American Electric Power Co, Inc. 4,770 0.90% 252,667 American International Group, Inc. 4,300 0.95% 265,826 Anthem, Inc. 1,395 0.82% 228,975 Apple Computer, Inc. 2,052 0.92% 257,372 Aspen Insurance Holdings Ltd. 5,610 0.96% 268,719 AT&T, Inc. 7,700 0.98% 273,504 Axis Capital Holdings Ltd. 4,090 0.78% 218,283 Cardinal Health, Inc. 3,030 0.90% 253,459 Cigna Corp. 2,000 1.16% 324,000 Cognizant Technology Solutions Corp. 3,520 0.77% 215,037 Dana Holding Corp. 12,100 0.89% 249,018 Deluxe Corp. 3,990 0.88% 247,380

SECTOR CAPITAL FUNDS PLC Unaudited Interim Financial Statements
For the period 1 January 2015 to 30 June 2015
The accompanying notes form an integral part of the financial statements 13
SCHEDULES OF INVESTMENTS (continued)
As at 30 June 2015
Sector Global Equity Kernel Fund (Continued)
Investment Units Fair Value as a % of
Net Assets Fair Value USD
Financial Assets at Fair Value through profit or loss (continued)
United States (continued) Everest Re Group Ltd. 1,440 0.94% 262,095 Foot Locker, Inc. 4,100 0.98% 274,741 Gilead Sciences, Inc. 2,340 0.98% 273,967 Hill-Rom Holdings, Inc. 5,120 0.99% 278,170 Humana, Inc. 1,492 1.02% 285,390 Ingredion Inc. 3,270 0.93% 260,979 Insight Enterprises, Inc. 8,100 0.86% 242,271 iShares MSCI ACWI Index Fund 35,240 7.48% 2,095,018 J&J Snack Foods Corp. 2,430 0.96% 268,928 JPMorgan Chase & Co. 3,393 0.82% 229,910 Lazard Ltd. 4,610 0.93% 259,266 Lear Corp. 2,286 0.92% 256,626 Lexmark International, Inc. 5,740 0.91% 253,708 Manpower, Inc. 3,000 0.96% 268,140 Marathon Petroleum Corp. 5,120 0.96% 267,827 MKS Instruments, Inc. 7,150 0.97% 271,271 Patterson Cos., Inc. 5,300 0.92% 257,845 Public Service Enterprise Group, Inc. 6,160 0.86% 241,965 Snap-On, Inc. 1,710 0.97% 272,317 SYSCO Corp. 7,500 0.97% 270,750 The AES Corp. 19,590 0.93% 259,763 The Blackstone Group LP 5,130 0.75% 209,663 Torchmark Corp. 4,500 0.93% 261,990 Tyson Foods, Inc. 5,400 0.82% 230,202 United Therapeutics Corp. 1,290 0.80% 224,395 UnitedHealth Group, Inc. 2,200 0.96% 268,400 Validus Holdings Ltd. 6,200 0.97% 272,738 Vonage Holdings Corp. 53,400 0.94% 262,194
Total United States 45.37% 12,704,856 Total Equities 92.53% 25,921,885 Contracts-for-Difference
China China Yangtze Power Co Ltd. 102,100 0.24% 66,379 Guangdong Baolihua New Energy Stock Co Ltd. 137,350 0.28% 79,401 Inner Mongolia MengDian HuaNeung Thermal Power Corp Ltd 229,581 0.43% 120,058 Luzhou Laojiao Co Ltd. 50,900 0.20% 54,856 Qindao Haier Co Ltd. 47,400 0.15% 41,334 Shenzhen Energy Group Co Ltd. 131,901 0.17% 47,635 Total China 1.47% 409,663 Total Contracts-for-Difference 1.47% 409,663 Net unrealised gain on forward foreign currency contracts (note 7) 0.13% 36,362
Total Financial Assets at Fair Value through profit or loss 94.13% 26,367,910 Total Investments at Fair Value 94.13% 26,367,910 Cash at bank and brokers 7.36% 2,061,860 Liabilities in excess of other assets (1.49)% (416,442) Total Net Assets 100.00% 28,013,328

SECTOR CAPITAL FUNDS PLC Unaudited Interim Financial Statements
For the period 1 January 2015 to 30 June 2015
The accompanying notes form an integral part of the financial statements 14
SCHEDULES OF INVESTMENTS (Continued)
As at 30 June 2015 Sector Global Equity Kernel Fund (Continued) ALL SECURIITES ARE TRANSFERABLE SECURITIES ADMITTED TO AN OFFICIAL EXCHANGE LISTING OR TRADED ON A REGULATED MARKET EXCEPT FOR CONTRACTS-FOR-DIFFERENCE AND FORWARD FOREIGN CURRENCY CONTRACTS WHICH ARE FINANCIAL DERIVATIVE INSTRUMENTS Analysis of Total Assets % of Total AssetsTransferable securities admitted to an official exchange listing or traded on a regulated market 86.66%Financial derivative instruments 1.49%Other assets 11.85%Total Assets 100.00%

SECTOR CAPITAL FUNDS PLC Unaudited Interim Financial Statements
For the period 1 January 2015 to 30 June 2015
The accompanying notes form an integral part of the financial statements 15
SCHEDULES OF INVESTMENTS (continued)
As at 30 June 2015
Sector Healthcare Value Fund
Investment Units Fair Value as a % of
Net Assets Fair Value USD
Financial Assets at Fair Value through profit or loss Equities
Denmark H Lundbeck A/S 110,000 4.13% 2,119,398
Total Denmark 4.13% 2,119,398
France Ipsen S.A. 29,900 3.22% 1,648,572 Sanofi-Aventis S.A. 36,000 6.91% 3,539,412
Total France 10.13% 5,187,984
Israel Teva Pharmaceutical Industries Ltd. 17,000 1.96% 1,004,700
Total Israel 1.96% 1,004,700
Japan Daiichi Sankyo Co. Ltd. 95,000 3.43% 1,757,692 Otsuka Holdings Co. Ltd. 20,000 1.25% 638,009 Takeda Pharmaceutical Co. Ltd. 10,000 0.94% 483,063
Total Japan 5.62% 2,878,764
Netherlands Koninklijke Philips Electronics NV 30,982 1.54% 787,750 Mylan NV 16,000 2.12% 1,085,760
Total Netherlands 3.66% 1,873,510
Sweden Getinge AB 29,186 1.37% 701,730
Total Sweden 1.37% 701,730
Switzerland Actelion Ltd. 6,000 1.71% 878,284 Basilea Pharmaceutica AG 6,000 1.47% 753,732
Total Switzerland 3.18% 1,632,016
United Kingdom AstraZeneca PLC 10,000 1.23% 632,068 GlaxoSmithKline PLC 155,000 6.29% 3,223,838
Total United Kingdom 7.52% 3,855,906
United States Baxter International, Inc. 48,000 6.55% 3,356,640 Bio-Rad Laboratories, Inc. 9,000 2.65% 1,355,490 Boston Scientific Corp. 150,000 5.18% 2,655,000 Bristol-Myers Squibb Co. 27,000 3.51% 1,796,580 Cardinal Health, Inc. 16,000 2.61% 1,338,400 Cigna Corp. 9,000 2.85% 1,458,000 Community Health Systems, Inc. 12,000 1.48% 755,640 Eli Lilly & Co. 33,000 5.38% 2,755,170 Integra LifeSciences Holdings Corp. 15,000 1.97% 1,010,550 Ironwood Pharmaceuticals, Inc. 110,000 2.59% 1,326,600 Johnson & Johnson 18,000 3.42% 1,754,280 Masimo Corp. 30,000 2.27% 1,162,200 Owens & Minor, Inc. 23,000 1.53% 782,000 PerkinElmer, Inc. 30,000 3.08% 1,579,200 Rite Aid Corp. 65,000 1.06% 542,750 Spectrum Pharmaceuticals, Inc. 44,500 0.59% 304,380 Stryker Corp. 17,000 3.17% 1,624,690 Tenet Healthcare Corp. 24,000 2.71% 1,389,120 The Medicines Co. 40,000 2.23% 1,144,400 Thoratec Corp. 17,000 1.48% 757,690 Vertex Pharmaceuticals, Inc. 6,500 1.57% 802,620

SECTOR CAPITAL FUNDS PLC Unaudited Interim Financial Statements
For the period 1 January 2015 to 30 June 2015
The accompanying notes form an integral part of the financial statements 16
SCHEDULES OF INVESTMENTS (continued)
As at 30 June 2015
Sector Healthcare Value Fund (Continued)
Investment Units Fair Value as a % of
Net Assets Fair Value USD
Financial Assets at Fair Value through profit or loss (continued)
United States (continued) WellCare Health Plans, Inc. 10,000 1.66% 848,300
Total United States 59.54% 30,499,700 Total Equities 97.11% 49,753,708 Net unrealised gain on forward foreign currency contracts (note 7) 0.34% 171,410
Total Financial Assets at Fair Value through profit or loss 97.45% 49,925,118 Total Investments at Fair Value 97.45% 49,925,118 Cash at bank and brokers 4.41% 2,261,683 Liabilities in excess of other assets (1.86)% (956,034) Total Net Assets 100.00% 51,230,767
ALL SECURITIES ARE TRANSFERABLE SECURITIES ADMITTED TO AN OFFICIAL EXCHNGE LISTING OR TRADED ON A REGULATED MARKET EXCEPT FOR FORWARD FOREIGN CURRENCY CONTRACTS WHICH ARE FINANCIAL DERIVATIVE INSTRUMENTS Analysis of Total Assets % of Total AssetsTransferable securities admitted to an official exchange listing or traded on a regulated market 95.18%Financial derivative instruments 0.33%Other assets 4.49%Total Assets 100.00%

SECTOR CAPITAL FUNDS PLC Unaudited Interim Financial Statements
For the period 1 January 2015 to 30 June 2015
The accompanying notes form an integral part of the financial statements 17
SCHEDULES OF INVESTMENTS (continued)
As at 30 June 2015
Sector Sigma Nordic Fund
Investment Units Fair Value as a % of
Net Assets Fair Value NOK
Financial Assets at Fair Value through profit or loss Equities
Bermuda Frontline 2012 Ltd. 175,000 1.27% 7,175,000
Total Bermuda 1.27% 7,175,000
Denmark Coloplast A/S 28,000 2.55% 14,447,350 Danske Bank A/S 61,600 2.52% 14,245,330 Novo Nordisk A/S 32,700 2.47% 14,009,774 Royal Unibrew A/S* 53,000 2.52% 14,249,466
Total Denmark 10.06% 56,951,920
Finland Amer Sports Oyj 81,500 3.01% 17,074,792 Cargotec Oyj 63,500 3.35% 18,953,558 Huhtamaki Oyj 101,000 4.33% 24,542,257 Munksjo Oyj 100,000 1.49% 8,415,330
Total Finland 12.18% 68,985,937
Marshall Islands DHT Holdings, Inc. 130,000 1.40% 7,946,962
Total Marshall Islands 1.40% 7,946,962
Norway Norsk Hydro ASA 522,000 3.05% 17,252,100 Royal Caribbean Cruises Ltd. 25,000 2.73% 15,477,339 Telenor ASA 87,000 2.64% 14,946,600 Tomra Systems ASA 215,000 2.72% 15,426,250 Yara International ASA 48,500 3.50% 19,807,400
Total Norway 14.64% 82,909,689
Sweden AarhusKarlshamn AB* 30,100 2.48% 14,021,767 ABB Ltd. 84,000 2.44% 13,834,663 Assa Abloy AB 128,400 3.36% 19,004,542 Autoliv, Inc. 23,600 3.82% 21,660,918 Haldex AB 100,000 1.83% 10,382,540 Hennes & Mauritz AB 55,500 2.97% 16,797,527 Hexagon AB 68,600 3.45% 19,539,504 Hexpol AB 161,000 2.30% 13,044,500 Investor AB 69,300 3.58% 20,297,410 Telefonaktiebolaget LM Ericsson 227,000 3.26% 18,488,791 TeliaSonera AB 310,000 2.53% 14,346,964 Trelleborg AB 129,000 3.31% 18,750,867 Volvo AB 142,000 2.45% 13,854,575
Total Sweden 37.78% 214,024,568 Total Equities 77.33% 437,994,076 Contracts-for-Difference
Norway Statoil ASA (140,000) 0.20% 1,100,886 Sweden Castellum AB (76,000) 0.07% 405,770 Hemfosa Fastigheter AB CFD (110,000) 0.00% 3,738 ICA Gruppen AB (30,000) 0.03% 192,235 Total Sweden 0.10% 601,743 Total Contracts-for-Difference 0.30% 1,702,629

SECTOR CAPITAL FUNDS PLC Unaudited Interim Financial Statements
For the period 1 January 2015 to 30 June 2015
The accompanying notes form an integral part of the financial statements 18
SCHEDULES OF INVESTMENTS (continued)
As at 30 June 2015
Sector Sigma Nordic Fund (Continued)
Investment Units Fair Value as a % of
Net Assets Fair Value NOK
Financial Assets at Fair Value through profit or loss (continued) Options July 15 Puts on OBX Put 550 16/07/2015 1,500 0.09% 517,500 July 15 Puts on OMX Put 1480 17/07/2015 400 0.08% 464,607 July 15 Puts on OMX Put 1500 17/07/2015 1,500 0.43% 2,453,408 July 15 Puts on OMX Put 1530 17/07/2015 300 0.14% 810,692 Total Options 0.74% 4,246,207 Total Financial Assets at Fair Value through profit or loss 78.37% 443,942,912 Financial Liabilities at Fair Value through profit or loss Contracts-for-Difference
Norway DNB ASA (107,000) (0.12)% (704,437) OBX Stock Index (22,500) (0.04)% (219,643) Total Norway (0.16)% (924,080) Sweden Electrolux AB (73,000) (0.14)% (775,758) Total Contracts-for-Difference (0.30)% (1,699,838) Net unrealised loss on forward foreign currency contracts (note 7) (0.12)% (671,503)
Total Financial Liabilities at Fair Value through profit or loss (0.42)% (2,371,341) Total Investments at Fair Value 77.95% 441,571,571 Cash at bank and brokers 21.64% 122,601,406 Other assets in excess of liabilities 0.41% 2,316,390 Total Net Assets 100.00% 566,489,367
* Securities pledged, in whole or in part, as margin to cover derivative contracts-for-difference trading. ALL SECURITIES ARE TRANSFERABLE SECURITIES ADMITTED TO AN OFFICIAL EXCHANGE LISTING OR TRADED ON A REGULATED MARKET EXCEPT FOR CONTRACTS-FOR-DIFFERENCE, FORWARD FOREIGN CURRENCY CONTRACTS AND OPTIONS WHICH ARE FINANCIAL DERIVATIVE INSTRUMENTS Analysis of Total Assets % of Total AssetsTransferable securities admitted to an official exchange listing or traded on a regulated market 76.72%Financial derivative instruments 1.04%Other assets 22.24%Total Assets 100.00%

SECTOR CAPITAL FUNDS PLC Unaudited Interim Financial Statements
For the period 1 January 2015 to 30 June 2015
NOTES TO THE FINANCIAL STATEMENTS
19
1. Organisation and Structure
Sector Capital Funds plc (the “Company”) was incorporated and registered in Ireland under the Companies Act, 2014 as an open-ended umbrella investment company with variable capital and with segregated liability between sub-funds on 27 September 2010 with registered number 489443. The Company is authorised by the Central Bank of Ireland pursuant to European Communities (Undertakings for Collective Investment in Transferable Securities) Regulations 2011 (the “UCITS Regulations”).
As at 30 June 2015, the Company has three funds in existence (30 June 2014: three), Sector Global Equity Kernel Fund, Sector Healthcare Value Fund and Sector Sigma Nordic Fund (the “Funds”).
Sector Healthcare Value Fund commenced trading on 17 November 2010. The base currency of Sector Healthcare Value Fund is U.S. Dollars (“USD”). As at 30 June 2015, six classes are currently subscribed to in the Fund (30 June 2014: five), Class A EUR Shares, Class A NOK Shares, Class A USD Shares, Class B NOK Shares, Class B SEK Shares and Class L NOK Shares. Class B SEK Shares launched on 12 February 2015. Class A EUR Shares, Class A NOK Shares and Class A USD Shares were listed on the Irish Stock Exchange on 18 November 2010 and Class B NOK Shares on 10 September 2013.
Sector Sigma Nordic Fund commenced trading on 25 June 2012. The base currency of Sector Sigma Nordic Fund is Norwegian Krone (“NOK”). As at 30 June 2015, eight classes are currently subscribed to in the Fund (30 June 2014: eight), Class A EUR Shares, Class A NOK Shares, Class A USD Shares, Class B EUR Shares, Class B NOK Shares, Class C NOK Shares, Class C SEK Shares and Class L NOK Shares. Class C SEK Shares launched on 18 February 2015. No application has been made to list the shares on any stock exchange.
Sector Global Equity Kernel Fund commenced trading on 19 March 2014. The base currency of Sector Global Equity Kernel Fund is U.S. Dollars (“USD”). As at 30 June 2015, four classes are currently subscribed to in the Fund (30 June 2014: two), Class O NOK Shares, Class P NOK Hedged Shares, Class P NOK Unhedged Shares and Class P USD Shares. Class P NOK Hedged Shares launched on 18 February 2015 and Class P NOK Unhedged Shares launched on 20 April 2015. Class L NOK Shares were fully redeemed during March 2015. Class P USD Shares were listed on the Irish Stock Exchange on 27 March 2014.
Investment Objective
The investment objective of the Sector Global Equity Kernel Fund is to maximize long-term total return relative to MSCI ACWI Index (the "Index"). The Index is a free float-adjusted market capitalisation weighted index that is designed to measure the equity market performance of developed and emerging markets. The MSCI ACWI consists of 45 country indices comprising 24 developed and 21 emerging market country indices. There can be no guarantee that the investment objective of the Fund will be achieved.
The investment objective of Sector Healthcare Value Fund is to achieve attractive long term investment returns relative to the MSCI Daily TR World Net Health Care USD (the “Index”). The Index is a capitalisation weighted index that monitors the performance of health care stocks from around the world. The Fund may invest in equities and financial instruments that are not part of the Index. There can be no guarantee that the investment objective of the Fund will be achieved.
The investment objective of Sector Sigma Nordic Fund is to generate attractive risk adjusted return for its investors, primarily through investment in Norway, Sweden, Denmark, Finland and Iceland (the “Nordic Region”) with the aim of generating positive return over time in rising as well as falling equity markets. There can be no guarantee that the investment objective of the Fund will be achieved.
2. Summary of Significant Accounting Policies
The financial statements have been prepared in accordance with the Financial Reporting Standard 102 (“FRS 102”), the Financial Reporting Standard applicable in the UK and Republic of Ireland issued by the Financial Reporting Council and promulgated by the Institute of Chartered Accountants in Ireland and the Companies Act 2014.
FRS 102 is applicable for annual periods beginning on or after 1 January 2015. These financial statements for the period ended 30 June 2015 are the first financial statements of the Company that comply with FRS 102. Therefore the date of transition is 1 January 2014 and all comparative are presented in accordance with FRS 102.
The transition to FRS 102 resulted in a change in the fair value measurement and recognition policy of the Company, however this change has not impacted financial position or financial performance of the Company.

SECTOR CAPITAL FUNDS PLC Unaudited Interim Financial Statements
For the period 1 January 2015 to 30 June 2015
NOTES TO THE FINANCIAL STATEMENTS (Continued)
20
2. Summary of Significant Accounting Policies (Continued)
Under FRS 102, in accounting for all of its financial instruments, an entity is required to apply either (a) the full requirements of Section 11 “Basic Financial Instruments” and Section 12 “Other Financial Instruments Issues” of FRS 102, (b) the recognition and measurement provisions of International Accounting Standards 39 “Financial Instruments: Recognition and Measurement” (“IAS 39”) as adopted for use in the European Union and the disclosure requirements of Sections 11 and 12, or (c) the recognition and measurement provisions of International Financial Reporting Standards 9 “Financial Instrument” and the disclosure requirements of Sections 11 and 12. The Company has elected to apply the recognition and measurement provisions of IAS 39 and the disclosure requirements of Sections 11 and 12. However the transition to FRS 102 has not impacted on the reported financial position or financial performance of the Company.
The financial statements have been prepared under the historical cost convention, as modified by the revaluation of financial assets and financial liabilities at fair value through profit or loss in accordance with the European Communities (Fair Value Accounting) Regulations 2011.
The Company has availed of certain exemptions contained in FRS 102 Section 7.1 A “Cash Flow Statements” not to prepare a cash flow statement.
(a) Portfolio valuation
Investment transactions
(i) Classification The Company classifies all of its investments as financial assets or financial liabilities at fair value through profit or loss. These financial instruments are designated on the basis that their fair value can be reliably measured and their performance has been evaluated on a fair value basis in accordance with the risk management and/or investment strategy as set out in the Company’s Prospectus.
(ii) Recognition The Company recognises financial assets and financial liabilities on the date it becomes party to the contractual provisions of the instrument. Investment transactions are accounted for on a trade date basis at cost. Purchases and sales of securities are accounted for on the trade date on which the transaction takes place. Transaction costs are expensed immediately to the Profit and Loss Account and not capitalised as part of cost of the investment.
(iii) Measurement Financial assets and financial liabilities held for trading are measured at fair value. Fair value is the amount for which an asset could be exchanged, or a liability settled, between knowledgeable, willing parties in an arms length transaction.
Realised gains and losses on sales of investments are calculated on a First-In, First-Out (“FIFO”) basis. Unrealised gains and losses on investments are recognised in the Profit and Loss Account. Forward foreign currency contracts and any other instruments held by the Company and traded on an exchange will be measured at fair value based on the last reported traded price on such regulated market as at the relevant valuation point.
If an investment is quoted, listed or normally dealt in on more than one market, the Directors may, in their absolute discretion, select any of such markets for the valuation purposes.
(iv) Derecognition The Company derecognises a financial asset when the contractual rights to the cash flows from the financial asset expire or it transfers the financial asset and the transfer qualifies for derecognition.
A financial liability is derecognised when the obligation specified in the contract is discharged, cancelled or expired.
(b) Forward foreign currency contracts
The unrealised gain or loss on open forward foreign currency contracts is calculated by reference to the difference between the contracted rate and the rate to close out the contract. Realised gains or losses include net gains on contracts which have been settled or offset by other contracts.
(c) Options
When the Company writes or purchases put or call options, an amount equal to the premium received or paid is recorded as a liability or an asset and is subsequently marked-to-market based on quoted market prices in the Balance Sheet. Premiums received or paid from writing or purchasing put or call options which are expired or were unexercised are recognised on the expiration date as realised gains or losses in the Profit or Loss Account. If an option is exercised, the premium received or paid is included with the proceeds or the cost of the transaction to determine whether the Company has realised a gain or loss on the related investment transaction in the Profit and Loss Account. When the Company enters into a closing transaction, the Company will realise a gain or loss in the Profit or Loss Account depending upon whether the amount from the closing transaction is greater or less than the premium received or paid.

SECTOR CAPITAL FUNDS PLC Unaudited Interim Financial Statements
For the period 1 January 2015 to 30 June 2015
NOTES TO THE FINANCIAL STATEMENTS (Continued)
21
2. Summary of Significant Accounting Policies (Continued)
(d) Contracts-for-difference
A contract-for-difference (“CFD”) is a contract between two parties, buyer and seller, stipulating that the seller will pay to the buyer the difference between the current value of an asset (a security, instrument, basket or index) and its value at contract time. The payment flows are usually netted against each other, with the differences being paid by one party to the other. The unrealised gain or loss depends upon the prices at which the underlying financial instruments of the CFD is valued at and is included in the Profit and Loss Account.
(e) Foreign exchange translation
Items included in the Company’s financial statements are measured using the currency of the primary economic environment in which it operates (the “functional currency”). The functional currency of Sector Global Equity Kernel Fund is the United States Dollar (“USD”), due to the fact that the majority of the Fund’s assets are denominated in USD and that a substantial portion of capital is issued in USD. The functional currency of Sector Healthcare Value Fund is the United States Dollar (“USD”), due to the fact that the majority of the Fund’s assets are denominated in USD and that a substantial portion of capital is issued in USD. The functional currency of Sector Sigma Nordic Fund is Norwegian Krone (“NOK”), due to the fact that the majority of the Fund’s assets are denominated in NOK and that a substantial portion of capital is issued in NOK. Each Fund has adopted its functional currency as the presentation currency for these financial statements. Assets and liabilities expressed in foreign currencies are converted into the functional currency of each Fund using the exchange rates prevailing as at the balance sheet date. Transactions in foreign currencies are translated into the Fund’s functional currency at exchange rates ruling at the transaction dates. Gains and losses on foreign exchange transactions are recognised in the Profit and Loss Account in determining the result for the period.
At 30 June 2015, in accordance with FRS 102 Section 30, a period end exchange rate of NOK/USD 0.1271 (30 June 2014: NOK/USD 0.1630) was used to translate the Balance Sheet of Sector Sigma Nordic Fund in arriving at the total USD value for the Company in the financial statements.
At 30 June 2015, the Profit and Loss Account and Statement of Changes in Net Assets attributable to holders of Redeemable Participating Shares of Sector Sigma Nordic Fund have been prepared using an average rate of exchange of NOK/USD 0.1290 (30 June 2014: NOK/USD 0.1656) in arriving at the total USD value for the Company in the financial statements. This results in a foreign currency translation loss in the Statement of Changes in Net Assets attributable to holders of Redeemable Participating Shares when compared to the NOK/USD rate used at period end. The adjustment recorded in the Statement of Changes in Net Assets attributable to holders of Redeemable Participating Shares for the period ended 30 June 2015 was a loss of USD2,521,733 (30 June 2014: loss USD512,730).
(f) Offsetting financial instruments
Financial assets and financial liabilities maybe offset and the net amount reported in the Balance Sheet when there is a legally enforceable right to offset the recognised amounts and there is an intention to settle on a net basis, or realise the asset and settle the liability simultaneously. As at 30 June 2015 and 30 June 2014 no offsetting has been presented.
(g) Income
Dividends are recognised as income on the dates that securities are first quoted “ex-dividend” to the extent information thereon is reasonably available to the Company. Interest income is accrued on a daily basis. Deposit interest is recognised as income on an accruals basis.
(h) Expenses
Operating expenses are accounted for on an accruals basis.
(i) Net asset value per share
The Net Asset Value per Share of each class is calculated by dividing the Net Asset Value attributable to a class by the number of shares of a class in issue as at the relevant valuation point.
(j) Redeemable participating shares
Redeemable participating shares are redeemable at the shareholders opinion and are classified as a financial liability.
(k) Amounts due from/to broker
Amounts due from/to broker relate to the outstanding amounts pending settlement on forward foreign currency contracts and upfront cash payments for fully funded contracts-for-difference.
(l) Taxation
The Company incurs dividend withholding tax imposed by certain countries on investment income. Dividend income is shown gross of any non-recoverable withholding taxes, which are disclosed separately in Profit and Loss Account.

SECTOR CAPITAL FUNDS PLC Unaudited Interim Financial Statements
For the period 1 January 2015 to 30 June 2015
NOTES TO THE FINANCIAL STATEMENTS (Continued)
22
2. Summary of Significant Accounting Policies (Continued)
(m) Transaction costs
Transaction costs are costs incurred to acquire financial assets or financial liabilities at fair value through profit or loss. They include fees and commissions paid to agents, advisers, brokers and dealers. Transaction costs, when incurred, are immediately recognised in profit or loss as an expense. For the period ended 30 June 2015 Sector Global Equity Kernel Fund incurred transaction costs of USD54,752 (30 June 2014: USD88,690), Sector Healthcare Value Fund incurred transaction costs of USD31,214 (30 June 2014: USD42,437) and Sector Sigma Nordic incurred transaction costs of NOK1,340,362 (30 June 2014: NOK744,556).
3. Dividend and Distribution Policy
The Directors do not currently intend to pay dividends. Accordingly, the price of the shares shall rise as income and capital gains accrue.
4. Taxation
The Company will not be liable to tax in respect of its income and gains, other than on the occurrence of a chargeable event. Generally a chargeable event arises on any distribution, redemption, repurchase, cancellation, transfer of shares or on the ending of a ‘Relevant Period’, a ‘Relevant Period’ being an eight year period beginning with the acquisition of the shares by the shareholders and each subsequent period of eight years beginning immediately after the preceding relevant period.
A chargeable event does not include:
(i) Any transactions in relation to shares held in a recognised clearing system: or (ii) An exchange of shares representing a fund for another fund: or (iii) An exchange of shares arising on a qualifying amalgamation or reconstruction of a Fund with another fund: or (iv) Certain exchanges of shares between spouses and former spouses.
A chargeable event will not occur in respect of shareholders who are neither resident nor ordinarily resident in Ireland and who have provided the Company with a relevant declaration to that effect.
In the absence of an appropriate declaration, the Company will be liable to Irish Tax on the occurrence of a chargeable event. There were no chargeable events during the period under review. Capital gains, dividends and interest received may be subject to withholding taxes imposed by the country of origin and such taxes may not be recoverable by the Company or its shareholders.
5. Exchange Rates
The following exchange rates (against USD) were used to convert the investments and other assets and liabilities denominated in currencies other than USD as at 30 June 2015 and 30 June 2014:
Currency 30 June 2015 30 June 2014
Australian Dollar 1.3011 1.0594Brazilian Real 3.1066 n/aBritish Pound 0.6358 0.5848Canadian Dollar 1.2484 1.0679Chinese Renminbi 6.1996 n/aDanish Krone 6.6934 5.4466Euro 0.8975 0.7304Hong Kong Dollar 7.7519 7.7519Hungarian Forint 285.7143 227.2727Japanese Yen 121.9512 101.0101Korean Won 1,111.111 n/aNorwegian Krone 7.8678 6.1350Swedish Krona 8.2988 6.6845Swiss Franc 0.9346 0.8868Taiwan Dollar 30.8642 n/a

SECTOR CAPITAL FUNDS PLC Unaudited Interim Financial Statements
For the period 1 January 2015 to 30 June 2015
NOTES TO THE FINANCIAL STATEMENTS (Continued)
23
5. Exchange Rates (Continued)
The following exchange rates (against NOK) were used to convert the investments and other assets and liabilities denominated in currencies other than NOK as at 30 June 2015 and 30 June 2014:
Currency 30 June 2015 30 June 2014British Pound 0.0808 0.0953
Danish Krone 0.8510 0.8874
Euro 0.1141 0.1190
Swedish Krona 1.0546 1.0894
US Dollar 0.1271 0.1630
An average exchange rate of 0.1290 was used to convert NOK to USD in the Profit and Loss Account (30 June 2014: 0.1656).
6. Cash
As at 30 June 2015 and 30 June 2014 all cash balances are held with BNY Mellon Trust Company (Ireland) Limited (the “Custodian”), DNB, Goldman Sachs and Nordea.
Sector Global Equity Kernel Fund
Sector Healthcare Value Fund
Sector Sigma Nordic Fund
USD USD NOK30 June 2015BNY Mellon 2,056,248 2,261,683 20,246,236DNB - - 7,614,456Goldman Sachs 5,612 - 22,414,036Nordea - - 72,362,678
2,061,860 2,261,683 122,637,406
30 June 2014BNY Mellon 586,788 3,924,819 27,444,817DNB - - 217,898Goldman Sachs - - 4,023,438Nordea - - 5,048,794
586,788 3,924,819 36,734,947
7. Financial Instruments and Associated Risks
Included in the Company’s financial instruments, but not limited to, are global equities and equity related securities (including but not limited to American Depositary Receipts, Global Depositary Receipts, European Depositary Receipts and other equity based derivatives) that shall be listed or traded on any market.
The main risks arising from the Company’s financial instruments are market price, liquidity, foreign currency and credit risks.
The Market Risk Group (“MRG”) functions across all Sector Investment Manager entities and the group is responsible for defining risk management related limits in addition to the investment restrictions found in the Prospectus and related supplements, securing that the Funds have a portfolio construction and risk exposure that are in line with the intentions of the individual Funds. The limits are generally related to exposure towards single positions and sectors, total portfolio exposure and Value-at-Risk (“VAR”). MRG consists of the CEO of Sector Asset Management AS (leader of MRG), Head of Fund Operations and CEO of Sector Fund Services AS. The Head of Fund Operations has the mandate to give short term exceptions to the risk limits set by MRG if he/she finds that under certain market conditions, the limits have unintended adverse effects, for example in extreme market conditions. Such exceptions are reported to the other members of MRG and to the Group Chief Compliance Officer.
(a) Market price risk
Market price risk arises from uncertainty concerning future prices of financial instruments. The consequence might be a decline in the Fund’s value. The risk related to the Funds – i.e. a combination of the probability of loss and the consequences – must be weighed against the potential gain for the Fund. To limit the risk, the Funds are both diversified and constructed through fundamental analyses of the expected behaviour and volatility of the individual instruments while following each Fund’s investment objective.

SECTOR CAPITAL FUNDS PLC Unaudited Interim Financial Statements
For the period 1 January 2015 to 30 June 2015
NOTES TO THE FINANCIAL STATEMENTS (Continued)
24
7. Financial Instruments and Associated Risks (Continued)
(a) Market price risk (Continued)
The main risk management tool for VaR calculations was Bloomberg Alpha. The Bloomberg Alpha VaR calculation is based on Monte Carlo simulations at a 95% confidence interval i.e. that one in every 20 days is expected to be above this measure in the long run. The MRG utilises the commitment approach to calculate global exposure.
There are inherent limitations to VaR. While VaR offers a clear, quantifiable measure, predicting futures behaviour involves extracting patterns from past data and applying judgment and modelling to project forward. There is no guarantee that any particular combination of past data modelling or judgment will actually predict future performance. For the purposes of the figures below, the holding period is 1 day and the length of data history used in the model is one year.
For the period ended 30 June 2015
Year end VaRGross
Exposure*Net
Exposure** lowest VaR highest VaR average VaRSector Global Equity Kernel Fund 0.90% 98.7% 98.7% 0.83% 1.02% 0.94%
Year end VaRGross
Exposure*Net
Exposure** lowest VaR highest VaR average VaRSector Healthcare Value Fund 1.06% 96.8% 96.8% 0.98% 1.12% 1.05%
Year end VaRGross
Exposure*Net
Exposure** lowest VaR highest VaR average VaRSector Sigma Nordic Fund 0.58% 114.0% 40.0% 0.39% 0.86% 0.65%
* Exposure as % of NAV ** Net open position as % of NAV For the period ended 30 June 2014
Year end VaRGross
Exposure*Net
Exposure** lowest VaR highest VaR average VaRSector Global Equity Kernel Fund 1.0% 98.8% 98.8% 0.8% 1.4% 1.1%
Year end VaRGross
Exposure*Net
Exposure** lowest VaR highest VaR average VaRSector Healthcare Value Fund 1.0% 96.7% 96.7% 1.0% 1.2% 1.1%
Year end VaRGross
Exposure*Net
Exposure** lowest VaR highest VaR average VaRSector Sigma Nordic Fund 0.6% 119.2% 55.3% 0.4% 0.8% 0.6% * Exposure as % of NAV ** Net open position as % of NAV
Exposure
Exposure for pure equities is equal to the fair value of the securities. The total gross exposure of each Fund is the sum of the absolute values of all long and short exposures.

SECTOR CAPITAL FUNDS PLC Unaudited Interim Financial Statements
For the period 1 January 2015 to 30 June 2015
NOTES TO THE FINANCIAL STATEMENTS (Continued)
25
7. Financial Instruments and Associated Risks (Continued)
(b) Interest rate risk
Interest rate risk is the risk (variability in value) borne by an interest-bearing asset, due to variability of interest rates. In general, as rates rise, the price of a fixed rate bond will fall, and vice versa. Interest rate risk is commonly measured by the bond's duration. For the period ended 30 June 2015 and 30 June 2014 the Funds have not invested in interest bearing assets, other than cash amounts. As at 30 June 2015 and 30 June 2014, the Funds do not have any significant fair value interest rate risk exposure.
Tables outlining the currency and interest exposure as at 30 June 2015 and 30 June 2014 are outlined in note 7(d).
(c) Liquidity risk
Liquidity risk is linked to the Funds having to realise assets in unfavourable market conditions with large losses as a consequence due to for example, redemptions in a Fund or a collapse in long asset values. This means that there are two aspects that are monitored; what is the probability of the situation occurring and how fast can the Funds realise their positions without significant adverse effects on the value of the positions.
Liquidity of portfolio The Company’s Prospectus provides for daily subscription and redemption of shares in the Funds, therefore the Funds are exposed to a liquidity risk of meeting shareholder redemptions on a daily basis. The majority of the Funds’ assets are comprised of publicly traded securities and are thus relatively easily realised. Still, with each Fund having positions in small cap equities, the ability of a Fund to realise assets within a short period of time without a large negative impact on the value of the assets is important. Some of the recognised exchanges on which a Fund may invest may prove to be less liquid or highly volatile from time to time. The Funds may invest a limited proportion of their assets in unquoted securities.
For the period ended 30 June 2015 and 30 June 2014, the Funds held very liquid assets and liquidity was monitored daily by the Investment Manager.
The reports below are snapshots of the estimated liquidity of the Funds as at 30 June 2015:
Sector Global Equity KernelDescription Cumulative
< 1 day 100%
Sector Healthcare Value FundDescription Cumulative
< 1 day 98.00%1-2 days 100.00%
Sector Sigma Nordic FundDescription Cumulative
< 1 day 87%1-2 days 93%3-5 days 95%1-2 weeks 97%3-4 weeks 97%> 4 weeks 100%

SECTOR CAPITAL FUNDS PLC Unaudited Interim Financial Statements
For the period 1 January 2015 to 30 June 2015
NOTES TO THE FINANCIAL STATEMENTS (Continued)
26
7. Financial Instruments and Associated Risks (Continued)
(c) Liquidity risk (Continued)
The reports below are snapshots of the estimated liquidity of the Funds as at 30 June 2014:
Sector Global Equity KernelDescription Cumulative
< 1 day 100%1-2 days 100%
Sector Healthcare Value FundDescription Cumulative
< 1 day 97.00%1-2 days 100.00%
Sector Sigma Nordic FundDescription Cumulative
< 1 day 92%1-2 days 95%3-5 days 100%
(d) Foreign currency risk
A substantial portion of the financial assets of the Funds are denominated in currencies other than the relevant Fund’s functional currency with the effect that the balance sheet of the Funds can be significantly affected by currency movements.
Foreign currency risk is in reality a sub-group of market risk, but with its own idiosyncrasies, both with respect to the Funds portfolio as well as the investor classes denominated in different currencies. Certain currency related transactions may, for example, be employed by the Funds in order to hedge against foreign exchange risk subject to the conditions and limits laid down by the Central Bank of Ireland. Such transactions include forward foreign currency contracts and may for example be executed in cases where an investment is in a currency other than the Fund’s functional currency.
Currency exposure for investor classes The shares of the Company are denominated in United States Dollar (USD), Euro (EUR), Norwegian Krone (NOK) and Swedish Krona (SEK) and are issued and redeemed in those currencies. The Investment Manager may seek to hedge the foreign currency exposure of the assets attributable to the shares in order to neutralise as far as reasonably possible, the impact of fluctuations in exchange rates. This is done monthly in addition to when a Fund has more than 3% absolute return, month to date. There is no guarantee that such hedging will give returns that are equal regardless of which currency the shareholders have invested in. In addition, shareholders whose assets and liabilities are predominantly in currencies other than the currency of investment in the Company should take into account the potential risk of loss arising from fluctuations in value between USD, EUR, NOK or SEK being the currency of shareholder investment, and such other currencies as invested in by the Company.
Portfolio currency exposure The Funds trade in many different markets across the world and in many different currencies. Thus, certain assets in the portfolio may, regardless of the shares of the Fund, be invested in securities which are denominated in currencies other than USD, EUR, NOK or SEK. Consequently, the value of such assets will be affected either favourably or unfavourably by fluctuations in currency rates. The exposure towards the different currencies based on the denomination of the securities is reported daily for each Fund. For each individual Fund, action towards currency exposure in the portfolio is taken by the Investment Manager based on reported exposure of the Fund’s assets.
Amounts represented below primarily are monetary assets and monetary liabilities except for investments in non-interest bearing securities, which include equities and contracts-for-difference, which are non-monetary assets.

SECTOR CAPITAL FUNDS PLC Unaudited Interim Financial Statements
For the period 1 January 2015 to 30 June 2015
NOTES TO THE FINANCIAL STATEMENTS (Continued)
27
7. Financial Instruments and Associated Risks (Continued)
(d) Foreign currency risk (Continued)
The foreign currency exposure as at 30 June 2015 is as follows: Cash Forward Investments in Investments in Investments in Net Other at Bank Currency Interest Non-Interest Non-Interest Assets/ Total NetSector Global Equity Kernel Fund
and Brokers Contracts Bearing Assets Bearing Assets Bearing Liabilities (Liabilities) Asset Value
Currency USD USD USD USD USD USD USDAUD 1,987 – – 492,864 – – 494,851 BRL 142 – – – – – 142 CAD 316 – – – – – 316 CHF 131 – – 471,500 – – 471,631 CNY – – – 670,355 – – 670,355 DKK 68 – – 504,658 – – 504,726 EUR 20,756 – – 4,120,016 – – 4,140,772 GBP 1,660 – – 1,466,753 – 2,744 1,471,157 HKD 7,772 – – 972,922 – 441 981,135 JPY 10,623 – – 3,375,994 – 1,060 3,387,677 KRW – – – 282,133 – – 282,133 NOK 4,171 36,362 – 270,073 – – 310,606 SEK 181 – – 252,418 – – 252,599 TWD 23 – – 242,623 – – 242,646 USD 2,014,030 – – 13,209,239 – (420,687) 14,802,582 Total 2,061,860 36,362 – 26,331,548 – (416,442) 28,013,328
Cash Forward Investments in Investments in Investments in Net Other at Bank Currency Interest Non-Interest Non-Interest Assets/ Total NetSector Healthcare Value Fund
and Brokers Contracts Bearing Assets Bearing Assets Bearing Liabilities (Liabilities) Asset Value
Currency USD USD USD USD USD USD USDCHF 8,720 – – 1,632,016 – – 1,640,736 DKK 121 – – 2,119,397 – – 2,119,518 EUR 28,548 35,251 – 5,975,734 – – 6,039,533 GBP 3,632 – – 3,855,907 – 38,846 3,898,385 HUF 36 – – – – – 36 JPY 29,097 – – 2,878,764 – 6,920 2,914,781 NOK 35,253 136,117 – – – – 171,370 SEK 6,917 42 – 701,730 – – 708,689 USD 2,149,359 – – 32,590,160 – (1,001,800) 33,737,719 Total 2,261,683 171,410 – 49,753,708 – (956,034) 51,230,767
Cash Forward Investments in Investments in Investments in Net Other at Bank Currency Interest Non-Interest Non-Interest Assets/ Total NetSector Sigma Nordic Fund
and Brokers Contracts Bearing Assets Bearing Assets Bearing Liabilities (Liabilities) Asset Value
Currency NOK NOK NOK NOK NOK NOK NOKDKK 262,715 – – 56,951,920 – – 57,214,635 EUR 351,356 (253,068) – 68,985,937 – – 69,084,225 GBP 482 – – – – – 482 NOK 120,701,570 – – 76,225,736 (924,080) 2,316,390 198,319,616 SEK 793,418 (124,430) – 218,355,018 (775,758) – 218,248,248 USD 491,865 (294,005) – 23,424,301 – – 23,622,161 Total 122,601,406 (671,503) – 443,942,912 (1,699,838) 2,316,390 566,489,367

SECTOR CAPITAL FUNDS PLC Unaudited Interim Financial Statements
For the period 1 January 2015 to 30 June 2015
NOTES TO THE FINANCIAL STATEMENTS (Continued)
28
7. Financial Instruments and Associated Risks (Continued)
(d) Foreign currency risk (Continued)
The foreign currency exposure as at 30 June 2014 is as follows: Cash Forward Investments in Investments in Investments in Net Other at Bank Currency Interest Non-Interest Non-Interest Assets/ Total NetSector Global Equity Kernel Fund
and Brokers Contracts Bearing Assets Bearing Assets Bearing Liabilities (Liabilities) Asset Value
Currency USD USD USD USD USD USD USDAUD 30,750 – – 300,251 – – 331,001 CAD 2,484 – – 304,698 – 794 307,976 CHF 596 – – 420,351 – 76,202 497,149 DKK 122 – – 201,579 – – 201,701 EUR 36,100 – – 1,998,293 – (85,346) 1,949,047 GBP 31,869 – – 382,820 – (83,549) 331,140 HKD – – – 103,815 – (103,653) 162 JPY 4,463 – – 823,561 – – 828,024 NOK 174,022 – – 425,237 – 84,746 684,005 SEK 127 – – – – – 127 USD 306,255 – – 5,434,847 – (338,332) 5,402,770 Total 586,788 – – 10,395,452 – (449,138) 10,533,102
Cash Forward Investments in Investments in Investments in Net Other at Bank Currency Interest Non-Interest Non-Interest Assets/ Total NetSector Healthcare Value Fund
and Brokers Contracts Bearing Assets Bearing Assets Bearing Liabilities (Liabilities) Asset Value
Currency USD USD USD USD USD USD USDCHF 3,207 – – 2,543,843 – – 2,547,050 DKK 151 – – 2,953,060 – – 2,953,211 EUR 33,196 165,908 – 7,710,950 – – 7,910,054 GBP 1,319 – – 5,109,331 – – 5,110,650 HUF 45 – – – – – 45 JPY 9,643 – – 8,489,430 – – 8,499,073 NOK 1,958 (14,709) – – – – (12,751) SEK 369 – – 937,105 – – 937,474 USD 3,874,931 – – 56,394,455 – (1,097,834) 59,171,552 Total 3,924,819 151,199 – 84,138,174 – (1,097,834) 87,116,358
Cash Forward Investments in Investments in Investments in Net Other at Bank Currency Interest Non-Interest Non-Interest Assets/ Total NetSector Sigma Nordic Fund
and Brokers Contracts Bearing Assets Bearing Assets Bearing Liabilities (Liabilities) Asset Value
Currency NOK NOK NOK NOK NOK NOK NOKDKK 1,114 – – 41,272,117 (531,423) – 40,741,808 EUR 282,840 262,759 – 19,786,659 – – 20,332,258 GBP 105,330 – – – – – 105,330 NOK 24,915,239 – – 74,895,300 (219,284) (2,684,482) 96,906,773 SEK 11,304,819 – – 65,334,318 (781,444) – 75,857,693 USD 125,605 5,359 – 24,558,076 (840,027) – 23,849,013 Total 36,734,947 268,118 – 225,846,470 (2,372,178) (2,684,482) 257,792,875

SECTOR CAPITAL FUNDS PLC Unaudited Interim Financial Statements
For the period 1 January 2015 to 30 June 2015
NOTES TO THE FINANCIAL STATEMENTS (Continued)
29
7. Financial Instruments and Associated Risks (Continued)
(d) Foreign currency risk (Continued)
As at 30 June 2015 the following forward foreign currency contracts were held by the Funds: Sector Global Equity Kernel Fund
Maturity Date Counterparty Sale Currency Amount Purchase Currency Amount Unrealised gain/(loss)
USD
3/8/2015 BNY Mellon USD 5,321,766 NOK 42,189,900 36,362
36,362 Total unrealised gain on forward foreign currency contracts Sector Healthcare Value Fund
Maturity Date Counterparty Sale Currency Amount Purchase Currency Amount Unrealised gain/(loss)
USD
3/8/2015 BNY Mellon USD 13,071,075 EUR 11,757,524 35,251
3/8/2015 BNY Mellon USD 19,924,066 NOK 157,953,880 136,117
3/8/2015 BNY Mellon USD 12,984 SEK 108,000 42
171,410 Total unrealised gain on forward foreign currency contracts Sector Sigma Nordic Fund
Maturity Date Counterparty Sale Currency Amount Purchase Currency Amount Unrealised gain/(loss)
NOK
3/8/2015 BNY Mellon NOK 56,120,047 EUR 6,364,946 (253,068)
3/8/2015 BNY Mellon NOK 39,655,934 SEK 41,628,024 (124,430)
3/8/2015 BNY Mellon NOK 43,163,909 USD 5,444,489 (294,005)
(671,503) Total unrealised loss on forward foreign currency contracts
As at 30 June 2014 the following open forward foreign currency contracts were held by the Funds:
Sector Healthcare Value Fund
Maturity Date Counterparty Sale Currency Amount Purchase Currency Amount Unrealised gain/(loss)
USD
1/8/2014 BNY Mellon USD 28,775,640 EUR 21,135,636 165,908
1/8/2014 BNY Mellon USD 16,891,187 NOK 103,692,039 (14,709)
151,199 Total unrealised gain on forward foreign currency contracts
Sector Sigma Nordic Fund
Maturity Date Counterparty Sale Currency Amount Purchase Currency Amount Unrealised gain/(loss)
NOK
1/8/2014 BNY Mellon NOK 39,447,751 EUR 4,719,929 262,759
1/8/2014 BNY Mellon NOK 5,900,766 USD 961,256 5,359
268,118 Total unrealised gain on forward foreign currency contracts (e) Credit risk
Credit risk is the risk that a counterparty will fail to discharge an obligation or commitment that is has entered into with the Funds.
The Funds are exposed to credit risk associated with counterparties with whom it trades or hold assets, and will also be exposed to the risk of settlement default. All transactions in listed securities are settled/paid for upon delivery using approved brokers. The risk of default is considered minimal, as delivery of securities sold is only made once the broker has received payment. Payment is made on a purchase once the securities have been received by the broker. The trade will fail if either party fails to meet its obligation.

SECTOR CAPITAL FUNDS PLC Unaudited Interim Financial Statements
For the period 1 January 2015 to 30 June 2015
NOTES TO THE FINANCIAL STATEMENTS (Continued)
30
7. Financial Instruments and Associated Risks (Continued)
(e) Credit risk (Continued)
Trade counterparty The Funds mitigate counterparty risk by undertaking transactions with large and well capitalised counterparties. The Funds also seek to trade with more than one counterparty and have reduced the activity with counterparties when there have been questions raised regarding the robustness of counterparties in terms of credit risk.
Although it is the intention of the Investment Managers to follow a general policy of seeking to spread the Funds’ capital at risk over a number of investments and counterparties, the Funds may at certain times hold relatively few positions with the result that a loss in any such position either to trading counterparty or settlement default could have a substantial adverse impact on a Fund’s capital.
The table below shows the long-term S&P credit ratings for the counterparties that hold cash as at 30 June 2015 and 30 June 2014:
30 June 2015 30 June 2014BNY Mellon A+ A+DNB A+ A+Goldman Sachs International A- A-Nordea Bank AA- AA-
The value of underlying securities, held by Sector Sigma Nordic Fund, pledged as collateral with Goldman Sachs, in relation to derivative contracts-for-difference trading as at 30 June 2015 was as follows:
Sector Sigma Nordic Fund
Security Counterparty Market Value
of Margin NOK
AarhusKarlshamn AB Goldman Sachs 7,861,648 Royal UNIBREW A/S Goldman Sachs 8,761,770
(f) Fair value estimation
FRS 102 requires the Company to classify fair value measurements using a fair value hierarchy that reflects the significance of the inputs used in making the measurements. The fair value hierarchy has the following levels:
Level A Fair valued using quoted price for an identical asset or liability in an active market. Quoted in an active market in this context means quoted prices are readily and regularly available and those prices represent actual and regularly occurring market transactions on an arm’s length basis.
Level B Fair valued using the price of a recent transaction for an identical asset or liability for which quoted prices are unavailable as long as there has not been a significant change in economic circumstances or a significant lapse of time since the transaction took place.
Level C Fair valued using a valuation technique which includes using recent arm’s length market transactions for an identical asset or liability, reference to the current fair value of another asset that is substantially the same as the asset being measured, discounted cash flow analysis and option pricing models. A valuation technique is expected to provide a reliable estimate of fair value if it reasonably reflects how the market could be expected to price the asset or liability and the inputs to the valuation technique reasonably represent market expectations and measures of the risk return factors inherent in the asset or liability.
The level in the fair value hierarchy within which the fair value measurement is categonsed is determined on the basis of the lowest level input that is significant to the fair value measurement in its entirety. For this purpose, the significance of an input is assessed against the fair value measurement in its entirety. If a fair value measurement uses inputs that are unobservable, that measurement is a Level C measurement. Assessing the significance of a particular input to the fair value measurement in its entirety requires judgement, considering factors specific to the asset or liability.
The determination of what constitutes ‘observable’ requires significant judgement by the Company. The Company considers observable data to be that market data that is readily available, regularly distributed or updated, reliable and verifiable, not proprietary, and provided by independent sources that are actively involved in the relevant market.
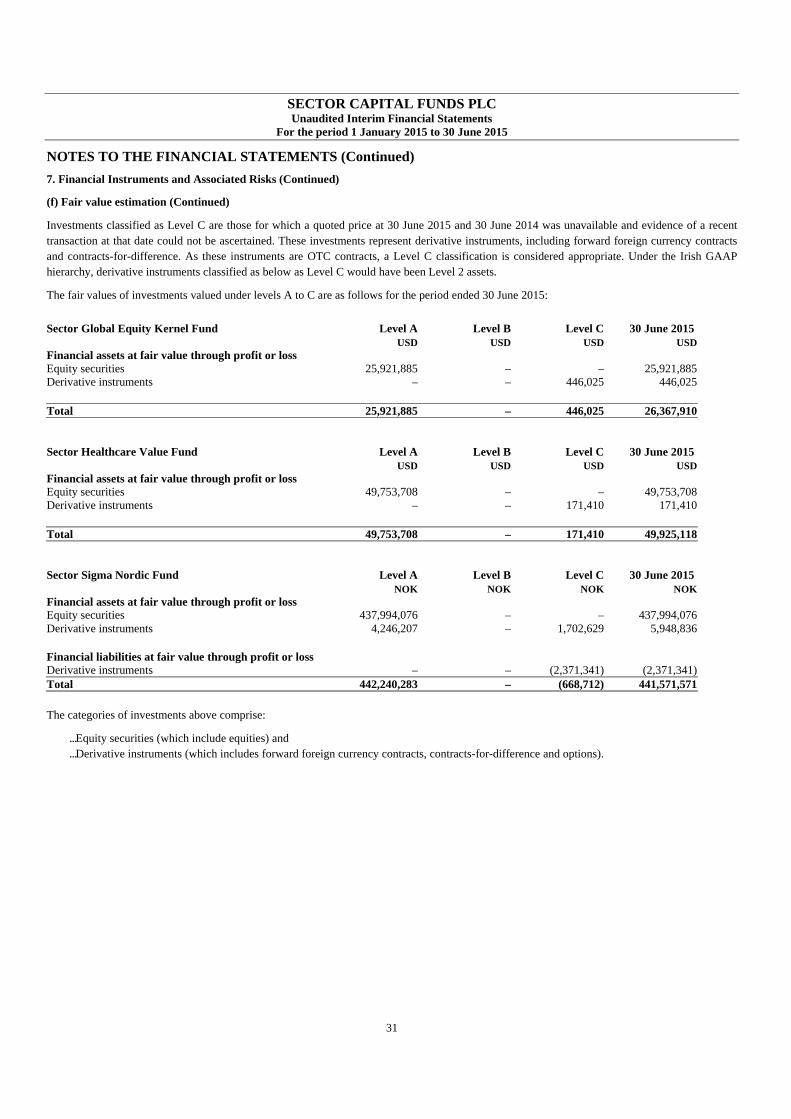
SECTOR CAPITAL FUNDS PLC Unaudited Interim Financial Statements
For the period 1 January 2015 to 30 June 2015
NOTES TO THE FINANCIAL STATEMENTS (Continued)
31
7. Financial Instruments and Associated Risks (Continued)
(f) Fair value estimation (Continued)
Investments classified as Level C are those for which a quoted price at 30 June 2015 and 30 June 2014 was unavailable and evidence of a recent transaction at that date could not be ascertained. These investments represent derivative instruments, including forward foreign currency contracts and contracts-for-difference. As these instruments are OTC contracts, a Level C classification is considered appropriate. Under the Irish GAAP hierarchy, derivative instruments classified as below as Level C would have been Level 2 assets.
The fair values of investments valued under levels A to C are as follows for the period ended 30 June 2015:
Sector Global Equity Kernel Fund Level A Level B Level C 30 June 2015 USD USD USD USDFinancial assets at fair value through profit or loss Equity securities 25,921,885 – – 25,921,885Derivative instruments – – 446,025 446,025 Total 25,921,885 – 446,025 26,367,910
Sector Healthcare Value Fund Level A Level B Level C 30 June 2015 USD USD USD USDFinancial assets at fair value through profit or loss Equity securities 49,753,708 – – 49,753,708Derivative instruments – – 171,410 171,410 Total 49,753,708 – 171,410 49,925,118
Sector Sigma Nordic Fund Level A Level B Level C 30 June 2015 NOK NOK NOK NOKFinancial assets at fair value through profit or loss Equity securities 437,994,076 – – 437,994,076Derivative instruments 4,246,207 – 1,702,629 5,948,836 Financial liabilities at fair value through profit or loss Derivative instruments – – (2,371,341) (2,371,341)Total 442,240,283 – (668,712) 441,571,571
The categories of investments above comprise:
• Equity securities (which include equities) and • Derivative instruments (which includes forward foreign currency contracts, contracts-for-difference and options).
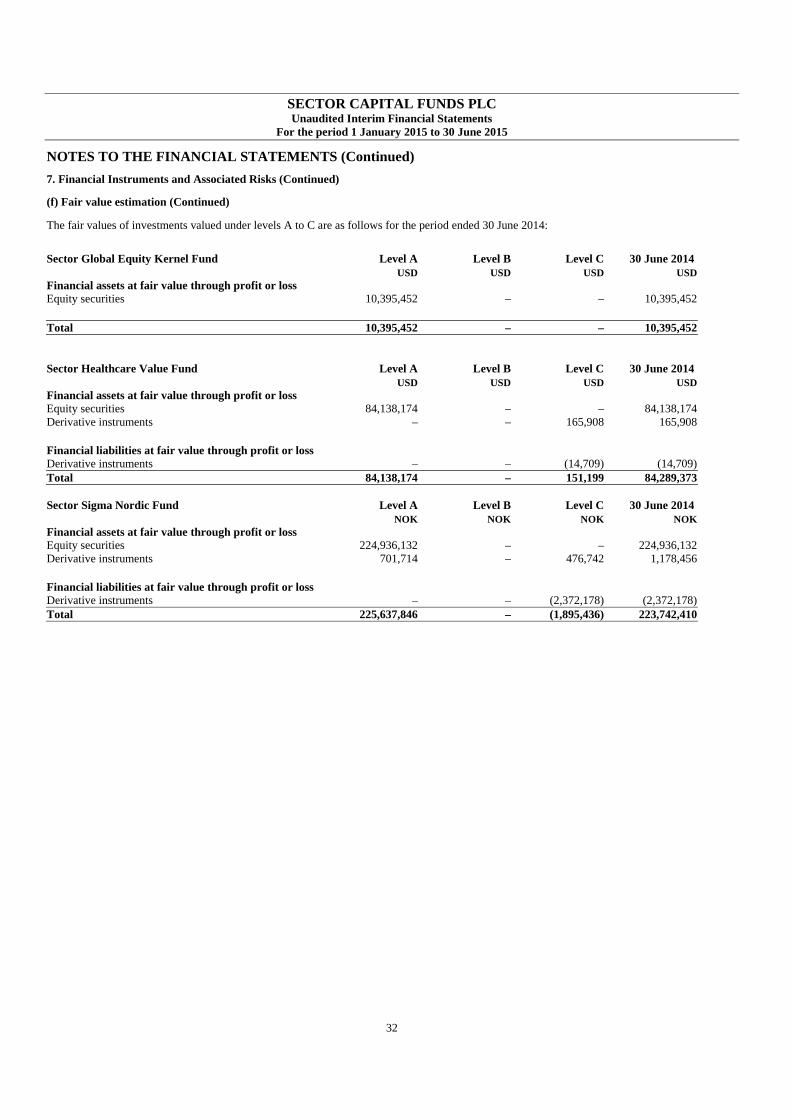
SECTOR CAPITAL FUNDS PLC Unaudited Interim Financial Statements
For the period 1 January 2015 to 30 June 2015
NOTES TO THE FINANCIAL STATEMENTS (Continued)
32
7. Financial Instruments and Associated Risks (Continued)
(f) Fair value estimation (Continued)
The fair values of investments valued under levels A to C are as follows for the period ended 30 June 2014:
Sector Global Equity Kernel Fund Level A Level B Level C 30 June 2014 USD USD USD USDFinancial assets at fair value through profit or loss Equity securities 10,395,452 – – 10,395,452 Total 10,395,452 – – 10,395,452
Sector Healthcare Value Fund Level A Level B Level C 30 June 2014 USD USD USD USDFinancial assets at fair value through profit or loss Equity securities 84,138,174 – – 84,138,174Derivative instruments – – 165,908 165,908 Financial liabilities at fair value through profit or loss Derivative instruments – – (14,709) (14,709)Total 84,138,174 – 151,199 84,289,373
Sector Sigma Nordic Fund Level A Level B Level C 30 June 2014 NOK NOK NOK NOKFinancial assets at fair value through profit or loss Equity securities 224,936,132 – – 224,936,132Derivative instruments 701,714 – 476,742 1,178,456 Financial liabilities at fair value through profit or loss Derivative instruments – – (2,372,178) (2,372,178)Total 225,637,846 – (1,895,436) 223,742,410

SECTOR CAPITAL FUNDS PLC Unaudited Interim Financial Statements
For the period 1 January 2015 to 30 June 2015
NOTES TO THE FINANCIAL STATEMENTS (Continued)
33
8. Share Capital The authorised share capital of the Company is 1,000,000,000,000 Shares of no par value initially designated as unclassified shares. The issued share capital of the Company is €2 represented by 2 shares (the “Subscriber Shares”) issued for the purposes of the incorporation of the Company at an issue price of €1 per Share which are fully paid up and which are beneficially owned by Sector Asset Management AS and Sector Fund Services AS.
Sector Global Equity Kernel Fund may issue Class A EUR Shares, Class A NOK Shares, Class A SEK Shares and Class A USD Shares (the “Class A Shares”), Class B EUR Shares, Class B NOK Shares, Class B SEK Shares and Class B USD Shares (the “Class B Shares”), Class C EUR Shares, Class C NOK Shares, Class C SEK Shares and Class C USD Shares (the “Class C Shares”), Class L NOK Shares, Class O NOK Shares, and Class P NOK Hedged Shares, Class P NOK Unhedged Shares and Class P USD Shares (“the Class P Shares”).
Sector Healthcare Value Fund may issue Class A EUR Shares, Class A NOK Shares, Class A SEK Shares and Class A USD Shares (the “Class A Shares”), Class B EUR Shares, Class B NOK Shares, Class B SEK Shares and Class B USD Shares (the “Class B Shares”) and Class L NOK Shares.
Sector Sigma Nordic Fund may issue Class A EUR Shares, Class A NOK Shares, Class A SEK Shares and Class A USD Shares (the “Class A Shares”), Class B EUR Shares, Class B NOK Shares, Class B SEK Shares and Class B USD Shares (the “Class B Shares”), Class C NOK Shares and Class C SEK Shares (the “Class C Shares”), Class D EUR Shares, Class D NOK Shares, Class D SEK Shares and Class D USD Shares (the “Class D Shares”) and Class L NOK Shares.
On a show of hands every holder who is present in person or by proxy shall have one vote and the holders of Subscriber Shares present or in person or by proxy shall have one vote.
The rights attached to any class may, be varied or abrogated with the consent in writing of the holders of three-fourths in number of the issued Shares of that class, or with the sanction of a special resolution passed at a separate general meeting of the holders of the Shares of the class, and may be so varied or abrogated either whilst the Company is a going concern or during or in contemplation of a winding-up. The quorum at any such separate general meeting, other than an adjourned meeting, shall be two persons holding or representing by proxy at least one third of the issued Shares of the class in question and the quorum at an adjourned meeting shall be one person holding Shares of the class in question or his proxy.
Class L NOK Shares and Class O NOK (issued by Sector Global Equity Kernel Fund) are only available for subscription by (i) other funds, (including sub-funds of the Company), or similar collective investment schemes that a Sector Group (as defined in the Company’s prospectus) company manages; (ii) the Directors; (iii) any person or investor connected with any such person or entity referred to in parts (i) and (ii) including, without limitation, a trustee of a trust established by or for such an entity, (iv) any company, partnership or other entity controlled by a Sector Group company (v) any company, partnership or other entity which has been appointed or acts as investment manager or investment adviser of an entity referred to in part (i), (vi) any employee of the Sector Group or (vii) any nominee of any of the foregoing.
The Class L NOK Shares (issued by Sector Healthcare Value Fund and Sector Sigma Nordic Fund) are open for public participation. However, the Investment Manager intends the Class L NOK Shares will be primarily invested in by any employees of a Sector Group company, any spouse of such employee, or any company controlled by (one or more) such employee or spouse.
Class L NOK Shares (issued by all Funds) are exempt from paying investment management fees.
The following are the share class transactions during the period ended 30 June 2015:
Sector Global
Equity Kernel FundSector Healthcare
Value FundSector Sigma Nordic Fund
Class A EUR Shares in issue at beginning of period – 97,848 47,121 Number of shares issued – 6,278 29,877 Number of shares redeemed – (42,725 ) (27,839 )Number in issue at end of period – 61,401 49,159 Class A NOK Shares in issue at beginning of period – 15,692 74,103 Number of shares issued – 607 108,246 Number of shares redeemed – – – Number in issue at end of period – 16,299 182,349

SECTOR CAPITAL FUNDS PLC Unaudited Interim Financial Statements
For the period 1 January 2015 to 30 June 2015
NOTES TO THE FINANCIAL STATEMENTS (Continued)
34
8. Share Capital (Continued)
Sector Global
Equity Kernel FundSector Healthcare
Value FundSector Sigma Nordic Fund
Class A USD Shares in issue at beginning of period – 85,070 1,355 Number of shares issued – 9,047 47,491 Number of shares redeemed – (25,229 ) (247 )Number in issue at end of period – 68,888 48,599 Class B EUR Shares in issue at beginning of period – – 10,416 Number of shares issued – – 5,944 Number of shares redeemed – – (9,304 )Number in issue at end of period – – 7,056 Class B NOK Shares in issue at beginning of period – 96,094 88,301 Number of shares issued – 26,497 20,760 Number of shares redeemed – (28,285 ) (19,525 )Number in issue at end of period – 94,306 89,536 Class B SEK Shares in issue at beginning of period – – – Number of shares issued – 118 – Number of shares redeemed – – – Number in issue at end of period – 118 – Class C NOK Shares in issue at beginning of period – – 2,498 Number of shares issued – – 937 Number of shares redeemed – – (1,020 )Number in issue at end of period – – 2,415 Class C SEK Shares in issue at beginning of period – – – Number of shares issued – – 51,383 Number of shares redeemed – – (10,114 )Number in issue at end of period – – 41,269 Class L NOK Shares in issue at beginning of period 4,000 25,492 20,184 Number of shares issued – – 76 Number of shares redeemed (4,000 ) – – Number in issue at end of period – 25,492 20,260 Class O NOK Shares in issue at beginning of period 1,623 – – Number of shares issued 9,020 – – Number of shares redeemed (8,895 ) – – Number in issue at end of period 1,748 – – Class P NOK Hedged Shares in issue at beginning of period – – – Number of shares issued 100,223 – – Number of shares redeemed (47,915 ) – – Number in issue at end of period 52,308 – – Class P NOK Unhedged Shares in issue at beginning of period – – – Number of shares issued 82,274 – – Number of shares redeemed – – – Number in issue at end of period 82,274 – –

SECTOR CAPITAL FUNDS PLC Unaudited Interim Financial Statements
For the period 1 January 2015 to 30 June 2015
NOTES TO THE FINANCIAL STATEMENTS (Continued)
35
8. Share Capital (Continued)
Sector Global
Equity Kernel FundSector Healthcare
Value FundSector Sigma Nordic Fund
Class P USD Shares in issue at beginning of period 90,075 – – Number of shares issued 59,508 – – Number of shares redeemed (24,503 ) – – Number in issue at end of period 125,080 – – The following are the share class transactions during the period ended 30 June 2014:
Sector Global
Equity Kernel FundSector Healthcare
Value FundSector Sigma Nordic Fund
Class A EUR Shares in issue at beginning of period – 98,930 – Number of shares issued – 39,943 29,432 Number of shares redeemed – (2,317 ) (4,072 )Number in issue at end of period – 136,556 25,360 Class A NOK Shares in issue at beginning of period – 15,692 42,745 Number of shares issued – – 24,393 Number of shares redeemed – – – Number in issue at end of period – 15,692 67,138 Class A USD Shares in issue at beginning of period – 223,138 – Number of shares issued – 23,492 9,577 Number of shares redeemed – (60,316 ) – Number in issue at end of period – 186,314 9,577 Class B EUR Shares in issue at beginning of period – – 16,805 Number of shares issued – – 1,387 Number of shares redeemed – – – Number in issue at end of period – – 18,192 Class B NOK Shares in issue at beginning of period – 64,332 91,523 Number of shares issued – 19,220 10,724 Number of shares redeemed – (18,705 ) (18,215 )Number in issue at end of period – 64,847 84,032 Class B USD Shares in issue at beginning of period – – 6,454 Number of shares issued – – 1,343 Number of shares redeemed – – (7,778 )Number in issue at end of period – – 19 Class C NOK Shares in issue at beginning of period – – 2,071 Number of shares issued – – 1,582 Number of shares redeemed – – – Number in issue at end of period – – 3,653 Class L NOK Shares in issue at beginning of period – 25,492 5,936 Number of shares issued – – 1,475 Number of shares redeemed – – – Number in issue at end of period – 25,492 7,411
SECTOR CAPITAL FUNDS PLC Unaudited Interim Financial Statements
For the period 1 January 2015 to 30 June 2015
NOTES TO THE FINANCIAL STATEMENTS (Continued)
36
8. Share Capital (Continued)
Sector Global
Equity Kernel FundSector Healthcare
Value FundSector Sigma Nordic Fund
Class O NOK Shares in issue at beginning of period – – – Number of shares issued 12,874 – – Number of shares redeemed – – – Number in issue at end of period 12,874 – – Class P USD Shares in issue at beginning of period – – – Number of shares issued 86,440 – – Number of shares redeemed – – – Number in issue at end of period 86,440 – – 9. Investment Management Fees The Company has appointed Sector Omega AS as Investment Manager to Sector Global Equity Kernel Fund, Sector Gamma AS as Investment Manager to Sector Healthcare Value Fund and has appointed Sigma Fondsforvaltning AS as Investment Manager to Sector Sigma Nordic Fund to provide investment management services pursuant to the investment management agreement between the Company and the Investment Manager.
Sector Global Equity Kernel Fund pays the Investment Manager a management fee of up to 1.5 per cent per annum of the Net Asset Value of the Class A Shares, up to 0.75 per cent per annum of the Net Asset Value of the Class B Shares, up to 0.5 per cent per annum of the Net Asset Value of the Class C Shares, up to 0.3 per cent per annum of the Net Asset Value of the Class P Shares and up to 3.0 per cent per annum of the Net Asset Value of the Class O Shares. The Investment Manager does not charge a fee in respect of the Class L NOK Shares.
Sector Healthcare Value Fund pays the Investment Manager a management fee of 1 per cent per annum of the Net Asset Value of Class A Shares and 2 per cent per annum of the Net Asset Value of Class B Shares. The Investment Manager does not charge a fee in respect of the Class L NOK Shares.
Sector Sigma Nordic Fund pays the Investment Manager a management fee of 1 per cent per annum of the Net Asset Value of Class A Shares, 1.5 per cent per annum of the Net Asset Value of Class B Shares, 2 per cent per annum of the Net Asset Value of Class C Shares and 1.5 per cent per annum of the Net Asset Value of Class D Shares. The Investment Manager will not charge a fee in respect of Class L NOK Shares.
The management fees accrued for the period ended 30 June 2015 were USD667,926 (30 June 2014: USD706,560) and the amount outstanding at 30 June 2015 was USD175,554 (30 June 2014: USD167,032).
The Investment Manager to Sector Global Equity Kernel Fund does not anticipate that the "Total Expense Ratio" which includes but is not limited to the management fee, administration fees and expenses, custodian fees and expenses, establishment costs of the Fund and other operating expenses of the Fund will exceed 0.5% of the Net Asset Value of Class P USD Shares each year of the Fund’s operation (the “TER Threshold”). If the Total Expense Ratio exceeds the TER Threshold, the Investment Manager has undertaken to discharge that proportion of the Total Expense Ratio of Class P USD Shares above the TER Threshold and shall rebate the Fund accordingly.
The Investment Manager will invest in Class O NOK Shares in Sector Global Equity Kernel Fund and beginning on the date the Class O NOK subscription is booked to the Fund, the aggregate fees for Class P USD above the Class P USD threshold will be funded in this order on an ongoing basis; i) by utilising the 3% management fee attributable to Class O NOK, then ii) by utilising any preliminary charges attributable to Class O NOK accrued on the Fund. If the amounts funded in accordance with (i) and (ii) are not sufficient to achieve the Class P USD TER Threshold, then this excess cost shall accrue and be offset against future fees attributable to the Investment Manager, including future preliminary charges attributable to future investments in Class O NOK.
The total fees waived by the Investment Manager for the period ended 30 June 2015 was USD66,774 (30 June 2014: USD34,294) and the amount outstanding at 30 June 2015 was USD12,951 (30 June 2014: USD3,113).
10. Incentive Fees The Investment Manager is also entitled to receive an incentive fee, as calculated on the following basis:
Sector Global Equity Kernel Fund The Fund, in respect of the Class B Shares, Class C Shares and Class O NOK Shares pays the Investment Manager an incentive fee (the "Incentive Fee") equal to 10 per cent of the amount by which the Net Asset Value (before the deduction of any performance fee) of the relevant Class exceeds the MSCI ACWI Index (“Index”) adjusted Prior High Net Asset Value (“Index adjusted Prior High Net Asset Value”) (as defined below). No Incentive Fee is charged in respect of the Class A Shares, Class P Shares and Class L NOK Shares.

SECTOR CAPITAL FUNDS PLC Unaudited Interim Financial Statements
For the period 1 January 2015 to 30 June 2015
NOTES TO THE FINANCIAL STATEMENTS (Continued)
37
10. Incentive Fees (Continued) The Incentive Fee is calculated on a share-by-share basis so that each share is charged a fee which equates precisely with that share's performance over each Calculation Period (as defined below). This method of calculation ensures that (i) any Incentive Fee paid to the Investment Manager is charged only to those shares which have outperformed their respective Prior High Net Asset Value over the course of a Calculation Period, (ii) all holders of shares have the same amount of capital per share at risk in the Fund, and (iii) all shares in a particular class have the same net asset value per share.
The Incentive Fee shall only be payable on the amount by which each share outperforms the previous high watermark or Index adjusted Prior High net asset value for the relevant share. For each Calculation Period, an Incentive Fee will only be payable by a particular share if the net asset value of that share at the end of a Calculation Period is greater than the prevailing Prior High Net Asset Value for that share.
The "Prior High Net Asset Value" of each share is the highest net asset value per share on which Incentive Fee was paid in respect of any previous Calculation Period (or, if no Incentive Fee has yet been paid with respect to any such Calculation Period, the Initial Issue Price of the relevant share). The "Index adjusted Prior High Net Asset Value" of each share is the Prior High Net Asset Value adjusted by the performance of the Index for the relevant Calculation Period.
The calculation period for the Incentive Fee shall be a calendar year, closing on the 31 December each year (or if the 31 December is not a Business Day, on the last Business Day of the year) (the “Calculation Period”). The first Calculation Period shall be the period from the close of the initial offer period until the 31 December 2014. Thereafter, the Incentive Fee will be calculated on an annual basis. The Incentive Fee will accrue as at each valuation point and shall be payable annually in arrears (on or after the first business day of the following year).
At the end of each Calculation Period, where an Incentive Fee has been paid, and only then, the Prior High Net Asset Value per share will be reset to the Net Asset Value per share of the relevant class at the end of such Calculation Period. For the avoidance of doubt, where the relevant class has underperformed, (i.e. its net asset value per share at the end of a Calculation Period is below the Index adjusted Prior High Net Asset Value per share), no Incentive Fee will be payable until the underperformance is clawed back.
The Incentive Fee will be verified by the Custodian.
As the Incentive Fee is based on net realised and net unrealised gains and losses as at the end of each Calculation Period and as a result, it may be paid on unrealised gains which may subsequently never be realised.
Sector Healthcare Value Fund
The Fund, in respect of the Class A Shares, pays the Investment Manager a fee equal to 20 per cent of the amount by which the net asset value (before the deduction of any performance fee) of the relevant share exceeds the MSCI Daily TR World Net Healthcare USD (the “Index”) (the “Incentive Fee”). The relevant share's subscription price or the initial issue price (where shares are issued during the initial offer period) is taken as the starting price for the purposes of determining the Incentive Fee. The Incentive Fee is accrued on a daily basis and reflected in the net asset value per share at each valuation point. The accrued Incentive Fee will only be paid to the Investment Manager once a shareholder redeems its investment in the Fund or when the Fund closes down where the performance of the relevant shares has exceeded the performance of the Index. The Incentive Fee may be payable even if the absolute return on the shareholder's investment is zero or negative. For example, if during the period of a shareholder's investment in the Fund, the net asset value per share on redemption is less than or equal to the net asset value per share that that shareholder paid on its initial subscription into the Fund, the Incentive Fee may still be payable if the net asset value per share on redemption exceeds the Index Net Asset Value per share, i.e. the Fund has outperformed the Index for the period of the shareholder's investment.
The Incentive Fee will be verified by the Custodian.
No Incentive Fee will be charged in respect of the Class B Shares and Class L NOK Shares.
Sector Sigma Nordic Fund The Investment Manager is also entitled to receive an incentive fee (the "Incentive Fee") of the aggregate appreciation in value of the Class A Shares, the Class B Shares and the Class C Shares (each a "Class") during the relevant Calculation Period (as defined below). No Incentive Fee will be charged in respect of the Class L NOK Shares.
The Incentive Fee equals 15% of the aggregate appreciation in value of the Class A Shares and 20% of the aggregate appreciation in value of the Class B Shares and the Class C Shares.
The Incentive Fee accrues as at each valuation point and is calculated annually on the rate of return (net of the Investment Manager's fees) of each class, and will be payable annually in arrears (on or after the first business day of the following year), or upon redemption, if earlier. The calculation period shall be a calendar year, closing on the last business day each year (the "Calculation Period"). The first Calculation Period in respect of Class A USD Shares, Class A EUR Shares, Class A SEK Shares, Class B SEK Shares and Class C SEK Shares will be from the close of the Initial Offer Period until the last business day of 2013. The Incentive Fee will be verified by the Custodian.

SECTOR CAPITAL FUNDS PLC Unaudited Interim Financial Statements
For the period 1 January 2015 to 30 June 2015
NOTES TO THE FINANCIAL STATEMENTS (Continued)
38
10. Incentive Fees (Continued) The Incentive Fee is calculated on a share-by-share basis so that each share is charged a fee which equates precisely with that share's performance over each Calculation Period. This method of calculation ensures that (i) any Incentive Fee paid to the Investment Manager is charged only to those shares which have outperformed their respective Prior High Net Asset Value (as defined below) over the course of a Calculation Period, (ii) all holders of shares have the same amount of capital per share at risk in the Fund, and (iii) all shares in a particular Class have the same net asset Value per share.
The Incentive Fee shall only be payable on the amount by which each share outperforms the previous high watermark or "Prior High Net Asset Value" (as defined below) for the relevant share. For each Calculation Period, an Incentive Fee will only be payable by a particular share if the net asset value of that share at the end of a Calculation Period is greater than the prevailing Prior High Net Asset Value for that share.
The "Prior High Net Asset Value" of each share is the highest net asset value per share on which Incentive Fee was paid in respect of any previous Calculation Period (or, if no Incentive Fee has yet been paid with respect to any such Calculation Period, the initial issue price of the relevant share). As the Incentive Fee is based on net realised and net unrealised gains and losses as at the end of each Calculation Period and as a result, it may be paid on unrealised gains which may subsequently never be realised.
At the end of each Calculation Period, where Incentive Fee has been paid, and only then, the Prior High Net Asset Value per share will be reset to the net asset value per share of the relevant class at the end of such Calculation Period. For the avoidance of doubt, where the relevant class has underperformed, (i.e. its net asset value per share at the end of a Calculation Period is below the Prior High Net Asset Value per share), no Incentive Fee will be payable until the underperformance is clawed back.
The Investment Manager shall also be entitled to an incentive fee ("Class D Incentive Fee") equal to 20% of the aggregated appreciation in value of the Class D Shares, in excess of the Prior High Net Asset Value (as defined below) adjusted by the performance of the following hurdle rates, (each a "Hurdle Rate");
- Class D SEK Shares the return of 3 month Swedish treasury bills (Bloomberg Ticker: GSGT3M Index);
- Class D USD Shares the return of 3 month US treasury bills (Bloomberg Ticker: USGG3M Index);
- Class D NOK Shares the return of 3 month Norwegian treasury bills (Bloomberg Ticker: GNGT3M Index); and
- Class D EUR Shares the return of 3 month German treasury bills (Bloomberg Ticker: GETB1 Index).
"Prior High Net Asset Value per Share" is the greater of (i) the Initial Issue Price for the relevant Class D Shares or (ii) the Net Asset Value per Class D Share on which the Class D Incentive Fee was paid in respect of any previous Class D Calculation Period.
The first calculation period for the Class D Shares shall commence from the close of the relevant initial offer period for the Class D Shares and conclude on the next Business Day thereafter. The calculation period thereafter shall be each Business Day (the "Class D Calculation Period"). The Class D Incentive Fee will be calculated and crystallised as at each Valuation Point (net of the Investment Manager's fees), and will be payable monthly in arrears (on or after the first Business Day of the following month), or upon redemption, if earlier. The Class D Incentive Fee will be verified by the Custodian.
Equalisation Credit The equalisation credit policy is applied to the calculation of the Incentive Fee payable by all Funds. The Incentive Fee is calculated on a share-by-share basis so that each relevant share is charged an Incentive Fee that equates precisely with that relevant share’s performance. This method of calculation ensures that (i) the Incentive Fee is charged only to those relevant shares that have appreciated in value relative to the Index, (ii) all relevant shareholders have the same amount per relevant share of the relevant class at risk in the Fund, and (iii) all shares of the same class have the same net asset value per share. If a shareholder subscribes for relevant shares at a time when the net asset value per relevant share is other than the Index Net Asset Value, certain adjustments will be made to reduce inequities that could otherwise result to the subscriber or beneficiary of the Incentive Fee.
The Incentive Fees accrued for the period ended 30 June 2015 were USD271,374 (30 June 2014: USD494,629) and the amount outstanding at 30 June 2015 was USD521,819 (30 June 2014: USD1,064,471).
As at 30 June 2015 an equalisation credit of USD112,502 (30 June 2014: USD326,447) was applied.

SECTOR CAPITAL FUNDS PLC Unaudited Interim Financial Statements
For the period 1 January 2015 to 30 June 2015
NOTES TO THE FINANCIAL STATEMENTS (Continued)
39
11. Administration Fees and Custodian Fees
The Company has appointed BNY Mellon Investment Servicing (International) Limited (“BNY Mellon”) to act as Administrator, registrar and transfer agent and BNY Mellon Trust Company (Ireland) Limited to act as Custodian (the “Custodian”). BNY Mellon is entitled to receive out of the assets of the Funds an annual administration fee, accrued and calculated on each dealing day and payable monthly in arrears of up to 0.105% of the aggregated Net Assets. BNY Mellon is also entitled to a shareholding services fee of USD1,875 per share class per month together with agree upon transaction charges. The Administrator is also entitled a financial reporting fee of up to USD5,000 per set of financial statements and other out of pocket expenses out of the assets of the Funds (plus VAT thereon if any).
The Administration fee accrued for the period ended 30 June 2015 was USD217,891 (30 June 2014: USD170,980) and the amount outstanding at 30 June 2015 was USD62,070 (30 June 2014: USD69,116).
The Custodian is entitled to an asset based fee of up to 0.02% per annum payable monthly together with sub-custodians’ fees (which will be charged at normal commercial rates) as well as agreed upon transaction charges (which will be at normal commercial rates) and other out of pocket expenses (plus VAT thereon if any).
The Custodian fee accrued for the period ended 30 June 2015 was USD55,229 (30 June 2014: USD43,325) and the amount outstanding at 30 June 2015 was USD14,493 (30 June 2014: USD17,562).
12. Directors’ fees and expenses
The Directors are entitled to a fee in remuneration for their services at a rate to be determined from time to time by the Directors, but so that the aggregate amount of Directors’ remuneration in any one year shall not exceed €20,000 or such higher amount as may be approved by resolution of the Directors and notified to Shareholders. The Directors may also be paid all travelling, hotel and other expenses, properly incurred by them, in attending and returning from meetings of the Directors or general meetings of the Company or in connection with the business of the Company.
The Directors’ fees and expenses accrued for the period ended 30 June 2015 was USD9,975 (30 June 2014: USD13,531) and the amount outstanding at 30 June 2015 was USD4,944 (30 June 2014: USD6,600).
13. Efficient Portfolio Management
The Company may enter into a variety of derivative instruments including, but not limited to, forward foreign exchange contracts, futures, options, swaps, contracts-for-difference, stocklending and repurchase agreements for the purposes of efficient portfolio management only, subject to the conditions and limits set out in the Central Bank of Ireland’s Notices and within any further limits laid down by the Central Bank of Ireland from time to time. In particular, the Funds may engage in forward foreign exchange contracts to provide protection against exchange rate risks, including cross-currency hedging, and in order to hedge foreign currency exposure of the underlying assets of the Funds into the base currency of the Funds or into a currency institutionally linked to the base currency. It is intended that the use of such forwards may reduce the currency risk in respect of the Funds and will better enable the Funds to manage its assets and liabilities. Futures contracts may be used to hedge or gain exposure to an increase in the value of an asset, market, currency, or deposit. Options may be used to hedge or achieve exposure to a particular market instead of using a physical security. Swaps may be used to achieve profit as well as to hedge existing long positions. Contracts-for-difference (“CFDs”) are bilateral agreements to exchange the difference between opening and closing contracts, which represent the performance of an underlying share.
At the discretion of the Directors, the Funds may use financial derivative instruments as a primary investment policy and details of the investment policy will be set out in the applicable Supplement in accordance with the requirements of the Central Bank of Ireland.
For the period ended 30 June 2015 and 30 June 2014, the Company has utilised forward foreign currency contracts, contracts-for-difference and options.
14. Related Party Transactions
Fees payable to the relevant Investment Manager are disclosed in notes 9 and 10.
Custodian and Administrator Although not deemed to be related parties under FRS 102 as they do not exercise “significant influence” over the activities of the Company, UCITS Notice 14 also deems a "Custodian" and its "associated or group companies" to be ‘connected parties” to the Company. As such, BNY Mellon Trust Company (Ireland) Limited, the Custodian, and BNY Mellon Investment Servicing (International) Limited, the Administrator, are connected parties to the Company.
The Board of Directors is satisfied that there are arrangements (evidenced by written procedures) in place, to ensure that any transaction carried out with the Company by a promoter, manager, custodian, investment manager and/or associated or group companies of these (“connected parties”) are carried out as if negotiated at arm’s length and that all such transactions are carried out in the best interests of the shareholders. The Board of

SECTOR CAPITAL FUNDS PLC Unaudited Interim Financial Statements
For the period 1 January 2015 to 30 June 2015
NOTES TO THE FINANCIAL STATEMENTS (Continued)
40
14. Related Party Transactions (Continued)
Directors are satisfied that transactions with connected parties entered into during the period complied with the obligations set out in Notice UCITS 14.
As at 30 June 2015 and 30 June 2014, Sector Asset Management AS, ultimate parent company of the Investment Manager, held 3 Class A EUR Shares, 2 Class A NOK Shares and 3 Class A USD Shares in Sector Healthcare Value Fund.
As at 30 June 2015 the following key personnel as defined within Section 33 of FRS 102 held a beneficial interest in the Funds as follows:
Key personnel Role/Team Fund/ClassNumber of
Shares heldSector Speculare AS 100% owned by Sector Omega AS Sector Global Equity Kernel Fund, Class O NOK 1,748Sector Gamma AS Investment Manager Sector Healthcare Value Fund, Class B SEK 118Trond Horneland Investment Manager, Sector Gamma AS Sector Healthcare Value Fund, Class L NOK 15,665Trond Tviberg Investment Manager, Sector Gamma AS Sector Healthcare Value Fund, Class L NOK 7,945Jan Henrik Arvesen Investment Manager, Sigma Fondsforvaltning AS Sector Sigma Nordic Fund, Class L NOK 3,341Lars Tell Director, Sector Capital Funds Plc Sector Sigma Nordic Fund, Class L NOK 76
During the period ended 30 June 2015, Sector Omega AS, the Investment Manager, sold its’ investment in Sector Global Equity Kernel Fund, Class O NOK.
15. Contingent Liabilities
The Company is established as a segregated portfolio company. As a matter of Irish law, the assets of one Fund will not be available to satisfy the liabilities of another. However, the Company is a single legal entity which may operate or have assets held on its behalf or be subject to claims in other jurisdictions which may not necessarily recognise such segregation. There is no guarantee that the courts of any jurisdiction outside Ireland will respect the limitations on liability associated with segregated portfolio companies nor is there any guarantee that the creditors of one Fund will not seek to enforce such Funds’ obligations against another Fund.
As at 30 June 2015 there were three Funds in operation (30 June 2014: three) and there were no known contingent liabilities.
16. Soft Commission
There were no soft commissions for the periods ended 30 June 2015 or 30 June 2014.
17. Prospectus
A revised Supplement for Sector Sigma Nordic Fund was issued on 20 March 2015 to include Class D Shares.
A revised Supplement for Sector Global Equity Kernel Fund was issued on 9 April 2015 to include Class P NOK Unhedged Shares.
18. Comparative period
The prior period comparatives are for the period 1 January 2014 to 30 June 2014.
19. Significant events during the period
There were no significant events during the period.
20. Significant events after the balance sheet date
There were no significant events after the balance sheet date.
21. Approval of Financial Statements
The financial statements were authorised for issue by the Directors on 20 August 2015.

SECTOR CAPITAL FUNDS PLC Unaudited Interim Financial Statements
For the period 1 January 2014 to 30 June 2015
SIGNIFICANT PORTFOLIO MOVEMENTS
41
In accordance with the European Communities (Undertakings for Collective Investment in Transferable Securities) Regulations 2011, a statement of the largest changes in the composition of the Schedule of Investments during the period is provided to ensure that the shareholders can identify changes in the investments held by the Fund. These statements present the aggregate purchases and sales of an investment, exceeding 1% of the total value of purchases and sales for the period. At a minimum the largest 20 purchases and sales are listed. If the Fund enters into less than 20 purchases or sales during the period, then all transactions are presented.
Sector Global Equity Kernel Fund LARGEST PURCHASES COST USD iShares MSCI ACWI Index Fund 5,197,639 Siemens AG 757,828 Bunge Ltd. 352,392 China Mobile Ltd. 318,391 SAIC Motor Corporation Ltd. 308,694 NTT DoCoMo, Inc. 302,909 Guangdong Investments Ltd. 301,894 Lenovo Group Ltd. 295,740 LG Chem Ltd. 292,307 Lawson, Inc. 292,156 Tokio Marine Holdings, Inc. 290,763 Castellum AB 287,282 DIC Corp. 284,196 The 77 Bank Ltd. 283,860 SYSCO Corp. 281,864 XL Group PLC 278,438 Samsung Electronics Co. Ltd. 274,049 J&J Snack Foods Corp. 272,959 Seven & I Holdings Co. Ltd. 272,324 Ipsen S.A. 271,985 LARGEST SALES PROCEEDS USD iShares MSCI ACWI Index Fund 3,075,120 Siemens AG 494,777 Bunge Ltd. 431,652 China Mobile Ltd. 400,221 SAIC Motor Corporation Ltd. 312,736 Tokio Marine Holdings, Inc. 309,296 Cal-Maine Foods, Inc. 305,542 AmerisourceBergen Corp. 294,021 Lawson, Inc. 288,717 Lenovo Group Ltd. 280,819 M2 Telecommunications Group Ltd. 277,366 Huolinhe Opencut Coal Industry Co. Ltd. 268,642 Gas Natural SDG S.A. 261,921 Computer Sciences Corp. 257,837 Ameren Corp. 257,738 Castellum AB 257,627 International Flavors & Fragrances, Inc. 253,728 Samsung Electronics Co. Ltd. 252,323 Osram Licht AG 247,331 WPP PLC 244,821 DIC Corp. 243,308 Old Mutual PLC 243,003 Alten Ltd. 241,961 Bridgestone Corp. 239,591

SECTOR CAPITAL FUNDS PLC Unaudited Interim Financial Statements
For the period 1 January 2015 to 30 June 2015
SIGNIFICANT PORTFOLIO MOVEMENTS (Continued)
42
Sector Healthcare Value Fund LARGEST PURCHASES COST USD
GlaxoSmithKline PLC 2,332,111 Johnson & Johnson 1,833,596 Teva Pharmaceutical Industries Ltd. 1,007,864 Owens & Minor, Inc. 781,428 Mylan, Inc. 541,055 Bristol-Myers Squibb Co. 535,563 Catamaran Corp. 530,546 Rite Aid Corp. 530,371 Takeda Pharmaceutical Co. Ltd. 431,913 Ironwood Pharmaceuticals, Inc. 371,611 The Medicines Co. 351,429 Sanofi-Aventis S.A. 294,246 Actelion Ltd. 223,622 Community Health Systems, Inc. 187,654 Ipsen S.A. 82,128 Koninklijke Philips Electronics NV 23,042 LARGEST SALES PROCEEDS USD Hospira, Inc. 2,310,766 Boston Scientific Corp. 1,921,295 Astellas Pharmaceutical Co. Ltd. 1,538,991 Edwards Lifesciences Corp. 1,300,574 AstraZeneca PLC 1,261,206 Bristol-Myers Squibb Co. 1,221,792 Bayer AG 1,170,020 LifePoint Hospitals, Inc. 1,157,576 Takeda Pharmaceutical Co. Ltd. 1,039,967 Shionogi & Co. Ltd. 1,019,121 Eli Lilly & Co. 1,003,075 Quest Diagnostics, Inc. 1,002,844 Mylan NV 959,854 AmerisourceBergen Corp. 910,048 Sanofi-Aventis S.A. 773,576 Rite Aid Corp. 731,444 Thoratec Corp. 671,785 Actelion Ltd. 614,161 Patterson Cos., Inc. 601,087 Catamaran Corp. 598,854 Vertex Pharmaceuticals, Inc. 519,092 WellCare Health Plans, Inc. 479,640 Stryker Corp. 366,566 Integra LifeSciences Holdings Corp. 333,869 Otsuka Holdings Co. Ltd. 313,489 Ipsen S.A. 305,218 Daiichi Sankyo Co. Ltd. 280,239

SECTOR CAPITAL FUNDS PLC Unaudited Interim Financial Statements
For the period 1 January 2015 to 30 June 2015
SIGNIFICANT PORTFOLIO MOVEMENTS (Continued)
43
Sector Sigma Nordic Fund LARGEST PURCHASES COST NOK Volvo AB 27,302,576 Trelleborg AB 25,806,663 Telefonaktiebolaget LM Ericsson 21,267,769 Norsk Hydro ASA 21,150,775 Cargotec Oyj 18,287,865 Coloplast A/S 17,162,551 Hexagon AB 15,449,673 Novo Nordisk A/S 14,883,573 TeliaSonera AB 14,820,312 DSV A/S 14,705,631 ABB Ltd. 13,965,143 Alfa Laval AB 13,898,732 Huhtamaki Oyj 13,862,483 Nokia Oyj 13,517,718 Telenor ASA 13,377,261 Royal Caribbean Cruises Ltd. 13,274,412 Hexpol AB 13,090,429 Danske Bank A/S 12,540,334 Haldex AB 11,387,214 Autoliv, Inc. 11,372,571 Yara International ASA 9,186,150 Munksjo Oyj 8,951,389 Assa Abloy AB 8,926,076 DHT Holdings, Inc. 8,327,835 Frontline 2012 Ltd. 8,299,314 Investor AB 7,362,571 Topdanmark A/S 5,138,572 Tomra Systems ASA 4,576,058 Svenska Cellulosa AB 4,547,746 Hennes & Mauritz AB 4,203,307
LARGEST SALES PROCEEDS NOK Skandinaviska Enskilda Banken AB 17,431,887 Volvo AB 15,587,866 DSV A/S 15,069,605 Alfa Laval AB 13,806,609 Svenska Cellulosa AB 13,707,457 Topdanmark A/S 13,252,808 Marine Harvest ASA 13,084,266 Novo Nordisk A/S 12,890,135 Nokia Oyj 12,282,579 Opera Software ASA 12,131,639 Salmar ASA 10,531,287 Hexpol AB 9,768,077 Telenor ASA 9,065,100 Swedbank AB 8,981,955 SKF AB 8,711,555 Danske Bank A/S 8,682,747 Hexagon AB 6,727,691 Trelleborg AB 6,229,035 Aurora LPG Holding AS 6,203,957 Golden Ocean Group Ltd. 1,640,493