ANNEALING AND MECHANICAL PROPERTIES OF ECAP … · An annealing study was performed on specimens...
37
AFRL-RW-EG-TR-2011-045 ANNEALING AND MECHANICAL PROPERTIES OF ECAP TANTALUM Joel House Philip Flater Richard Harris Robert De Angelis Michael Nixon John Bingert James O’Brien AIR FORCE RESEARCH LABORATORY MUNITIONS DIRECTORATE 101 W EGLIN BLVD EGLIN AFB, FL 32542-6810 UNIVERSITY OF FLORIDA/REEF 1350 NORTH POQUITO ROAD SHALIMAR, FL 32579 LOS ALAMOS NATIONAL LABORATORY MST-6, MAIL STOP G770 LOS ALAMOS, NM 87545 O’BRIEN AND ASSOCIATES P.O. BOX 126 BLISSFIELD, MI 49228 MAR 2011 FINAL REPORT AIR FORCE RESEARCH LABORATORY MUNITIONS DIRECTORATE Air Force Materiel Command United States Air Force Eglin Air Force Base, FL 32542 DISTRIBUTION A. Approved for public release, distribution unlimited. 96 th ABW/PA Approval and Clearance # 96ABW-2011-0163 dated 04 April 2011.
-
Upload
phungthien -
Category
Documents
-
view
215 -
download
0
Transcript of ANNEALING AND MECHANICAL PROPERTIES OF ECAP … · An annealing study was performed on specimens...

AFRL-RW-EG-TR-2011-045
ANNEALING AND MECHANICAL PROPERTIES OF ECAP TANTALUM
Joel House Philip Flater Richard Harris Robert De Angelis Michael Nixon John Bingert James O’Brien AIR FORCE RESEARCH LABORATORY MUNITIONS DIRECTORATE 101 W EGLIN BLVD EGLIN AFB, FL 32542-6810 UNIVERSITY OF FLORIDA/REEF 1350 NORTH POQUITO ROAD SHALIMAR, FL 32579 LOS ALAMOS NATIONAL LABORATORY MST-6, MAIL STOP G770 LOS ALAMOS, NM 87545 O’BRIEN AND ASSOCIATES P.O. BOX 126 BLISSFIELD, MI 49228 MAR 2011 FINAL REPORT AIR FORCE RESEARCH LABORATORY
MUNITIONS DIRECTORATE
Air Force Materiel Command
United States Air Force Eglin Air Force Base, FL 32542
DISTRIBUTION A. Approved for public release, distribution unlimited. 96th ABW/PA Approval and Clearance # 96ABW-2011-0163 dated 04 April 2011.
NOTICE AND SIGNATURE PAGE
Using Government drawings, specifications, or other data included in this document for any purpose other than Government procurement does not in any obligate the U.S. Government. The fact that the Government formulated or supplied the drawings, specifications, or other data does not license the holder or any other person or corporation, or convey any rights or permission to manufacture, use, or sell any patented invention that may relate to them. This report was cleared for public release by the 96th Air Base Wing, Public Affairs Office, and is available to the general public, including foreign nationals. Copies may be obtained from the Defense Technical Information Center (DTIC) < http://www.dtic.mil/dtic/index/html>. AFRL-RW-EG-TR-2011-0045 HAS BEEN REVIEWED AND IS APPROVED FOR PUBLICATION IN ACCORDANCE WITH ASSIGNED DISTRIBUTION STATEMENT. FOR THE DIRECTOR: //ORIGNAL SIGNED// //ORIGINAL SIGNED// //ORIGNAL SIGNED// _______________________ _______________________ _____________________ HOWARD G. WHITE MATTHEW J. MATYAC JOEL W. HOUSE Technical Advisor Technical Advisor Program Manager Ordnance Division Damage Mechanisms Branch Damage Mechanisms Branch This report is published in the interest of scientific and technical information exchange, and its publication does not constitute the Government’s approval or disapproval of its ideas or findings.

REPORT DOCUMENTATION PAGE Form Approved
OMB No. 0704-0188 Public reporting burden for this collection of information is estimated to average 1 hour per response, including the time for reviewing instructions, searching existing data sources, gathering and maintaining the data needed, and completing and reviewing this collection of information. Send comments regarding this burden estimate or any other aspect of this collection of information, including suggestions for reducing this burden to Department of Defense, Washington Headquarters Services, Directorate for Information Operations and Reports (0704-0188), 1215 Jefferson Davis Highway, Suite 1204, Arlington, VA 22202-4302. Respondents should be aware that notwithstanding any other provision of law, no person shall be subject to any penalty for failing to comply with a collection of information if it does not display a currently valid OMB control number. PLEASE DO NOT RETURN YOUR FORM TO THE ABOVE ADDRESS. 1. REPORT DATE 22-MAR-2011
2. REPORT TYPE FINAL
3. DATES COVERED (From - To) MAR, 2008 - DEC, 2010
4. TITLE AND SUBTITLE ANNEALING AND MECHANICAL PROPERTIES OF ECAP TANTALUM
5a. CONTRACT NUMBER
5b. GRANT NUMBER
5c. PROGRAM ELEMENT NUMBER 62602F
6. AUTHOR(S) Joel House, Philip Flater, Richard Harris, Robert De Angelis,
5d. PROJECT NUMBER 2502
Michael Nixon, John Bingert, James O’Brien
5e. TASK NUMBER 12
5f. WORK UNIT NUMBER 28 7. PERFORMING ORGANIZATION NAME(S) AND ADDRESS(ES)
Air Force Research Laboratory, AFRL/RWMWD, 101 W Eglin Blvd,
8. PERFORMING ORGANIZATION REPORT NUMBER
Eglin AFB, FL 32542. University of Florida/REEF, 1350 North Poquito Road, Shalimar, FL 32579. Los Alamos National Laboratory, MST-6, Mail Stop G770, Los Alamos, NM. O’Brien and Associates, P.O. Box 126, Blissfield, MI 49228
AFRL-RW-EG-TR-2011-045
9. SPONSORING / MONITORING AGENCY NAME(S) AND ADDRESS(ES) 10. SPONSOR/MONITOR’S ACRONYM(S) Air Force Research Laboratory, Munitions Directorate AFRL-RW-EG AFRL/RWMWD 101 West Eglin Boulevard
11. SPONSOR/MONITOR’S REPORT Eglin AFB, FL 32542-6810 NUMBER(S) AFRL-RW-EG-TR-2011-045 12. DISTRIBUTION / AVAILABILITY STATEMENT Approved for public release, distribution unlimited. 96th ABW/PA Approval and Clearance # 96ABW-2011-045, dated 04 April 2011.
13. SUPPLEMENTARY NOTES DISTRIBUTION STATEMENT INDICATING AUTHORIZED ACCESS IS ON THE COVER PAGE AND BLOCK 12 OF THIS FORM. DATA RIGHTS RESTRICTIONS AND AVAILABILITY OF THIS REPORT ARE SHOWN ON THE NOTICE AND SIGNATURE PAGE. 14. ABSTRACT Equal Channel Angular Pressing (ECAP) was used to breakdown the microstructure of tantalum rods produced by Cabot and H.C. Starck. Hardness measurements from annealing samples showed a 100ºC to 150ºC difference in the softening response to recrystallization for the two manufacturers. Orientation maps were generated from the samples to characterize the thermo-mechanical processing and texture evolution. Low temperature annealing resulted in a fine grain size that was uniform. In the higher temperature anneals, the grain size varied with location. Mechanical property measurements showed the strength of the hardened tantalum to be 800MPa. Taylor Impact experiments were used to study the behavior of tantalum under dynamic loading. The plastic flow in the recovered Taylor Impact specimen was analyzed to determine the rotation that accompanied the texture evolution. The mechanical property data was used to calibrate the MTS constitutive model. The Taylor Impact experiment was simulated using the MTS constitutive relationship and an anisotropic yield surface. These calculations were in excellent agreement with the experimental data.
15. SUBJECT TERMS TANTALUM, EQUAL CHANNEL ANGULAR PRESSING, ECAP, TAYLOR IMPACT, TEXTURE, MECHANICAL THRESHOLD STRESS, MTS 16. SECURITY CLASSIFICATION OF:
17. LIMITATION OF ABSTRACT
18. NUMBER OF PAGES
19a. NAME OF RESPONSIBLE PERSON Joel House
a. REPORT UNCLASSIFIED
b. ABSTRACT UNCLASSIFIED
c. THIS PAGE UNCLASSIFIED
UL
37
19b. TELEPHONE NUMBER (include area code) 850-882-7987 Standard Form 298 (Rev. 8-98)
Prescribed by ANSI Std. Z39.18

i
Table of Contents
1.0 EXECUTIVE SUMMARY ................................................................................................................................ 1
2.0 INTRODUCTION .............................................................................................................................................. 3
3.0 MATERIAL AND MATERIAL PROCESSING ............................................................................................ 5
4.0 ANNEALING ..................................................................................................................................................... 9
5.0 MECHANICAL PROPERTIES ..................................................................................................................... 13
6.0 RESULTS ......................................................................................................................................................... 18
7.0 DISCUSSION ................................................................................................................................................... 23
8.0 CONCLUSION................................................................................................................................................. 28
9.0 REFERENCES ................................................................................................................................................. 29
ii
Table of Figures
FIGURE 1..................................................................................................................................................................... 4
FIGURE 2. .................................................................................................................................................................... 4
FIGURE 3. .................................................................................................................................................................... 6
FIGURE 4. .................................................................................................................................................................... 7
FIGURE 5. .................................................................................................................................................................... 8
FIGURE 6. .................................................................................................................................................................... 9
FIGURE 7. .................................................................................................................................................................. 11
FIGURE 8. .................................................................................................................................................................. 12
FIGURE 9. .................................................................................................................................................................. 15
FIGURE 10. ................................................................................................................................................................ 16
FIGURE 11. ................................................................................................................................................................ 18
FIGURE 12. ................................................................................................................................................................ 19
FIGURE 13. ................................................................................................................................................................ 19
FIGURE 14. ................................................................................................................................................................ 20
FIGURE 15. ................................................................................................................................................................ 21
FIGURE 16. ................................................................................................................................................................ 21
FIGURE 17. ................................................................................................................................................................ 22
FIGURE 18. ................................................................................................................................................................ 23
FIGURE 19. ................................................................................................................................................................ 24

iii
Table of Tables
TABLE 1....................................................................................................................................................................... 5

1
1.0 Executive Summary This report documents the research and development on the processing of pure tantalum by
Equal Channel Angular Pressing (ECAP) conducted by the Ordnance Division of the Munitions
Directorate. ECAP processing was selected because of the effect the strain path has on the
ability to refine the size of grains in metals. The details of ECAP tooling development and
manufacturing process can be found in Reference 1.
An annealing study was performed on specimens extracted from the plates. This study provided
data on recrystallization and texture evolution resulting from exposure to elevated temperatures.
One out-come of the annealing study was that mill processing of the initial ingot left a signature
in the material that subsequent thermo-mechanical processing could not eliminate. As example,
the initial recrystallization temperature of Cabot material was 950°C, whereas, H.C. Starck did
not reach a similar metallurgical condition until 1050 – 1100°C. That this difference in
recrystallization remained in the materials after extensive cold work by ECAP and forging into
plates was an un-anticipated result. It was expected that the extensive cold working of the two
metals would eliminate variations in the annealing properties which had been observed in earlier
studies.
At the conclusion of that effort, the
Munitions Directorate received 14 plates of ECAP processed tantalum, as well as, 5 plates from
a control group (No ECAP). These ECAP plates were used for additional mechanical and
physical property characterization at the Munitions Directorate. These plates were fabricated
from rod stock obtained from either H.C. Starck of Newton, MA, or Cabot Performance Metals
of Boyertown, PA. Most of the subsequent discussion is a comparison of properties resulting
from the thermo-mechanical processing and how this processing has affected recrystallization
and mechanical properties.
As a result of the annealing study, it would appear that the chemistry difference of these “pure”
tantalum materials controlled the phenomenology of recrystallization more than changes to the
substructure of the material, i.e., grain deformation and defect density. Both mills produce and
sell their pure tantalum rods based on the chemistry limits defined in the American Society of
Testing of Materials Standard (ASTM) B-364, Standard Specification for Tantalum and
Tantalum Alloy Ingots. In the grade of tantalum use in this study a number of elements exists in
2
trace amounts, Parts Per Million (PPM). Relative to the chemistry of tantalum, the most
significant contaminant is oxygen. Tantalum has a high affinity for oxygen, so in the presence of
1) elevated temperatures, 2) available oxygen and 3) sufficient time to absorb, it will convert to
tantalum-oxide. In general, for munitions applications tantalum-oxide is undesirable because of
its impact on mechanical properties, specifically reduced ductility. The application for tantalum
within the Department of Defense requires a balance between strength, ductility, cost and
repeatability.
The samples from the annealing study were interrogated using Electron Back Scattered
Diffraction (EBSD). This technique provides spatially resolved data on the crystallographic
orientation of the metal and can be used to identify changes in microstructure as a function of
processing, i.e., temperature, deformation, etc. As example, for forged tantalum plates it is
observed that within a millimeter of the exterior surface, grains with a dominate <100> direction
parallel to the normal direction (ND) exists, see Figure 7. In the interior three different texture
conditions have been observed, 1) grains with a mixture of <100> and <111> directions, 2)
grains with <111> directions with bands of <100>, and 3) grains dominated by the <111>
directions.
The significance of these texture observations is found in the role crystallographic orientation
plays on the mechanical properties. (100) oriented grains have lower strength properties than
(111) oriented grains. As a result tantalum displays strong directional properties, or anisotropy,
as do most body-centered-cubic (BCC) metals. If the grain size and crystallographic orientation
can be controlled to some extent by processing, then the opportunity exists to optimize the
mechanical properties relative to some intended application. The work described in this report
has as an objective to understand how processing parameters for tantalum inter-relate with
physical properties such as grain size and orientation, and mechanical properties such as flow
stress and plastic anisotropy.
3
2.0 Introduction Mechanical and physical properties make commercially pure tantalum an ideal material for high
strain rate applications that require high density (16.3 gm/cc) and good formability.2- 6 The
design process to achieve optimum and repeatable performance with tantalum based components
relies on well characterized mechanical properties.7- 10 Previous studies of commercially pure
tantalum plate have shown that texture bands, or texture gradients, are routinely observed in the
microstructures, see Figure 1. These bands are layers with the dominant texture component
being either the {111} or the {100} relative to the plate normal direction (ND), also called the
compression axis. These particular orientations represent the extremes in the Taylor Factor that
describe the orientation dependent yield strength within a polycrystal subjected to uniaxial
compression.11 In addition to texture banding, commercially pure tantalum plate can have a
heterogeneous grain size where adjacent regions can vary in grain sizes by an order of
magnitude, see Figure 2. The fine grain microstructure has a mixed texture of {111} and {100}
relative to ND, whereas, the large grained region is entirely {111} oriented structure. Texture
banding and heterogeneous grain size both contribute to local variations in mechanical properties
and under extreme loading conditions can initiate pre-mature failure.12,13
In this study severe plastic deformation of pure tantalum rod stock, prior to annealing, was used
to reduce both texture banding and the inhomogeneous grain size. ECAP processing was used to
introduce severe plastic deformation. 14-16 The ECAP rods were then upset forged into
cylindrical disks and samples from the disk were used to determine annealing characteristics and
mechanical properties. The latter were used to determine material constants for the Mechanical
Threshold Stress (MTS) constitutive relationship.17 Taylor Impact experiments were conducted
to investigate the influence of thermo-mechanical history on high strain rate (104/s) properties of
the material.18- 21 A Lagrangian finite element program, Elastic Plastic Impact Code (EPIC)
2006 version was used, in-conjunction with the MTS constitutive model, to simulate the impact
and plastic/elastic wave propagation observed in the Taylor Impact experiments.22 The
recovered Taylor Impact specimen provided geometry data for analysis of the mechanical
property anisotropy and to assess the accuracy of the simulation. The plastic zone in the

4
recovered Taylor Impact specimen was interrogated by EBSD to evaluate the texture evolution
generated by high strain rate deformation.
Compression Axis of Forging
Figure 1. Texture banding observed in an orientation map of upset forged H. C. Starck tantalum after annealing at 1000°C. The texture data is displayed relative to the compression axis of forging. The plane scanned was a through-thickness section of a disk.
Figure 2. A montage of photomicrographs showing the inhomogeneous microstructure observed in annealed tantalum.

5
3.0 Material and Material Processing The commercially pure tantalum used in this investigation was obtained from two sources. One
rod was produced by H.C. Starck, Newton, Massachusetts, the other by Cabot Supermetals,
Boyertown, Pennsylvania. Both companies provided rod stock that was 63 mm (2.50 inch)
diameter, see ASTM B-365, Standard Specification for Tantalum and Tantalum Alloy Rod and
Wire. Ingot chemistries are given in Table 1, obtained from mill reports generated by the
manufacturers. Each rod was cut into sections and each section was vacuum annealed for one
hour at 1250ºC. Each section received eight passes through ECAP tooling with a 135˚ included
angle between the entrance and exit channels. Between each pass, the ingot was rotated 180˚,
route B. This ECAP process generated a strain of 0.5 per pass. After ECAP, the processed rods
were upset forged into disks with a thickness of 6.3 mm (0.25 inch) and a diameter of
approximately 229 mm (9 inch). The engineering strain introduced by forging was greater than
90%.
Table 1. Ingot chemistries in parts per million by weight. Elements
Mill O N C H Fe Ni Cr Mo W Nb Ta Cabot 35 <10 10 <5 <5 <5 <5 <5 <25 125 Bal. H.C.
Starck 26 23 9 <1 16 30 7 182 68 78 Bal.
Specimens for analysis of microstructure were water-jet cut from the forged disk halfway
between the center and the outer radius. Two views were examined, one having a plane with a
direction normal aligned parallel to the ND of the forged disk. The second view had a normal
direction that was aligned parallel to the radial direction. These views were obtained by cutting
the specimen on a diamond saw and the exposed surfaces were prepared (ground, polished and
etched) using standard metallographic techniques for tantalum. 23
Samples in the as-worked
condition for both Cabot and H.C. Starck were examined using a FEI Quanta 200 Scanning
Electron Microscope (SEM) equipped with an EDAX/TSL system to generate orientation maps
from Electron Backscattered Diffraction (EBSD).
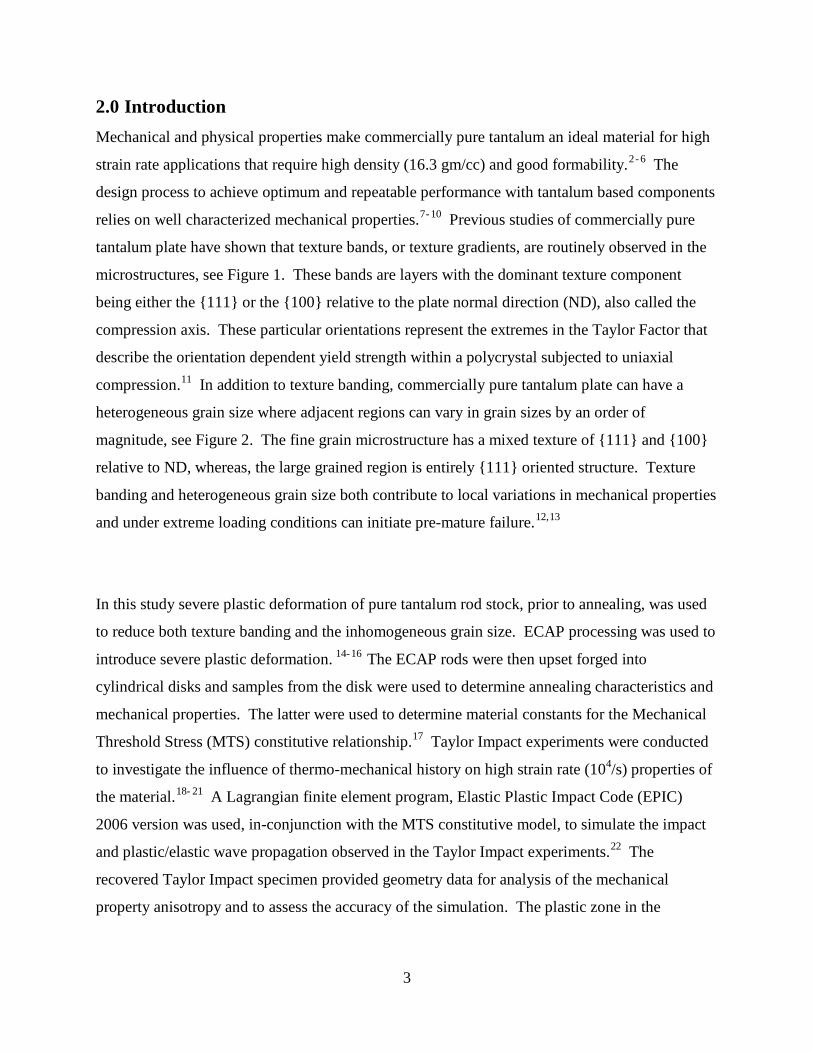
The grain orientation and image quality data for the in-plane view of both Cabot and H.C. Starck
are displayed in Figure 3. These maps were the result of stitching a number of orientation maps
together. A schematic at the top of the figure identifies the specimen geometry and the
6
approximate relationship to where the map data were obtained. The stereographic triangle in
Figure 3 relates the color in the orientation maps to the fundamental directions (100)-(110)-
(111). This legend has been oriented relative to the ND or compression axis of the disk. The
microstructure observed in Figure 3 indicates the grains have been heavily deformed and are
aligned perpendicular to the compression axis. These orientation maps show that all of the
grains have aligned themselves with the ND direction of the forged disk with either the <100> or
<111> direction. This duplex texture component is typical of pure BCC materials deformed in
compression.
Figure 3. Orientation maps of cold worked tantalum microstructures.
Several features in the orientation maps differ between Cabot and H.C. Starck tantalum. Both
have some mixture of grains with a <100> and <111> directions in the outer regions, locations A
and C, the center region is dominated by grains with <111> directions. This gradient in the
texture is less severe in the H.C. Starck tantalum. The texture distribution in the Cabot data was
not symmetric about region B, the mid-thickness point of the disk. Region A is a mixture, but
region C is pre-dominantly grains with <100> directions. Since the forging operation would
have generated similar boundary conditions at the platen work-piece interface (region A and C) it
is not clear why the texture would not be symmetric about the mid plane. It is also noted that
7
region B in the Cabot sample consisted almost entirely of grains with <111> directions with the
exception of a single band of <100>.
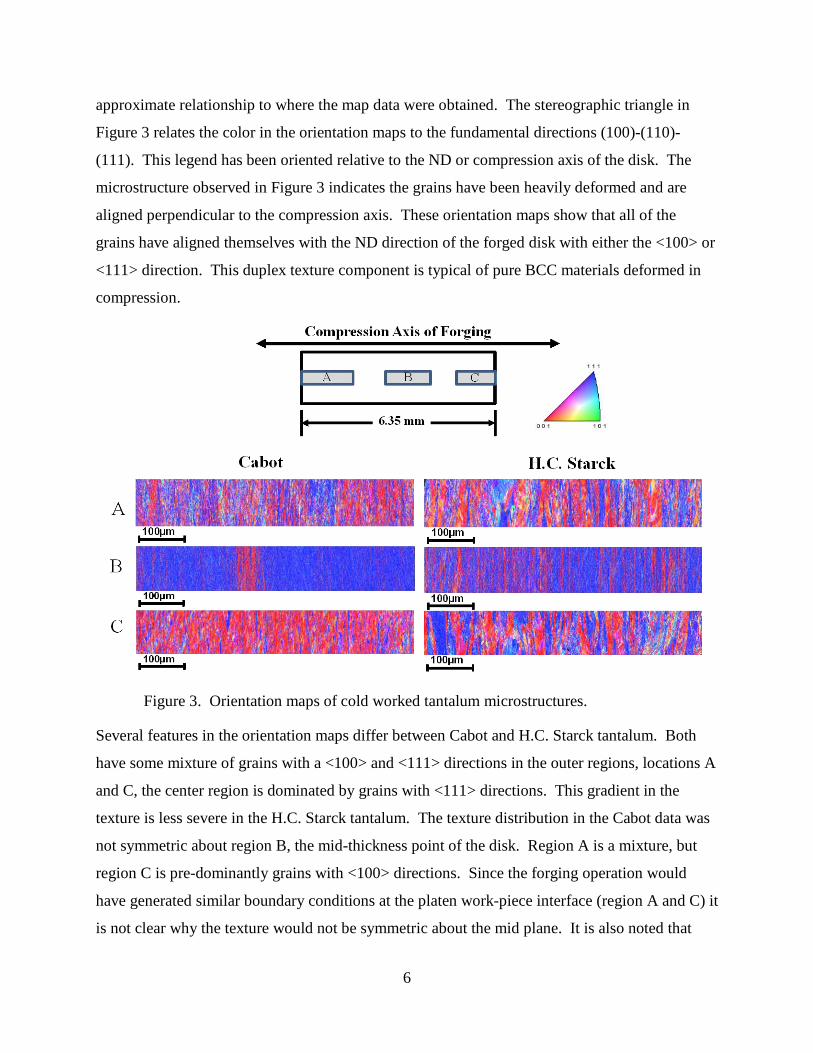
The orientation maps in Figure 4 are individual scans taken in the locations indicated by the
schematic at the top of the figure. In these images the SEM magnification was at 10,000X and
the scale bar represents 4 µm. The area imaged in Figure 3 covers 400 times more surface than
in Figure 4. With the increased magnification in the orientation maps displayed in Figure 4 the
details of the structure, shape of the heavily deformed grains and the grain substructure, can be
observed. These features were not readily viewed in Figure 3.
Figure 4. High magnification orientation maps of cold worked tantalum
microstructures.
8
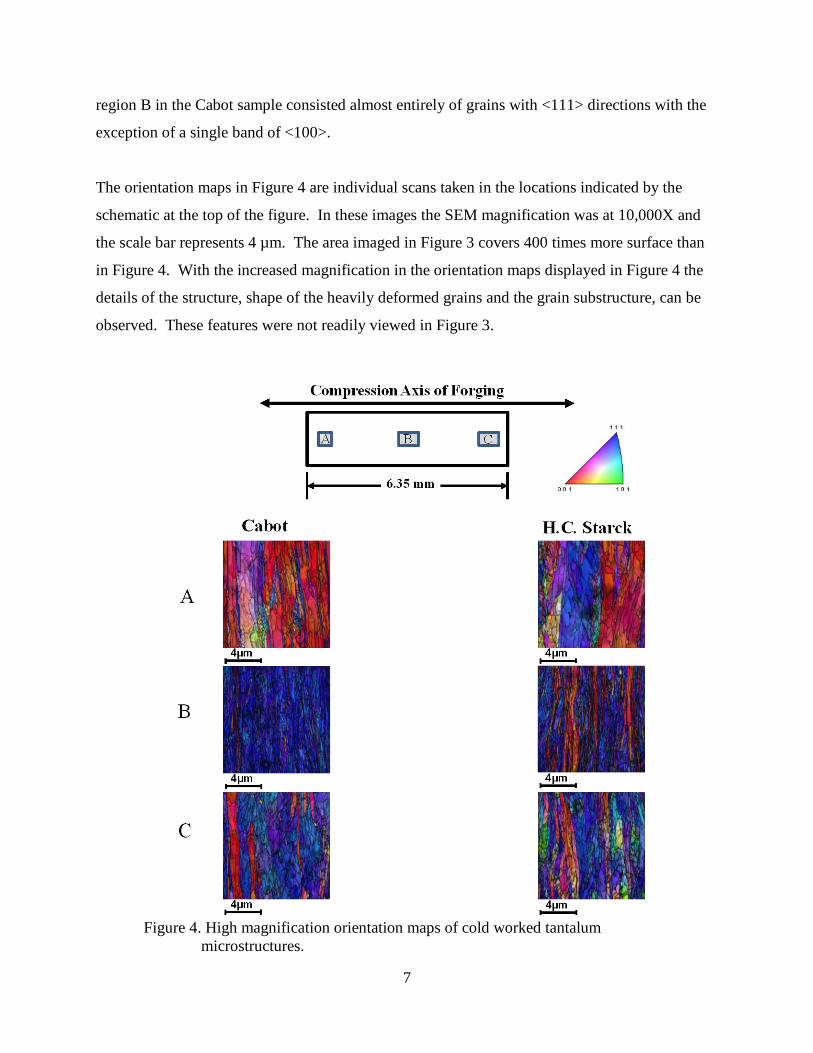
The orientation maps in Figure 5 displays the microstructure with the view parallel to the ND, or
compression axis. This view is perpendicular to that of Figures 3 and 4. The schematic at the
top of the figure gives the spatial relationship between A, B and C scan locations. A was furthest
from the center of the disk in a radial direction, C was closest to the center. The scale of the
orientation maps was 5 µm in length. The disks were forged to an engineering strain of greater
than 90%, and the resulting microstructure in the orientation maps reveals the plastic flow in the
radial direction. The area of the grain in this view has been significantly increased by the
compressive loading. Figures 4 and 5 give the basic geometry of the deformed grains as
flattened in the plane of the disk (Figure 4) and enlarged relative to the compressive direction
(Figure 5).
Figure 5. High magnification orientation maps of tantalum microstructures.

9
4.0 Annealing Specimens of the cold worked tantalums were annealed one hour at temperatures from 700°C to
1250°C in increments of 50°C in a vacuum of less than 10-5torr. A series of Vickers hardness
measurements were made on each of the annealed samples and on material in the cold worked
condition. The hardness values from two orthogonal surfaces identified as the through thickness
(TT) and in-plane (IP) directions are plotted in Figure 6 as a function of the annealing
temperature. The values plotted were the averages of at least 5 measurements out of 7, with the
highest and lowest readings being discarded. In the cold worked condition the hardness of both
Cabot and H.C. Starck reached 250 HV on the TT surface. For both tantalums the IP surface
generated a lower hardness value of 227 HV and 230 HV for Cabot and H.C. Starck,
respectively. When exposed to elevated temperatures cold worked tantalum will undergo
recovery and recrystallization. Both processes will reduce the hardness values as observed in
Figure 6. The Cabot tantalum reached a softening plateau at 900 - 950°C, this plateau indicates
the material is fully recrystallized. H.C. Starck tantalum reached a softening plateau at 1000 -
1050°C.
0 200 400 600 800 1000 1200 1400
Temperature (°C)
50
100
150
200
250
300
Har
dnes
s (H
V)
H.C. Starck TTCabot TTH.C. Starck IPCabot IP
Figure 6. Vickers hardness measurements as a function of annealing temperature of ECAP and forged tantalum.
10
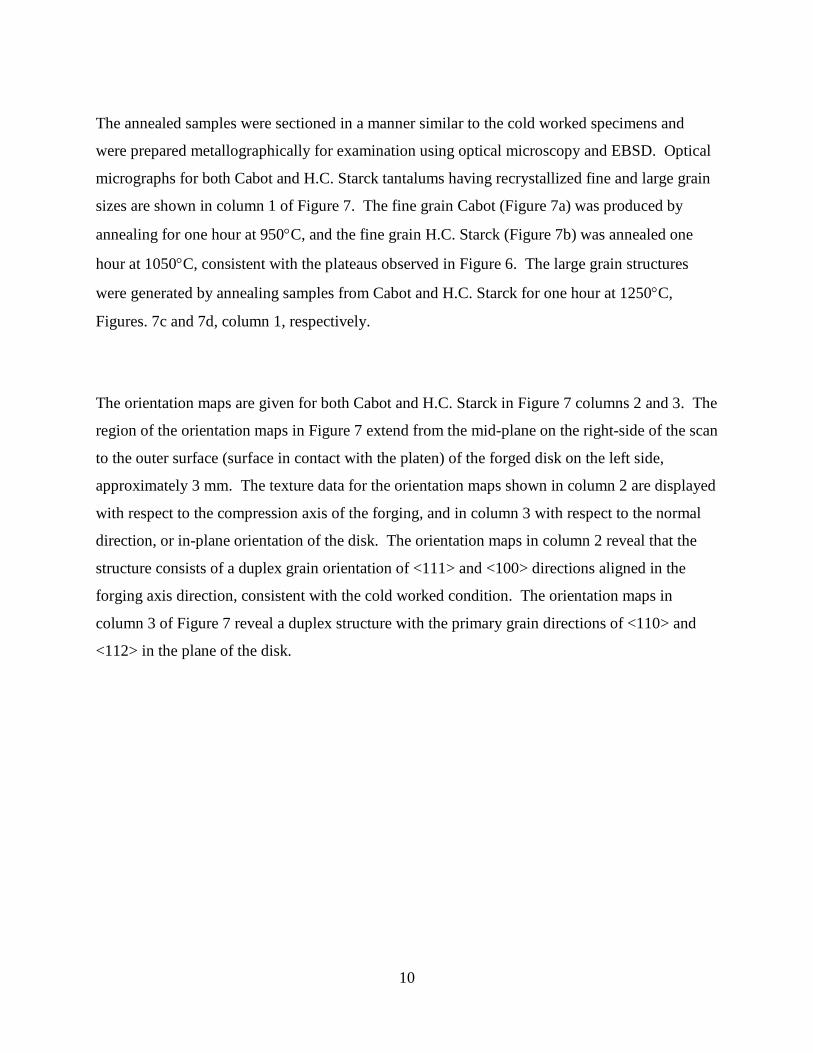
The annealed samples were sectioned in a manner similar to the cold worked specimens and
were prepared metallographically for examination using optical microscopy and EBSD. Optical
micrographs for both Cabot and H.C. Starck tantalums having recrystallized fine and large grain
sizes are shown in column 1 of Figure 7. The fine grain Cabot (Figure 7a) was produced by
annealing for one hour at 950°C, and the fine grain H.C. Starck (Figure 7b) was annealed one
hour at 1050°C, consistent with the plateaus observed in Figure 6. The large grain structures
were generated by annealing samples from Cabot and H.C. Starck for one hour at 1250°C,
Figures. 7c and 7d, column 1, respectively.
The orientation maps are given for both Cabot and H.C. Starck in Figure 7 columns 2 and 3. The
region of the orientation maps in Figure 7 extend from the mid-plane on the right-side of the scan
to the outer surface (surface in contact with the platen) of the forged disk on the left side,
approximately 3 mm. The texture data for the orientation maps shown in column 2 are displayed
with respect to the compression axis of the forging, and in column 3 with respect to the normal
direction, or in-plane orientation of the disk. The orientation maps in column 2 reveal that the
structure consists of a duplex grain orientation of <111> and <100> directions aligned in the
forging axis direction, consistent with the cold worked condition. The orientation maps in
column 3 of Figure 7 reveal a duplex structure with the primary grain directions of <110> and
<112> in the plane of the disk.

11
Compression Axis of Forging
(1) (2) (3)
(a)
(b)
(c)
(d)
Figure 7. Optical micrographs and orientation maps of tantalum, a) fine grain Cabot, b) fine grain H.C. Starck, c) large grain Cabot and d) large grain H.C. Starck. In column 2 the orientation map has the texture displayed relative to the compression axis, in column 3 the data is displayed relative to the plane normal direction.
The orientation maps from the complete scans, half of each being displayed in Figure 7, were
analyzed using the software developed by EDAX/TSL. For each section of the scan across the
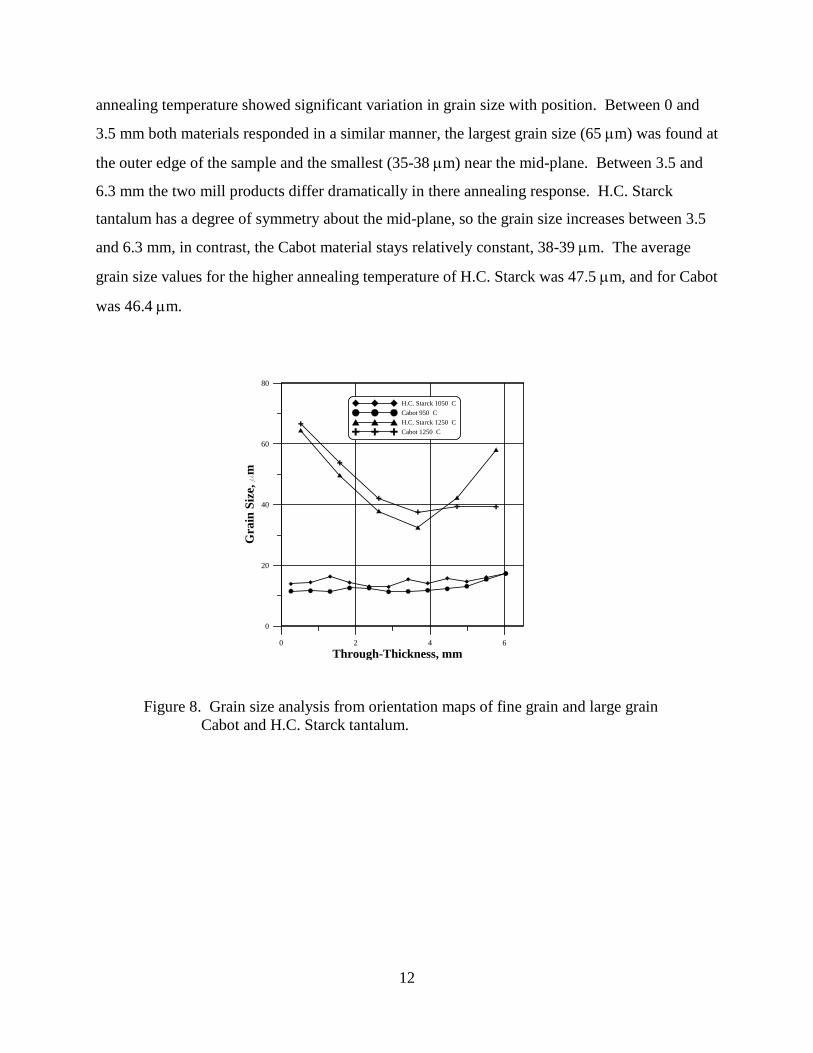
TT face of the specimen an average grain size was generated and is plotted in Figure 8 at the
center location of that scan. The data in Figure 8 shows that for the lower annealing
temperatures the response is uniform through the thickness of the disk. The overall average for
fine grain H.C. Starck was 14.9 µm, and for Cabot was 12.7 µm. The response at the higher
12
annealing temperature showed significant variation in grain size with position. Between 0 and
3.5 mm both materials responded in a similar manner, the largest grain size (65 µm) was found at
the outer edge of the sample and the smallest (35-38 µm) near the mid-plane. Between 3.5 and
6.3 mm the two mill products differ dramatically in there annealing response. H.C. Starck
tantalum has a degree of symmetry about the mid-plane, so the grain size increases between 3.5
and 6.3 mm, in contrast, the Cabot material stays relatively constant, 38-39 µm. The average
grain size values for the higher annealing temperature of H.C. Starck was 47.5 µm, and for Cabot
was 46.4 µm.
0 2 4 6Through-Thickness, mm
0
20
40
60
80
Gra
in S
ize,
m
H.C. Starck 1050 CCabot 950 CH.C. Starck 1250 CCabot 1250 C
Figure 8. Grain size analysis from orientation maps of fine grain and large grain Cabot and H.C. Starck tantalum.
13
5.0 Mechanical Properties A test matrix was developed to study the effects of thermo-mechanical processing on the
mechanical properties of tantalum over a range of strain rates. Three different metallurgical
conditions were investigated, fine grain, large grain and cold worked. Samples for compression
testing were right circular cylinders fabricated with the load axis oriented a) through the
thickness of the disk (TT), or b) in the plane of the disk (IP). For low strain rates, the specimen
diameter was 7.6 mm (0.3 inch), for high strain rate the specimen diameter was 5.1 mm (0.2
inch). In both cases the length-to-diameter ratio was one. Taylor Impact specimens were
fabricated from the forged disk with the longitudinal axis of the specimen aligned in the radial
direction. The geometry of the Taylor specimen was 5.3 mm (0.209 inch) diameter by 53.3 mm
(2.10 inch) length.
The low strain rate experiments (0.1/s) were conducted at room temperature on an Instron
Universal Testing Machine with a 22.2 kN load cell. The high strain rate experiments were
conducted on a split Hopkinson Pressure bar. The strain rates ranged from 250 to 750/s. The
high strain rate experiments occur under adiabatic conditions with temperature increases that
were predicted to rise by approximately 70-100°C. Change in temperature is important because
of the strong temperature sensitivity in mechanical properties for pure BBC metals.10
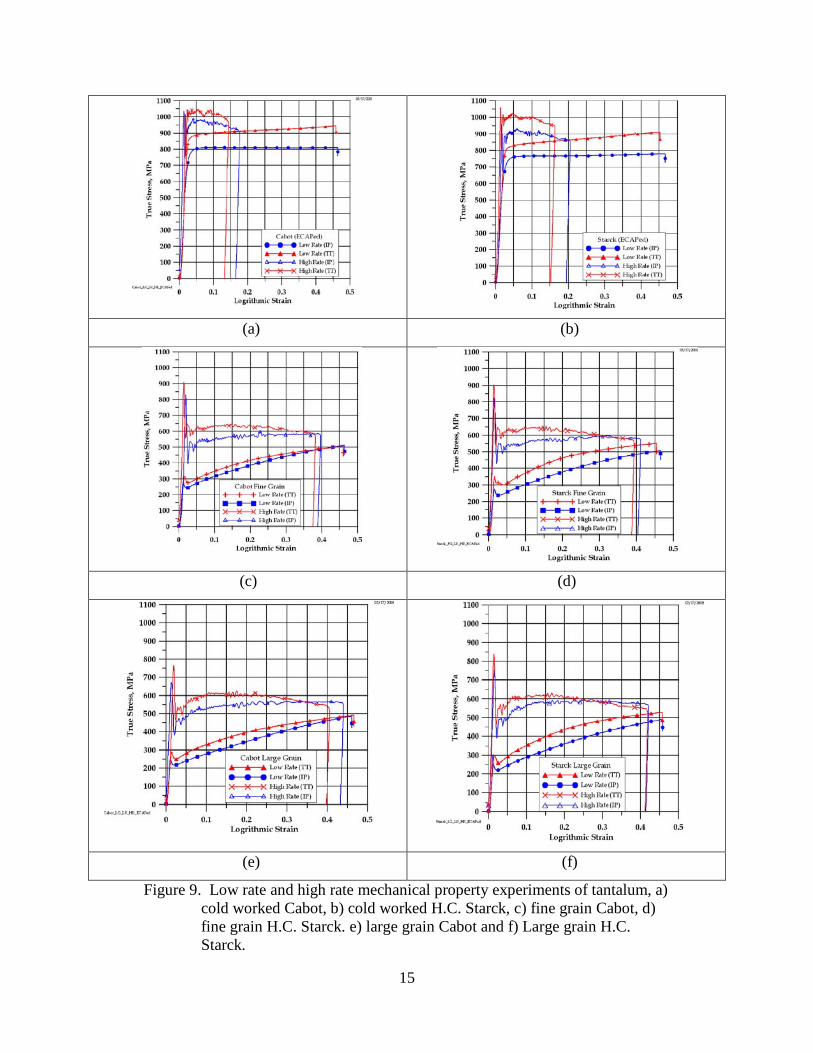
True stress versus logarithmic strain data obtained from high and low rate compression
experiments of both tantalums are plotted in Figures 9a – 9g. In Figure 9, the red data was for
specimens loaded along the TT direction and the blue data was for specimens loaded along the IP
direction. An examination of each pair of data (TT versus IP) shows that the TT direction had
higher mechanical properties for equal strain rates and similar metallurgical conditions
regardless of the manufacturer. The difference in the TT loaded specimens versus the IP loaded
specimens reflects the preferred orientation of the hard <111> direction aligned with the TT
direction and the softer <110> and <112> aligned with the IP direction. This mechanical
property anisotropy was also observed in the geometry of the recovered specimens. The IP
loaded samples had cross-sectional areas shaped like an ellipse when the experiment was

14
completed. The samples loaded in the TT direction were only slightly out-of-round. For both
the IP and TT load directions the major diameter and minor diameters were measured. These
diameters were differenced (largest diameter – smallest diameter) and the results are graphed in
Figure 10. Figure 10a gives the results for the low rate compression experiments, and Figure 10b
gives the result for high rate compression experiments. These data show that low rate
experiments with samples oriented in the IP direction had the greatest amount of mechanical
anisotropy (0.8 – 1.4 mm). The greatest degree of anisotropy was observed in the large grain
sample and the least in the cold worked material. Similar trends were observed in the high rate
compression data but the maximum values were smaller (0.7 – 1.0 mm). For both low and high
rate experiments the samples loaded in the TT direction had a maximum difference value of 0.2
mm.
In the cold worked condition, (Figures 9a and 9b) the metallurgical processing has hardened the
tantalums to a low rate yield strength of approximately 800 MPa. Comparing the low rate
strength properties of the cold worked material several things are notable. First, Cabot strength
exceeds that of the H.C. Starck by 50 to 75 MPa. Second, the TT loaded samples harden linearly
whereas the IP loaded samples indicate little ability to accommodate additional strain hardening.
When loaded dynamically, the cold worked Cabot is slightly stronger at the point of yielding, but
the mechanical strength peaks and begins to decrease noticeably above a logarithmic strain of
0.05. The decrease in strength is due to the temperature sensitivity of the mechanical properties.
Under dynamic loading, the experiment was conducted adiabatically, no heat transfer to the
surroundings, and the resulting increase in temperature (70 - 100 ºC) was sufficient to lower the
mechanical strength.
15
(a) (b)
(c) (d)
(e) (f)
Figure 9. Low rate and high rate mechanical property experiments of tantalum, a) cold worked Cabot, b) cold worked H.C. Starck, c) fine grain Cabot, d) fine grain H.C. Starck. e) large grain Cabot and f) Large grain H.C. Starck.

16
For the annealed tantalums with a fine grain size (Figures 9c and 9d) the low rate yield strength
was 260 MPa and for the large grain size (Figures 9e and 9f) the low rate yield strength was 240
MPa. By comparison, the high rate yields point was 550 MPa and 500 MPa for fine grain and
large grain size tantalum, respectively. These data show the strong rate dependent mechanical
property of the yield point for pure bcc metals. The increase in strain rate by 3 orders of
magnitude doubled the strength of the material. All samples that were TT oriented, annealed and
high rate loaded reached a mechanical saturation at a logarithmic strain of 0.15. The IP loaded
specimens continued to increase the mechanical strength to the maximum logarithmic strain of
0.4. At the maximum logarithmic strain the TT and IP strength data either converged, or
crossed, with the exception being low rate H.C. Starck which had a 40 MPa difference.
(a) (b)
Figure 10. Difference values of diameter measured on recovered samples, a) low rate compression experiments and b) high rate compression experiments.
One difference observed in the mechanical properties of the annealed specimens compared with
the cold worked materials was the yield drop under the low rate loading. Regardless of
orientation, grain size, or manufacturer, the annealed tantalum (Figure 9c-9f) had an upper and
lower yield point, with the magnitude of the drop being 30 MPa. In the cold worked tantalum no
yield drop was observed. The ringing that occurs in split Hopkinson Pressure bar experiments
can obscure the details of the response at the yield point.
17
As part of the mechanical property characterization a series of Taylor Impact experiments were
conducted on each of the metallurgical conditions. These experiments created a high strain rate
loading condition (105-104/s). The recovered samples provide in-sight into large strain, high
strain rate plasticity, while providing data for validating finite element based modeling and
simulation programs.
The Taylor Impact experiment consists of launching a plane-ended cylindrical specimen against
a rigid target. The gun barrel had a 5.33 mm (0.210 inch) bore diameter. The impact surface
was a polished 4340 steel anvil, heat treated to Rc hardness of 58. A pair of pressure gauges and
a pair of laser beams produced independent methods for determining the projectile velocity. The
specimens in this study impacted the anvil at velocities that ranged from 205 to 138 m/s. The
profile geometry of the recovered impact specimen was measured using an optical comparator.
The deformed microstructure of the recovered impact specimen was interrogated optically and
by EBSD.

18
6.0 Results The mechanical property data reported in Figure 9 were used to calibrate the MTS constitutive
relationship developed by Follansbee and Kocks, using the methodology developed by Chen and
Gray to characterize tantalum.7 Comparisons of the MTS calculated properties and those
experimentally measured using IP oriented specimens for the fine grained H.C Starck are shown
in Figure 11. The MTS parameters employed in the fitting process were weighted towards the
split Hopkinson Pressure Bar results in anticipation of simulating the high strain rate loading of
the Taylor Impact experiment. To demonstrate the analysis technique only the results for the
fine grain H.C. Starck are reported.
0 0.1 0.2 0.3 0.4 0.5Logrithmic Strain
0
100
200
300
400
500
600
700
800
900
True
Str
ess,
MPa
MTS, 0.1/sH.C. Starck, 0.1/s, IPMTS, 775/s H.C. Starck, 775/s, IP
Figure 11. MTS fit to mechanical property of fine grain tantalum produced by
H.C. Starck (IP direction).
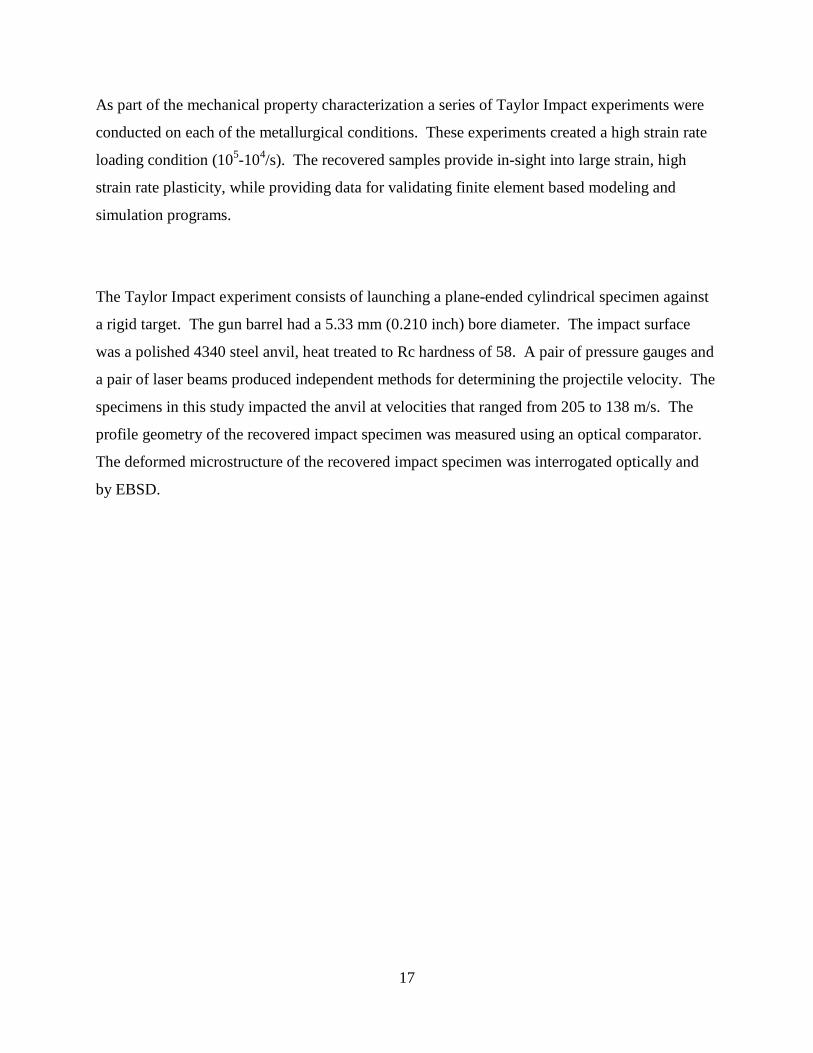
The photograph in Figure 12 shows the recovered sample geometry from the Taylor Impact
experiment using the fine grain H.C Starck tantalum. The ellipsoidal geometry of the axial
cross-section reflects the crystallographic texture and its effect on the mechanical properties.
The data in Figure 13 show equivalent strain contours results from a three dimensional
Lagrangian finite element calculation using EPIC06 with a modified yield surface that
19
incorporates anisotropy. The anisotropic yield surface description in EPIC has been described in
Reference 19 by Maudlin et al.
Figure 12. Geometry of a recovered Taylor
Impact specimen. The material is fine grain H.C. Starck tantalum.
Figure 13. EPIC06 simulation of the Taylor Impact experiment. The simulation was done in three dimensions with a plane of symmetry.
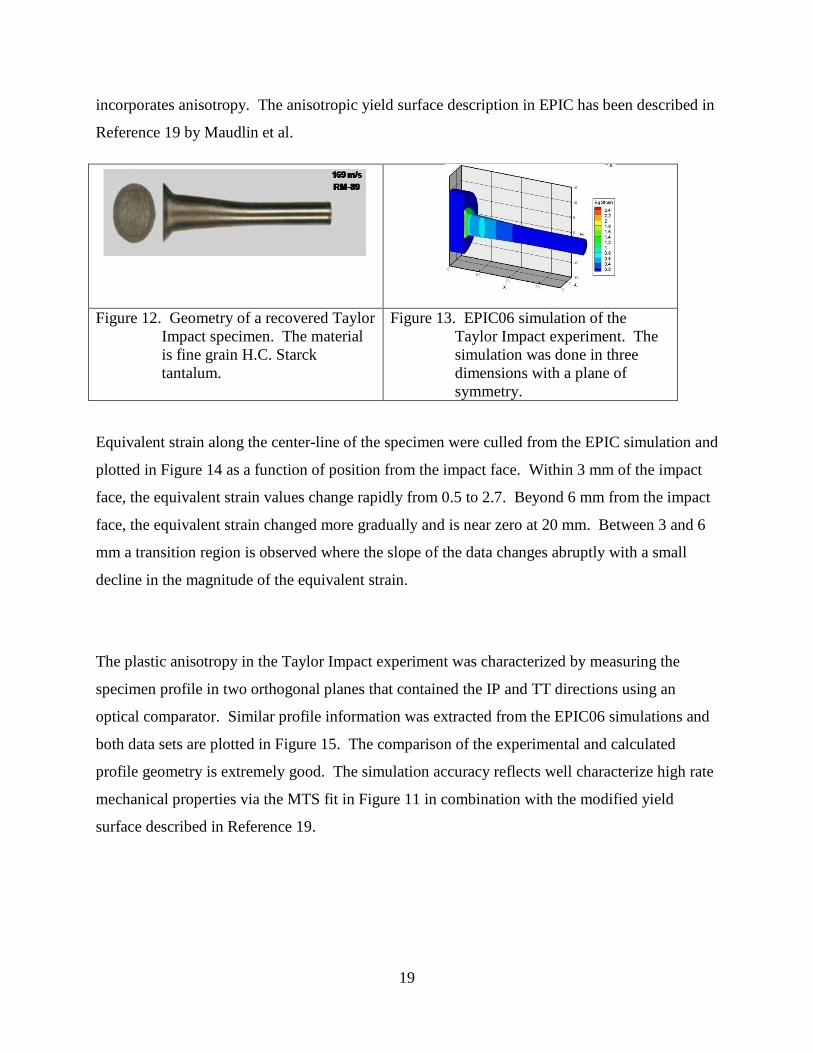
Equivalent strain along the center-line of the specimen were culled from the EPIC simulation and
plotted in Figure 14 as a function of position from the impact face. Within 3 mm of the impact
face, the equivalent strain values change rapidly from 0.5 to 2.7. Beyond 6 mm from the impact
face, the equivalent strain changed more gradually and is near zero at 20 mm. Between 3 and 6
mm a transition region is observed where the slope of the data changes abruptly with a small
decline in the magnitude of the equivalent strain.
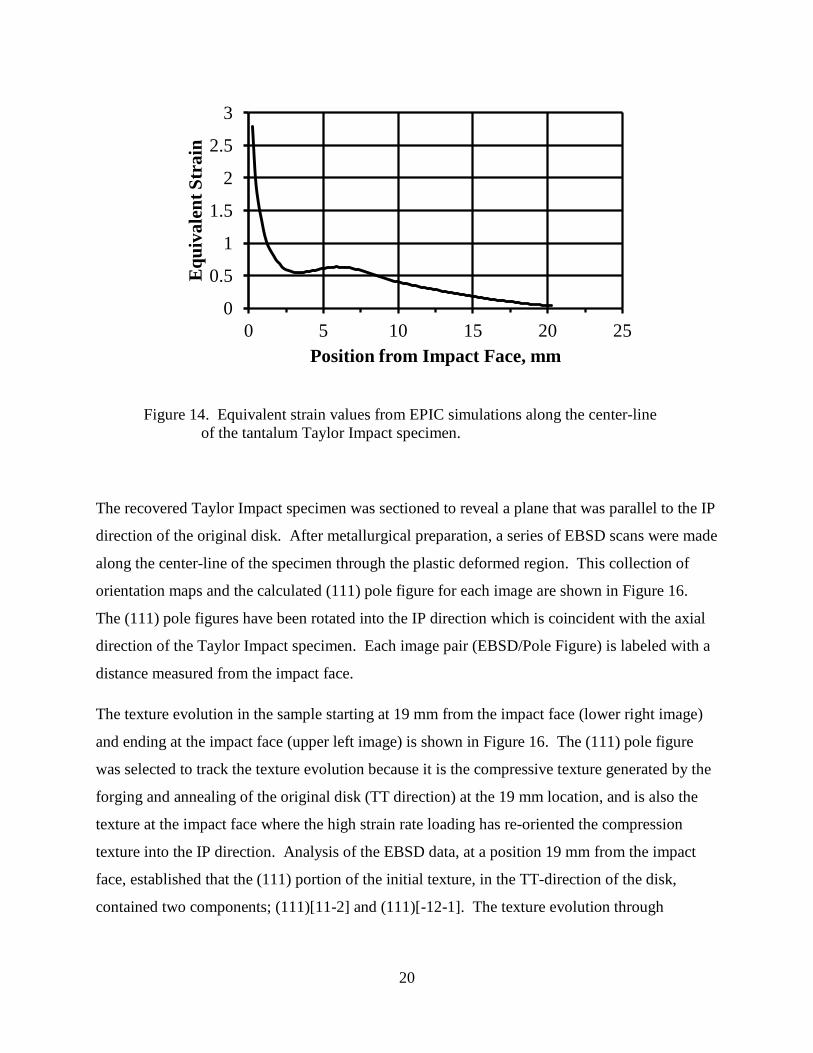
The plastic anisotropy in the Taylor Impact experiment was characterized by measuring the
specimen profile in two orthogonal planes that contained the IP and TT directions using an
optical comparator. Similar profile information was extracted from the EPIC06 simulations and
both data sets are plotted in Figure 15. The comparison of the experimental and calculated
profile geometry is extremely good. The simulation accuracy reflects well characterize high rate
mechanical properties via the MTS fit in Figure 11 in combination with the modified yield
surface described in Reference 19.
20
Figure 14. Equivalent strain values from EPIC simulations along the center-line of the tantalum Taylor Impact specimen.
The recovered Taylor Impact specimen was sectioned to reveal a plane that was parallel to the IP
direction of the original disk. After metallurgical preparation, a series of EBSD scans were made
along the center-line of the specimen through the plastic deformed region. This collection of
orientation maps and the calculated (111) pole figure for each image are shown in Figure 16.
The (111) pole figures have been rotated into the IP direction which is coincident with the axial
direction of the Taylor Impact specimen. Each image pair (EBSD/Pole Figure) is labeled with a
distance measured from the impact face.
The texture evolution in the sample starting at 19 mm from the impact face (lower right image)
and ending at the impact face (upper left image) is shown in Figure 16. The (111) pole figure
was selected to track the texture evolution because it is the compressive texture generated by the
forging and annealing of the original disk (TT direction) at the 19 mm location, and is also the
texture at the impact face where the high strain rate loading has re-oriented the compression
texture into the IP direction. Analysis of the EBSD data, at a position 19 mm from the impact
face, established that the (111) portion of the initial texture, in the TT-direction of the disk,
contained two components; (111)[11-2] and (111)[-12-1]. The texture evolution through
0
0.5
1
1.5
2
2.5
3
0 5 10 15 20 25
Equ
ival
ent S
trai
n
Position from Impact Face, mm
21
0 10 20 30 40 50Axial Position, mm
0
2
4
6
8
Rad
ius,
mm
Experiment TTEPIC06 TTExperiment IPEPIC06 IP
Figure 15. Comparison of specimen profile radius between measured and
calculated. In the simulation the MTS fit to mechanical property data of fine grain tantalum produced by H.C. Starck (IP direction) were used with an anisotropic yield surface.
Figure 16. Texture development in a Taylor Impact specimen of fine grain H.C.
Starck tantalum. All of the data were gather along the center-line and the location of the image as measured from the impact face is provided by the label. The orientation maps and pole figures are referenced to the axial direction of the Taylor specimen.
22
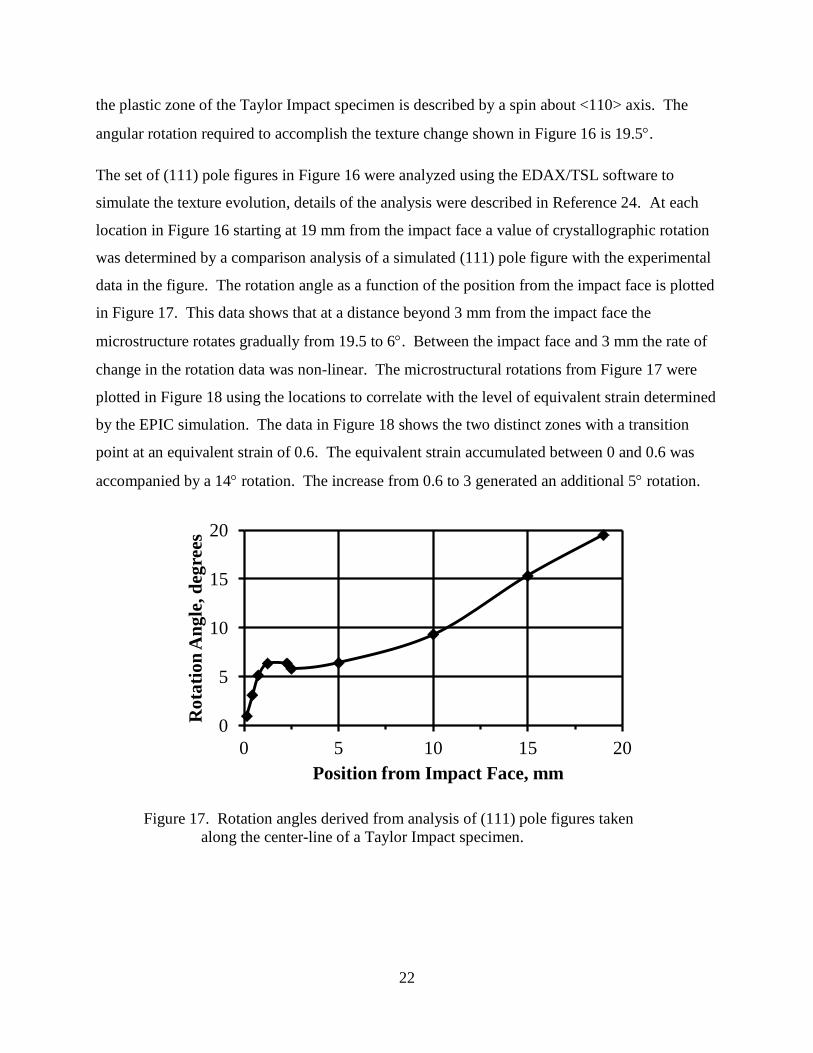
the plastic zone of the Taylor Impact specimen is described by a spin about <110> axis. The
angular rotation required to accomplish the texture change shown in Figure 16 is 19.5°.
The set of (111) pole figures in Figure 16 were analyzed using the EDAX/TSL software to
simulate the texture evolution, details of the analysis were described in Reference 24. At each
location in Figure 16
starting at 19 mm from the impact face a value of crystallographic rotation
was determined by a comparison analysis of a simulated (111) pole figure with the experimental
data in the figure. The rotation angle as a function of the position from the impact face is plotted
in Figure 17. This data shows that at a distance beyond 3 mm from the impact face the
microstructure rotates gradually from 19.5 to 6°. Between the impact face and 3 mm the rate of
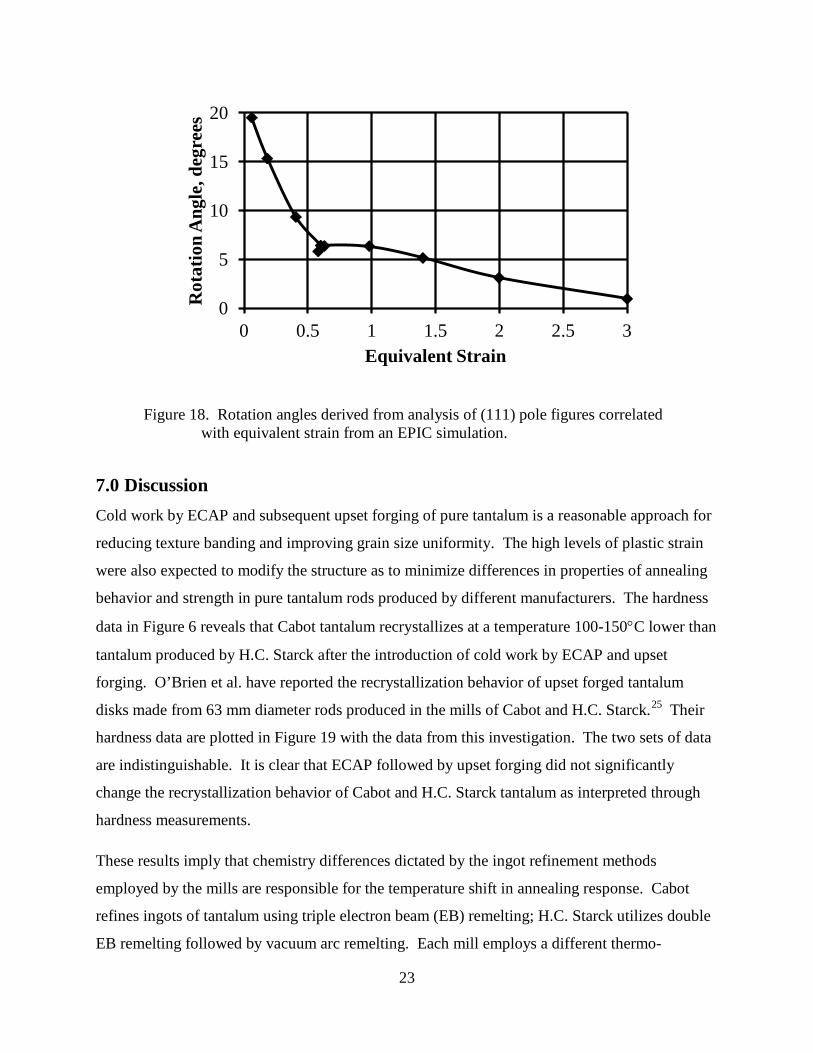
change in the rotation data was non-linear. The microstructural rotations from Figure 17 were
plotted in Figure 18 using the locations to correlate with the level of equivalent strain determined
by the EPIC simulation. The data in Figure 18 shows the two distinct zones with a transition
point at an equivalent strain of 0.6. The equivalent strain accumulated between 0 and 0.6 was
accompanied by a 14° rotation. The increase from 0.6 to 3 generated an additional 5° rotation.
Figure 17. Rotation angles derived from analysis of (111) pole figures taken along the center-line of a Taylor Impact specimen.
0
5
10
15
20
0 5 10 15 20
Rot
atio
n A
ngle
, deg
rees
Position from Impact Face, mm
23
Figure 18. Rotation angles derived from analysis of (111) pole figures correlated with equivalent strain from an EPIC simulation.
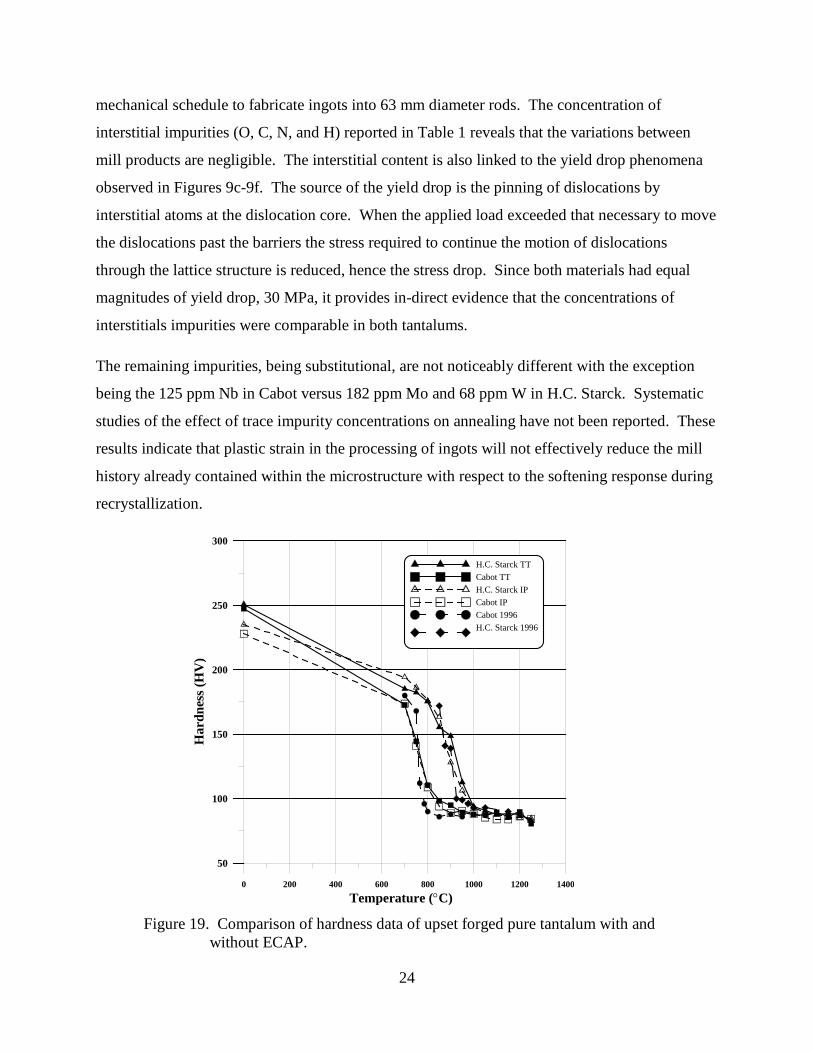
7.0 Discussion Cold work by ECAP and subsequent upset forging of pure tantalum is a reasonable approach for
reducing texture banding and improving grain size uniformity. The high levels of plastic strain
were also expected to modify the structure as to minimize differences in properties of annealing
behavior and strength in pure tantalum rods produced by different manufacturers. The hardness
data in Figure 6 reveals that Cabot tantalum recrystallizes at a temperature 100-150°C lower than
tantalum produced by H.C. Starck after the introduction of cold work by ECAP and upset
forging. O’Brien et al. have reported the recrystallization behavior of upset forged tantalum
disks made from 63 mm diameter rods produced in the mills of Cabot and H.C. Starck.25
These results imply that chemistry differences dictated by the ingot refinement methods
employed by the mills are responsible for the temperature shift in annealing response. Cabot
refines ingots of tantalum using triple electron beam (EB) remelting; H.C. Starck utilizes double
EB remelting followed by vacuum arc remelting. Each mill employs a different thermo-
Their
hardness data are plotted in Figure 19 with the data from this investigation. The two sets of data
are indistinguishable. It is clear that ECAP followed by upset forging did not significantly
change the recrystallization behavior of Cabot and H.C. Starck tantalum as interpreted through
hardness measurements.
0
5
10
15
20
0 0.5 1 1.5 2 2.5 3
Rot
atio
n A
ngle
, deg
rees
Equivalent Strain
24
mechanical schedule to fabricate ingots into 63 mm diameter rods. The concentration of
interstitial impurities (O, C, N, and H) reported in Table 1 reveals that the variations between
mill products are negligible. The interstitial content is also linked to the yield drop phenomena
observed in Figures 9c-9f. The source of the yield drop is the pinning of dislocations by
interstitial atoms at the dislocation core. When the applied load exceeded that necessary to move
the dislocations past the barriers the stress required to continue the motion of dislocations
through the lattice structure is reduced, hence the stress drop. Since both materials had equal
magnitudes of yield drop, 30 MPa, it provides in-direct evidence that the concentrations of
interstitials impurities were comparable in both tantalums.
The remaining impurities, being substitutional, are not noticeably different with the exception
being the 125 ppm Nb in Cabot versus 182 ppm Mo and 68 ppm W in H.C. Starck. Systematic
studies of the effect of trace impurity concentrations on annealing have not been reported. These
results indicate that plastic strain in the processing of ingots will not effectively reduce the mill
history already contained within the microstructure with respect to the softening response during
recrystallization.
0 200 400 600 800 1000 1200 1400
Temperature (°C)
50
100
150
200
250
300
Har
dnes
s (H
V)
H.C. Starck TTCabot TTH.C. Starck IPCabot IPCabot 1996H.C. Starck 1996
Figure 19. Comparison of hardness data of upset forged pure tantalum with and
without ECAP.

25
The cold worked mechanical property data suggests the two tantalums have different levels of an
intrinsic ability to store strain energy in the microstructure. It was observed that Cabot tantalum
strain hardened to a yield point 50 to 75 MPa higher than H.C. Starck in low rate experiments
(Figure 9a and 9b). This higher mechanical strength would indicate a higher dislocation density
in the Cabot tantalum. In the high rate loading experiments, Cabot mechanical strength was
higher near the yield point, and yet, decreased rapidly beyond a logarithmic strain of only 0.05.
Assuming the influence of adiabatic temperature increase in the experiments, the softening
reveals a change in the stress required to overcome barriers to dislocation motion. These
observations indicate Cabot tantalum has greater stored energy and is more sensitive to
temperature increases. The latter is consistent with the lower recrystallization temperature for
Cabot tantalum.
One objective of the study was to improve the uniformity of grain size in the forged tantalum
disk. The photo-micrographs in Figure 7 and the grain size distribution curves for the low
temperature anneals in Figure 8 provided evidence that supported improved grain size
uniformity. At the higher annealing temperatures, the data suggests that grain size varied with
position in a manner similar to the texture gradient. For H.C. Starck the grain size distribution
was symmetric about the mid-plane, as was the texture gradients. Cabot grain size distribution
was not-symmetric. Between the mid-plane and one edge of the sample the grain size
distribution followed a trend identical to that of the H.C. Starck response (Figure 8). On the
opposite side of the mid-plane the grain size was a constant. The orientation maps in Figure 3
for Cabot indicate the cold worked structure was non-symmetric about the mid-plane from the
viewpoint of crystallographic texture. The data suggests a connection between the deformation
texture and how the large grain recrystallization process evolved. However, the complex inter-
play between the deformed structure and processes like recovery, extended recovery, nucleation
and growth make it unclear what mechanisms controlled the evolution of the microstructure to
achieve the final large grain microstructure, i.e., symmetric versus non-symmetric grain size
distribution.
A second objective was to reduce, or eliminate, texture banding like that observed in the
orientation map in Figure 1. For the lower annealing temperatures, the orientation maps in
Figure 7 show a texture gradient between the outer edge of the disks and the mid-plane, but the
26
severe banding in Figure 1 is not present. At the higher annealing temperatures, H.C. Starck has
a microstructure dominated by grains with <111> directions parallel to ND, but no texture
banding is observed. Cabot tantalum shows a 0.5 mm size band of grains with <112> direction
parallel to the ND in a structure otherwise dominated by grains with <111> direction parallel to
the ND. Orientation maps of the Cabot tantalum annealed between the temperatures of 950ºC
and 1250ºC, all showed various levels of banding in the microstructure. While H.C. Starck had
the texture gradient at 1050ºC at each successively higher annealing temperature the gradient
was reduced in favor of grains with <111> direction parallel to the ND. The orientation maps
indicate the intrinsic properties of Cabot tantalum gives it a predisposition for forming banded
textures regardless of the level of mechanical work introduced by processing. Banding in H.C.
Starck tantalum can be eliminated by its intrinsic properties and how it response to thermo-
mechanical processing.
The third objective was to characterize the mechanical properties of Cabot and H.C. Starck
tantalums with different microstructures. The mechanical property data presented in Figure 9
provides in-sight into the relationship between thermo-mechanical processing and strength
properties for both low and high rates of loading. The stress versus strain data with loading in
orthogonal directions reveals the anisotropic properties of both types of tantalum. The geometry
of the recovered samples was used to quantify the magnitude of plastic anisotropy (Figure 10)
and this data was correlated with the microstructures. For both tantalums, the samples loaded in
the IP direction were considerably more anisotropic than those loaded in the TT direction
consistent with the grain orientation maps displayed in Figure 7. Plastic anisotropy is dependent
on load orientation, sample microstructure and the rate of loading. The anisotropic response was
least in the cold worked material and greatest in the large grain structure. Between
manufacturers, large grain Cabot had the highest magnitude of anisotropy in both low rate and
high rate experiments.
The Taylor Impact experiment is known as an integrated experiment because the conditions of
stress, strain, strain-rate, pressures and temperature are varying through-out the test. The simple
architecture of the experiment and the high rates of loading make the Taylor Impact experiment
useful for characterizing the properties of materials under dynamic loading. The geometry of the
recovered specimen displayed in Figures 12 and 15 provides data on the level of anisotropic

27
response in the material when subjected to high rates of loading. These results have been used to
validate the accuracy of continuum codes, such as EPIC, used for high strain rate design
applications. With the experimental stress versus strain data discussed above, the MTS
constitutive model in EPIC was calibrated to the mechanical property data for fine grain H.C.
Starck. The EPIC based calculation of the final specimen geometry for the Taylor Impact
experiment with the MTS constitutive model and the anisotropic yield surface description are in
excellent agreement with the experimental data.
The orientation maps of the recovered Taylor Impact specimen presented in Figure 16 shows the
texture evolution under high strain rate loading. The pole figures in Figure 16 were used to
determine the amount of rotation (Figure 17) and the axis of rotation, see Reference 24. The
orientation maps and the pole figures in Figure 16 were correlated with the position from the
impact face in the specimen. Using the EPIC simulation, the position data in Figure 16 for the
orientation maps and pole figures could be linked with the calculated values of equivalent strain.
Connecting the degree of rotation with the equivalent strain levels provides a tool for better
understanding the mechanics of polycrystalline metals. Numerous attempts have been made to
numerically predict the texture evolution in metals resulting from deformation. Generally, the
comparisons are in good qualitative agreement with experiments, but predicted texture tend to be
sharper and of higher magnitude than the experiment. The knowledge gained by detailed
analysis of texture evolution in experiments like the Taylor Impact experiment will improve the
understanding of the mechanics of polycrystalline metals. The information derived from the
analysis will be used to improve models that predict the texture evolution under different loading
conditions. Higher levels of fidelity in predicting texture evolution is a step towards the ability
to engineer properties of materials for better performance.
28
8.0 Conclusion Tantalum produced by Cabot and H.C. Starck were processed by ECAP and upset forging into
disks. Hardness measurements from annealing samples taken from the disks identified a 100ºC
to 150ºC shift in recrystallization response. Cabot reached a higher strength in the cold worked
condition and in split Hopkinson Pressure Bar experiments demonstrated higher temperature
sensitivity. The differences in ability to store strain energy and annealing response after ECAP
and upset forging point to intrinsic difference between Cabot and H.C. Starck pure tantalum
products even though both are produced to the same ASTM specification.
Orientation maps from the cold worked and annealed samples give insight to the texture, grain
size and grain uniformity. The cold work samples had a texture gradient from the outer edge to
the mid-plane. H.C. Starck’s texture gradient was symmetric about the mid-plane, Cabot’s was
not. At low annealing temperatures, both materials had a uniform grain size across the sample.
At higher annealing temperatures, the grain size varied with location and for H.C. Starck the
grain size distribution was symmetric about the mid-plane. For Cabot, one side had the same
grain size distribution as H.C. Starck, the opposite side had a constant grain size.
The processing of tantalum to reduce, or eliminate, texture banding was successful in the case of
H.C. Starck tantalum. Cabot had a banded microstructure regardless of the annealing
temperatures.
Tantalum’s ability to accommodate large magnitudes of plastic strain and its ability to work
harden is demonstrated in the mechanical property data. Cabot in the cold work condition had a
yield point of 800 MPa and was 50-75 MPa higher than H.C. Starck. The annealed tantalum had
yield points of 260 MPa and 240 MPa for fine and large grain, respectively. The split Hopkinson
Pressure Bar data shows for the annealed tantalum the materials high strain rate sensitivity for
yielding. Under conditions of high strain rate loading, the yield point was a factor of two higher
than the low rate yield point.
Analysis of the recovered samples showed that the anisotropic response is dependent on the load
direction, microstructure, and strain rate. Cold work samples loaded in the TT direction of the
disk had the lowest magnitude of strain anisotropy. Large grain samples loaded in the IP

29
direction of the disk had the highest. Cabot large grain tantalum displayed the highest level of
strain anisotropy.
Taylor Impact experiments were performed to characterize the properties of tantalum at high
strain rates. The recovered samples provided data on the plastic anisotropy of the tantalum
deformed under high strain rate conditions. EPIC simulations were performed based on the MTS
model in conjunction with an anisotropic yield surface and the final predicted sample geometry
was in excellent agreement with the experiment.
Orientation maps and pole figures generated from the recovered Taylor Impact specimen were
analyzed to determine the kinematics of rotation of the grains through the plastic zone. Results
from the rotation analysis and the EPIC simulation were correlated with one another to
understand the details of polycrystalline deformation.
9.0 References 1 J. M. O’Brien and W. F. Hosford. “Grain Refinement of Tantalum, Copper and Zirconium by Equal Channal Angular Pressing,” Technical Report Number AFRL-MN-EG-TR-2007-7000, Eglin AFB, November 2006.
2 L. E. Murr, H. K. Shih and C-S Niou, Materials Characterization, 33 (1994) pp. 65-74.
3 F. Cao, E.K. Cerreta, C.P. Trujillo and G.T. Gray III, Acta Materialia 56 (2008) pp. 5804-5817.
4 E.C. Faccini, Tantalum, E.Chen, A. Crowson, E.Lavernia, W. Ebihara, P. Kumar (Eds.), TMS, Warrendale, PA (1996) pp. 73-94.
5 H. K. Shin, L.E. Murr, C-S Niou, and L. Zernow, Scripta Met. et Mat. 29 (10) (1995) pp. 1291-1296.
6 L. E. Murr, C-S Niou, J. C. Sanchez, and L. Zernow, Scripta Met. et Mat. 32(1) (1995) pp. 31-36.
7 S. R. Chen and G. T. Gray III, Met. Trans. A, 27 A (10) (1996) pp. 2994-3006
30
8 K. G. Hoge and A.K. Mukherjee, J. Mater. Sci. 12 (1977) pp. 1666-1672.
9 C. A. Michaluk, Tantalum, E.Chen, A. Crowson, E.Lavernia, W. Ebihara, P. Kumar (Eds.), TMS, Warrendale, PA (1996) pp. 205-217.
10 S. Nemat-Nasser and J.B. Isaacs, Acta Materialia 45 (3) (1997) pp.907-919.
11 W. F. Hosford, The Mechanics of Crystals and Textured Polycrystals. Oxford Engineering Science Series. Oxford University Press, New York, Oxford. 1993.
12 S. I. Wright, G.T. Gray III, and A.D. Rollett, Met. Trans. A, 25A, May (1994) pp. 1025-1031
13 C. A. Michaluk, M. M. Nowell, and R. A. Witt, JOM, March (2002) pp. 51-54.
14 R. Z. Valiev, et. al., JOM, (2006) pp. 33-39.
15 S. N. Mathaudhu and K. T. Hartwig, Materials Science and Engineering A, 426 (2006) pp. 128-142.
16 J. M. O’Brien and W. F. Hosford, AFRL-MN-EG-TR-2007-7000, Technical Report, Eglin AFB, FL, November 2006, Contract No. F08651-02-C-0023.
17 P. S. Follansbee and U.F. Kocks, Acta Met., vol. 36, (1988) pp. 81-93.
18 G. I. Taylor, Proc. R. Soc of London, A 194, (1948) pp. 289-299.
19 P. J. Maudlin, J. F. Bingert, and G. T. Gray III, Int. J. of Plasticity 19 (2003) pp. 483-515.
20 J. W. House and P. P. Gillis, Mat. Sci. Forum, vol. 408-412, (I) (2002) pp. 547-552.
21 J. F. Bingert, T. A. Mason, G. C. Kashner, P. J. Maudlin and G. T. Gray III, Electron Backscattered Diffraction in Materials Science, A. J. Schwartz, M. Kumar, and B. Adams (Eds.), Plenum Publisher, New York, 2000, pp. 213-229.
22 G. R. Johnson, J. Appl. Mech. 98 (1976) pp. 439-444.
23 A. M. Kelly, S. R. Bingert, and D. J. Thoma, Materials Characterization 32 (1) (1994) pp. 35-39.
24 J. W. House et al., AFRL-MN-EG-TR-2011-032, Texture Evolution During Dynamic Loading of ECAP Tantalum, Technical Report, Eglin AFB, FL, March 2011.
25 J. M. O’Brien and W. F. Hosford. “Manufacturing and Metallurgical Evaluation of Cold Forged Tantalum and Tantalum-Tungsten Alloy,” Technical Report Number AFRL-MN-EG-TR-2001-7031, Eglin AFB, May 2001.
DISTRIBUTION LIST AFRL-RW-EG-TR-2011-045
Defense Technical Information Center 1 Attn: Acquisition (OCA) 8725 John J. Kingman Road, Ste 0944 Ft Belvoir, VA 22060-6218 EGLIN AFB OFFICES: AFRL/RWOC (STINFO Office) - 1 AFRL/RW CA-N - STINFO Officer Provides Notice of Publication AFRL/RWME - 1 AFRL/RWMF - 1 AFRL/RWMW - 3 AFRL/RWMI - 1 AFRL/RWPC - 2 O’Brien and Associates Los Alamos National Laboratory Attn: James M. O’Brien, Attn: John Bingert P.O. Box 126 MST-6, Mail Stop G770 Blissfield, MI 49228 Los Alamos, NM 87545 Los Alamos National Laboratory Los Alamos National Laboratory Attn: Matthew Tucker, Ph.D. Attn: David Alexander MST-8, Mail Stop G755 MST-6, Mail Stop G755 Los Alamos, NM 87545 Los Alamos, NM 87545 University of Florida/REEF H.C. Starck Attn: Prof. Robert J. De Angelis Attn: Dincer Bozkaya 1350 North Poquito Road 45 Industrial Place Shalimar, FL 32579 Newton, MA 02461 Cabot Supermetals Attn: Engineering P.O. Box 1608 Boyertown, PA 19512

![Texture, Second-Phase Particles, and the Anisotropy of Deformation Behavior in … · 2019. 10. 12. · recrystallization annealing treatment.[31–35] The aim of the present study](https://static.fdocuments.us/doc/165x107/60bf0737669c443c9151d900/texture-second-phase-particles-and-the-anisotropy-of-deformation-behavior-in-2019.jpg)


![Variant Selection During Cooling after Beta Annealing of ...result of deformation, dynamic/static recrystallization, grain growth, or phase transformation.[4,5] To date, a ... interesting](https://static.fdocuments.us/doc/165x107/60adaa2fa9bd9f17a3603baa/variant-selection-during-cooling-after-beta-annealing-of-result-of-deformation.jpg)