ANNALS OF THE UNIVERSITY OF PETROŞANI ECONOMICS · Annals of the University of Petroşani,...
255
ISSN 1582–5949 http://www.upet.ro/annals/economics/ [email protected] Universitas Publishing House Petroşani - Romania ANNALS OF THE UNIVERSITY OF PETROŞANI ECONOMICS VOL. XII - PART IV 2012 From 2009 the journal is classified in the B+ Category (code 23) by the National Council for Scientific Research in Higher Education from Romania (CNCSIS).
Transcript of ANNALS OF THE UNIVERSITY OF PETROŞANI ECONOMICS · Annals of the University of Petroşani,...

ISSN 1582–5949
http://www.upet.ro/annals/economics/
Universitas Publishing House Petroşani - Romania
ANNALS OF THE UNIVERSITY OF PETROŞANI
ECONOMICS
VOL. XII - PART IV
2012
From 2009 the journal is classified in the B+ Category (code 23) by the National Council for Scientific Research in Higher Education from
Romania (CNCSIS).

EDITOR OF PUBLICATION Prof. Eng. Ioan-Lucian BOLUNDUŢ Ph.D., e-mail: [email protected]
ADVISORY BOARD Prof. Ioan ABRUDAN Ph.D. Technical University of Cluj-Napoca, Romania Prof. Crişan ALBU Ph.D. Academy of Economic Studies, Bucharest, Romania Prof. Ionel BARBU Ph.D. „Aurel Vlaicu” University of Arad, Romania Prof. Mircea BARON Ph.D. University of Petroşani, Romania Prof. Constantin BÂGU Ph.D. Academy of Economic Studies, Bucharest, Romania Prof. Maria BOLDEA Ph.D. West University of Timişoara, Romania Prof. Petre BREZEANU Ph.D. Academy of Economic Studies, Bucharest, Romania Prof. Sorin BRICIU Ph.D. „1 Decembrie 1918” University of Alba-Iulia, Romania Assoc. Prof. Ovidiu BUNGET Ph.D. West University of Timişoara, Romania Prof. Laura Mariana CISMAŞ Ph.D. West University of Timişoara, Romania Prof. Ioan COSMESCU Ph.D. „Lucian Blaga” University of Sibiu, Romania Prof. Horia CRISTEA Ph.D. West University of Timişoara, Romania Prof. Tatiana DĂNESCU Ph.D. “Petru Maior” University of Tg. Mureş, Romania Prof. Ioan Constantin DIMA Ph.D. “Valahia” University of Târgovişte, Romania Prof. Elena DOBRE Ph.D. „Ovidius” University of Constanţa, Romania Prof. Luigi DUMITRESCU Ph.D. „Lucian Blaga” University of Sibiu, Romania Assoc. Prof. Codruţa DURA Ph.D.
University of Petroşani, Romania Assoc. Prof. Valentina FETINIUC Ph.D. International Center for Research into Economic Transformations, Republic of Moldova Prof. Jaime GIL ALUJA Ph.D. Royal Academy of Economics and Finance, Barcelona, Spain Prof. Janusz GRABARA Ph.D. Czestochowa University of Technology, Poland Prof. Constanţa IACOB Ph.D. University of Craiova, Romania Assoc. Prof. Claudia ISAC Ph.D. University of Petroşani, Romania Prof. Mihaela KELEMEN Ph.D. Keele University, United Kingdom Prof. Mariana MAN Ph.D. University of Petroşani, Romania Prof. Gheorghe MATEI Ph.D. University of Craiova, Romania Prof. Arnaldo MAURI, Ph.D. University of Milano, Italy Assoc. Prof. Ilie MITRAN Ph.D. University of Petroşani, Romania Prof. Vladimír MODRÁK Ph.D. Technical University of Košice, Slovakia Prof. Aladár NAGY Ph.D. University of Miskolc, Hungary Prof. Jozef NOVÁK-MARCINČIN Ph.D. Technical University of Košice, Slovakia Prof. Adriana OLARU Ph.D. "Dunărea de Jos" University of Galaţi, Romania Prof. Dumitru OPREAN Ph.D. „Babeş-Bolyai” University of Cluj-Napoca, Romania Prof. Natalia PASHKEVICH Ph.D. St. Petersburg State Mining Institute, Russia
Assoc. Prof. Francesco PASTORE Ph.D. Second University of Napoli, Italy Prof. Marina PESHKOVA Ph.D. Mine University of Moscow, Russia Prof. George POEDE Ph.D. „Al.I.Cuza” University of Iaşi, Romania Prof. Mirjana RADOVIĆ MARKOVIĆ Ph.D. Institute of Economic Sciences, Belgrade, Serbia Assoc. Prof. Ilie RĂSCOLEAN Ph.D. University of Petroşani, Romania Prof. Oleksandr ROMANOVSKIY Ph.D. National Technical University of Kharkov, Ukraine Prof. Bruno SCHÖNFELDER Ph.D. Technical University of Freiberg, Germany Prof. Elena Claudia ŞERBAN Ph.D. Academy of Economic Studies, Bucharest, Romania; Prof. Aurelia-Felicia STĂNCIOIU Ph.D. Academy of Economic Studies, Bucharest, Romania Prof. Ion STEGĂROIU Ph.D. “Valahia” University of Târgovişte, Romania Prof. Ovidiu STOICA Ph.D. “Alexandru Ioan Cuza” University of Iaşi, Romania Assoc. Prof. Alexandru STRATAN Ph.D. Institute of Economy, Finance and Statistics, Republic of Moldova Prof. Emilia VASILE Ph.D. “Athenaeum” University of Bucharest, Romania Prof. Yuriy VILKUL Ph.D. - Technical University of Krivoirog, Ukraine
EDITORIAL BOARD
Editor-in-chief: Prof. Mariana MAN Ph.D., University of Petroşani, Romania
Deputy Editor-in-chief: Lecturer Imola DRIGĂ Ph.D., University of Petroşani, Romania
Associate Editors Lecturer Oana DOBRE-BARON Ph.D. University of Petroşani, Romania
Lecturer Mirela MONEA Ph.D. University of Petroşani, Romania
Lecturer Alin MONEA Ph.D. University of Petroşani, Romania
Lecturer Dorina NIŢĂ Ph.D. University of Petroşani, Romania
Editorial Secretary Assist. Prof. Oana-Carmen RĂVAŞ University of Petroşani, Romania
Assist. Prof. Ana-Petrina STANCIU University of Petroşani, Romania
Language Reviewer: Assoc. Prof. Gabriela DUMBRAVĂ Ph.D., University of Petroşani, Romania
Technical Editor: Assist. Prof. Marian FOAMETE University of Petroşani, Romania

Annals of the University of Petroşani, Economics, 12(4), 2012 3
Contents
Atanasoaie, G. Price on the Organic Food Market Bratu (Simionescu), M. The Accuracy and Bias Evaluation of the USA
Unemployment Rate Forecasts. Methods to Improve the Forecasts Accuracy
Cenuşe, M.; David, A. Legal Issues and Aspects Related to the Human Resources Management Regarding the Selection of Civil Servants
Chaiboonsri, C.; Chaitip, P. A Comparative Analysis of ASEAN Currencies Using a Copula Approach and a Dynamic Copula Approach
Cucu, C. Computer-Based Reasoning Systems: An Overview Dobre-Baron, O. The Analysis of the Beer Sector in Romania Dumbravă, G. Keying and Role Play in Business Encounters. Spatial,
Temporal, Behavior and Language Cues Dura, C.; Ghicajanu, M. Overview of the State of Corporate Social
Responsibility within Multinational Companies Guță, A.J. Characteristics of Public Sector Management Isac, A.C. The Place of Facebook in International Social Network Portfolio Isac, C.; Bahnaru, M.; Stanciu, A.P. Comparative Analysis of the
Unemployment between Romania and Moldova Kar, J. Income Inequality in Some Major European Union Economies A
Discriminant Analysis Manole, O.; Necșulescu, C. The Decentralization Process in Romania Has
Been Affected by the Financial Crisis or Not; Arguments in Favor or Against Decentralization in the Management of the Financial Crisis
Matei, G.; Manole, O. Imbalances in Financial Autonomy at Different Level of Local Government in Romania
Okwiet, B. Environmental Management in the Energy Sector on the Example of Power Plant in Belchatow
Okwiet, B. CSR - Issues in the Value Chains of Multi National Companies (MNCs) – Challenges and Best Practise
Oprițescu, E.M. Competitiveness in Regional Development Petrini, M. Extended Network for Backpropagation Algorithm Petrini, M. Improvements to the Backpropagation Algorithm
5 17
33
39
53 61 77
85
95
103 109
117
129
137
147
155
169 177 185

4 Annals of the University of Petroşani, Economics, 12(4), 2012 Pîrvu, R.; Axinte, G. Return Migration – Reasons, Consequences and
Benefits Pîrvu, R.; Danatie Enescu, M. Competitiveness in Services, Driving Force of
Economic Development Popa, C.E. Monetary Aggregates - Instrument of the Policy Promoted by the
National Bank of Romania Răvaş, B. Independence and Objectivity - A Sine Qua Non Principle in
Auditing Sabău, L.I. Information and Strategic Decisions in Economic Entities
Management Slusariuc, G.C.; Răscolean, I. The Perception of Tourism Development in
West Region of Romania Stanciu, A.P.; Brezeanu, P. The Prognosis of Total Public Expenditures and
Types of Expenditures in Romania
193
203
211
219
227
235
243

Annals of the University of Petroşani, Economics, 12(4), 2012, 5-16 5
PRICE ON THE ORGANIC FOOD MARKET
GEORGE ATANASOAIE *
ABSTRACT: The main objective of this paper is to present prices on PAE market (PAE- organic foods market). Prices are analyzed in terms of importance and the main factors that contribute to their establishment (quality of products, distribution channels, certification and eco-labeling system, customer segments and market development stage). This paper is based on the investigation of secondary sources, of specialized literature related to PAE consumers. The paper shows that are used three strategic options of prices: prices with high rigidity located in a low or high level and fluctuating prices, characterized by variations on short periods of time. Price is a very important barrier to market development but this importance can be mitigated through appropriate communication policies with the market, which are essential especially for markets in early stages of development
KEY WORDS: ecological food products (organic); price; consumers; market.
JEL CLASSIFICATION: M31 1. PRICE ON PAE MARKET
PAE Market represents an industry with a positive development in recent years, and showing great benefits for society, among which stands protecting the environment, maintaining population health, rural areas development, creating export opportunities for developing countries and animal welfare. The evolution of this sector is hindered by the too high prices on markets in early stage of development. All marketing mix variables are closely connected to each other, which mean that decisions relating to prices are closely linked to decisions on product, distribution and promotion. Price is a marketing variable that can be easily modified unlike the other three marketing mix variables, when the marketing conditions require it. To the pricing of these products should be taken into account the prices of conventional food products. Consumers' willingness to purchase these products depends on factors such as processing, packaging, certification, labeling and consumer knowledge about products. If an individual cannot distinguish between two alternatives, the price differences between organic and conventional foods can induce a state of confusion. Product attributes together with education, income, occupation and household size influence the
* Teacher, Ph.D. Student, “Ioan Bojor” Technological High School, Reghin, Romania, [email protected]

6 Atanasoaie, G. attitude and preferences towards products. There are people who would buy these products despite higher prices but do not know the existence of these products on the market. There are debates in society about the quality of PAE. Thus, it is questioned whether these products are better in terms of quality than conventional food. Consumers are willing to pay the price difference only if they are convinced that these products are better. Also, how they report the price of organic products to conventional food prices is very important, because consumers should be educated not to take into account the cheapest variant of conventional food as the basis of comparison but to analyze the organic product compared with the conventional food but of a better quality and a higher price than the cheapest option. This price difference can be seen as an investment in human health. Price differences ranges depending on skills as manager of the farmer, farm size, conversion stage to organic farming and farming system practiced on farm land (Bonti-Ankomah & Yiridoe, 2006). There are countries where conventional foods are cheaper than in other countries (eg Spain), which makes the price differences between conventional and organic food to be higher. Therefore producers are turning to exports towards countries with more developed markets, leading development of the internal market delay (Gil, et al., 2000). Price is a factor with important consequences on PAE market. Thus, alongside with the limited availability of these products, the price is one of the most significant barriers hindering market development (Brown, et al., 2009). More than half of consumers consider PAE price as being too high (Tsakiridou, et al., 2008). Other authors have found that price too high is a significant barrier only for 12.5% of people, while a much larger obstacle is the fact that these products have a limited availability Chryssohoidis & Krystallis, 2005). Despite the importance of price as a barrier to purchase, there is a more pronounced decrease of this barrier importance, for all categories of consumers (Mondelaers,et al, 2009). Given that price is a factor hindering market development it is very important when buying for the first time these products, consumers to be fully satisfied so that their satisfaction to lead to new acquisitions. (Aertsens, et al,, 2009). While there is a clear tendency of consumers that take into account price when are buying food, there can be observed an orientation towards high quality food, which include PAE also. (Davies, at al., 1995). An important consequence of higher prices in the PAE market is their incentive character because leads some farmers to enter in the period of conversion to organic farming but there are many challenges that they must overcome. One of the most important challenges refers to the price development of these products, trend which tends to be descending, as in the case of conventional agriculture, which determines the farmers to arrange new channels for distribution to avoid supermarket chains in order to retain a greater portion of profit (Seyfang, 2007). Another reason why the evolution of these prices is descending represents the fact that is entering in this sector larger farms that succeed to significantly reduce costs. Hence the reluctance of small producers on the involvement of large firms in this field (Morven, et al., 2004). Also, a reduction of subsidies for farmers in the post-

Price on the Organic Food Market 7 conversion period is likely to erode from the positive dynamic of organic farming. In countries where organic milk supply rose due to a wave of animal husbandry farmers who achieved the conversion to organic farming decreased a lot the organic milk price but increased the price of organic grain needed to feed the animals, which determined some of the new organic farmers to give up organic farming. The disordered development of ecological agriculture is adjusted over time as the overall demand for PAE is growing, being large waves of growth followed by a lower recoil. Though with PAE price vary also the number of consumers and consumption intensity, the number of consumers that are less sensitive to price is increasing, which creates serious premises for market development. Consumers’ education to buy less products off-season and which are produced locally is a way to control prices. The growing experience that organic farmers acquire enables them to offer competitive prices. Involvement of authorities, farmers associations and NGOs is essential for this purpose. PAE market is growing, but it requires competitive prices and to inform consumers for them to make the difference between an organic product and one obtained in conventional manner (Briz & Ward, 2009). Market development also depends a lot on evolution of the medium and long term of macroeconomic conditions since in the global economic crisis conditions are more people who have difficulties in procuring conventional food and for whom organic food is not a priority. For PAE market to lose niche market status it is necessary that the difference in price to drop to 20-30%. Between 5-20% of consumers are willing to pay a price difference of 30%, while a difference between 5-10% will attract willingness to pay of 45 - 80% of consumers. Such percentages vary depending on the consumer incomes. Regarding the dynamic of the difference in price that consumers are willing to pay it can be observed an increase of 5-6% in 1999 to 25.1% in 2007, with faster progress since 2003 (Gonzalez, 2009 ). Consumers cannot distinguish between conventional and organic products and retailers should implement appropriate strategies for information. Consumers must have confidence in organic labeling systems, in order to differentiate products (Siderer, et al., 2005). Elasticity of demand for organic foods based on price is much higher than for conventional food (Wier & Calverley, 2002) which means that the efforts of market participants to lower prices will lead to considerable increase in demand. There are potential clients that would buy these product but they do not buy because of the price (Burja & Burja, 2008). On the other hand, the decrease in prices or their sudden drop will make organic farming less desirable for farmers, undermining the uniqueness of this domain. Another situation that will increase future demand for PAE is to increase revenue. PAE price is perceived as elitist one, and products are perceived to taste better but not particularly showy. Some consumers perceive products aspect as more important than their prices (Juan Antonio Aguirre Gonzalez, 2009). For consumers who prefer to buy from supermarkets, products acceptance is conditioned on their appearance (Richter & Hempfling, 2002), unlike consumers who prefer specialized

8 Atanasoaie, G. organic shops that accept more easily products with disabilities regarding their appearance. Price differences between organic and conventional foods vary from country to country, depending on weather conditions, subsidies granted, the degree of market development and product specificity. In general, if eggs and fruits case distinguishes higher price differences that do not represent insurmountable obstacles if effective marketing policies are implemented. PAE quality determines the practicing of a certain price level. Thus, for products with a high quality level are practiced higher prices, unlike PAE for which are no special requirements on quality. 2. STRATEGIC VARIANTS OF PRICES In the early phase of the PAE life cycle the price and promotion are two variables of the marketing mix more important than the product and distribution. In the organic food sector there are several pricing strategies based on price rigidity. A premium pricing strategy represents the establishment of prices with low rigidity, which means alternating some price reductions with regular prices. It is very important that the discounts to not be on extended periods of time so that consumers’ confidence in those products to don’t be lose. A second option for prices is the use of some low prices, unchanged for long periods of time, especially by food retailers and PAE marketed under the retailers’ brand. A third strategy of prices refers to the use of high prices for products for which demand is less influenced by price. Such high prices have a high stiffness as they remain relatively unchanged for long periods of time and are used mostly by specialized retailers (Hellberg-Bahr, et al., 2011). All these pricing strategic variants must be accompanied by proper communication through which to highlight the main advantages that customers will have. (better quality, health and environmental protection) to maximize the chances of purchase. 3. PRICE AND DISTRIBUTION CHANNELS PAE prices depend on the chosen distribution channels. In addition to higher prices that consumers have to pay, they also bear the costs related to search activities of these products because they cannot be easily found, and this causes that some of relative non consumers to don’t make the step toward purchase. Marketing through direct sale by farmers, through CSA systems (Community Supported Agriculture) peasant markets, sales from farms, leads to consumption increase and increase of farmers' profits. It is an appropriate distribution method especially for markets in early stage of development but also for the developed markets, for those segments of consumers for whom ethical values are very important in choosing food products that are going to be purchased. It is developing a relationship of trust between consumer and farmer, relationship that can be strengthened by organizing farm visits. There are CSA type systems where consumers

Price on the Organic Food Market 9 pay part of the price in advance before farmers to start work on the farm, which induces a feeling of safety on the sale of products. Use of the Internet is proving to be successful for organic farmers because there don’t need to invest in retail space, which leads to lower costs. Sequential harvesting by small farmers creates the opportunity to provide access to better prices because they do not carry significant costs for the storage, losses due to organoleptic changes of products during storage are small and it can be used more effectively the workforce of farmer’s family (Katundu, et al., 2010). There are problems in terms of marketing knowledge of organic farmers, but these deficiencies can be remedied by involving the authorities, NGOs and other actors in the market so that organic farmers to acquire the necessary knowledge for marketing strategies implementation in order to enable to sell directly to consumers, which would ensure them a better price. Distribution through specialized organic shops and organic restaurants requires practice of higher prices than in supermarkets, but which reward better the farmers’ job. Availability of specialized organic shops consumers to pay extra for these products increases as it increases the percentage of organic origin ingredients in the finished product (Batte, et al., 2007). Prices of organic food distributed through catering companies are large because catering units use processed or cooked food to avoid the obligation to set up a special room for the preparation of fresh raw materials, and PAE are not provided in the cooked state because there is the widespread opinion that these products must be offered fresh (Post, et al., 2008). Processors offer farmers who have less bargaining power very low prices, being problems by farmers on their ability to comply with the requirements of quality, quantity and time of delivery. At first processors are present in small number on the market because there are very few farmers who can meet the requirements of processors. Also, the increasing involvement of hypermarkets and the processing industry development lead to prices decrease (Lockiea, at al., 2004).The distribution of these products in supermarkets requires good organization for the delivery of high quality products. Though, in general, prices of food products delivered in supermarkets are smaller than other distribution systems, there are also ecological foods as meat, for which prices are higher in supermarkets with 64% than the direct means of distribution (Morven, et al., 2004). There is reluctances from organic farmers to work with supermarkets because supermarkets have high bargaining power, offer very low prices, have high demands on quality, quantity and delivery terms and high trade markup for these products. Managers of major shops argue that their business practices (very low prices offered to farmers, establishment of fees etc.) reflect their operational costs and customer requirements (Dolan, 2008). PAE sometimes very low prices in supermarkets are challenged by actors in the field as it affects the integrity and spirit of organic farming. Despite the controversial role that these great shops have, it is certain that they contribute to market development and the possible adverse effects they cause may be offset by better education of farmers with lower production capacity so that they also

10 Atanasoaie, G. get with their products to customers. There are some opinions that low prices in supermarkets are not in the interests of customers because they are compensated by lower quality services. 4. PRICE AND CUSTOMER SEGMENTS Customer segments which they are intended PAE put their considerable footprint on practiced prices. There are two categories of consumers who show a higher willingness to pay higher prices, elderly consumers with incomes above average, interested in health and environmental activists (Lockiea, at al., 2004). There is a group of ordinary consumers who regularly buy these products and are less sensitive to the price of these products because they give priority to the advantages they have when buying and consuming these products. Within this category of consumers there is a sub-category that prefers to buy locally produced food products to support local agriculture and so that will no longer need to transport food on long distances between producers and consumers (Hamzaoui Essoussi & Zahaf, 2008). For this sub-category it is necessary a deep understanding of the perceptions and attitudes in order to implement effective marketing strategies. Here are consumers who only seem to be interested in environmental issues, which are not willing to integrate in the purchasing behavior and consumption of food the ideas on environmental protection (Davies, et al., 1995). Moreover, although 49% of consumers were concerned about the level of pesticide, and 46% were concerned with the high content of preservatives and additives in their food, only 26% of them have changed their consumer and purchase behavior regarding PAE, because this change involves costs in terms of money and time (Desmond, 1991). Some consumers declare their willingness to pay more for PAE but this availability is only in words, because in reality, they want to pay a price difference less than is on the market, especially for products such as organic meat. There are exceptions to this situation, for products such as organic milk, for which consumers act not only in words but also in reality and pay the difference of price from the market (Millock & Hansen, 2002). The price is a more important barrier for consumers of "light" type, which consume very little PAE, although they realize the special nature of these products. Consumers of "heavy" type are the least sensitive to the price of these products, for them are excelling (Mondelaers,et al., 2009). 'Ideological' consumers for which PAE consumption is a philosophy of life, have a critical attitude towards genetically modified foods and the corporations that produce food, are more willing to pay a higher price for these products, unlike pragmatic consumers, for which the consumption of these products does not have a special symbolic meaning (Pellegrini & Farinello, 2009) . In recent years the notion of ethical consumerism, which requires larger and more stable prices for farmers in developing countries, reducing greenhouse gas emissions, protection of tropical forests, prevention of child labor, animal welfare, preservation of traditions, integration of people with disabilities and biodiversity conservation. Despite awareness of these ideas, rarely ethical values are communicated to consumers, being preferred communications based on pragmatic reasons of buying

Price on the Organic Food Market 11 (the sanogenetic pronounced character of PAE, better taste), resulting the remaining in latent state of a demand part for such products. The most important ethical values that must be communicated to the consumers and for which consumers are willing to pay extra are “animal welfare" and "regional production" (Zander & Hamm, 2010). Such ethical values can be used for a more effective differentiation of food products on the market, which may lead to higher market shares. Purchase selfish reasons are more predictive in terms of buying behavior in comparison with altruistic motives but cause a lower availability of consumers to pay higher prices for organic food. Also, family incomes are incentives for willingness to pay extra just to a certain step, beyond which high incomes determine the decreases of PAE consumption. Consumers who are very concerned about their health are more willing to pay extra for an organic food that incorporates less than 95% of the organic ingredients, and less willing to pay for a product that has more than 95% of organic ingredients. The existence of children in family determines an increase of the consumers’ willingness to pay more for these products that have between 70-95% of organic ingredients. (Batte,et al., 2007). An effective policy of prices in this market can only be achieved by determining the exact customers segments which will be assign these products and the reasons for buying. In UK the most important reason of acquisition is the quality, followed by health and environmental concerns (Griffth &Nesheim, 2008). 5. PRICE AND MARKET DEVELOPMENT STAGE Stage of market development affects the price level to a great extent. Thus on the markets in the early stages of development are practiced high prices for several reasons. There is a novelty element that generates higher prices, but at the same time, there are higher logistical and production costs. That part of production costs which is due to specific production activity in organic farming will largely remain but the part of the price which is formed due to the novelty of the products will decrease more and more. Farmers are not associated, do not have the necessary experience to decrease costs, there are leaks especially in the first years of activity and transport costs are high as the quantities transported are small. Some farmers prefer to use unreasonably high prices, leading to erosion of a part from image leverage of organic farming, especially considering that these unreasonably high prices are linked to a lack of consumer education campaigns. The situation changes dramatically in developed markets, where farmers have growing experience which transposes into lower production and distribution costs, and consequently, PAE prices will be lower. Also, on emerging markets, price fluctuations are large from one manufacturer to another. There is a big difference between producers price and the price consumers pay (the difference is up to three to four times), being big problems regarding distribution of such products (Tsakiridou, et al., 2008). Regarding processed food products, their prices are big on undeveloped markets as demand for raw materials is very low and there are very few processors on the

12 Atanasoaie, G. market, which leads farmers to export raw materials at prices less favorable and finished goods return to the country at great prices. On less developed markets, potential customers are available to pay in addition towards a food product obtained in conventional manner a sum much lower than for consumers in developed markets, fact which can be explained by differences in income, awareness and availability of products (Radman, 2005). If supply increases faster than demand by entering into the converting program of many farmers or by significant increase in production achieved by farmers who have completed the conversion period, the price differences between organic and conventional will decrease and sector profitability will lessen . Organic milk price has dropped so much in Denmark that almost reached the level of price of milk produced in conventional manner. One way to offset the prices decline of these products is the creation of some brands that are associated with moral values. It requires substantial investments to create organic brands, but this problem can be resolved if farmers associate and appeal to marketing specialists. The reasons why farmers have adopted organic farming have an impact on prices. There is a wide range of motivations for entering into the conversion program towards organic farming: organic, ethical, financial, political and personal motivations. Farmers for which prevail financial motivations tend to set prices much higher than the costs, than farmers for which prevail altruistic motivations and who set prices justified by costs (Morven, et al., 2004). For a period these unjustified prices have their place in market, but as the market matures and loses it niche status will need to be restored at lower levels, but still higher than the prices in supermarkets. 6. PRICES, CERTIFICATION AND ECO-LABELING SYSTEMS Certification costs are also an important factor in determining PAE market prices. There are many farmers who would like to enter into the period of conversion towards organic farming but do not have the resources to pay the costs of certification, if there will be problems on production marketing during conversion period. Alternatively, for prices reduction, some farmers prefer to produce PAE without certification, being a sense of trust between farmers and consumers (Lua, et al., 2004). Association of farmers in cooperatives leads to decrease of certification costs and the increase of farmers' profits (Morales Galindo, 2007). Although the usefulness of certification as an organic producer cannot be questioned, both consumers and producers and distributors have hesitations regarding assumption of a part or all of the costs of certification. Each party would like others to give up some of their profits in order to support a larger share of the certification costs. Moreover, government involvement in subsidizing all or part of the certification costs would lead to lower prices, but it takes lobby from the actors of this sector, but it involves primarily them to be organized. Because the organic brand makes a clear distinction between an organic product quality and quality of a product obtained in conventional manner, it is possible to obtain better prices for PAE. Lack of confidence in the marking system lowers

Price on the Organic Food Market 13 consumers’ willingness to pay in addition to these products. There is skepticism about the veracity of the organic nature of these products, suspicions which are partly determined by cases of incorrect labeling or differences of organic certification systems (Bonti-Ankomah & Yiridoe, 2006). Hence results again an obvious need to conduct effective communication campaigns, so that consumers develop trust in these products. The labeling system is very important, especially in case of processed organic products in order to increase consumers' willingness to pay a higher price for these products. In the European Union under Regulation 834/2007 is allowed to use Eco-label for processed products that have at least 95% organic ingredients and contamination limit with ingredients from genetically modified products has been raised from 0.1% to 0.9%. There are labeling and certification systems more restrictive, such as the Demeter system, which was formed by the association of organic farmers AGÖL (Arbeitsgemeinschaft ökologischer Landbau) in 1988 and is now widespread in many countries. Price differences will decrease as consumers will be more informed about the specifics of organic food products and therefore the traders’ expenses to inform consumers will decrease (La Via & Antonio Nucifora, 2002). 7. CONCLUSIONS Price remains an important barrier to market development, but its importance can be reduced by effective information campaigns so that consumers understand why they have to pay a higher price. There are consumers segments for which information campaigns focused on ethical consumption will be very effective, but also segments prevailing purchase selfish reasons, pragmatic and which are less sensitive to such information and who will prefer conventional or organic foods with low prices acquired mainly in supermarkets. It is very important for a good development of the market to satisfy the requirements of all consumers’ categories, being production and distribution solutions that will bring PAE at desired locations and at the prices desired by consumers. Not all categories of consumers are very sensitive to these products prices, but if it is desired so that lower income consumers can purchase these products, it is desirable for prices to fall. Low prices in supermarkets do not enter in opposition to the higher prices charged by direct distribution channels as these channels are intended for different categories of consumers who have very different buying habits and consumption. It puts more emphasis on problem that in the conventional food costs to be reflected also the environmental costs, which make organic food prices, become more competitive. PAE prices levels should be at balanced levels, the extremes are not desirable because very low prices would not be incentive to farmers, and high prices would lead to discredit the organic farming. It is also desirable to use temporary price reduction to attract consumers, but those cuts must be on short terms in order to do not affect the brand image.

14 Atanasoaie, G. Considering the economic context also - financially very difficult through which are going most countries, the PAE price is a concept that acquires meanings more important regarding formulation of some marketing strategies aimed at developing markets. Importance of price as barrier falls increasingly as consumers perceive the value of PAE. For an overcoming of niche market status is needed implementation of effective communication policies, so that consumers become more informed about these products and to give less importance to price compared to product quality, health and environment. A strong development of the market of these products can only be made only in terms of production technology improvement and marketing policies optimization. REFERENCES: [1]. Aertsens, J., Verbeke, W., Mondelaers, K., van Huylenbroeck, G. (2009) Personal
determinants of organic food consumption: a review, British Food Journal, Vol. 111 (10), pp.1140 – 1167
[2]. Batte, M.T., Hooker, N.H., Haab, T.C., Beaverson, J. (2007), Putting their money where their mouths are: consumer willingness to pay for multi-ingredient, processed organic food products, Food Policy, 32(2), pp. 145-59
[3]. Bonti-Ankomah, S.; Yiridoe, E.K. (2006) Organic and Conventional Food: A Literature Review of the Economics of Consumer Perceptions and Preferences, Final report, Organic Agriculture Centre of Canada, Truro
[4]. Briz, T., Ward, R.W. (2009) Consumer awareness of organic products in Spain: an application of multinomial logit models, Food Policy, Vol. 34 (3), pp. 295–304
[5]. Brown, E.; Dury, S.; Holdsworth, M. (2009 ) Motivations of Consumers That Use Local, Organic Fruit and Vegetable Box Schemes in Central England and Southern France, Appetite, 53(2), pp. 183-188
[6]. Burja, C., Burja, V. (2008) The Analysis of the Green Produce Consumer’s Behaviour in Romania, Annals of the University of Petrosani – Economics, 8(1), pp. 33 - 40
[7]. Davies, A., Titterington, A., & Cochrane, C. (1995) Who buys organic food: A profile of the purchases of organic food in Northern Ireland, British Food Journal, 97(10), pp. 17 – 23
[8]. Desmond A., J. (1991) Determinants of Organic Horticultural Products Consumption Based on a Sample of California Consumers, Horticultural Economics and Marketing, 295, pp. 141-148
[9]. González, J., A., A. (2009) Market trends and consumer profile at the organic farmers market in Costa Rica, British Food Journal, Vol. 111(5), pp.498 – 510
[10]. Gracia, A.; Sanchez, M. (2000) Market segmentation and willingness to pay for organic products in Spain, International Food and Agribusiness Management Review, 3, pp. 207-226
[11]. Griffith, R., Nesheim, L. (2008) Household willingness to pay for organic products, CeMMAP working papers CWP18/08, Centre for Microdata Methods and Prac tice, Institute for Fiscal Studies
[12]. Hamzaoui Essoussi, L., Zahaf, M. (2008) Decision making process of community organic food consumers: an exploratory study, Journal of Consumer Marketing, 25(2), pp. 95 - 104

Price on the Organic Food Market 15 [13]. Hellberg-Bahr, A., Pfeuffer, M., Spiller, A., Brümmer, B. (2011) Using Price
Rigidities to Explain Pricing Strategies in the Organic Milk Chain in International European Forum on Innovation and System Dynamics in Food Networks, February, 14-18, 2011, Innsbruck-Igls, Austria
[14]. Katundu, M., Hendriks, S., Bower, J., Siwela, M. (2010) Can sequential harvesting help small holder organic farmers meet consumer expectations for organic potatoes?, Food Quality and Preference, 21(4), pp. 379-384
[15]. Krystallis, A., Chryssohoidis, G. (2005) Consumer’s willingness to pay for organic food: factors that affect it and variation per organic product type, British Food Journal, 107(4), pp. 320-343
[16]. Lockie, S., Lyons, K., Lawrence, G., Grice, J. (2004) Choosing organics: a path analysis of factors underlying the selection of organic food among Australian consumers, Appetite, 43(2), pp. 135-146
[17]. Lua, C., D., Gangyi, X., Kawas, J., R. (2010) Organic goat production, processing and marketing: Opportunities, challenges and outlook, Small Ruminant Research, 89 (2-3), pp. 102-109
[18]. McEachern, M.G., Willock, J. (2004) Producers and consumers of organic meat: a focus on attitudes and motivations, British Food Journal, Vol. 106(7), pp. 534-52
[19]. Megan M., D. (2008) The Impact of the Organic Mainstream Movement: A Case Study of New England Organic Produce Prices, Masters Theses, [Accesed at http://scholarworks.umass.edu/cgi/viewcontent.cgi?article=1142&context=theses]
[20]. Millock, K., Hansen, L. G. (2002) Willingness to Pay for Organic Foods: A Comparison between Survey Data and Panel Data from Denmark, in European Association of Environmental and Resource Economists Conference, June, 2002, Monterey, USA, [Unpublished]
[21]. Mondelaers, K., Verbeke, W., van Huylenbroeck, G. (2009) Importance of health and environment as quality traits in the buying decision of organic products , British Food Journal, Vol. 111(10), pp.1120 – 1139
[22]. Morales Galindo, I. (2007) Regional development through knowledge creation in organic agriculture, Journal of Knowledge Management, 11(5) , pp.87 - 97
[23]. Pellegrini, G., Farinello, F. (2009) Organic consumers and new lifestyles: An Italian country survey on consumption patterns, British Food Journal, 111( 9), pp.948 – 974
[24]. Post, A., Shanahan, H., Jonsson, l. (2008) Food processing: barriers to, or opportunities for, organic foods in the catering sector?, British Food Journal, 110( 2), pp.160 – 173
[25]. Radman, M. (2005) Consumer consumption and perception of organic products in Croatia, British Food Journal, Vol. 107(4-5), pp. 263-273
[26]. Richter, T., Hempfling, G. (2002) The supermarket study 2002 – Organic products in European Supermarkets, FiBl, [Online], Available at: https://www.fibl.org/en/shop-en/article/c/market/p/1285-supermarket.html, [Accesed at 20 May 2012]
[27]. Seyfang, G. (2007) Growing sustainable consumption communities: The case of local organic food networks, International Journal of Sociology and Social Policy, Vol. 27(3/4), pp.120 – 134
[28]. Siderer, Y., Maquet, A., Anklam, E. (2005) Need for research to support consumer confidence in the growing organic food market, Trends in Food Science & Technology, Volume 16(8), pp. 332-343
[29]. Tsakiridou, E.; Boutsouki, C.; Zotos, Y.; Mattas, K. (2008) Attitudes and behaviour towards organic products: an exploratory study, International Journal of Retail & Distribution Management, 36 (2), pp.158 – 175

16 Atanasoaie, G. [30]. La Via, G.; Nucifora, A. (2002) The determinants of the price mark-up for organic fruit
and vegetable products in the European Union, British Food Journal, 104(3), pp.319 – 336
[31]. Wier, M., Calverley, C. (2002) Market potential for organic foods in Europe, British Food Journal, Vol. 104(1), pp. 45-62
[32]. Zander, K., Hamm, U. (2010) Consumer preferences for additional ethical attributes of organic food, Food Quality and Preference, 21(5), pp. 495-503

Annals of the University of Petroşani, Economics, 12(4), 2012, 17-32 17
THE ACCURACY AND BIAS EVALUATION OF THE USA UNEMPLOYMENT RATE FORECASTS. METHODS
TO IMPROVE THE FORECASTS ACCURACY
MIHAELA BRATU (SIMIONESCU) *
ABSTRACT. In this study some alternative forecasts for the unemployment rate of USA made by four institutions (International Monetary Fund (IMF), Organization for Economic Co-operation and Development (OECD), Congressional Budget Office (CBO) and Blue Chips (BC)) are evaluated regarding the accuracy and the biasness. The most accurate predictions on the forecasting horizon 201-2011 were provided by IMF, followed by OECD, CBO and BC.. These results were gotten using U1 Theil’s statistic and a new method that has not been used before in literature in this context. The multi-criteria ranking was applied to make a hierarchy of the institutions regarding the accuracy and five important accuracy measures were taken into account at the same time: mean errors, mean squared error, root mean squared error, U1 and U2 statistics of Theil. The IMF, OECD and CBO predictions are unbiased. The combined forecasts of institutions’ predictions are a suitable strategy to improve the forecasts accuracy of IMF and OECD forecasts when all combination schemes are used, but INV one is the best. The filtered and smoothed original predictions based on Hodrick-Prescott filter, respectively Holt-Winters technique are a good strategy of improving only the BC expectations. The proposed strategies to improve the accuracy do not solve the problem of biasness. The assessment and improvement of forecasts accuracy have an important contribution in growing the quality of decisional process.
KEY WORDS: forecasts; accuracy; multi-criteria ranking; combined forecasts; Hodrick-Prescott filter; Holt-Winters smoothing exponential technique.
JEL CLASSIFICATION: E21, E27,C51, C53 1. INTRODUCTION
The evaluation of forecasts accuracy is necessary for establishing the
decisional process. When more institutions in a country provide forecasts for the same * Department of Statistics and Econometrics, Faculty of Cybernetics, Statistics and Economic Informatics, Academy of Economic Studies, Bucharest, Romania, [email protected]

18 Bratu (Simionescu), M. macroeconomic variable, the deciders have to choose the one with the highest accuracy. The term of “accuracy” is put in correlation with the errors that affect the forecasting process, because only by hazard the predicted value of an indicator is exactly equal with its real value.
The original contribution of this research is related to the proposal of a new method of assessing the forecasts accuracy, taking into account more accuracy measures at the same time. The multi-criteria ranking let us make a classification of the institution according to more accuracy indicators.
On the other hand, the literature reports the necessity of improving the forecasts accuracy. We proposed as strategy of getting better predictions than the original ones the combined forecasts and the filtered and smoothed predictions and we made comparisons with the original predictions to measure the degree of improvement.
2. LITERATURE
The forecasts accuracy evaluation is one of the current concerns of many
researchers. One purpose of this assessment is related to the need of improving the predictions. The current economic and financial crisis emphasized the struggles of uncertainty reduction. The forecasts accuracy is a very large domain of research, an exhaustive presentation of it being impossible. But, some of the recent results will be described.
To assess the forecast accuracy, as well as their ordering, statisticians have developed several measures of accuracy. For comparisons between the MSE indicators of forecasts, Granger and Newbold proposed a statistic. Another statistic is presented by Diebold and Mariano (1995) for comparison of other quantitative measures of errors. Diebold and Mariano test proposed in 1995 a test to compare the accuracy of two forecasts under the null hypothesis that assumes no differences in accuracy. The test proposed by them was later improved by Ashley and Harvey, who developed a new statistic based on a bootstrap inference. Subsequently, Diebold and Christoffersen have developed a new way of measuring the accuracy while preserving the co-integration relation between variables.
Meese and Rogoff's paper, " Empirical exchange rate models of the seventies”, remains the starting point for many researches on the comparing of accuracy and bias. Recent studies target accuracy analysis using as comparison criterion different models used in making predictions or the analysis of forecasted values for the same macroeconomic indicators registered in several countries.
Allan (2012) obtained a good accuracy for the OECD forecasts combined with outturn values of GDP growth for G7 countries between 1984 and 2010. The same author mentioned two groups of accuracy techniques used in assessing the predictions: quantitative forecasts accuracy statistics and qualitative accuracy methods.
Deschamps and Bianchi (2012) concluded that there are large differences between macroeconomic forecasts for China regarding the accuracy measures for consumption and investment, GDP and inflation. The slow adjustment to structural shocks generated biased predictions, the information being utilized relatively inefficient.

The Accuracy and Bias Evaluation of the USA Unemployment Rate … 19
Dovern and Weisser (2011) used a broad set of individual forecasts to analyze four macroeconomic variables in G7 countries. Analyzing accuracy, bias and forecasts efficiency, resulted large discrepancies between countries and also in the same country for different variables.
Most international institutions provide their own macroeconomic forecasts. It is interesting that many researchers compare the predictions of those institutions (Melander for European Commission, Vogel for OECD, Timmermann for IMF) with registered values and those of other international organizations, but it is omitted the comparison with official predictions of government.
Abreu (2011) evaluated the performance of macroeconomic forecasts made by IMF, European Commission and OECD and two private institutions (Consensus Economics and The Economist). The author analized the directional accuracy and the ability of predicting an eventual economic crisis.
In Netherlands, experts made predictions starting from the macroeconomic model used by the Netherlands Bureau for Economic Policy Analysis (CPB). For the period 1997-2008 was reconstructed the model of the experts macroeconomic variables evolution and it was compared with the base model. The conclusions of Franses, Kranendonk and Lanser (2011) were that the CPB model forecasts are in general biased and with a higher degree of accuracy.
Reeve and Vigfusson (2011) compared the performance of forecasts based on futures, choosing as a reference model a random walk and a random walk with drift.
Kurita (2010) showed that an ARFIMA model forecasts for Japan’s unemployment rate outperformed the AR(1) model predictions in what concerns the performance.
Shittu and Yaya (2009) evaluated the performance of forecasts based on ARIMA and ARFIMA models for the exchange rate of England and USA. The authors recommended the ARFIMA models as a better tool of predicting the exchange rate in both countries.
Edge, Kiley and Laforte (2009) evaluated the performance of forecasts made by Federal Reserve staff and of those based by a time-series model and a DSGE model.
Gorr (2009) showed that the univariate method of prediction is suitable for normal conditions of forecasting while using conventional measures for accuracy, but multivariate models are recommended for predicting exceptional conditions when ROC curve is used to measure accuracy.
Lam, Fung and Yu (2008) compared the predictions performance for the exchange rate when different forecasting methods are used: sticky price monetary model, uncovered interest rate parity model, Bayesian model and purchasing power parity model. The authors made also combined forecasts based on the mentioned models. The result was that combined predictions outperformed the ones based on a single model.
Ruth (2008), using the empirical studies, obtained forecasts with a higher degree of accuracy for European macroeconomic variables by combining specific sub-groups predictions in comparison with forecasts based on a single model for the whole Union.

20 Bratu (Simionescu), M.
Heilemann and Stekler (2007) explain why macroeconomic forecast accuracy in the last 50 years in G7 has not improved. The first explanation refers to the critic brought to macro-econometrics models and to forecasting models, and the second one is related to the unrealistic expectations of forecast accuracy. Problems related to the forecasts bias, data quality, the forecast process, predicted indicators, the relationship between forecast accuracy and forecast horizon are analyzed.
3. COMPARISONS BETWEEN UNEMPLOYMENT RATE FORECASTS MADE BY DIFFERENT INSTITUTIONS
3.1. The evaluation of forecasts accuracy
In this study we used the forecasted values of the annual registered
unemployment rate made for USA by International Monetary Fund (IMF), Organization for Economic Co-operation and Development (OECD), Congressional Budget Office (CBO) and Blue Chips (BC) on the forecasting horizon 2001-2011. The objective is to assess the accuracy and the bias of these predictions and determine the best institution with the highest accuracy.
Armstrong and Fildes (1995) showed that it is not sufficient to use a single measure of accuracy. Therefore, more accuracy indicators were computed for the three types of forecasts on the specified horizon.
To make comparisons between forecasts we propose to determine the hierarchy of institutions according to the accuracy of their forecasts using multi-criteria ranking.
Two methods of multi-criteria ranking (ranks method and the method of relative distance with respect to the maximal performance) are used in order to select the institution that provided the best forecasts on the horizon 2001-2011 taking into account at the same time all computed measures of accuracy.
If we consider )(kX t
the predicted value after k periods from the origin time
t, then the error at future time (t+k) is: )( ktet . This is the difference between the registered value and the predicted one.
The indicators for evaluating the forecasts accuracy that will be taken into consideration when the multi-criteria ranking is used are:
Root Mean Squared Error (RMSE)
Equation 1 Formula for mean error
n
jX kjTe
nRMSE
10
2 ),(1
Mean error (ME)
Equation 2 Formula for mean absolute error ),(1
01
kjTen
MEn
jX

The Accuracy and Bias Evaluation of the USA Unemployment Rate … 21
The sign of indicator value provides important information: if it has a positive value, then the current value of the variable was underestimated, which means expected average values too small. A negative value of the indicator shows expected values too high on average.
Mean absolute error (MAE)
Equation 3 Formula for root mean squared error ),(1
01
kjTen
MAEn
jX
These measures of accuracy have some disadvantages. For example, RMSE is affected by outliers. Armstrong and Collopy stresses that these measures are not independent of the unit of measurement, unless if they are expressed as percentage. If we have two forecasts with the same mean absolute error, RMSE penalizes the one with the biggest errors.
A common practice is to compare the forecast errors with those based on a random-walk. “Naïve model” method assumes that the variable value in the next period is equal to the one recorded at actual moment. Theil proposed the calculation of U statistic that takes into account both changes in the negative and the positive sense of an indicator:
U Theil’s statistic can be computed in two variants, specified also by the Australian Tresorery.
The following notations are used: a- the registered results p- the predicted results t- reference time e- the error (e=a-p) n- number of time periods
Equation 4 Formula for U1
n
ttt
n
t
n
ttt
pa
pa
U
1
22
1
1
2
1
)(
A value close to zero for 1U implies a higher accuracy.
Equation 5 Formula for U2
1
1
21
1
1
211
2
)(
)(
n
t t
tt
n
t t
tt
a
aa
a
ap
U
If 2U =1=> there are not differences in terms of accuracy between the two forecasts to compare
If 2U <1=> the forecast to compare has a higher degree of accuracy than the naive one

22 Bratu (Simionescu), M.
If 2U >1=> the forecast to compare has a lower degree of accuracy than the naive one
Table 1. The accuracy of forecasts made by IMF, OECD, CBO and BC for the
unemployment rate in USA (2001-2011)
INSTITUTION ACCURACY MEASURE IMF OECD CBO BC
ME 0.0262 0.4664 1.0455 1.4818 MAE 0.0520 0.4973 1.3545 1.5909 RMSE 0.1120 0.8430 2.1564 2.3524 U1 0.0085 0.0654 0.1806 0.2047 U2 0.0551 0.6560 0.6560 1.4405
Source: own computations using Excel According to all accuracy indicators for forecasts made on the horizon 2001-
2011, the IMF provided the most accurate predictions for the unemployment rate. This institution is followed by OECD, CBO and BC. All the forecasts, excepting BC ones, outperformed the naïve predictions based on the random walk. The positive values of the mean error imply too low in average predicted values for all institutions. The less accurate forecasts are made by Blue Chips.
Ranks method application supposes several steps: 1. Ranks are assigned to each value of an accuracy indicator (the value that indicates the best accuracy receives the rank 1); The statistical units are the four institutions that made forecasts. The rank for each institution is denoted by: ), i=1,2,3,4 and
accuracy indicator j. We chose 5 indicators: mean error, mean absolute error,
root mean squared error, U1 and U2. 2. If the ranks assigned to each institution are sum up, the score to each of them is computed. Equation 6 Formula for the sum of ranks , i=1,2,3,4
3. The institution with the lowest score has the highest performance and it will get the final rank 1.
Table 2. The ranks of institutions according to the accuracy measures (ranks method)
INSTITUTION
ACCURACY MEASURE IMF OECD CBO BC
ME 1 2 3 44 MAE 1 2 3 44 RMSE 1 2 3 44 U1 1 2 3 44 U2 1 2 3 44 Sum of ranks 5 10 15 220 Final ranks 1 2 3 44
Source: own computations using Excel

The Accuracy and Bias Evaluation of the USA Unemployment Rate … 23
The results of the ranks method are the same as those provided by all accuracy measures, especially U1 used in making comparisons between forecasts. Actually, if all the calculated accuracy indicators are taken into account at the same time, the following hierarchy was gotten: IMF, OECD, CBO and BC.
The method of relative distance with respect to the maximal performance is the second way of ranking.
For each accuracy indicator the distance of each statistical unit (institution) with respect to the one with the best performance is computed. The distance is calculated as a relative indicator of coordination:
Equation 7 Formula for the relative distance , i=1,2,3,4
and j=1,2,..,5 The relative distance computed for each institution is a ratio, where the
denominator is the best value for the accuracy indicator for all institutions. The geometric mean for the distances of each institution is calculated, its
significance being the average relative distance for institution i.
Equation 8 Formula for the average relative distance = , i=1,2,3,4
According to the values of average relative distances, the final ranks are assigned. The institution with the lowest average relative distance will take the rank 1. The position (location) of each institution with respect to the one with the best performance is computed as: its average relative distance over the lowest average relative distance. Equation 9 Formula for the position of each statistical unit in the hierarchy
Table 3. The ranks of institutions according to the accuracy measures (method of relative
distance with respect to the best institution)
ACCURACY MEASURE IMF OECD CBO BC ME 1 17.8125 39.9306 56.5972 MAE 1 9.5629 26.0490 30.5944 RMSE 1 7.5258 19.2519 21.0016 U1 1 7.7071 21.2832 24.1205 U2 1 11.9057 11.9057 26.1427 Average relative distance 1 10.3301 21.9317 29.6541 Ranks 1 2 3 4 Location (%) 100 10.3301 21.9317 29.6541
Source: own computations using Excel The method of relative distance with respect to the best institution gave the
same results as the previous methods. The lowest average relative distance was registered by IMF (the value 1).

24 Bratu (Simionescu), M.
The Diebold-Mariano test (DM test) is utilized to check if two forecasts have the same accuracy. The following steps are applied: The difference between the squared errors of forecasts ( ) to compare and the
squared errors of reference forecasts ( ):
The following model is estimated:
We test if “a” differs from zero, where the null hypothesis is that a=0 (equal forecasts). A p-value less than 0.05 implies the rejection of the null hypothesis for a probability of 95% in guaranteeing the results.
The following variables are computed: d1, d2, d3, d4, d5 and d6 to make comparisons between all institutions predictions. The p-values are less than 0.05 for d1 and d6, fact that shows there are significant differences in accuracy between IMF and OECD predictions and CBO and BC predictions. The regression models are estimated in EViews and the results are presented in Appendix 1. The results are in accordance with the computed accuracy measures, IMF forecasts being more accurate than OECD ones, while CBO predictions outperform BC ones. 3.2. The forecasts bias
Corder (2003) shows that McNees (1978, 1987) and Fair and Schiller (1989)
brought among the first contributions in the field of bias and efficiency of the individual forecasts made by consensus. Figlewski and Wachtel noted that early results showed that the projections of private sector are biased and uncorrelated with the rational expectations hypothesis. Batchelor R. (2007) detected the presence of systematic bias in the forecast of real GDP and inflation made by the private sector in the G7 countries during 1990-2005. The measuring and test of bias was based on regression models and nonparametric tests of accuracy of the ranks. Empirical researches have shown a conclusion already presented in the literature, namely, the discrepancy between rational expectations tests and the too pessimistic or too optimistic forecasts.
Bias in this context implies a zero mean forecast error series. In the literature rationality tests are used to check if the forecasts are optimal in relation to a certain criterion, if they are biased or ensure a good informational efficiency. The standard test of forecast bias-test-Mincer-Zarnowitz starts from this model: ttt ePbaA . tA
-Current values, tP – predicted values
Holden and Peel proposed a modified version of the test, which is based on forecast errors by testing whether their mean (m) is zero: ttt emPA .
Accuracy can be improved if it is known that there is autocorrelation between errors and other data available at the time the forecast is made. The correlation indicates an inefficient use of information from the past. If iX are the observed variables that
influence the forecast, then:
i kj
tijiY ejtXkkte )(),( , .

The Accuracy and Bias Evaluation of the USA Unemployment Rate … 25
If jiand , are significantly different from zero, the forecasts can be
improved if one takes into account the influence of iX variables. However, Jeong and
Maddie have demonstrated that tests of rationality are dependent on assumptions made for regression models. Pain shows that while the data series is non-stationary with unit roots, co-integration tests should be used. In the case of asymmetric loss functions the forecasts are rational, even if the errors mean is zero. The unbiasedness of the forecasts is tested applying a simple t-test for the
following regression: We have to test if the parameter “a” differs or not significantly from zero. A p-value or Prob. less than 0.05 for t test implies the existence of biasedness
for those forecasts. The values of Prob. computed in EViews show that IMF, OECD and CBO predictions are unbiased, only the CB forecasts being biased.. The errors for each institution are denoted by e1, e2, e3 and e4 and the tests results are presented in Appendix 2. 4. STRATEGIES TO IMPROVE THE ACCURACY OF UNEMPLOYMENT RATE PREDICTIONS
Bratu (2012) utilized some strategies to improve the forecasts accuracy
(combined predictions, regressions models, historical errors method, application of filters and exponential smoothing techniques).
The combined forecasts are another possible strategy of getting more accurate predictions. The most utilized combination approaches are:
optimal combination (OPT); equal-weights-scheme (EW); inverse MSE weighting scheme (INV). Bates and Granger (1969) started from two forecasts f1;t and f2;t, for the same
variable Xt, derived h periods ago. If the forecasts are unbiased, the error is calculated as:
tif
tiX
tie
,,, . The errors follow a normal distribution of parameters 0 and
2i . If is the correlation between the errors, then their covariance is
2112 . The linear combination of the two predictions is a weighted
average:t
fmt
fmt
c2
)1(1
.The error of the combined forecast
is: temtemtce 2)1(1, .The mean of the combined forecast is zero and the
variance is: 12)1(22
22)1(2
122 mmtmmc
. By minimizing the error
variance, the optimal value for m is determined ( optm ):
Equation 11 Formula for the optimal value of m
12222
21
1222
optm

26 Bratu (Simionescu), M.
The individual forecasts are inversely weighted to their relative mean squared forecast error (MSE) resulting INV. In this case, the inverse weight ( invm ) is:
Equation 12 Formula for the inverse weight 22
21
22
invm
Equally weighted combined predictions (EW) are gotten when the same weights are given to all models.
The U Theil’s statistics were computed for the combined forecasts based on the three schemes, the results being shown in the following table (Table 4):
Table 4. The accuracy of combined forecasts for USA unemployment rate (2001-2011)
Accuracy indicator
IMF+OECD forecasts
IMF+CBO forecasts
IMF+BC forecasts
OECD+CBO forecasts
OECD+BC forecasts
CBO+BC forecasts
U1 (optimal scheme)
0.0523 0.1734 0.2073 0.1712 0.2058 0.2066
U2 (optimal scheme)
0.0551 0.6560 0.6560 1.4405 0.0551 0.6560
U1 (inverse MSE scheme)
0.0269 0.1738 0.2042 0.1758 0.2044 0.2030
U2 (inverse MSE scheme)
0.0534 0.6566 0.6567 1.4667 0.0556 0.6546
U1 (equally weighted scheme)
0.0459 0.1772 0.2044 0.1782 0.2045 0.2038
U2 (equally weighted scheme)
0.0534 0.6546 0.6545 1.4478 0.0544 0.6577
Source: Author’s computations using Excel 0.0085 0.0654 0.1806 0.2047 0.0551 0.6560 0.6560 1.4405 All the combined predictions are better than the naïve ones, excepting those of
OECD and CBO. We got improvements in accuracy by combining the OECD expectations with IMF ones, the highest improvement being brought by INV scheme. The biasedness of those forecasts was tested and these combined predictions based on all schemes are biased. If we take into account that accuracy is more important, these forecasts are better than the original ones.
We test the biasedness of the combined forecasts based on CB predictions. These combined predictions are biased. So, the combined predictions introduce bias to the original forecasts.
Another technique of improving the forecasts accuracy used by Bratu (Simionescu) (2013) is the application of filters to the predicted data. The author recommends also the use of exponential smoothing methods like Holts Winters.
Hodrick-Prescott filter and Holt-Winters exponential technique were applied to the original predictions and the accuracy of new forecasts was evaluated. Holt-Winters

The Accuracy and Bias Evaluation of the USA Unemployment Rate … 27 Simple exponential smoothing method is recommended for data series with linear trend and without seasonal variations. The Hodrick–Prescott (HP) filter is very used in macroeconomics to extract the trend of the data series and separate the cyclical component of the time series. The smoothed data gotten are more sensitive to long term changes. Table 5. The accuracy of filtered and smoothed forecasts of USA for unemployment rate
(2001-2011)
Accuracy measure
Filtered IMF forecasts
Smoothed IMF forecasts
Filtered OECD forecasts
Smoothed OECD forecasts
Filtered CBO forecasts
Smoothed CBO forecasts
Filtered BC forecasts
Smoothed BC forecasts
U1 0.0886 0.0952 0.1001 0.1101 0.1837 0.1784 0.2045 0.2031 Source: Author’s computations using Excel
The filtered and smoothed predictions using HP filter, respectively Holt-
Winters technique are a good strategy only to improve the CB forecasts. For the other forecasts we got an increase of the degree of accuracy. The IMF, OECD and CBO forecasts are still unbiased and the BC ones are biased.
5. CONCLUSIONS
In addition to economic analysis, the elaboration of forecasts is an essential
aspect that conducts the way of developing the activity al macroeconomic level. But any forecast must be accompanied by macroeconomic explanations of its accuracy. The purpose of this evaluation is related to different aspects: the improvement of the model on which the forecast was based, adjustment of government policies, the planning of results. Basically, performance evaluation in this context refers directly to the degree of trust conferred to the prediction. Although the literature on forecasting methods and techniques used in describing the evolution of an economic phenomenon is particularly rich, surprisingly, few researchers have dealt with the methods used to improve the measurement of forecast uncertainty. The aspect is important, because the macroeconomic predictions must not be easily accepted, taking into account the negative consequences of macroeconomic forecasts failures, consequences that affect the state policies. The decisions of economic policy are based on these forecasts. Hence, there is an evident interest of improving their accuracy and biasedness.
In our study, we assessed the unemployment forecasts accuracy and bias for the predictions provided during 2001-2011 by four institutions: International Monetary Fund (IMF), Organization for Economic Co-operation and Development (OECD), Congressional Budget Office (CBO) and Blue Chips (BC). The best accuracy is provided by IMF, followed by OECD, CBO and BC. This hierarchy resulted from the application of the multi-criteria ranking, but also from the measurement of accuracy indicators, as U1, used in making comparisons between forecasts.
The combined forecasts using the three classical schemes are a good strategy of improving the accuracy for the combined forecasts of IMF and OECD. The combined forecasts are in all cases biased, but those of IMF, OECD and CBO are

28 Bratu (Simionescu), M. unbiased. Filtered forecasts based on HP filter or smoothed ones based on Holt-Winters technique succeeded in improving only the BC forecasts.
The forecasts accuracy should be a priority for the public that uses these predictions in underlying the decisional process. The combined forecasts and in some cases the filtered and smoothed predictions are a very good strategy of getting improvements in accuracy for some unemployment rate predictions.
REFERENCES: [1]. Abreu, I. (2011) International organisations’ vs. private analysts’ forecasts: an
Evaluation, Banco de Portugal, article available at: http://www.bportugal.pt/en-US/BdP%20Publications%20Research/wp201120.pdf
[2]. Allan, G. (2012) Evaluating the usefulness of forecasts of relative growth, Strathclyde, Discussion Papers in Economics, No. 12-14
[3]. Armstrong, J.S.; Fildes, R. (1995) On the selection of Error Measures for Comparisons Among Forecasting Methods, Journal of Forecasting, 14, p. 67-71
[4]. Bates, J.; Granger, C.W.J. (1969) The Combination of Forecasts, Operations Research Quarterly, 20(4), 451-468
[5]. Bratu, M. (2012) Strategies to Improve the Accuracy of Macroeconomic Forecasts in USA”, LAP LAMBERT Academic Publishing, ISBN-10: 3848403196, ISBN-13: 978-3848403196
[6]. Corder, J.K. (2003) Managing Uncertainty. The Bias and Efficiency of Federal Macroeconomic Forecasts, Department of Political Science, Western Michigan Universit, the 7th National Public Management Conference.Georgetown University. Washington DC, Octombrie
[7]. Deschamps, B.; Bianchi, P. (2012) An evaluation of Chinese macroeconomic forecasts, Journal of Chinese Economics and Business Studies, Volume 10, Number 3, 1 August 2012 , pp. 229-246(18)
[8]. Dovern, J.; Weisser, J. (2011) Accuracy, unbiasedness and efficiency of professional macroeconomic forecasts: An empirical comparison for the G7, International Journal of Forecasting, 27 (2), p. 452-465
[9]. Edge, R.M.; Kiley, M.T.; Laforte, J.P. (2009) A comparison of forecast performance between Federal Reserve Staff Forecasts simple reduced-form models and a DSGE model, Finance and Economics Discussion Series, article available at: http://www.federalreserve.gov/pubs/feds/2009/200910/200910pap.pdf
[10]. Fair, R.; Shiller, R.J. (1989) The Informational Content of Ex Ante Forecasts,The Review of Economics and Statistics, no. 71, pp. 325-331
[11]. Fildes, R.; Steckler, H. (2000) The State of Macroeconomic Forecasting. Lancaster University EC3/99, George Washington University, Center for Economic Research, Discussion Paper No. 99-04
[12]. Franses, P.H.; McAleer, M.; Legerstee, R. (2012) Evaluating Macroeconomic Forecasts: A Concise Review of Some Recent Developments, Working paper/ Department of Economics and Finance, University of Cantenbury
[13]. Gorr, W. L. (2009) Forecast accuracy measures for exception reporting using receiver operating characteristic curves, International Journal of Forecasting, Volum 25, Issue 1, ianuarie-martie 2009, pp. 48-61
[14]. Heilemann, U.; Stekler, H. (2007) Introduction to “The future of macroeconomic forecasting”, International Journal of Forecasting, 23(2), pp.159-165

The Accuracy and Bias Evaluation of the USA Unemployment Rate … 29 [15]. Lam, L.; Fung, L.; Yu, I. (2008) Comparing forecast performance of exchange rate
models, Hong Kong Monetary Authority, Working Paper 08 [16]. Kurita, T. (2010) A forecasting model for Japan’s unemployment rate, Eurasian Journal
of Business and Economics, No. 3(5), pp. 127-134 [17]. McNees, S. (1987) Consensus Forecasts: Tyranny of the Majority, New England
Economic Review. (November/December 1987), pp. 15-21 [18]. Reeve, T.A.; Vigfusson, R.J. (2011) Evaluating the forecasting performance of
commodity future prices, Board of Governors System, International Finance Discussion Papers, No. 1025
[19]. Ruth, K. (2008) Macroeconomic forecasting in the EMU: Does disaggregate modeling improve forecast accuracy ?, Journal of Policy Modeling, Volum 30, Issue 3, mai-iunie 2008, pp. 417-429
[20]. Shittu, O.I.; Yaya, O.S. (2009) Measuring forecast performance of ARMA & ARFIMA models: An application to US Dollar/UK pound foreign exchange rate, European Journal of Scientific Research, vol. 32, no. 2, pp. 167-176

30 Bratu (Simionescu), M.
APPENDIX 1. The results of Diebold-Mariano test in EViews
Dependent Variable: D6 Method: Least Squares Date: 11/24/12 Time: 14:05 Sample: 2001 2011 Included observations: 11
Variable Coefficient Std. Error t-Statistic Prob.
C -0.883636 0.344872 -2.562214 0.0283
Dependent Variable: D2 Method: Least Squares Date: 11/24/12 Time: 14:05 Sample: 2001 2011 Included observations: 11
Variable Coefficient Std. Error t-Statistic Prob.
C -4.637454 2.345183 -1.977438 0.0762
Dependent Variable: D3 Method: Least Squares Date: 11/24/12 Time: 14:05 Sample: 2001 2011 Included observations: 11
Variable Coefficient Std. Error t-Statistic Prob.
C -5.521090 2.666494 -2.070543 0.0652
Dependent Variable: D4 Method: Least Squares Date: 11/24/12 Time: 14:05 Sample: 2001 2011 Included observations: 11
Variable Coefficient Std. Error t-Statistic Prob.
C -3.939427 2.520943 -1.562680 0.1492
Dependent Variable: D6 Method: Least Squares Date: 11/24/12 Time: 14:05 Sample: 2001 2011 Included observations: 11
Variable Coefficient Std. Error t-Statistic Prob.
C -0.883636 0.344872 -2.562214 0.0283

The Accuracy and Bias Evaluation of the USA Unemployment Rate … 31
APPENDIX 2. Biasedness tests
Dependent Variable: E1 Method: Least Squares Date: 11/24/12 Time: 14:22 Sample: 2001 2011 Included observations: 11
Variable Coefficient Std. Error t-Statistic Prob.
C 0.026182 0.034439 0.760235 0.4647
Dependent Variable: E2 Method: Least Squares Date: 11/24/12 Time: 14:22 Sample: 2001 2011 Included observations: 11
Variable Coefficient Std. Error t-Statistic Prob.
C 0.466364 0.222054 2.100231 0.0621
Dependent Variable: E3 Method: Least Squares Date: 11/24/12 Time: 14:23 Sample: 2001 2011 Included observations: 11
Variable Coefficient Std. Error t-Statistic Prob.
C 1.045455 0.596408 1.752918 0.1102
Dependent Variable: E4 Method: Least Squares Date: 11/24/12 Time: 14:23 Sample: 2001 2011 Included observations: 11
Variable Coefficient Std. Error t-Statistic Prob.
C 1.481818 0.577741 2.564847 0.0281

32 Bratu (Simionescu), M.
The biasedness test for combined forecasts
Dependent Variable: C1 Method: Least Squares Date: 11/24/12 Time: 15:01 Sample: 2001 2011 Included observations: 11
Variable Coefficient Std. Error t-Statistic Prob.
C 6.678958 0.539466 12.38068 0.0000
Dependent Variable: C2 Method: Least Squares Date: 11/24/12 Time: 15:04 Sample: 2001 2011 Included observations: 11
Variable Coefficient Std. Error t-Statistic Prob.
C 6.146983 0.607579 10.11717 0.0000
Dependent Variable: C3 Method: Least Squares Date: 11/24/12 Time: 15:04 Sample: 2001 2011 Included observations: 11
Variable Coefficient Std. Error t-Statistic Prob.
C 6.017582 0.641704 9.377502 0.0000
Dependent Variable: C4 Method: Least Squares Date: 11/24/12 Time: 15:08 Sample: 2001 2011 Included observations: 11
Variable Coefficient Std. Error t-Statistic Prob.
C 4.856279 0.026520 183.1166 0.0000
Dependent Variable: C5 Method: Least Squares Date: 11/24/12 Time: 15:09 Sample: 2001 2011 Included observations: 11
Variable Coefficient Std. Error t-Statistic Prob.
C 4.867313 0.027033 180.0511 0.0000
Dependent Variable: C6 Method: Least Squares Date: 11/24/12 Time: 15:09 Sample: 2001 2011 Included observations: 11
Variable Coefficient Std. Error t-Statistic Prob.
C 4.844737 0.026504 182.7940 0.0000

Annals of the University of Petroşani, Economics, 12(4), 2012, 33-38 33
LEGAL ISSUES AND ASPECTS RELATED TO THE HUMAN RESOURCES MANAGEMENT REGARDING THE
SELECTION OF CIVIL SERVANTS
MELINDA CENUŞE, ADRIAN DAVID *
ABSTRACT: Public administration selects its servants exclusively on competence criteria (the so-called merit system). The selection of civil servants is performed by contest, organized within the limit of vacant public positions provided annually for this purpose, by the plan for occupation of public positions. As a general rule, the contest is organized on a quarterly basis. Any individual who meets the general conditions provided by law and the specific conditions established by law for occupying a certain public position may participate at the selection contest organized for the occupation of a public position. Among other aspects, in this study we underline an inconsistency regarding the recruitment defined in the field of Human Resources Management and its definition from The Statute of the Civil Servants.
KEY WORDS: civil servant’s career; public interest; recruitment; personnel selection.
JEL CLASSIFICATION: O15; H83. An important aspect in the field of the civil servant’s career is „the
recruitment of civil servants”. Currently, it is generally accepted the theory pursuant to which they have to be selected exclusively on competence criteria (the so-called merit system). All countries with a stable democracy, as well as those in transition have tried to solve this problem by developing legislation to regulate this aspect. However, experts are unanimous in recognizing that even in countries with advanced democracies (the United States and Great Britain, for example), there are ways to circumvent the legal provisions, without becoming a general phenomenon (in fact, this practical possibility of circumventing the provisions of the merit system is one of the most important reproaches against it).
* Lecturer, Ph.D. Student, University of Petroşani, Romania, [email protected] Assist. Prof., Ph.D. Student, University of Petroşani, Romania, [email protected]

34 Cenuşe, M.; David, A.
In order to create a body of civil servants with a solid and recognized professional competence, in practice was used the system for selecting public servants through contest, or by selecting from among several candidates for the same position, of the candidate who proves to have the skills and highest professional competence.
“The Statute of the Civil Servants provides that the occupation of vacant public positions shall be performed solely by advancement, transfer, redistribution, recruitment, and other ways provided by law” (Preda, 2006, p.89).
Article 57 of the Civil Servants’ Statute stipulates that the recruitment in view of entering the body of civil servants is performed through contest, organized within the limit of the number of vacant public positions provided annually for this purpose in the plan for occupation of public positions”, elaborated by the National Agency of Civil Servants. With respect to this provision we feel bound to bring some clarifications in the field of Human Resources Management.
Although the Civil Servants’ Statute addresses the recruiting of civil servants by contest, we believe that the term of recruitment is not consistent with the components of the Human Resources Management activities.
Thus, in the field of Human Resources Management, recruitment means the activity of identifying individuals who possess the necessary characteristics for occupying the vacant positions and attracting them to the organization. Recruitment can be performed from external sources, namely from the external environment of the organizational system or from internal sources, accordingly, an employee even within the organization, shall occupy a vacant position.
On the other hand, the selection is the process of selecting the future employee of the organization, based on specific criteria. This process is carried out immediately after recruitment, and based on the decision taken by the management of the organization, is followed by the employment.
We observe in the study of Human Resources Management component activities a clear distinction between recruitment and selection stages, which unfortunately is not as clear in the Civil Servants’ Statute. Therefore in our paper we refer to the selection of civil servants in respect to what the law provides as being the recruitment of civil servants, as we believe that this term superiorly meets the requirements of the scientific rigor.
Authorities or public institutions may organize or request the organization of contests, provided the public positions become vacant during the year and have not been envisaged as vacant public positions in the plan for occupation of public positions. Thus, the contest is organized after the advancement, transfer and redistribution of civil servants under the law. This method of civil servants’ recruitment is currently regulated by Government Decision no. 611 of 4th June, 2008 on the approval of the rules regarding the organization and development of civil servants’ career (published in the Official Gazette no.757 of 29th October, 2003).
Thus, the selection of civil servants is performed by contest, organized within the limit of vacant public positions provided annually for this purpose, by the plan for occupation of public positions. As a general rule, the contest is organized on a quarterly basis.

Legal Issues and Aspects Related to the Human Resources … 35
Any individual who meets the general conditions provided by law and the specific conditions established by law for occupying a certain public position may participate at the selection contest organized for the occupation of a public position (Iancu, 1999, pp.63-69).
The specific conditions for participation in the selection contest for occupying a vacant public position shall be established pursuant to the job description, as follows:
a) for the public positions for which the competence of organizing the contest belongs to the Agency, the specific conditions shall be approved by the Agency, at the request of the public authorities and institutions;
b) for the public positions for which the competence of organizing the contest belongs to the public authorities and institutions within the central public administration, the specific conditions shall be established by the public authorities or institutions of whose title lists comprise the vacant public position for which the contest shall be organized, with the approval of the Agency.
c) for the public positions for which the competence of organizing the contest belongs to the public authorities and institutions within the local public administration, the specific conditions shall be approved by the head of the public authority or institution of whose title list comprises the vacant public position for which the contest shall be organized, with the notification of the Agency.
At least 30 days before the date established for the written test, based on the approval or, where appropriate, with the proof of having notified the Agency, the public authority or institution organizing the contest shall ensure the publicity of the contest, under the law.
The contest notice shall be published by the organizing public authority or institution in the Official Gazette of Romania, Part III, and in a widely read daily newspaper, at least 30 days before the date of the written test.
At least 30 days before the date established for the written test, the public authority or institution shall post at its registered office the participation conditions and the conditions for the conduct of the contest, the bibliography, content and other information necessary for the organization of the contest.
The public authority or institution shall post these information on its website, if owns one, in the section specifically designed for this purpose. The information shall be kept in the place where it was posted until the completion of the contest. Supposing the public authorities or institution deem as necessary, they can ensure the publication of the notice through other forms of publicity.
The recruitment contest consists of 3 consecutive stages, as follows: a) selection of the application files to enter for the contest; b) written test; c) interview. Only the candidates who passed the previous test may enter the following one. The stages of the contest shall be assessed independently by each member of
the Contest Commission, respectively each member of the Appeal Commission. In order to participate in the contest, within 20 days from the date of the notice
publication in the Official Gazette of Romania, Part III, candidates shall submit the contest application file, which shall contain mandatorily the followings: a) application

36 Cenuşe, M.; David, A. form provided in Annex No. 3 b) copy of the identity card c) copies of study diplomas and other documents certifying the graduation of some specializations d) copy of the employment record or, where applicable, a certificate attesting the accumulated service; e) criminal record f) certificate attesting proper health, issued at the most 6 months before the organization of the contest by the family doctor of the candidate or a certified sanitary unit; g) statutory declaration or a certificate attesting that the candidate did not conduct political police activities.
In order to organize and conduct contests for the selection of civil servants, at least 20 days before the contest, shall be created Contest Commissions, respectively Appeal Commissions, by administrative act of the head of the public authority or institution organizing the contest, under the present decision. The president of the Contest Commission and the president of the Appeal Commissions respectively, shall be nominated from within its members through the administrative act of establishing the commission (Preda, 2006, pp. 321-323).
Each Contest Commission, namely Appeal Commission shall have a nominated secretary. Ordinarily, the secretary of the Contest Commission and the secretary of the Appeal Commission are ensured by the civil servants within the Human Resources Department or by civil servants with responsibilities in this field, provided in the job description, within the public authority or institution organizing the contest.
For the contests organized for the purpose of occupying leadership public positions, the Contest Commission and the Appeal Commission shall consist of 5 members, nominated as follows:
a) 3 members shall be representatives of the public authority or institution of whose title list comprises the vacant public position for which the contest shall be organized or, where appropriate, shall be nominated from within then superior hierarchical public institution.
b) 2 members shall be representatives of the Agency. For the contests organized for the purpose of occupying executive public
positions, the Contest Commission and the Appeal Commission shall consist of 3 members, nominated as follows:
a) 2 members shall be representatives of the public authority or institution of whose title list comprises the vacant public position for which the contest shall be organized;
b) 1 member shall be a representative of the Agency. At the request of the representative trade union organizations1 of the civil
servants, addressed to the public authority or institution organizing the contest, with the approval of the Agency, a member of the commission shall be nominated from among them.
For contests organized by public authorities and institutions of local public administrations and decentralized public authorities and institutions, the representative of the Agency may be nominated from within the Institution of the Prefect or County
1 The request of the representative trade union organization of civil servants shall be submitted no later than the last day for submitting the files by the candidates for occupying a vacant public position for which the contest shall be organized.

Legal Issues and Aspects Related to the Human Resources … 37 Council from the county in which the public institution has its registered office and of whose title lists comprise the vacant public position for which the contest shall be organized. The nomination of the representatives of the Agency shall be performed with the approval of the public authority in which the civil servant conducts its activity.
Members of other public authorities or institutions may be nominated when the establishment of a Contest Commission and Appeal Commission public authority or institution can not be performed pursuant to the legal provisions, due to the small number of civil servants, at the request of the public authority or institution of whose title lists comprise the vacant public position for which the contest shall be organized.
Only definitive civil servants may be nominated as members of the Content Commissions or Appeal Commissions. The civil servants to be nominated in the Contest Commissions and Appeal Commission must meet the following conditions simultaneously: a) shall have extensive knowledge in one of the fields of the public positions for
which the contest is organized or general knowledge in public administration; b) shall have training and/or experience in one of the fields of the public positions for
which the contest is organized, Human Resource Management or public administration;
c) shall have a recognized probity; d) shall hold a public position at least in the same class with the vacant public
position(s) for which the contest shall be organized; e) shall not comply with the cases of incompatibility or conflict of interest provided
by law. In the case of contests organized for the purposes of occupying leadership
public position, at least 2 of the members of the Contest Commission, the Appeal Commission respectively, shall be civil servants in leading positions.
If the commission tests specific skills or competencies in the information technology, foreign languages, national minority language or other specific competencies, at least one of its members shall have knowledge or experience in these fields. The Contest Commission or Appeal Commission may benefit from the advice of certain experts in that field. The civil servant who has been disciplined, and the penalty has not been withdrawn, may not be nominated as a member of the Contest Commission or Appeal Commission. The membership in the Contest Commission shall be incompatible with the membership in the Appeal Commission.
The civil servant to be nominated as a member to the Contest Commission or Appeal Commission shall not fall under the conflicts of interest cases enlisted below: a) has patrimonial relations with any of the candidates or its property interests or the
property interests of its spouse may affect the impartiality and objectivity of the assessment;
b) is the spouse, close relative or related until the IV grade including, with any of the candidates or with another member of the Contest Commission or Appeal Commission;
c) is, or will be, in the situation of occupying a leadership public position for which the contest shall be organized, being directly hierarchical subordinated to any of the candidates.

38 Cenuşe, M.; David, A.
The non-compliance with the conditions referring to the incompatibility of the members of the Contest Commission and Appeal Commission shall constitute misconduct and shall be punished by law.
Public authorities and institutions have the duty to ensure the training of the civil servants, which may become members in the Contest Commission and Appeal Commission, as well as of the persons with responsibilities in providing the secretariat of these commissions in fields specific to recruitment and personnel selection (Preda & Stecoza, 2000, pp. 63-73).
REFERENCES: [1]. Alexandru, I. (2002) Administraţia publică. Teorii, realităţi, perspective, ed. a III-a, Ed.
Lumina Lex, Bucureşti [2]. Brezoianu, D.; Oprincan, M. (2008) Administraţia publică în România, Ed. C.H. Beck,
Bucureşti [3]. Iancu, G. (1999) Reguli constituţionale privind ocuparea funcţiilor publice, Revista de
drept public [4]. Preda, M.; Stecoza, G. (2000) Unele consideraţii şi observaţii critice cu privire la statutul
funcţionarului public, Dreptul, nr. 8 [5]. Preda, M. (2006) Drept administrativ. Partea generală, Edition IV, Lumina Lex
Publishing House, Bucharest [6]. Tofan, D. (2008) Drept administrativ, Ed. C. H. Beck, Bucureşti

Annals of the University of Petroşani, Economics, 12(4), 2012, 39-52 39
A COMPARATIVE ANALYSIS OF ASEAN CURRENCIES USING A COPULA APPROACH AND A DYNAMIC
COPULA APPROACH
CHUKIAT CHAIBOONSRI, PRASERT CHAITIP *
ABSTRACT: The ASEAN Economic Community (AEC) will be shaped developing to be a single market and production base in 2015, moving towards regional Economic Integration, 2009. These developments in international financial markets do lead to some adverse cost for AEC country borrowers. The specific objective aims to investigate the dependent measures and the co-movement among selected ASEAN currencies. A Copula Approach was used to examine dependent measures of Thai Baht exchange rate among selected ASEAN currencies during the period of 2008-2011. Also, a Dynamic Copula Approach was tested to investigate the co-movement of Thai Baht exchange rate among selected ASEAN currencies during the period of 2008-2011. The results of the study based on a Pearson linear correlation coefficient confirmed that Thai Baht exchange rate and each of selected ASEAN currencies have a linear correlation during the specific period excluding Vietnam exchange rate. Furthermore, based on empirical Copula Approach, Thai Baht exchange rate had a dependent structure with each of the selected in ASEAN currencies including Brunei exchange rate, Singapore exchange rate, Malaysia exchange rate, Indonesia exchange rate, Philippine exchange rate, and Vietnam exchange rate respectively. The results of Dynamic Copula estimation indicated that Thai Baht exchange rate had a co-movement with selected ASEAN currencies. The research results provide an informative and interactive ASEAN financial market to all users, including Global financial market. KEY WORDS: Empirical Copula; Dynamic Copula; Exchange Rate; Thailand; AEC JEL CLASSIFICATION: C5, F3, F4 * Lecturer, Faculty of Economics, Chiang Mai University, Chiang Mai, Thailand Assoc. Prof., Faculty of Economics, Chiang Mai University, Chiang Mai, Thailand

40 Chaiboonsri, C.; Chaitip, P. 1. INTRODUCTION
ASEAN had target to be a single market and production base in 2015, (Charting Progress towards regional Economic Integration, 2009). The importance thing should to concern is the international financial linkage among of ASEAN countries. Mohd and Zaidi (2006) found that currency movement among of three ASEAN countries (Malaysia, Singapore and Thailand) showed the possibilities of nonlinearity. The empirical copulas approach was employed to calculate the dependent measurement between Thai Baht exchange rate and the selected ASEAN currencies consisting of Brunei exchange rate, Singapore exchange rate, Malaysia exchange rate, Indonesia exchange rate, Philippine exchange rate, and Vietnam exchange rate during period of 2008-2011. Based on a few financial literatures the copula functions are the standard tool in financial modeling (Vogiatzoglou, 2010). Patton (2006) tried to estimate the asymmetry in the constant and dynamics dependence between the Deustche mark and the Yen based on copula approach. Benediktsdóttir and Scotti (2009) tested for all the possible joining of the following six bivariate exchange rates against the U.S. dollar such as Australian dollar, Canadian dollar, Swiss franc, Euro, British pound, Japanese yen based on dynamics copula and co-movement approach for during period of 1990-2007.
2. RESEARCH OBJECTIVE
The specific objective is to find the dependence measures and to find the co-movement between Thai exchange rates and selected ASEAN currencies during the period of 2008-2011.
3. SCOPE OF THIS RESEARCH
The daily data of Thai Baht exchange rate and each of selected ASEAN currencies shown as the exchange returns in percentage were collected during period of 2008-2011 shown in small percents.
4. THE RESEARCH FRAMEWORK AND METHODOLOGY 4.1. The copula concept
The copula concept was first proposed by Sklar’s theorem (Sklar, 1959) and this concept can be explained by equations (1A).
H(x1,x2, …..,xn ) = C (F1(x1), F2(x2),….., Fn(xn)) (1A)
H : n-dimensional distribution with marginal Fi , i=1,2,..,n. C : n-copula for all x1,x2,…., xn

A Comparative Analysis of ASEAN Currencies Using a … 41 Sklar’s Theorem with two dimensions can be explained by equation (2A) and this equation has already shown below that:
H(x,y ) = C (F(x), F(y)) (2A)
H(.,.) : 2-dimensional or bivariate distribution with marginal distributions F and G C(.,.) : copula for all x, y in R 4.2. Spearman’s rho and Kendal’s tau with empirical copula approach
Nelson (1999) proposed the estimation of both Spearman’s rho and Kendal’s tau for a sample size n calculated from the empirical copula approach. Therefore, the Kendal’s tau and Spearman’s rho based on empirical copula calculation was able to show the formula of them from both equation (3A) and equation (4A).
n
j
n
i n
j
n
iC
n
j
n
iC
n
j
n
iC
n
j
n
iC
n
n2
^^^^
2
^
,11
,1
,1
,1
2 (3A)
n
j
n
is n
j
n
i
n
j
n
iC
n 1
^
12
^
*,1
12 (4A)
- The equation (3A): Kendal’s tau empirical copula based. - The equation (4A): Spearman’s rho empirical copula based.
- ^
C is empirical copula (see more detail Deheuvels, 1978) 4.3. Dependence Measures and Copulas
The general properties of dependence measures can be explained by the 4 items properties shown below (Embrechts, Lindskog, and McNeil (2003)): 1. δ (X,Y) = δ (Y,X). 2. -1≤ δ (X,Y) ≤ 1. 3. δ (X,Y) = 1 if X and Y are comonotonic; as well as δ (X,Y) = -1 if X and Y are
comonotonic. 4. If T is exactly monotonic, then δ (T(X),Y) = { δ (X,Y), T = increasing or - δ
(X,Y), T = decreasing Normally, the Pearson linear correlation fits only the first two properties but the rank correlation measures Spearman’s rho and Kendall’s tau fits all of the 4 properties. Therefore, the Copulas calculates the Spearman’s rho and Kendall’s tau as the dependence measures between X and Y which are random variables. 4.4. Dynamic copula and Co-movement
The dynamic copula and co-movement in international finance became more interesting. A few literatures discussed about these topics. For example, Patton(2006)

42 Chaiboonsri, C.; Chaitip, P. estimated the asymmetry in the constant and dynamics dependence between Japanese yen and US dollar, Euro and US dollar exchange rates based on copula approach. Benediktsdóttir and Scotti(2009) investigated for all the possible joining of the following six bivariate exchange rates such as Australian dollar, Canadian dollar, Swiss franc, euro, British pound, Japanese yen against the U.S. dollar based on dynamics copula and co-movement approach for during period of 1990-2007. Literatures were conducted to produce this study of the dependence measurement and co-movement toward between Thai Baht exchange rate and the exchange returns of selected ASEAN currencies. Moreover, this study introduced criteria for selecting the pair of currency between Thai exchange rate and ASEAN currencies by utilizing empirical copula approach. The first currency in the pair is called the base currency and the second is called the quote currency An AR (1)-GJR (1, 1) marginal model with either Skew-T or T residuals was fitted to each of ASEAN currencies. And this model can be written in equation (5A) - (7A).
tititi erccr ,1,10, (5A)
),(,,,,, SkThe titititi (6A)
)0(1 1,2
1,1,2
1,,, titititititi eeheh (7A)
The copula family was employed to estimate the pair of currency between Thai exchange rate and each of ASEAN exchange rate such as static t copula (t), the time varying t copula (tDCC), the Clayton copula (tvC), the static SJC copula, and the time varying SJC copula (tvSJC). Both static t copula (tDCC) and the time varying t copula (tDCC) were called Elliptical copulas family. Furthermore, the Clayton copula (tvC), the static SJC copula, and the time varying SJC copula (tvSJC) were called Archimedean copulas family. The model of static t copula (t) and the time varying t copula (tDCC) were explained by equation (8A) and (9A).
111 ..).1(
tttt QQQ (8A)
,~~ 11 tttt QQQR (9A)
Define: - Rt : the value of correlation evolves through time as in the DCC(1,1) model was
proposed by Engle(2002); - �t : the sample covariance of �t; - α , β : the parameters were estimated from equation (8A); - v : the degree of freedom parameter of the t copula;

A Comparative Analysis of ASEAN Currencies Using a … 43 The Archimedean copulas such as the Clayton copula (tvC), the static SJC copula, and the time varying SJC copula (tvSJC) explained by equation (10A), (11A), (12A), and (13A) respectively.
),.( ,2,11 ititt (10A)
Define: - � : the logistic transformation to keep the parameters of both Clayton and SJC
(Symmetrized Joe-Clayton copula). (see more detail in Vogiatzoglou,2010). - ,β,α : the parameters were estimated for Clayton copula model. - μ1, μ2 : the error terms of bivariate exchange rate.
),10
1.( ,2,1
10
11 itit
itt
(11A)
And define that: - � : the logistic transformation to keep the parameters of SJC(Symmetrized Joe-
Clayton copula). - ,β,α : the parameters were estimated for SJC copula model. - μ1, μ2 : the error terms of bivariate exchange rate. - τt : the Kendall’s tau for the SJC copula in upper tail and lower tail (see more
detail in Patton,(2006), and Vogiatzoglou,2010).
Moreover, the time varying SJC copula (tvSJC) can be explained by equation (12A) for upper tail and (13A) for lower tail.
),10
1.( ,2,1
10
11 itit
it
(12A)
),10
1.( ,2,1
10
11
*itit
it
(13A)
And also define that: - � : the logistic transformation to keep the parameters of SJC(Symmetrized Joe-
Clayton copula) for upper tail. - �* : the logistic transformation to keep the parameters of SJC(Symmetrized Joe-
Clayton copula) for lower tail. - ,β,α : the parameters were estimated for SJC copula model. - μ1, μ2 : the error terms of bivariate exchange rate. - τt : the Kendall’s tau for the SJC copula in upper and lower tail (see more detail in
Patton, 2006; Vogiatzoglou, 2010).
5. DATA DESCRIPTION

44 Chaiboonsri, C.; Chaitip, P. Figure (1a) shows daily data of ASEAN exchange rates in percentage returns during the period of 2008 to 2011. Moreover, Table (1a) shows descriptive statistics of ASEAN exchange rates in percentage returns during the period of 2008 to 2011.
Figure (1a). The ASEAN exchange rates in percentage returns during period of 2008-2011
(daily data)
Table (1a). The statistics of ASEAN exchange rates in percentage returns during the period of 2008 to 2011(daily data)
Items Thailand Malaysia Indonesia Singapore Philippine Vietnam Brunei
Mean 0.003090 -0.004775 -0.003230 -0.011818 0.005344 0.027920 -0.011930
Median 0.000000 0.000000 0.000000 -0.027175 0.000000 0.000000 -0.022006
Maximum 4.745763 1.802077 7.436282 2.700345 1.978491 6.262834 2.753971
Minimum -3.721683 -2.141981 -6.293103 -2.306903 -2.061628 -4.563969 -2.314413
Std. Dev. 0.396876 0.454471 0.555336 0.440743 0.487157 0.420956 0.436556
Skewness 2.227425 -0.068831 1.630686 0.219288 0.082685 4.701804 0.059016
Kurtosis 45.20574 4.978748 56.28973 6.822453 4.056245 90.79956 7.417489
Jarque-Bera 75273.90 164.4248 119124.3 618.6629 47.76793 325857.6 816.1136
Probability 0.000000 0.000000 0.000000 0.000000 0.000000 0.000000 0.000000
Observations 1003 1003 1003 1003 1003 1003 1003

A Comparative Analysis of ASEAN Currencies Using a … 45 From: computed 6. EMPIRICAL RESULTS OF RESEARCH
6.1. The dependence measure of Thai Baht exchange rate and selected ASEAN exchange rates
In this research pointed out that the general properties of dependence measures can be explained by four important potential properties of statistics as shown on table(1g) below (Embrechts, Lindskog, and McNeil (2003)). From computed there is a perfect harmony between the two sets of ranks of dependent measurement based on Kendall’s tau statistics and Spearman’s rho statistics (a non-parametric measure of statistical dependence between two variables). Ranking of dependent measurement based on the Pearson linear correlation coefficient is a settle on of the strong point of a linear determined a linear mixture of the dependent variables (see table (1b)).
Table (1b). The dependence measure of Thai Baht exchange rate and each selected
ASEAN exchange rates during period of 2008-2011
Properties of statistics
Malaysia Indonesia Singapore Philippine Vietnam Brunei
Pearson linear correlation coefficient
0.340** 0.181** 0.326** 0.218** 0.008 0.335**
Kendall’s tau statistics
0.312976 0.208214 0.3171003 0.2064734 0.01975112 0.3411878
Spearman’s rho statistics
0.452674 0.3059663 0.4533679 0.3015882 0.02844642 0.4865837
Ranking of dependent
measurement based on
Kendall’s tau statistics and Spearman’s rho statistics
3 4 2 5 6 1
Ranking of dependent
measurement based on the Pearson linear
correlation coefficient
1 5 3 4 6 2
**: Correlation is significant at the 0.01 level (2-tailed) Source: From computed. 6.2. The dynamic copula and co-movement between Thai Baht exchange rate and each of selected ASEAN exchange rates

46 Chaiboonsri, C.; Chaitip, P. The LM test and the Kolmogorov-Smirnov test were employed to test the marginal distributions of AR (1)-GJR (1, 1) marginal model for each selected ASEAN’s exchange rate (see the result of testing in appendix A, (Sigríður Benediktsdóttir And Chiara Scotti, 2009)). The results of estimation based on dynamic copula and co-movement between Thai Baht exchange rate and each of selected ASEAN exchange rate presented in table (1c). Estimation of the static t-copula found that the exchange rate of Thailand had a co-movement with each of ASEAN exchange rates such as Brunei exchange rate, Singapore exchange rate, Malaysia exchange rate and Indonesia exchange rate. But Philippine exchange rate had no co-movement with Thai exchange rate. Estimation of the time varying t copula (tDCC) found that the exchange rate of Thailand had a co-movement with both Brunei exchange rate and Malaysia exchange rate. However, Thai’s exchange had no co-movement with Singapore exchange rate, Indonesia exchange rate and Philippine exchange rate. Based on estimation of the Clayton copulas (tVC) the exchange rate of Thailand had a co-movement with only one currency in ASEAN is Malaysiaexchange rate. In addition, based on estimation of the static SJC copula (Symmetrized Joe-Clayton copula) was found that both upper tail and lower tail have a statistics significantly. It is meaning that Thai exchange rate had a co-moment with all of ASEAN exchange rates in upper tail regime and lower tail regime (during period of world’s financial crisis 2008-2010). Finally, estimation of the time varying SJC copula (Symmetrized Joe-Clayton copula) found that the exchange rate of Thailand had a co-movement with Brunei exchange rate in upper tail regime. During period of world’s financial crisis, Thai exchange rate and Brunei exchange rate had a co-movement shown depreciation against US dollar. Table (1c). The estimated marginal parameters correspond to AR(1)-GJR(1,1) toward the
copula-family
Thailand Brunei Thailand Singapore AR(1)- GJR(1,1) (marginal
parameters) SE.
(marginal parameters)
SE (marginal
parameters) SE.
(marginal parameters)
SE
C0 -0.0051 0.006 -0.0254** 0.01 -0.0051 0.006 -0.0296** 0.011 C1 0.0466* 0.034 -0.0315 0.031 0.0466* 0.034 -0.0424* 0.029 ω 0.0023* 0.001 0.0051* 0.003 0.0023** 0.001 0.0017* 0.001 α 0.2535*** 0.061 0.1490*** 0.068 0.2535*** 0.061 0.0777*** 0.019 β 0.8006*** 0.036 0.8965*** 0.048 0.8006*** 0.036 0.9421*** 0.016 γ -0.0664* 0.058 -0.1253* 0.064 -0.0664* 0.058 -0.0511** 0.025 v
3.9853*** 0.5 4.2724*** 0.612 3.9853*** 0.5 4.9077*** 0.776 λ - - - - - - -
Log- likelihood -75.733 -455.324 -75.733 -474.3
AIC 165.4664 924.6471 165.4664 962.6005 BIC 199.8417 959.0223 199.8417 996.9757
Static t-copula
(t) parameters SE. parameters SE.

A Comparative Analysis of ASEAN Currencies Using a … 47
v 11.3419*** 4.545 9.5014*** 3.001
AIC -278.5438 -260.5068 BIC -273.6331 -255.596 Log-
likelihood 140.272 131.253 Time
varying t(tDCC) parameters SE. parameters SE.
v 14.0819* 7.4 9.0609*** 2.832 α 0.0317* 0.018 0.0218 0.026 β 0.8984*** 0.076 0.8803*** 0.278
AIC -282.5605 -258.8045 BIC -267.8282 -244.0722 Log-
likelihood 144.28 132.402 Clayton Copulas
(tVC) parameters SE. parameters SE.
ω -0.0283 0.138 -1.4084*** 0.216 α -0.7831* 0.417 0.6571* 0.381 β 0.7007** 0.256 -0.7331*** 0.131
AIC -203.8507 -188.3311 BIC -189.1184 -173.5989 Log-
likelihood 104.925 97.166 Static SJC
copula parameters SE. parameters SE.
0.3102*** 0.044 0.2885*** 0.042
0.2696*** 0.048 0.2651*** 0.046 AIC -261.2982 -243.8058 BIC -251.4767 -233.9843 Log-
likelihood 132.649 123.903 Time
varying SJC
copula Upper Tail SE. Lower Tail SE. Upper Tail SE. Lower Tail SE.
ω 1.7852*** 0.417 0.0954 0.756 0.0723 1.124 -0.0704 0.554 α -9.9999*** 0.002 -3.1715 4.981 -3.9123 5.161 -1.3339 2.839 β -0.9838*** 0.007 0.0604 0.83 -0.7521*** 0.155 0.3951* 0.266
AIC -269.8925 -237.1479 BIC -240.428 -207.6834 Log-
likelihood 140.946 124.574 From: computed, SE: Standard errors are in parenthesis and *, **, ***: Significance at 1%,5%,10%
Table (1c): Present the estimated marginal parameters correspond to AR(1)-
GJR(1,1) toward the copula-family (continue with Table(1c))
L
U

48 Chaiboonsri, C.; Chaitip, P.
AR(1)-GJR(1,1)
Thailand (marginal
parameters) SE.
Malaysia (marginal
parameters) SE
Thailand (marginal
parameters) SE.
Indonesia (marginal
parameters) SE
C0 -0.0073* 0.007 -0.0146* 0.013 -0.0051 0.006 -0.0150** 0.007 C1 0.0493* 0.035 -0.0189 0.028 0.0466* 0.034 -0.0514* 0.032 ω 0.0023** 0.001 0.0078** 0.004 0.0023* 0.001 0.0070* 0.005 α 0.2528*** 0.061 0.1677*** 0.049 0.2535*** 0.061 0.2362* 0.18 β 0.8018*** 0.036 0.8508*** 0.035 0.8006*** 0.036 0.8536*** 0.071 γ -0.0666* 0.058 -0.0867* 0.055 -0.0664* 0.058 0.0565 0.104 v 3.9798*** 0.501 5.6849*** 1.038 3.9853*** 0.5 2.3742*** 0.151 λ -0.0267 0.041 -0.0281 0.04 - - - -
Log- likelihood -75.528 -551.095 -75.733 -295.23
AIC 167.0559 1118.1899 165.4664 604.4597 BIC 206.3419 1157.4759 199.8417 638.835
Static t-copula (t) parameters SE. parameters SE.
v 15.9104** 7.933 16.3510* 10.907
AIC -223.4681 -115.5455 BIC -218.5574 -110.6348 Log-
likelihood 112.734 58.773 Time
varying t(tDCC) parameters SE. parameters SE.
v
15.2286** 7.461
16.3281* 10.189
α 0.0399** 0.018 0.002 0.015 β 0.8743*** 0.066 0.8604*** 0.052
AIC -229.0344 -111.5174 BIC -214.3021 -96.7851 Log-
likelihood 117.517 58.759 Clayton Copulas
(tVC) parameters SE. parameters SE.
ω -0.4380* 0.336 -1.0959** 0.448 α -0.1778 0.515 -1.4727* 0.979 β 0.4513* 0.298 -0.1689 0.319
AIC -152.9157 -86.6304 BIC -138.1834 -71.8981 Log-
likelihood 79.458 46.315 Static SJC
copula parameters SE. parameters SE.
0.2797*** 0.042 0.1396*** 0.043
0.2131*** 0.046 0.1515*** 0.045 AIC -210.21 -108.4114 BIC -200.3885 -98.5899 Log-
likelihood 107.105 56.206
UL

A Comparative Analysis of ASEAN Currencies Using a … 49
Time varying
SJC copula Upper Tail SE. Lower Tail SE. Upper Tail SE. Lower Tail SE.
ω 1.5064 2.985 -1.4923 1.96 -0.4504 1.619 0.2004 1.428 α -9.4706 18.461 -1.0989 7.918 -9.9975* 6.444 -9.9997** 4.838 β -0.2787 2.677 -0.8470*** 0.08 -0.9255*** 0.048 -0.9127*** 0.101
AIC -208.8808 -109.2253 BIC -179.4163 -79.7608 Log-
likelihood 110.44 60.613 From: computed, SE: Standard errors are in parenthesis and,*, **, ***: Significance t 1%,5%,10%
Table (1c): Present the estimated marginal parameters correspond to AR(1)-GJR(1,1)
toward the copula-family(continue with Table(1c)).
Thailand Philippine AR(1)-GJR(1,1) (marginal parameters) SE. (marginal parameters) SE
C0 -0.0051 0.006 -0.0104 0.028 C1 0.0466* 0.034 -0.0773** 0.033 ω 0.0023* 0.001 0.00001 0.01 α 0.2535** 0.061 0.0068 0.008 β 0.8006*** 0.036 0.9769*** 0.037 γ -0.0664* 0.058 0.0393 0.112 v 3.9853*** 0.5 7.7887* 5.157 λ - - - -
Log-likelihood -75.733 -671.449 AIC 165.4664 1356.8986 BIC 199.8417 1391.2739
Static t-copula (t) parameters SE. v 46.1557 76.026
AIC -94.1893 BIC -89.2785
Log-likelihood 48.095 Time varying t(tDCC) parameters SE.
v 62.7767* 44.064 α 0.0268 0.023 β 0.8463*** 0.156
AIC -93.1355 BIC -78.4032
Log-likelihood 49.568 Clayton Copulas (tVC) parameters SE.
ω -0.6579 2.23 α 0.0929 1.747 β 0.5568 1.229
AIC -60.6954 BIC -45.9631

50 Chaiboonsri, C.; Chaitip, P.
Log-likelihood 33.348 Static SJC copula parameters SE.
ω 0.1401*** 0.047
0.1038** 0.046 AIC -85.1033 BIC -75.2818
Log-likelihood 44.552
Time varying SJC copula Upper Tail SE. Lower Tail SE.
ω 0.945 1.291 -0.1789 0.776
α -10.0000* 7.295 -0.8908 1.87 β -0.1541 0.772 0.7791*** 0.176
AIC -84.046 BIC -54.5815
Log-likelihood 48.023 From: computed, SE: Standard errors are in parenthesis and *, **, ***: Significance at 1%,5%,10% 7. CONCLUSIONS In conclusion, the study found a dependent structure as an appropriate solution for Thai Baht exchange rate in percentage returns and each of selected ASEAN currencies excluding Vietnam exchange rate return during period of 2008-2011. The copula approach to construct statistical models provided strong evidence showing a relationship between Thai Baht exchange rate against each of selected ASEAN currencies. Pearson linear correlation coefficient suggested that Thai Baht exchange rate returns had a moderate correlation with each of selected ASEAN currencies, except Vietnam. Kendall’s tau statistics and Spearman’s tau statistics confirmed a dependent structure as an appropriate solution for Thai Baht exchange rate and each of selected ASEAN currencies. Moreover, the Dynamic Copula estimation indicated that Thai Baht exchange rate had a co-movement with some selected in ASEAN’s currencies. Based on Elliptical copulas family estimation, Thai Baht exchange rate had a co-movement with each of selected ASEAN exchange rates including Brunei exchange rate, Singapore exchange rate, Malaysia exchange rate and Indonesia exchange rate. But Philippine exchange rate had no co-movement with Thai Baht exchange rate. And based on Archimedean copulas family estimation, the exchange rate of Thailand had a co-movement with each of selected ASEAN exchange rates such as Brunei exchange rate, Singapore exchange rate, Malaysia exchange rate, Indonesia exchange rate and Philippine exchange rate. But based on estimation of the time varying SJC copula (Symmetrized Joe-Clayton copula) Thai Baht exchange rate had a co-movement with only Brunei exchange rate in upper tail regime. During period of world’s financial crisis Thai exchange rate and Bruneiex change rate had a co-movement shown depreciation against US dollar.
UL

A Comparative Analysis of ASEAN Currencies Using a … 51 REFERENCES: [1]. Benediktsdóttir, S.; Scotti, C. (2009) Exchange Rates Dependence: What Drives it?,
Board of Governors of the Federal Reserve System International Finance Discussion Papers, Number 969, March 2009
[2]. Deheuvels, P. (1978) Caracteisation Complete des lois Extremes Multivariees et de la Convergence des Types Extemes, Publications de L’Institut de. Statistique de L’Uinversite de Paris, 23: 1-36
[3]. Enders, W.; Granger, C.W.J. (1998) Unit-root tests and asymmetric adjustment with an example using the term structure of interest rate, Journal of Business and Economics Statistics
[4]. Engle, R.F. (2002) Dynamic conditional correlation: a new simple class of multivariate GARCH models, Journal of Business and Economic Statistics, 20: 339-350
[5]. Franses, P.H.; Van Dijk, D. (2000) Non-linear time series models in empirical finance, Cambridge University Press
[6]. Glasserman, P. (2003) Tail Approximations for portfolio credit Risk, September [7]. Ismail, M.T.; Isa, Z. (2006) Modelling Exchange Rate Using Regime Switching Models,
Sains Malaysiana, pp.55-62 [8]. Nelsen, R. (2006) An Introduction to Copulas, New York Springer [9]. Nelson, R.B. (1999) An introduction to Copulas, Lecture Note in Statistics, Springer-
Verlag, New York [10]. Patton, A.J. (2006) Estimation of Multivariate Models for Time Series of Possibly
Different Lengths, Journal of Applied Econometrics, 21: 147–173 [11]. Patton, A.J. (2006) Modelling Asymmetric Exchange Rate Dependence, International
Economic Review, Vol. 47, No. 2, May [12]. Sklar, A. (1959) Fonctions de Repartition a n Dimensions et Leurs Marges, Publications
de l’Institut de. Statistique de L’Universite de Paris, 8: 229-231 [13]. Vogiatzoglou, M. (2010) Statistical Analysis of Multivariate Dependence Structures
among Financial Time Series, Ph.D., Dissertation Presented to the Department of Business Administration of the University of Macedonia, Thessaloniki, Greece
[14]. Vogiatzoglou, M. (2010) Dynamics Copula Toolbox, University of Macedonia, Greece [15]. Wood, S.N. (2004) Stale and efficient multiple smoothing parameter estimation for
generalized additive models, Journal of the American Statistical Association, 99: 673-686
[16]. Wuertz, D.; Chalabi, Y. (2010) Time Series: R metrics-Financial Time Series Objects, R Package, Version 2110.87, URL.http://cran.R-Project.org/web/packages/time Series
[17]. Yan, J. (2007) Enjoy the Joy of Copulas: With a Package Copula, Journal of Statistical Software, 21(4): 1-21
[18]. Zivot, E.; Wang, J. (2006) Modeling Fianacial Time Series with S-Plus, second edition. Springer Science +Business Media, Inc.

52 Chaiboonsri, C.; Chaitip, P.
Appendix A Table (1d). Testing of the Marginal Distribution Models based on LM-test and K-S test Thailand Brunei Singapore Malaysia Indonesia Philippine First moment LM test 0.302 0.225 0.363 0.115 0.128 0.363 Second moment LM test 0.312 0.138 0.211 0.131 0.071 0.211 Third moment LM test 0.339 0.358 0.272 0.475 0.649 0.272 Forth moment LM test 0.594 0.060 0.531 0.871 0.105 0.531 K-S test 0.125 0.076 0.063 0.057 0.166 0.045
LM-test: test for serial independence of the residual terms of marginal model (all of residual terms are satisfied for all of marginal models were employed to estimate the copula model).
K-S test: test for the uniform distribution of marginal models (If a p value more than 0.05 then the marginal model is well-specified (except, Philippine)).

Annals of the University of Petroşani, Economics, 12(4), 2012, 53-60 53
COMPUTER-BASED REASONING SYSTEMS: AN OVERVIEW
CIPRIAN CUCU *
ABSTRACT: Argumentation is nowadays seen both as skill that people use in various aspects of their lives, as well as an educational technique that can support the transfer or creation of knowledge thus aiding in the development of other skills (e.g. Communication, critical thinking) or attitudes. However, teaching argumentation and teaching with argumentation is still a rare practice, mostly due to the lack of available resources such as time or expert human tutors that are specialized in argumentation. Intelligent Computer Systems (i.e. Systems that implement an inner representation of particular knowledge and try to emulate the behavior of humans) could allow more people to understand the purpose, techniques and benefits of argumentation. The proposed paper investigates the state of the art concepts of computer-based argumentation used in education and tries to develop a conceptual map, showing benefits, limitation and relations between various concepts focusing on the duality “learning to argue – arguing to learn”. KEY WORDS: argumentation; computer systems; learning. JEL CLASSIFICATION: D83, L86 1. INTRODUCTION
The theoretical foundation of Argumentation research can be found in the well-known work of Stephen Toulmin – “The Uses of Argument”, firstly published in 1958 with an intention that was “strictly philosophical: to criticize the assumption [...] that any significant argument can be put in formal terms: not just as a syllogism [...] but a rigidly demonstrative deduction of the kind to be found in Euclidean geometry” (Toulmin, 2003).
* Assist. Prof., Ph.D., „1 Decembrie 1918” University, Alba Iulia, Romania, [email protected]

54 Cucu, C. Those expectations have been greatly exceeded, with argumentation finding its way into a wide area of research, from law to philosophy, from rhetoric and education to computer science. Consequntly, we find that argumentation theory can provide valuable educational tools, especially in domains that are "ill-defined" i.e., domains that “lack a systematic way to determine when a proposed solution is acceptable” (Lynch, et al., 2006) such as communication, critical thinking, music appreciation, ethics or even law. The limitations related to using argumentation in education (eg. lack of resources) can be overcome by the use of specialized computer systems that either help in the representation of argument structures or even generate new arguments or make automated analysis of an argument structure. The current paper tries to provide a review of the ways argumentation and learning are connected and what are the latest developments in the specialized computer systems that use argumentation tools to enhance education.
2. ARGUMENTATION AND LEARNING
2.1. Scaffolding learning with argumentation
From the point of view of the education process, we can distinguish two types of argumentation: the competition argumentation, where the purpose of the participants is to convince their counterparts to assume their position on a specific topic and the collaborative argumentation, where the purpose is to test all possible ideas regarding a topic in order to reach the best possible outcome. The competition type argumentation is the more visible type of argumentation in day-to-day life. Political candidates oppose different views on TV, people have opposing opinions on whom to trust and what course of action to take in various moments. Since the goal of such arguments is not to work together toward a common position, but simply to score points in order to convince either the opponent(s), or in some cases (as in politics) the public, it has been argued (Andriessen, 2006) that this type of debate has little to none educational benefit. However, since the purpose of any competition is to be won, winning an argument is a strong motivation for learning new concepts and facts that can support one's claims or help to refute the opponent's arguments. There is also a secondary learning benefit from competition arguments: even if one researches a specific topic and tries to understand all issues related to it, a different person might take a different approach and still come up with new information. However, one must take into account the fact that, the manner in which the opponents will be lead to expand their knowledge in order to win the argument is strictly related to the context of the argument:

Computer-Based Reasoning Systems: An Overview 55
a formal debate competition requires strong scientific preparation that may lead all involved parties to try to get a deeper understanding of all issues relating to the topic;
an informal debate may not have such a positive educational effect, but could even create more confusion since “many people have trouble arguing productively.
They are not good at distinguishing evidence from theory, and do not tend to consider alternative positions ” (Andriessen, 2006). In the case of collaborative argumentation, since the purpose is not to win or convince the opposition or the public, the educational effects are even more obvious. The participants are not primarily attempting to convince each other, they are instead engaged in cooperative explorations of a dialogical space of solutions (Nonnon, 1996). Collaborative argumentation has been found to have an important role in research – advances in science is not obtained by the accumulation of facts, but by opposing different views and testing their strengths and limitations with the help of peers.(Bell, 2004) Another interesting observation is that argumentation fosters transversal learning, by forcing the participants to put together in a logical fashion, data, concepts and knowledge from various domains. To back their positions or contradict the opposing positions, participants must find different types of proofs, from expert opinions to statistical data or demonstrations, which in turn exposes them to more information and leads to the construction of deep understanding.
2.2. Direct application of argumentation in education
Argumentation and its related techniques and methods have obvious limitations in the possibilities of being implemented in formal educational settings. Using argumentation one could not possibly learn how to solve a second degree equation and it would be of no use in trying to master a programming language. Thus argumentation is useful especially in ill-defined domains as defined above. Most studies so far investigated the use of argumentation in three major areas: critical thinking, law and essay writing, though it seems plausible that it can be used in other domains, such as music appreciation, ethics, philosophy or others. Critical thinking is a domain with a fair amount of attention, even though “there is no generally accepted, well-defined list of skills that constitutes the set we call 'critical thinking skills'” (Harrell, 2007). For the scope of this paper we will consider critical thinking as “the intellectually disciplined process of actively and skillfully conceptualizing, applying, analyzing, synthesizing, and/or evaluating information gathered from, or generated by, observation, experience, reflection, reasoning, or communication, as a guide to belief and action" (Scriven, 1987). The practice and education of law is also linked with the theory of argumentation. There are several computer-based systems such as Carneades (Gordon, et al., 2007), ArguMed (Verheij, 2003) or LARGO (Pinkwart, et al., 2006), that reported good results in teaching legal argumentation by means of tests that interpret

56 Cucu, C. laws, legal principles, or precedence cases in a specific way to decide the current situation at hand (Scheuer, et al., 2010). Essay writing is another ill-defined domain where argumentation proved to be an effective method of learning, with studies showing that students who used this method performed better at writing esseys than student who studied philosophy in a traditional manner, even with less writing practice (Burns, 2012). 3. COMPUTER – BASED REASONING SYTEMS
3.1. Rationale of developing Computer-based Reasoning Systems
By Computer-based Reasoning Systems (CBRS) we understand any computer application that can be used to support the creation, practice, analysis or graphical representation of an argument structure. Such systems have started being developed in the late '80, following the advances in artificial intelligence, with two main goals in mind: to instruct people – both in argumentation itself, but also in other subjects such as law and to help with the decision – making process in complex, unstructured problems. The evolution of CBRS refined their rationale, that we have summarized in the points below:
Education: CBRS act as a practice field for skills such as critical thinking.
Research: CBRS are being used in research both as collaborative tools, allowing researchers to oppose views in a structured environment that may lead to the new ideas or solutions (Gordon, et al., 2007).
Productivity: CBRS are being used in the corporate environment as productivity tools, either as Decision-support tools (Moon, 2009), either to act as support for meetings and other forms of dialogue-based collaboration (Conklin, 2006).
Mixed: many systems might have two / three layers – a productivity system can be used in corporate training so it has an educational purpose; a system that implements a formal argument model can be used to investigate the strengths and limits of said model and so on.
3.2. Types of Computer-based Reasoning Systems
When analyzing the different types of CBRS, we looked at both form and functionality, to get a better picture of how these systems are organized, how closely they follow a specific theory of argumentation and to what degree they can provide automation to tasks such as argument creation or argument analysis / evaluation. The following points summarize our findings:

Computer-Based Reasoning Systems: An Overview 57
Strict systems: focused specifically on argumentation; modeled keeping argumentation theories in mind. They are less flexible (i.e. users can only use them in argumentation-related contexts) and more formal.
Automated reasoning systems: automatically perform reasoning on the basis of the information in their 'knowledge base'. Examples: Carneades (Gordon, et al., 2007), ConvinceMe (Adams, 2003).
Argument mapping: allow the creation of argument maps - graphical representation of an argument structure. Examples: iLogos (http://www.phil.cmu.edu), Raționale (rationale. austhink.com), Araucaria (rationale.austhink.com/).
Argument assistance: systems that aid in drafting and generating arguments, by administering and supervising the argument process. Examples: ArguMed (http://www.ai.rug.nl/ ~verheij /aaa/argumed3.htm).
DMS – debate management systems: content management websites specialized on asynchronous argumentation; they are usually human-maintained and serve as “practice space” for any user that wants to debate a given issue. Examples: Debatabase (idebate.org), Truthmapping (truthmapping.com).
Loose systems: systems that have a broader scope and allow different types of relation definitions not related with a specific theory, such as mind maps. Examples: Cohere (http://www.cohere. open.ac.uk/), DialogueMapping (Conklin, 2006).
Derrivative: systems that are complementary in some way to CBRS. They focus on specific sub-points (e.g. logical proof, causality) but do not implement a full reasoning-model. Eg.: APROS (http://cohere.open.ac.uk/), Causality Lab (http://cohere.open.ac.uk/).
3.3. Main CBRS with focus on education
During the last decade, there have been developed more than a few interesting Computer-based Reasoning Systems with focus on education. However, some of these have been discontinued and even if they can still be found on-line, we believe it is best to focus on the most updated and document systems that can be used by researchers and educators in their own projects. The main systems we have identified are summarized in Table 1.

58 Cucu, C.
Table 1. Educational computer-based reasoning systems overview
System Type Purpose
(education) Automation Obs.
Rationale Argument Mapping
Critical Thinking, Essay writing
No Update for Reason!Able http://rationale.austhink.com/
LASAD Mixed: implements visual, analytic, and pedagogic components
Background in law-argumentation; updated to a broader scope including critical thinking and argumentation
YES Update for LARGO. Domain independent. http://cscwlab.in.tu-clausthal.de/lasad/
Carneades Automated reasoning
Argumentation. Focused on the legal domain
YES http://carneades.berlios.de/
Argunaut Argument assistance
Cross-domain learning objectives
YES http://www.argunaut.org
Wise
Mixed: concept mapping, debate management
Cross-domain collaborative learning
NO implements several other tools (e.g simulations) http://wise.berkeley. edu
4. CONCLUSIONS The current paper focused on analyzing the connections between argumentation and education, emphasizing the importance of argumentation in critical thinking, essay writing, law and other ill-defined domains. Since such topics are difficult to teach in a traditional manner we looked for possible computer-based solutions. We have found a strong interest in developing and implementing computer systems that use some theory, method or representation of argumentation as educational tools - Computer-Based Reasoning Systems. While not all CBRS are used in education, most have at least some educational benefit. Since they vary in type and domain of, we have summarized the main types in order to provide a map of what is achievable and through what means. We have also looked at the main systems developed in the last decade or more and found an interesting fact: most systems have been abandoned after periods of testing and research, mostly due to the fact that they have been seen as research experiments in the first place. Although some of these can still be found, it is highly unlikely that they can be used in education or can be developed further.

Computer-Based Reasoning Systems: An Overview 59 From the systems that have been updated we chose to highlight five systems, one of each major type, that could be used directly in the classroom (with just a little training) or could be used as a starting point for new research into learning by argumentation. REFERENCES: [1]. Adams, S. (2003) Investigation of the "Convince Me" computer environment as a tool for
critical argumentation about public policy issues, Journal of Interactive Learning Research 14(3), 263-283
[2]. Andriessen, J. (2006) Arguing to Learn, in: K. Sawyer (Ed.) Handbook of the Learning Sciences (pp.443-459), Cambridge: CambridgeUniversity press
[3]. Bell, P. (2004) “Promoting students' argument construction and collaborative debate in the Science classroom, in M. C. Linn, E. A. Davis, & P. Bell (Eds.), Internet Environments for Science Education, Mahwah, NJ: Lawrence Erlbaum
[4]. Burns, M. (2012) No Debate: Kids Can Learn By Arguing, in Pacific Standard Magazine, Available online (30.10.2012) at: http://www.psmag.com/education/no-debate- kids-can-learn-by-arguing-38932/
[5]. Conklin, J. (2006) Dialogue Mapping: Creating Shared Understanding of Wicked Problems, Wiley and Sons
[6]. Gordon, T.F.; Prakken, H.; Walton, D. (2007) The Carneades model of argument and burden of proof, Artificial Intelligence, 171(10–15), 875–896
[7]. Harrell, M. (2007) Using Argument Diagramming Software to Teach Critical Thinking Skills, Carnegie Mellon, Department of Philosophy, Paper 349
[8]. Lynch, C.F.; Ashley, K.D.; Aleven, V.; Pinkwart, N. (2006) Defining “Ill-Defined Domains”, A literature survey
[9]. Moon, P. (2009) Potent tool for making decisions, Australian Financial Review, Tuesday, 28 July, p.32
[10]. Nonnon, E. (1996) Activités argumentatives et élaboration de connaissances nouvelles: Le dialogue comme espace d'exploration, Langue Francaise, 112, 67-87
[11]. Pinkwart, N.; Aleven, V.; Ashley, K.; Lynch, C. (2006) Toward legal argument instruction with graph grammars and collaborative filtering techniques, in M. Ikeda, K. Ashley, & T. W. Chan (Hrsg.), Proceedings of the 8th International Conference on Intelligent Tutoring Systems, pp. 227–236, Berlin, Germany: Springer
[12]. Scheuer, O.; Loll, F.; Pinkwart, N.; McLaren, B.M. (2010) Computer-Supported Argumentation: A Review of the State of the Art, International Journal of Computer-Supported Collaborative Learning, 5(1)
[13]. Scriven, M.; Paul, R.W. (1987) Critical Thinking as Defined by the National Council for Excellence in Critical Thinking, Available online (02.11.2012) at: http://www.criticalthinking.org/pages/defining-critical-thinking/766
[14]. Toulmin, S. (2003) The uses of argument, Cambridge, U.K. New York: Cambridge University Press
[15]. Verheij, B. (2003) Artificial argument assistants for defeasible argumentation, Artificial Intelligence, 150(1–2), 291–324
[16]. http://araucaria.computing.dundee.ac.uk [17]. http://cohere.open.ac.uk/ [18]. http://idebate.org/

60 Cucu, C. [19]. http://rationale.austhink.com/ [20]. http://www.ai.rug.nl/~verheij/aaa/argumed3.htm [21]. http://www.phil.cmu.edu/projects/argument_mapping/ [22]. http://www.phil.cmu.edu/projects/apros/ [23]. http://www.phil.cmu.edu/projects/causality-lab/ [24]. http://www.truthmapping.com

Annals of the University of Petroşani, Economics, 12(4), 2012, 61-76 61
THE ANALYSIS OF THE BEER SECTOR IN ROMANIA
OANA DOBRE-BARON *
ABSTRACT: This study aims to analyse a sector of the Romanian economy which is currently among the most sustainable. It is about production and marketing of beer, a product with a long and rich history around the world but also in Romania. The analysis covers a period of seven years and takes into account the dynamic evolution of those market-specific indicators such as: production, consumption, imports, exports, workforce involved, the contribution to the state budget, etc.
KEY WORDS: sector of activity; beer sector; beer market; production of beer; consumption of beer; beer sales; import and export of beer; workforce.
JEL CLASSIFICATION: E2; L66. 1. INTRODUCTION
As the human society has evolved, our needs as well as the ways to satisfy
them have evolved so that today we encounter only a few goods that we consume like thousands of years ago. Considered over time either a food or a drink, or even remedy against diseases beer held out until today.
The first beers dates back to the dawn of civilization when man became from nomadic a farmer and started to conserve grains, and will discover the drink that would become a true and vital "lymph" of a complex and evolved society. Babylonians knew over 20 different ways for making beer. Because beer is consumed in large amounts, the Babylonians developed the first regulation that regulate consumption of alcoholic beverages and operation of the profile venues. In medieval Europe, beer came to be manufactured in monasteries. Monks improved manufacturing technology, using flowers of hops as a preservative. In the nineteenth century, along with the industrial revolution, the process of manufacturing beer was mechanized, which has been a milestone in the history of this drink so popular.
* Assoc. Prof., Ph.D., University of Petrosani, Romania, [email protected]

62 Dobre-Baron, O. 2. THE BEER MARKET IN ROMANIA
True mass production of beer on Romanian territory dates back to the early
19th century when Johann de Gotha inaugurated in 1809, on the outskirts of Bucharest, a beer factory which was destroyed by fire during the revolution from 1821. Starting with the second half of the 19th century, the emergence of several beer factories translates into the inauguration of numerous breweries, some of which have only ephemeral life. Very quickly brewery becomes an "institution" and especially an important meeting point for journalists, politicians and theater people.
Bucharest breweries ambiance from the turn between the two centuries, often transpires in the Caragiale's novellas thanks, in large part, to his experience of "beer salesman."
In more recent history, 22 years ago, the beer market in Romania meant only a few brands such as Azuga, Aurora, Mountains, Malbera, and those only with zonal spreading. In the '88-'89 for the Romanians from the province which did not attend in the summer at sea or in Bucharest, a few bottles of beer became a true delicacy.
After 90s, the situation began to change, the market being gradually invaded by numerous brands of beer, their number currently surpassing 50. This is explained by many regional producers and suppliers in the market that all tried to launch at least one, if not several brands in every segment of the market.
In the period after 1990, the beer industry has experienced a great development concretized in the following stages of development:
In the period 1990-1994 there have been built by the local investors 74 beer factories, totaling a capacity of 1,101 thousand hl / year (small and medium capacities ranging between 5-100 thousand hl / factory), these companies being located throughout the country. These companies were later closed for financial reasons (undifferentiated excises being one of the most important) in the period 1995-2000.
Since 1995 foreign investors have purchased a total of 15 large capacity beer factories for Romania (500-600 thousand hl / year / company) which accounted a total annual capacity of approximately 7,000 thousand hectoliters. Those acquisitions were motivated by the low price of these units, because of the way privatization was carried out in Romania in that period as well as by the need of these companies to transfer in Romania second hand equipment to upgrade factories that they have bought. This was followed by the 2000s period when the multinational companies have closed approximately 33.3% of the purchased capacities and proceeding to the expanding of other existing capacities.
Should be noted that the SME group from the beer industry (companies incorporated before 1990) was not taken up by the multinational companies for capacity reasons. Currently from a number of 22 units existing at the end of 1999, only 6 companies have managed to stay on the market.
All beer factories organized themselves in the 4th quarter of 1991, in an employers' organization to which have acceded multinational companies, that have come in Romania after 1995.
In early 2004, independent brewers unhappy with how multinational companies have managed their interests, and how the the activity was directed in the former

The Analysis of the Beer Sector in Romania 63 patronized of beer (in which decisions were taken by vote, depending on the amount of beer made), decided the separation from and the establishment of a the multinational patronized to represent their interests in dialogue with the state institutions or non-governmental ones [4].
The Independent Beer Producers Companies Patronized from Romania is an employers' non - profit association that represents the interests of independent breweries in Romania. It was founded in March 2004 through the association of approximately 25 local manufacturers, producers representing an important link in the Romanian beer industry, located in more than 20 counties of the country (Tg. Mureş, Prahova, Galaţi, Suceava, Teleorman, Neamţ etc.).
But beer market boom began soon after 1990 when the first international group started its operations in Romania, Brau and Brunnen (B & B) purchased the beer factories from Ursus (Cluj) and Eagle (Pitesti), but in 1996 he decided to focus on other markets and withdrew from Romania. SAB Group (South African Breweries) bought from B & B its two factories and purchased Pitber (Pitești) and Timişoreana.
The next group which entered the local beer market was Interbrew, which in 1994 bought Bianca (Blaj) and Proberco (Baia Mare). In 1999, Interbrew concluded a contract with the Ephesus factory (Ploiesti), in 2001 becoming the sole shareholder.
United Romanian Breweries (Tuborg) initiated the first "greenfield" project and building a brewery near Bucharest.
The Austrian group BBAG through his division of beer - Brau Union, entered the Romanian market in 1996 by acquiring the majority stake from the beer factory Arbema Arad. In 1997 were purchased Bere Craiova and Malbera Constanta and in 1998 Silva Reghin. BBAG group made in 2000, a major acquisition, namely the one of the Brewery Holding group, with three factories - Griviţa Bucureşti, Bere Miercurea-Ciuc and Haber Haţeg. All groups have a highly supported activity in all segments of the market, including in the non-alcoholic beer segment. Basically, there was no market segment that has not been attacked, except the mix drinks - mix of beer with cola or other sodas.
To enter the Romanian market a brewing firm must invest around 70 million euros. Out of the 125 small beer producers that existed ten years ago in Romania, only 26 were able to cope. Experts say that the market is already seated, and the emergence of a new competitor is highly unlikely. Only a global manufacturer can succeed, but only if it is willing to invest a fairly large amount of money. In Romania, the beer market is already consolidated, mature, highly competitive, a market where are present four of the top five global beer producers.
The major players in the beer market, which occupy more than 70 percent of the relevant Romanian market, constituted "Brewers of Romania" (BR), which is open to all producers who share the mission and objectives set. Brau Union Romania, Romania Beer Company (CBR), Interbrew Romania and United Romanian Breweries Bereprod (URBB) have established the "Brewers of Romania" with the mission to promote and develop in Romania a responsible and strong beer industry.
Romanian Brewers Association was established in 2004 with the mission to promote and develop responsible and strong beer industry in Romania.

64 Dobre-Baron, O.
From the desire to ensure a healthy business environment in the production of beer nationwide, five of the largest companies operating in the market in Romania are currently members of the association: Bergenbier, HEINEKEN România, Romaqua Group, Ursus Breweries and United Romanian Breweries Bereprod. Together these five manufacturing companies provides over 90% of the beer consumed in Romania.
With the correct and whole vision over the complexity of the process that it involves the production of a quality beer, in 2010, Romanian Brewers Association has opened its doors to welcome among its members the most important national producer of hops and malt, materials needed for the beer production: Association of Hops Producers and Soufflet Malt România.
Permanently eager to expand its membership, since 2011 a new brewer joined the existing ones: Beer Clinic. Headquartered in Timisoara, Beer Clinic is a microfactory that will successfully complete the joint efforts towards the development of beer culture in Romania.
As a consequence of its mission according to the one of the countries from the European Union since January 2008, the Association became a member of "Brewers of Europe" organization considered representative of the European beer industry before various international institutions and organizations. Founded in 1958 in Brussels, the organization now has 27 members and represents the interests of approximately 4,000 producers in the beer industry from Europe. Moreover, the Brewers of Europe represents and defends the interests of more than 2 million people who owe their jobs to the production and sale of beer (Broşura ABR, 2012, p. 4). 3. THE ROMANIAN BEER MARKET ANALYSIS IN THE PERIOD 2004-2011 3.1. The beer industry in Romania
The beer market in Romania is characterized by rapid growth sustained by the development of the economy and increasing purchasing power of the population. For several years, "Brewers of Romania" Association which brings together the largest brewers in our country is growing faster than the market.
In the analyzed period there has been a steady increase in beer sales both in the overall market, as well at the level of Brewers of Romania Association (BR), up to 2008. It is important to note that in 2004 "Brewers of Romania" owns about 67% of total market sales, and in 2011 they have come to cover 91.7% of total sales, aspect that is due on the one hand to the fact that Romaqua Group joined the Association in 2009, but also due to a decrease in recent years in the number of small beer producers in Romania.
The economic crisis started in 2009 has also been felt in the beer industry, which recorded its first decline in six years, from 20.2 million hectoliters (hl) sold in 2008 to 17.6 million hl in 2009. Overall, in 2009, the beer market fell below the figures recorded three years ago when have been sold 17.7 million hl. (Table 1). In 2010, the unstable economic environment that affected consumers and their habits determined a decrease in the beer market by 3.5% over the previous year, reaching a total volume of 17 million hectoliters. The total volume of beer market reached 17 million hl in 2011,
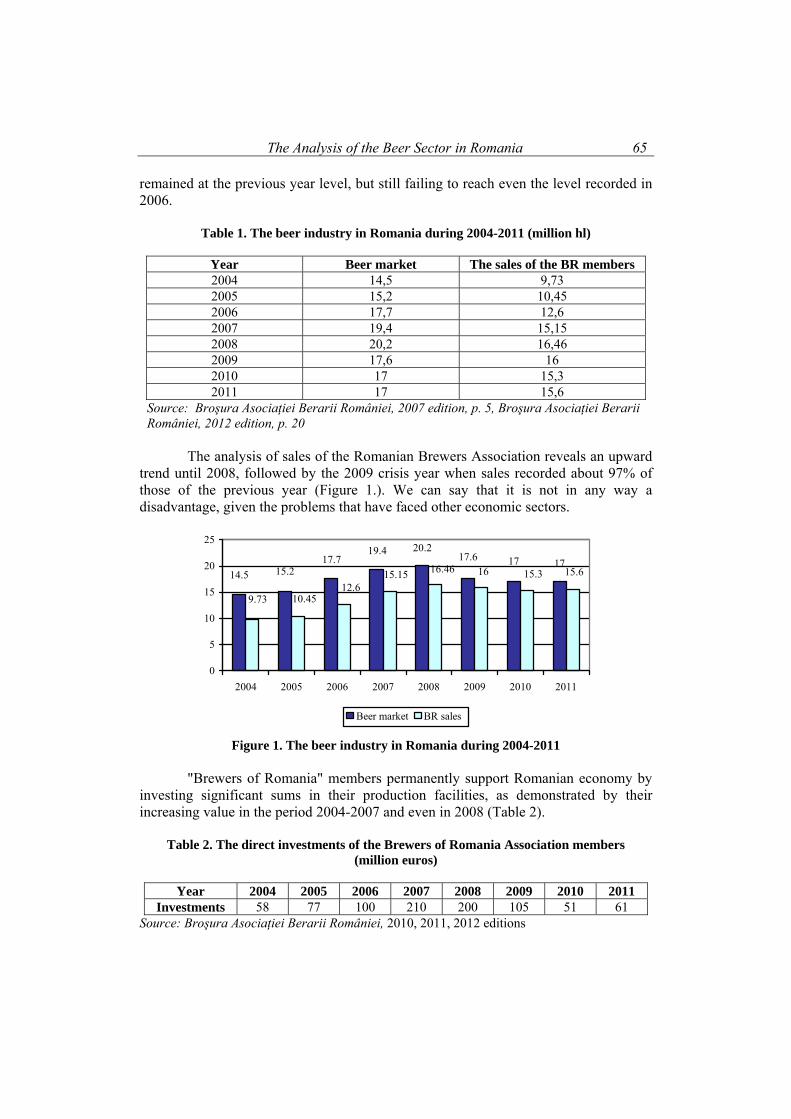
The Analysis of the Beer Sector in Romania 65 remained at the previous year level, but still failing to reach even the level recorded in 2006.
Table 1. The beer industry in Romania during 2004-2011 (million hl)
Year Beer market The sales of the BR members 2004 14,5 9,73 2005 15,2 10,45 2006 17,7 12,6 2007 19,4 15,15 2008 20,2 16,46 2009 17,6 16 2010 17 15,3 2011 17 15,6
Source: Broşura Asociaţiei Berarii României, 2007 edition, p. 5, Broşura Asociaţiei Berarii României, 2012 edition, p. 20
The analysis of sales of the Romanian Brewers Association reveals an upward
trend until 2008, followed by the 2009 crisis year when sales recorded about 97% of those of the previous year (Figure 1.). We can say that it is not in any way a disadvantage, given the problems that have faced other economic sectors.
171717.620.219.4
17.715.214.5 15.615.31616.4615.15
12.610.459.73
0
5
10
15
20
25
2004 2005 2006 2007 2008 2009 2010 2011
Beer market BR sales
Figure 1. The beer industry in Romania during 2004-2011
"Brewers of Romania" members permanently support Romanian economy by
investing significant sums in their production facilities, as demonstrated by their increasing value in the period 2004-2007 and even in 2008 (Table 2).
Table 2. The direct investments of the Brewers of Romania Association members (million euros)
Year 2004 2005 2006 2007 2008 2009 2010 2011
Investments 58 77 100 210 200 105 51 61 Source: Broşura Asociaţiei Berarii României, 2010, 2011, 2012 editions

66 Dobre-Baron, O.
Members of "Brewers of Romania" developed significant investment projects in their production facilities proving in this way their permanent support to the Romanian economy. Basically they have doubled the amount of investments in 2008, compared to the previous year, thus registering the highest level of investments in the period under review (Figure 2.).
6151
105
200210
10077
58
0
50
100
150
200
250
2004 2005 2006 2007 2008 2009 2010 2011
BR investments
Figure 2. The evolution of Brewers of Romania Association direct investment
during 2004-2011 (million euros)
Direct investments of the members in 2009 amounted to almost 105 million, representing a decrease of almost 50% from the previous year, and this in a year that has registered, unlike 2008, an overall decrease of net investments at the national economy level of 22.5%, according to INS (Broşura ABR, 2010, p. 8). Members operates in 11 beer factories on Romanian territory situated in: Blaj, Braşov, Buzău, Cluj-Napoca, Constanţa, Craiova, Miercurea-Ciuc, Pantelimon, Ploieşti, Sebeş and Timişoara.
The sales made at the level of "Brewers of Romania" attained a volume of 15.3 million hectoliters in 2010, with less than 4.4% compared to 2009, while investments decreased due to lower investments in the national economy as a whole. These totaled an amount of 51 million euros, with less than about 50% compared to previous year.
The sales made at the level of Brewers of Romania Association have reached a level of 15.6 million in 2011. Considered a real recovery engine sales and a way to strengthen the business, the investments made by members of the Association in 2011 recorded an increase of 10 million euros compared to the previous year, bringing them to 61 million euros. 3.2. The beer consumption in Romania
Romanians consumed on average 81 l per capita in 2006, which means an increase of 16% compared to previous year. Average consumption rates in other European countries with a strong beer culture are: Czech Republic 160 l, 118 l Germany, Austria 111 l, 106 l Luxembourg, Belgium 96 l, 90 l Denmark, Finland 84 l, 81 l of Lithuania, Spain 79 l and Netherlands 78 l (Broşura ABR, 2007, p. 8).
A Romanian consumed on average 89 liters of beer in 2007, by almost 10% more than the previous year. Romanians consume, on average, a glass of beer per day, according to the "Brewers of Romania" (ABR). Well, it comes to all Romania, with

The Analysis of the Beer Sector in Romania 67 children, women, elderly, vegetarians, etc. If we reduce the number of beer drinkers in half, we find a daily amount of a bottle (0.5 liters), figure closer to reality. But it comes to the reality of 2009because in 2009 consumption decreased by 13% compared to 2008. More specifically, the average consumption was 81 liters of beer in 2009 (per capita, not drinkers), down from 93 liters in 2008 and then returned to the figures recorded in 2006. In other words, the crisis that hit soundly consumption in general convinced us to drink less beer per week. The decrease in 2009 is the first after five years of climb. Beer consumption per capita has followed the same downward trend as the beer market, reaching the value of 78 liters in 2010 (Table 3.).
Table 3. The beer consumption per capita in Romania during 2004-2011 (liters)
Year 2004 2005 2006 2007 2008 2009 2010 2011 Consumption 66 70 81 89 93 81 78 89
Source: Broşura Asociaţiei Berarii României, 2007, 2008, 2009, 2010, 2011, 2012 editions
Calculated having as reference the data provided by the last Romanian census, the consumption of beer per capita in 2011 reached the value of 89 liters.
Analysis of data concerning beer consumption per capita in our country retroactively recalculated corresponding to the latest data from census shows some differences from the values presented annually and shows that consumption has an upward trend during the period 2004-2008, after which it stabilizes around 89 liters in the next years, with about 10% less than the highest recorded value, which is in 2008 (Figure 3.). This is due of course to the fact that population incomes declined after 2009, bringing after them a fall in consumption.
89888910094
8571
66
0
20
40
60
80
100
120
2004 2005 2006 2007 2008 2009 2010 2011
Figure 3. The evolution of beer consumption per capita in Romania
during 2004-2011 (liters)
All market studies show that beer remains the preferred drink of the Romanians, nearly six out of ten people aged over 18 who consume alcohol choose this product when they are meeting with friends. Half of them are used to drink beer with food, according to an analysis made by GfK Romania, at the request of Brewers of Romania Association [5].
In a ranking by regions Oltenia inhabitants lead the way, they choosing beer for more than 78% when they meet with friends, followed by residents of Muntenia

68 Dobre-Baron, O. with a percentage of 60.34%, and the Bucharest inhabitants, which have a share of 58%, and the inhabitants of Dobrogea, with 56.5%.
At European level, in 2010, the Romanians were ranked the seventh among beer consumption per capita, with an average consumption of 88 liters of beer, compared to a European average of 80 liters per capita. First place was taken by the Czechs, which annually consumes with 56 liters more than the Romanians, exactly 144 liters of beer per capita, they being followed in ranking by the Germans with 107 liters of beer, Austrian with 105 liters of beer and Norwegians, who drink about 105 liters of beer per year per capita.
About 28% of all beer consumed in Romania is sold in restaurants and bars, the beer sales in this segment being approximately 800 million euros, according to an Ernst & Young study, which took into account the average price per liter for beer in bars and restaurants, of 1.7 euro per liter including VAT.
The same study also shows that the rest of the 72% of the total beer consumption in Romania - 12.2 million hectoliters - is sold in supermarkets and other retail units. Taking into account an average selling price of 0.8 euros per liter, including VAT, appears that Romanians have spent on beer bought from supermarkets 991.4 million euro.
In total, sales of beer in Romania in restaurants, bars and supermarkets reach about 1.8 billion euros, according to Ernst & Young. 3.3. The sales of beer by packaging types
On the Romanian beer market there are many types of packaging: returnable bottles, aluminum cans, barrels and PET containers. The PET packaging has a significant market share, which distinguishes Romania towards other European countries, and in 2007 recorded a slowdown in growth that it held in recent years, while the dose packaging climbs the top of the preferences of consumers.
In 2008, sales in the segment of dose packing increased 25%, Romanian consumers preferring this type of packaging. In terms of sales on the packaging segments, 2009 confirming the consolidation of the Romanian consumer preferences, the changes being minor: PET 46.7%, dose 14.8%, glass 35.3% and draught 3.2%. The same thing can be observed in 2010 (Table 4).
Table 4. The beer consumption by type of packaging in Romania during 2004-2011 (%)
Year 2004 2005 2006 2007 2008 2009 2010 2011 PET 24,4 31,4 40,4 45,6 46,5 46,7 49,3 51,3 Dose 8 7,8 8,7 10,4 13 14,8 16 14,8 Glass 61,9 54,5 46,2 40,5 37,5 35,3 31,7 30,2
Draught 5,7 6,3 4,7 3,5 3 3,2 3 3,7 Source: Broşura Asociaţiei Berarii României, 2007, 2008, 2009, 2010, 2011, 2012 editions
Observing the data in the table above, we can say that within just eight years
preferences for beer in PET packaging have doubled in 2011, reaching to hold more than half of consumption in our country. The same situation, although not as

The Analysis of the Beer Sector in Romania 69 spectacular is recorded for the beer on dose, but the situation is the opposite for glass, from 61.9% in 2004 to 30.2% in 2011. Only draught beer consumption remains relatively unchanged.
For 2011, consumer preferences regarding packaging of beer have had only small fluctuations from the values recorded in 2010, they recorded for PET - 51.3% (+2% from the previous year), glass - 30.2% (-1.5% from the previous year), dose - 14.8% (-1.2% yoy) and draught - 3.7% (+0.7% from the previous year). (Figure 4.)
The packaging that has revolutionized beer sales in Romania, PET, and which which has come to represent half of local consumption can not be ignored by traditional European brands, while producers face decreasing consumption and the need to maintain sales by products adapted to the new market order.
Recently, Bergenbier, number three on the local market, decided to use PET packaging for the Czech brand with a long tradition, Staropramen. Launched in 1869, Staropramen is a brand present on 30 markets worldwide and in Romania was brought to half of last year, and it was initially packaged in bottles of 0.33 liters, 0.5 liters, and at dose of 0.5 liters. [7] Staropramen Czech factory did not have in 2011 a packaging line for PET. However, from February 2012 the Romanian producer decided to package this brand in PET of one liter, packaging that will be available in both modern trade and in the traditional one and the targeted consumer is the one from the urban environment with average incomes and above average.
30.20%
51.30%
3.70%14.80%
PET Glass Dose Draught
Figure 4. The share of beer sales by type of packaging in 2011 (%)
The movement may seem surprising for a Czech brand, especially since three
or four years ago, the factories in the Czech Republic, the country with the highest consumption of beer per capita in Europe (160 liters), just experimenting "PET beer" and in 2008-2009 this segment did not reached even to 0.05% of the market. From more than 16 million hectoliters of beer sold in 2008 in Czech Republic, sales in the PET packaging have been 7,403 hectoliters.
On the other hand, the figures show that in Romania this type of packaging makes the law and come to represent half of a market of nearly 17 million hectoliters annually. In 2000 the PET packaging covered only 2% of the local market. Other European countries where this type of package has a stronger presence are Germany, Serbia and Ukraine.
Moreover, the PET helps Romania being placed among the cheapest beer markets in retail. A report on the beer industry conducted by Ernst & Young [6] and published on the website of European Brewers Association show that Romania is

70 Dobre-Baron, O. placed third in the ranking of markets where consumers find the cheapest beer in both retail as well as restaurants and bars, being surpassed only by the Czech Republic and Bulgaria. Thus, a liter of beer purchased from stores in Romania costs 0.8 euros, almost as in Bulgaria (0.79) and Czech Republic (0.75%), and half against the European average of 1.7 euro / liter, as shown by the survey data quoted. The strong presence in the local beer industry of PET makes that more than 70% of beer consumption to take place at home, unlike the Czech Republic, where the restaurants and the pubs covers half of the consumption. Thus the Romanians give nearly a billion euros annually on beer purchased in retail, while in Czech Republic this segment value is 575 million euros, according to the Ernst & Young report. 3.4. The import and export of beer
In Romania the share of imports in the beer market is still small, which clearly
demonstrates that the Romanians prefer beer produced in the country. In 2006 imports were at a level of about 0.4%. As regards the exports this recorded spectacular increases in percentages in 2006, but still represents a small part of the entire production (Table 5).
Table 5. The import and export of beer during 2004-2011 (million hl)
Year 2004 2005 2006 2007 2008 2009 2010 2011
Import 0,059 0,028 0,032 0,076 0,5 0,17 0,22 0,27 Export 0,024 0,056 0,076 0,026 0,06 0,17 0,14 0,17
Source: Broşura Asociaţiei Berarii României, 2007, 2008, 2009, 2010, 2011, 2012 editions
Although the integration in the European Union from 2007 has led the market in Romania in the Community, the share of imports in the beer market is still insignificant. Romanians consume almost the entire domestic production of beer, the share of imports being below 1%. As for exports, they decreased reaching the level of 2004. In 2009, exports increased from 0.06 million hl in 2008 to 0.17 million hl, while imports declined from 0.5 million hl to 0.17 million hl.
0.028 0.032
0.270.22
0.17
0.5
0.0760.0590.026
0.06
0.17 0.140.17
0.0760.0560.024
0
0.1
0.2
0.3
0.4
0.5
0.6
2004 2005 2006 2007 2008 2009 2010 2011
Import Export
Figure 5. The evolution of beer imports and exports in the period 2004-2011 (million hl)

The Analysis of the Beer Sector in Romania 71
In 2010 the situation changed, so that the imported beer has increased, totaling 0.22 million hl, while exports decreased slightly, to 0.14 million hl, which indicates a consumer orientation to beer specialties (Figure 5).
The year 2011 is characterized by a slight increase in the import of beer, totaling 0.27 million hl and in terms of exports, they also showed a slight increase, reaching 0.17 million hl. The indicators presented in the figure above are mainly characterized by the fact that both imports and exports increased and decreased, the highest level for imports being recorded in 2008. In general, we can say that for the most part of the period beer imports exceeded exports, but in 2009 the two values were equal. 3.5. The beer industry contribution to the state budget
At national economy level, the beer industry emerges as a serious contributor
to the state budget. Due to the large share that Romanian Brewers Association has in our country beer market, the data provided by them in the newsletters are relevant so that we can make a real picture of the level of these fees on the entire industry.
Taxes, representing excise, VAT and direct taxes for employees, which the Brewers of Romania Association members pay them every year, without delay, to the Romanian state, demonstrates their influence and importance to the state budget.
In 2009, members of the Romanian Brewers Association had over 6,300 employees across the country, contributing with more than 1.3 billion in the last six years to Romanian budget through various taxes - such as VAT, excise, personal duties and contributions to the social insurance. This year, in the context of increasing excise duty and of the competitive economic conditions, the direct contribution of the members to the state budget remained at over 263 million, with only 9 million less than in 2008 (Table 6). Table 6. The Brewers of Romania Association members contribution to the state budget in
the period 2004-2011 (million euros)
Year 2004 2005 2006 2007 2008 2009 2010 2011 Contributions 122 167 214 264 272 263 270 272
Source: Broşura Asociaţiei Berarii României, 2007, 2008, 2009, 2010, 2011, 2012 editions Although in 2010 the unfavorable economic conditions do not change, the
contribution to the state budget through various taxes (VAT, excise, personal duties and social insurance contributions) of the Association members reached the threshold of 270 million euros, increasing by 7 million euros compared to 2009, and in 2011 the contribution reached the threshold of 272 million euros, increasing by 2 million euros compared to 2010. It is noted thus a first period of sharp increase in contributions since 2004, then from 2007 their value shows only slight variations by the end of the analyzed period. So in 2011 contributions were nearly 2.5 times higher than in 2004.

72 Dobre-Baron, O.
122
167
214
272270263272264
0
50
100
150
200
250
300
2004 2005 2006 2007 2008 2009 2010 2011
Figure 6. The evolution of the Romanian Brewers Association members contribution to
the state budget in the period 2004-2011 (million euros) 3.6. The workforce in the beer industry
At this point, the five member companies of the Association offers a number of
over 4,100 jobs within ten beer factories in different cities, such as Ploieşti, Constanţa, Craiova, Miercurea Ciuc, Târgu-Mureş, Sebeş, Pantelimon, Timişoara, Buzău, Braşov.
Although the number of employees is quite important, even this sector has experienced a number of changes due to the effect of economic rebound, strongly felt at the investments level but especially at the labor force level, due to the closure of some important beer factories. Thus in 2011 the number of jobs provided by the Romanian Brewers Association is close to the value recorded in 2006 and represent 61.19% of the number of jobs offered in 2008 (Table 7.)
Table 7. The number of workplaces offered by the "Brewers of Romania" producers during 2006-2011
Year 2006 2007 2008 2009 2010 2011
Number of workplaces
4200 4400 6700 6300 4100 4100
Source: Broşura Asociaţiei Berarii României, 2007, 2008, 2009, 2010, 2011, 2012 editions
125 114
74
53 4731 23
8
0
20
40
60
80
100
120
140
1993 1995 1997 1999 2001 2004 2006 2010
Figure 7. The evolution of the number of beer factories belonging to the small producers
in Romania in the period 1993-2010

The Analysis of the Beer Sector in Romania 73
The two companies producing raw materials, members of the Association from 2011, Soufflet Malt Romania and Hops Producers Association from Romania, successfully support the efforts to promote the beer culture in Romania, to educate consumers about responsible consumption of beer and informing on benefits this drink made from natural ingredients.
The two producers of raw materials are operating in nine factories and farms and provides a total of 118 jobs, contributing to the state budget by more than 8 million euros. With regard to the small beer producers in Romania, their number has decreased significantly since 1989, reaching from a total of 125 factories in 1993, to only 8 in 2010 (Figure 7) [4]. 4. THE BEER SECTOR CONTRIBUTION TO THE NATIONAL ECONOMY IN ROMANIA
Europe is the world leader in beer manufacturing sector due to a mix of small, medium, large and multinational producing companies.
With 3,638 breweries in all countries of the Union space, annual beer sales on the markets of all 27 Member States reached 106 billion. At the EU level, the production of beer create for 2 million jobs and generates income as taxes to the member states budgets amounting to 51 billion euros and an added value of 50 billion euros (Ernst&Young, 2011).
According to Ernst & Young study, contribution of the beer industry to the European economy, demand for goods and services generated by the beer industry in 2010 at the level of the Romanian economy, in sectors such as agriculture, transportation, utilities, equipment, media, marketing, services and packaging manufacturing industry, reached 331 million euro.
The number of jobs generated by the beer industry at the local level in 2010 was 76,000. The value added produced by the beer industry in the same year reached 509 million euros and the total contributions to the state budget due to the same sector reached 651 million euros.
In 2010, 0.14 million hl of beer produced in Romania have been intended for export, which means a decrease compared to 2009. The main export markets for Romanian beer are in Hungary, Bulgaria, and Italy. Also this year have been imported into our country 0.22 million hl of beer, the most important markets are Germany, Poland and Hungary. In 2010, the breweries have spent large amounts of money to improve packaging and less on the raw material for the finished product, and that due to the decrease of beer production volume compared to 2009.
The economic recession has led to an increase in the fuel prices. This is a burden especially for brewing companies which must to align with EU directives. This alignment increased pressure on distribution costs.
The most important threats with which the beer sector in Romania will face in the coming years are: creating a storage system for the non-returnable packaging; decrease in beer consumption; higher risk of increase in the number of unfavorable regulations for this sector; market trends; higher production costs due to higher prices of raw materials.

74 Dobre-Baron, O.
In 2010, the breweries in Romania have had approximately 4,200 employees who together produced 16.9 million hectoliters of beer, worth 605 million euros. (Ernst&Young, 2011)
A relatively high share from the total turnover of 605 million euros remains in the beer sector, as the value added. This added value represents 104 million euros, while the rest of 501 million represents expenditures with the production factors that are used for: labor cost, interest paid on loans and the profit (Figure 8.).
In Romania, 17% of the total production value has remained in the beer sector as value added. Other 83% of those 605 million euros representing the total turnover in this sector were accumulated by the suppliers of goods and services.
104
501
0
200
400
600
800
The added value Expenditure with the production factors
Figure 8. Total value of the beer production from Romania in 2010
(million euros)
In 2010, the majority of jobs created by the beer industry in the supply chain have been in agriculture. Also it is estimated that the overall effect of the beer sector from Romania on employment has led to the existence of approximately 17,900 employees. The economic impact of beer producers on the hospitality sector is evaluated in this way: - approximately 28% from the entire quantity of beer consumed in Romania is sold
in the hospitality sector, which means that 4.8 million hl are sold in restaurants, bars, pubs etc.;
- the average price of beer consumed in bars and restaurants in Romania is estimated to be 1.7 euros per liter (including VAT), so that the total consumption expenditure for the beer in the hospitality sector is about 799.5 million euros (including VAT);
- the net expenditures for the beer consumption are estimated thus to 644.9 million euros (at a VAT rate of 24%);
- with an average turnover of 17,635 euros (excluding VAT) per person, this is reflected in the nearly 36,600 registered jobs in the hospitality sector and that can be attributed to the beer sales (Ernst&Young, 2011).
The importance of the beer sector for retail can be similarly assessed as: - approximately 72% of the total consumption of beer (12.2 million hl) from
Romania is represented by the beer sold in supermarkets and other retail sales markets;

The Analysis of the Beer Sector in Romania 75 - with an average consumer price of 0.8 euros per liter (including VAT), the total
beer consumption expenditure in retail is estimated at 991.4 million euros; - the total consumption expenditure, excluding VAT, therefore are 799.5 million
euros, with a turnover per employee estimated at 104,122 euros (excluding VAT), this means that about 7,700 people owe their jobs to the retail beer sales (Ernst&Young, 2011).
Thus we can conclude that in 2010, approximately 4,200 people were employed in the beer factories in Romania. Moreover, 27,500 jobs were created by the providers of goods and services for the beer industry. Also have been registered 36,600 jobs in the the hospitality sector and 7,700 jobs in the wholesale and the retail thanks to the beer sales. Therefore, the total workforce employed due to the beer industry has been by 76,000 jobs (Figure 9.).
6%
36%
48%
10%
Beer producers
Suppliers of production factors
The hospitality industry
The retail trade
Figure 9. The number of jobs due to the beer industry in Romania in 2010
In 2010, the earnings accruing from VAT and earnings related to the
contributions due to the beer production and sales have been estimated at 651 million euros: the earnings from VAT have been estimated at 347 million euros; total earnings from excise duties were 131 million euros; the earnings due to revenue realized in the beer production and sales, were approximately 164 million euros, including 36 million euros income tax, 49 million euros social insurance contributions paid by employees and 111 million euros, social insurance contributions and payroll taxes paid by employers.
After a difficult period which has been felt through a significant contraction in consumption, keeping the beer market volume for two consecutive years at the same level is the first positive sign that the efforts of producers have managed to counter a negative economic context and led to the strengthening of the market, creating the foundations for a future return of the sector. 5. CONCLUSIONS
Despite the unfavorable economic environment of recent years, the beer manufacturing sector remains the most patriotic production field, 99% of the beer consumed in Romania being produced locally. Moreover, the production of beer is one of the most sustainable economic sectors in the country, fact proved by the quality of

76 Dobre-Baron, O. the products that are available to consumers, by the number of jobs that it generates and by the high level of investment and significant contributions to the state budget.
Thus the statement that "The beer is the most patriotic sector of the economy" is due to the result of our analysis which showed that in the beer sector the consumption is covered in a ratio of about 99% by the domestic production, and can be supported by at least three key arguments.
First, it is worth noting the local presence of the major players in the global beer market, while the share of manufacture in GDP has dropped below 30% and many multinational companies coming from other industries have in Romania only sales offices. The domestic production is itself a rarity among the other sectors in Romania and represents an effort to involve thousands of employees, to pay local taxes and to the state budget or the involvement in community life.
Secondly, the beer sector is one of the few sectors in which the quantity imports into hectoliters is not significant, the consumption being covered by what is produced in the country. The fact that by 2009 the economy was dominated by the existence of an excessive consumption, based on "debt" reminds us the paradox according to which the exit from the recession or it will be based on consumption or will not be happen anytime soon. Served by the domestic production the consumption does not create problems in solving this paradox but on the contrary. The problem is the rest of the sectors where the consumption is covered mainly by imports, for their financing being necessary loans.
Thirdly, the beer sector has many indirect positive effects on the national economy such as: pays excise more than all other industries of alcoholic drinks combined; the segment of the underground economy is not developed; and ultimately supports retail development.
Finally one can easily conclude that the beer sector can be an example for other sectors of the economy and that the support of such a model can help Romania to be developed sustainably on medium and long term. REFERENCES: [1]. Ernst&Young (2011) Contribution made by Beer to the European Economy, [Online],
Available at: http://www.ey.com/Publication/vwLUAssets/, [Accessed 20 March 2012] [2]. *** Broşura Asociaţiei Berarii României, 2007-2012 editions, [Online], Available at:
http://www.berariiromaniei.ro/media-center/, [Accessed 20 March 2012] [3]. *** http://www.berariiromaniei.ro/cultura-berii/istoria-berii/ [4]. *** http://www.psipbr.ro/ [5]. *** http://www.gandul.info/financiar [6]. *** http://www.zf.ro/companii/ [7]. *** http://www.ceeretail.com/ [8]. *** http://www.romanialibera.ro

Annals of the University of Petroşani, Economics, 12(4), 2012, 77-84 77
KEYING AND ROLE PLAY IN BUSINESS ENCOUNTERS. SPATIAL, TEMPORAL, BEHAVIOR AND
LANGUAGE CUES
GABRIELA DUMBRAVĂ *
ABSTRACT: This study proposes an approach business communication based on Erving Goffman’s theory of the relational dimension of meaning, according to which meaning is not attached to the communication process, but generated within the context (frame) of each specific interaction. This automatically involves a complex process of keying, which basically refers to a series of paradigm shifts that individualize each instance of communication. Therefore, the present study aims at tracing the way in which the process of keying operates in business communication where the overlapping frames of everyday informal interactions and of formal, standardized communication generate, under the pressure of culturally inherited patterns, specific sets of spatial, temporal, behavior and language cues that assign well defined roles to the participants.
KEY WORDS: business comunication; key; keying; frames; spatial cues; temporal cues; behavior and language cues.
JEL CLASSIFICATION: D83 1. INTRODUCTION. KEYING IN HUMAN COMMUNICATION
Stemming from the conceptual legacy of Emile Durkheim’s macrosociological
approach and the functional discourse of British social anthropology, Erving Goffman’s book, Frame Analysis. An Essay on the Organization of Experience, sets as early as 1974 the guidelines of a theory which, almost forty years later, still proves its efficiency by opening new perspectives in the study of human communication under various forms, from literal to artistic interaction. This theory sets forth the relational dimension of meaning based on the idea that the meaning generated in any human interaction is determined by what he metaphorically defines as the ‘frame’ within which a specific instance of communication unfolds. To be more specific, “… just like
* Assistant Professor, Ph.D., University of Petroşani, Romania, [email protected]

78 Dumbravă, G. the picture frame defines an artistic representation of reality as a distinct, unique world, individuals rely on frames, which are culturally inherited forms of organization of experience, to structure the events and interactions they are involved in and invest them with significance” (Dumbravă, 2010, p. 83).
The concept of ‘frame’ and ‘framing’ was adopted by subsequent research in the field and it is still present, as a very productive perspective, in contemporary works of sociology and social anthropology. Although present theories display the concept under a variety of names, such as ‘background’, ‘setting’ or ‘context’, they all converge to the idea that human communication is endowed with meaning according to a set of rules and principles that pertain to the situation in which the interaction occurs rather than to the interaction itself. Under these circumstances, individuals engaged in any face - to - face interaction unconsciously place themselves in negotiating positions using different strategies to manipulate the exchange to their own advantage. The ability to act naturally and effectively within different and often overlapping frames, as well as the flexibility to adapt to different interlocutors and ‘roles’ is generically referred to by using the term ‘social skills’.
Expanding on Gregory Bateson’s observation that “… otters not only fight, but also play at fighting”1, which points to their capacity to break the boundaries of a basic frame by modeling a pre - existing pattern of behavior, Goffman identifies the very source of social skills in the concept of key, defined as “…the set of conventions by which a given activity, one already meaningful in terms of some primary framework, is transformed into something patterned on this activity but seen by the participants to be something quite else” (Goffman, 1974, pp. 43-44). In the same sense, the process by which primary frames of communication are ‘transcribed’ with variations meant to loosen their rigid boundaries is called keying, a kind of tune of social interaction that turns individuals into efficient social actors. From Goffman’s detailed research on keying, we have selected for the purpose of the present study three elements that are defining for this process, namely:
- the transformation of already meaningful communication units in compliance with a ‘schema of interpretation’ similar to a play script;
- the awareness and acknowledgement of the interlocutors regarding the alterations that re - project the specific interaction within a different frame and assign specific roles to each participant;
- the existence of spatial and temporal cues to guide the development of the process, which also sends to the idea of staging.
The next section of the study will apply these three fundamental dimensions of keying to business communication in order to see how the multiple framing of such encounters determine specific alterations of primary frames and the assignation of roles.
1 In Bertram Schaffner, ed., Group Processes, New York: Josiah Macy, Jr., Foundation Proceedings, 1955, p. 175

Keying and Role Play in Business Encounters. Spatial, Temporal … 79 2. KEYING IN BUSINESS COMMUNICATION
Instances of business communication are basically characterized by two
overlapping frames - one specific to informal, everyday speech and the other to formal business interaction. Taking into account that in any human exchange participants bring along their own social and cultural heritage under the form of what we generically call ‘background’, we cannot help noticing the multiple determination of this process. However, if in everyday interaction there are unwritten rules and culturally inherited patterns of verbal and non - verbal language, business interaction has, strict written rules of etiquette, less prone to negotiation. Therefore, business encounters are closer to ceremonial acts, where rituals are precisely outlined in a pre - existing ‘script’ and failure to observe them leads to breaking the frame and rendering the encounter inefficient. Therefore, within a formal context, the overlapping frames of everyday interactions and of standardized business interactions exert a double pressure on the ‘actors’ of the communication process, forcing them to alternate the already assumed ‘everyday person’ role with the ‘business professional’ role. Thus, the more formal the situation, the more bracketed will be personal identity in favor of the social role to be played. Actually, this is what Goffman defines as “…the dissociation […] between the figure that is projected and the human engine which animates it” (Goffman, 1974, p. 573).
In this context, keying in business communication involves a precise ‘scripting’ process during which the primary frames of daily interaction are modeled according to spatial, temporal, language and behavior cues, all meant to foster power relations and different levels of collaboration. A. Spatial cues
This type of cues refers to space management under various forms, from the efficient use of office space in different situations to rules of proper distance between interlocutors during conversation.
Office space management is a basic item in the ‘staging’ of a business meeting, as it automatically determines the roles of the interlocutors in the exchange. Office layout will, therefore, make the difference between informal and collaborative business relations, if chairs are set around a small table, or at right angles to each other, and control or superiority relations induced by someone who sits behind a large desk, facing the guests, seated at ‘respectful’ distance in smaller chairs.
Sitting position has such a dramatic impact on the development and outcome of business encounters that some specialists in the field went as far as talking about a genuine “language of seating”. Thus, communication trainer Lillian D. Bjorseth shows the close relation between space and power management, by outlining the way in which the use of space casts well determined roles to the participants. Thus, chairs in a circle cast equal roles and relations of collaboration; a ‘horseshoe’ or a ‘T’ layout places the persons at the head of the table in leading roles, while theater or side - by - side seating encourages the role of listener rather than of speaker. In the same context, a raised speaking platform emphasizes the role of the speaker, but it is thought to lower, as it acts as a barrier between him/her and the audience (Bjorseth, 2000, p. 230).

80 Dumbravă, G.
To conclude, seating arrangements assign two opposite categories of roles: Sitting side-by-side or at 90° induces equality, adding psychological
security and fostering relations of collaboration. It is not accidental at all that these frames overlap extensively with the one of close relations and small talk;
Opposite sides mean dominance and competing attitude. In close relation with seating stands another major spatial cue, namely
proxemics. Since this issue was detailed in a previous paper2, the present study will confine itself to delineating the connections between proxemics and keying. As this spatial cue is subject to double determination - the formality of the business encounter and culturally inherited standards - keying is of a more complex nature in this case. In combination with other non - verbal cues, proxemics adds different degrees of emotional charge to the verbal message. Therefore, ‘tuning’ involves deep awareness of the cues that enable us to adjust communication distance to the level of comfort specific to each individual and to foster a more positive response and cooperative behavior from our counterpart. In this sense, knowledge regarding the dynamics of personal space increases awareness of the following factors:
1. Violation of personal space refers to the discomfort people feel when someone who has not yet gained their trust enters their personal space (120 cm), auomatically assuming the role of the invader. The invasion of someone’s personal distance without establishing some level of trust first can cause the interlocutor to feel threatened and become defensive, sending out such non - verbal cues as moving away in order to regain personal territory.
2. Power relationships. Specialists have come to the conclusion that the way people use space in communication provides relevant information about such social cues as status, power, and confidence. Thus, a greater amount of personal space, under the form of big offices, apart from the rest of the employees, signals higher status and authority. Similarly, confident people are comfortable being permanently at the center of the attention, while lower status or non-confident people tend to withdraw to the back of the room. University studies have even shown that the students who sit front and center of the classroom received the highest grades in the class, while those who sat in the back and at the corners of the room received the worst grades.
3. Material barriers. Studies have shown that any object, such as a table, a desk, or even a drinking glass set between the interlocutors is an indication of defensiveness, either in an unconscious attempt to restore emotional comfort, or in a conscious effort to conceal dishonest intentions. (Low, 2003, pp. 211 - 212).
2 See “Actions Speak Louder than Words” - Body Language in Business Communication, in Annals of the University of Petroşani. Economics, vol. IX, Part III, Universitas Publishing House, Petroşani, 2009, pp. 249 - 254

Keying and Role Play in Business Encounters. Spatial, Temporal … 81 B. Temporal cues
Training consultant Morris Taylor shows that meetings are currently the most expensive communication activity in the corporate world, considering the salaries of participants, preparation costs, and the price of materials, facilities, and equipment. Given the financial considerations pertaining to them, meetings should be organized in such a way as to become efficient, productive activities, worth the time and the resources invested in them. The basic element of keying, in this context, is related with the punctuality of the participants. By modeling the frame of regular meetings, where time boundaries are relatively looser and susceptible of alterations from either of the two parts, the business meeting relies on a strict schedule, whose disruption has a negative impact on efficiency, productivity, and morale. Consequently, communication specialist Alexander Kjerulf suggests the following strategies to be implemented in order to keep the issue of punctuality under control.
1. The meeting should always start on time, even if some of the expected participants are late, because doing otherwise would have a double negative impact. On the one hand, it would disconsider the effort of the prompt participants and, on the other hand, it would convey the disruptive message that being late is acceptable, thus reinforcing the negative behavior;
2. When the meeting begins, the door of the room should be closed in order to draw attention to the people who walk in late and induce self - consciousness;
3. The meeting agenda should be sent out in advance in order to give the participants enough time to get the message and adjust their schedule accordingly;
4. The most critical items should be placed first on the agenda to stir the participants’ interest and stimulate them to be on time;
5. Solicit help from the secretaries and assistants of chronic latecomers asking them to alter schedules or remind their bosses of the meeting time;
6. Peer pressure on potential late comers can be achieved by appealing to other participants to the meeting, placing punctuality as an item on the agenda and presenting the topic as a challenge to the group.
7. As an ultimate solution, chronic late comers should be talked to in private in order to clarify the importance of their attendance and, in extreme cases, to warn them of the consequences of not improving. (Kjerulf, 2007, pp. 121 - 122).
C. Behavior and Language Cues
In terms of business behavior and language, the keying of everyday conduct and talk takes into account strict standards of etiquette and well defined roles that differ according to the type of encounter. Starting from the premise that, as any human contact, the business relation largely depends on first impressions, keying is made by closely following a ‘script’ generally referred to as business etiquette. In this sense, business communication expert Lydia Ramsey delineates the following strategies meant to ensure successful initial encounters that will be the start of efficient collaborations:

82 Dumbravă, G.
1. Standing up when we meet someone in order to engage an equal level, eye - to - eye contact. A person who remains seated sends a message of disrespect to the interlocutor;
2. Smiling, because facial expression goes far beyond the verbal message; 3. Making eye contact to show people we are focused and interested in
them; 4. Introducing ourselves and offering information about who we are (job,
qualifications, position in the company we work for) as soon as we approach or are approached by unknown people;
5. Offering a firm handshake concomitantly with the greeting. According to Ramsey, in order to convey self - confidence and professionalism, such extremes as a bone - crushing grip or a weak, limp - wristed shake should be equally avoided. On the other hand, the expert points out that the contemporary business environment excludes gender related restrictions, as everyone shakes hands with everyone else in business;
6. Making formal introductions. In business, like in any formal context, the less important people are introduced. Another important detail is to provide information about each person, so that they should know why they are being introduced and have a starting point for their conversation;
7. Paying attention to names when we meet people, as it quite common for people think about what they are going to say next and not focus on the other person. The solution recommended here is to concentrate and repeat the name as soon as we hear it, in order to stand a better chance of remembering it later. (Ramsey, 200, pp. 49 - 50).
Besides adequate clothing and good command of body language, keying in terms of language in business interactions refers to the use of correct, proper language, which is of utmost importance for positive first impression and trust building in any business interaction, because speaking well reflects good education and professionalism. Adapting language to a certain social or business environment is essential because a wrong choice of words and expressions, or inappropriate language can place tremendous strain on human relationships and destroy credibility.
Specialists identify the following language cues that undermine relationships and targeted results either by disconnecting the audience, or generating reluctance or defensive attitude:
1. The use of pompous language. Pretentious language and a hyper educated, formal tone, trying to establish a level of expertise, create barriers that induce resentment and disconnect the audience. To avoid this, it is recommended to pay attention to verbal and nonverbal feedback, which will tell us whether the audience is following or not and allows us to switch to more familiar language and establish a rapport of equality rather than of dominance;
2. Vulgar language not only betrays a lack of self - control and disrespect for others, but it also has an irreversible negative impact on the reputation and image of the speaker;
Keying and Role Play in Business Encounters. Spatial, Temporal … 83
3. Negative tone is a mixture of condescendence and disrespect that makes the difference between being confident and arrogant. Negative tones undermine communication because they generate pessimism and make people feel reluctant in developing relationships;
4. Offensive, harassing statements, as well as inappropriate humor and offensive comments, are both inappropriate and wrong, showing flagrant disregard for the audience’s sensibilities and, therefore, generating frustration and negative response;
5. Being insensitive involves being unaware of the cues the audience is sending back during a speech or presentation and the consequent inability to change the delivery and/or the topic in case the response is negative;
6. Abusing qualifiers such as “I think” or “it seems” weakens the discourse by ambiguous statements, conveys doubt and makes the audience question and dismiss both the speaker and the message;
7. Confusing words, with abstract or multiple meanings, tend to send ambiguous messages and create vague images in the listeners’ mind, confusing and annoying the audience. The solution to this problem is the use of concrete terms and specific messages, which generate clear signals and ensure connection and communication. (Laskowski, 2001, p. 10)
3. CONCLUSION
As fundamentally symbolic beings, humans communicate by successive encoding and decoding processes that define their relation with the environment and with one another. This permanent negotiation leads to a paradigmatic perspective on communication, in terms of which meaning is generated within the process itself, in accordance with culturally established systems of values and norms.
This approach, which Goffman refers to as framing, opens new perspectives on business communication as an instance of human interaction where the overlapping frames of culturally determined informal and formal interaction generate well defined sets of cues and assign specific roles to the interlocutor. Therefore, as a result of keying the primary frame of everyday encounters, the business interaction gets closer to a stage performance and it can be studied in terms of a particular script and well established roles, each with its pertaining spatial, temporal, behavior and language cues.
Consequently, by applying the process of keying and the role play approach to business communication we become aware of it as a double determined process, in which the ability to negotiate the boundaries between informal spontaneity and formal standardized behavior makes the difference between failure and success in business. REFERENCES: [1]. Bjorseth, L.D. (2000) Nothing Happens Until We Communicate, Personal Quest

84 Dumbravă, G. [2]. Dumbravă, G. (2010) The Concept of Framing in Cross - cultural Business
Communication, Annals of the University of Petroşani - Economics, vol. X, Part I, Universitas Publishing House, Petroşani, pp. 83-90
[3]. Goffman, E. (1986) Frame Analysis. An Essay on the Organization of Experience, Northeastern University Press, Boston
[4]. Kinsey Goman, C. (2002) Ghost Story: A Modern Business Fable, Kcs Pub [5]. Kjerulf, A. (2007) Happy Hour is 9 to 5, Alexander Publishing [6]. Laskowski, L. (2001) No Sweat Presentations - The Painless Way to Successful Speaking,
Grand Central Publishing [7]. Low, S.M.; Lawrence-Zúñiga, D. (2003) The Anthropology of Space and Place: Locating
Culture, Blackwell Publishing [8]. Ramsey, L. (2000) Manners That Sell - Adding the Polish That Builds Profits, Longfellow
Press

Annals of the University of Petroşani, Economics, 12(4), 2012, 85-94 85
OVERVIEW OF THE STATE OF CORPORATE SOCIAL RESPONSIBILITY WITHIN MULTINATIONAL
COMPANIES
CODRUŢA DURA, MIHAELA GHICAJANU *
ABSTRACT: In the near future, multinational companies should play a crucial role in supporting and developing a responsible corporate behavior from social, as well as ecological point of view, within the globalization framework. Thus, the process of globalization and liberalization of markets, of goods and services, must be accompanied by the real progress towards an effective system of global governance, with its own social and environmental dimensions. The paper dwells upon the diagnosis of the current state of corporate social responsibility within the international business environment, substantiated on the basis of a study carried out in 2010 by the American scientific and professional organization Business for Social Responsibility (BSR).
KEY WORDS: corporate social responsibility (CSR), sustainable business,
multinational companies, responsible industries, return on investment (ROI) of CSR, business environment.
JEL CLASSIFICATION: M14, F23, F64 1. INTRODUCTION
Definitions of corporate social responsibility (CSR) have appeared in the
literature in the late 1970s, and the common idea that can be inferred from most approaches is that, regardless of the economic-financial performance, no company can afford to take action against society (Băleanu, et al, 2011).
One of the best known definitions of CSR belongs to A.B. Carroll (1979, 1983, 2010) who defines the responsibility of any kind of economic organization in relation to the four main areas: economic, legal, ethics and philantropic (or charitable) (Dura & Isac, 2012b).
* Assoc. Prof., Ph.D., University of Petrosani, Romania, [email protected] Lecturer, Ph.D., University of Petrosani, Romania, [email protected]

86 Dura, C.; Ghicajanu, M.
First of all, any company aims to produce goods and/or services desired by individuals and to sell them for a profit. Thus, Carroll defines the economic business responsibility which is the starting point of any subsequent request. Secondly, just as the company expects an economic operator to produce profit as a result of selling goods and services, they are also expected to comply with the law along this process. This is the legal responsibility of the company. The following two types of responsibilities, the ethical one and the discretionary/philanthropic one are characterized by the fact that they specify a set of expectations that go beyond the legal system. The ethical responsibility incorporates social expectations regarding the moral rules adopted by corporations. The philantropic responsibility refers to the commitment of corporations to contribute to the improvement of the quality of people’s life in the modern society (Dura & Isac, 2012b).
The four types of responsibilities make up the concept of total corporate social responsibility, and in order to give the public an image as close to reality as possible, these dimensions must be taken into account and must be complied with simultaneously (Carroll & Shabana, 2010).
The Romanian business environment took over and developed relatively recently the concept of corporate social responsibility (CSR), and this was achieved through multinational companies who had the merit of introducing new practices and activities in this field of activity. This phenomenon was possible mainly after the year 2000, when many of the multinationals started to apply in Romania, the principles and practices of corporate social responsibility (CSR) as an example that is worth following by other Romanian companies as well (Săvoiu & Čudanov, 2010).
The evaluation of Corporate Social Responsibility in multinational companies uses as a benchmark the study released by Business for Social Responsibility (BSR) and GlobeScan, in the paper "Sustainable Business Survey for 2010" (State of Sustainable Businesses 2010), published on November 3rd, 2010. The study was carried out during the period September 6th – 24th, 2010 on a representative sample of 334 professionals (Manager or below 54%; Vice President or above 14%; Director 24%; other 8%) of the member organizations of the Business for Social Responsibility (BSR) and has sought to identify and assess the current status of corporate social responsibility and sustainable businesses. In terms of the objectives of the study, the terms "corporate social responsibility" and "sustainability” have been used as synonyms (Iamandi, 2010). The sample population was made up of representatives of the business environment from North America (51%), Europe (25%) and other regions (24% Asia-Pacific, Africa, Latin America).
The survey intended to sum up five types of information: the most important leadership challenges; the main aspects of corporate social responsibility: CSR priorities, trust building, public confidence in responsible businesses, the most important actions in the areas of confidence building in the business; a group of information regarding climate changes in reference to the priorities of the strategy to reduce carbon emissions and climate challenges of sustainability; the evolution and profitability of corporate social responsibility programs.

Overview of the State of Corporate Social Responsibility within … 87 2. EVALUATION OF CORPORATE SOCIAL RESPONSIBILITY WITHIN MULTINATIONAL COMPANIES
We shall focus below on the aspects related to the concept of CSR and the
current state of its implementation within global businesses. An initial question in the questionnaire, which was the basis of the research,
referred to the priorities related to CSR for next year, and the responses indicated the fact that the climate change (63%) and the rights of the employees (62%) would focus primarily on corporate efforts in the field of sustainability in the next 12 months. Other priorities associated with the CSR and mentioned in the responses dwelled upon the following areas: human rights (59%), availability and quality of water resources (47%), political framework for the promotion of sustainability (46%), sustainable consumption (46%) and the reduction of poverty (26%) (BSR/GlobeScan, 2010).
It is worth mentioning that a more recent study undertaken by Business for Social Responsibility in 2012 highlights the fact that these priorities have changed as follows: the first place was taken by the human rights - 66%, the second belongs to the worker’s rights - 63% and the third place was occupied by the climate change - 61% (BSR/GlobeScan, 2012).
26%
46%
46%
47%
59%
62%
63%
33%
51%
56%
50%
56%
56%
66%
0% 20% 40% 60% 80%
Poverty decrease
Sustainable consumption
Public policy frameworks promoting sustainability
Water availability/quality
Human rights
Worker's rights
Climate change
2009
2010
Source: BSR/GlobeScan, State of Sustainable Business Poll, San Francisco, 2010
Figure 1. CSR priorities in during the period 2009-2010 As regards the identification of the most responsible industries in 2010, the
answers provided by the sample of companies have led to the following distribution (figure 2):
- there were three industries that had been the most responsible on the market in recent years in terms of their involvement in sustainability

88 Dura, C.; Ghicajanu, M.
aspects; these are the consumer products/retail industry (57%), food, beverage and agriculture (30%), information technology and communication (28%).
- at the opposite side, we find the least responsible industries in 2010: tourism and travel (5%), financial services (3%), and media and entertainment (2%).
2%
1%
0
6%
9%
10%
22%
32%
19%
56%
2%
3%
5%
5%
8%
12%
23%
28%
30%
57%
0% 20% 40% 60%
Media and entertainment
Financial services
Travel and tourism
Construction / real estate
Transportation and logistics
Pharmaceuticals/biotechnology
Energy and extractives
Information and communications …
Food, beverage and agriculture
Consumer products / retail
2010
2009
Source: BSR/GlobeScan, State of Sustainable Business Poll, San Francisco, 2010
Figure 2. The most responsible industries at global level (2009-2010) Another question included in the survey intended to assess the degree of
optimism/pessimism as regards the availability of global companies to include CSR as part of their core strategies for the next five years.
Thus, for the year 2010, over 8 out of 10 respondents (i.e. a percentage of approximately 84%) are somewhat optimistic or very optimistic concerning the implementation of sustainable business practices within the corporate operations and strategies for the next five years, which represents a slight decrease from the 90% who felt the same thing in 2009. As compared to the percentage for the year 2008 - namely 77% - the situation certainly improved in 2010 (Figure 3).
As regards the number of respondents who are very optimistic concerning the adoption of CSR practices, we found again a slight reduction (from 26% in 2009 to 19% in 2010), probably due to the limitation of financial resources available to the companies under the conditions of economic crisis.
As regards the amendments forecasted for the following year within the framework of the various CSR approaches, a series of seven relevant programs were

Overview of the State of Corporate Social Responsibility within … 89 analyzed in this respect. The results indicated the fact that most of those surveyed expected an increase in one of the two key areas of corporate CSR programs, namely in internal and external communication regarding these programs (estimates are of 72% and 71% in the second case) – Figure 4.
77
90
84
10
7
10
13
3
6
0% 50% 100%
2008
2009
2010 Optimistic
Neither pessimistoptimistic
Pessimistic
Source: BSR/GlobeScan, State of Sustainable Business Poll, San Francisco, 2010
Figure 3. The degree of optimism/pessimism regarding the implementation of CSR in the core strategies of global companies for the next five years
32
33
39
41
42
71
72
66
62
57
56
52
27
26
1
3
2
1
5
1
1
0% 20% 40% 60% 80% 100%
Board-level engagement on CSR/sustainability
Level of staff in CSR/sustainability
Demonstrate return on investment from CSR / sustainability
CEO-level engagement on CSR / sustainability
Budget for CSR / sustaiability
Amount of external CSR / sustainability communications
Amount of internal CSR / sustainability communications
Increase
Stay the same
Decrease
Source: BSR/GlobeScan, State of Sustainable Business Poll, San Francisco, 2010
Figure 4. Estimated changes within the CSR programs of global companies for the following year (2010)

90 Dura, C.; Ghicajanu, M.
For the other domains – top-management involvement in supporting and promoting CSR, the budgets, the number of employees to support the company's CSR efforts – predictions based on the sample of respondents indicate a tendency of stagnation. The overwhelming majority of those interviewed (a rate of 94%) expects that the budgets for CSR programs to be maintained at approximately the same level or to increase.
Analysis of the return on investment (ROI) of corporate social responsibility programs aims at the extent to which companies assess, at present, the financial benefits derived from the involvement in issues of CSR. In 2010, the majority of respondents (66%) reported that the business organizations for which they work or they run either measured or intend to measure soon the profitability of CSR programs carried out (this percentage is increasing as compared to the 61%, related to the previous year, 2009) (BSR/GlobeScan, 2010).
Figure 5 shows however that only 36% of the inquired companies actually measure the profitability of CSR programs, which has led to the necessity to explore the reasons why this indicator is not quantified yet at the level that would be required.
30
36
31
30
37
33
0% 20% 40% 60% 80% 100%
2009
2010
Company measures ROI oCSR
Company does no measurROI of CSR, but will soon
Company does not measuROI of CSR
Source: BSR/GlobeScan, State of Sustainable Business Poll, San Francisco, 2010
Figure 5 Actual involvement of companies in measuring ROI of CSR programs
Figure 6 reveals the most frequent reasons for which companies do not asses
ROI of CSR programs yet. The lack of resources is the most frequently mentioned reason (25% of the
total of responses), followed by a low interest for such an approach (15%) and the lack of knowledge regarding the implementation (11%).
With regard to public confidence in the responsible businesses, the survey showed an overall decline of respondents. Therefore, corporate measures were analyzed in order to enhance public confidence in the business sector. According to the responses of those interviewed, companies should undertake two main actions to regain public confidence which was with the current economic crisis: demonstrating the positive impact in social and environmental terms (54%) and increasing the transparency of business practices (53%). Moreover, with a lower frequency, the

Overview of the State of Corporate Social Responsibility within … 91 following issues have also been mentioned: prompt and effective response to accidents, quality issues and other possible incidents (43%), improving dialogue and commitment of all stakeholders (37%), creating innovative products and business models to enhance sustainability (34%), increasing the involvement of top management in CSR activities (23%), close cooperation with NGOs for solving social and environmental issues (16%) – Figure 7.
25%
15%
11%10%
10%
29%
Limited or nressources m
No interest/
Little or no k
Hard to do/m
Other
Source: BSR/GlobeScan, State of Sustainable Business Poll, San Francisco, 2010
Figure 6. Reasons for which ROI of CSR programs is not evaluated

92 Dura, C.; Ghicajanu, M.
7%
10%
14%
16%
23%
34%
37%
43%
53%
54%
0% 20% 40% 60%
Better align lobbying efforts and CSR/sustainability goals
Increase board oversight of CSR/sustainability
Reform executive compensation
Work closely with NGOs on social and environmental issues
Increase CEO leadership on CSR/sustainability
Create innovative products and business models designed for sustainability
Improve stakeholder dialogue and engagement
Respond promptly to accidents, product quality issues and other incidents
Increase transparency of business practices
Measure and demonstrate positive social and environmental impacts
Source: BSR/GlobeScan, State of Sustainable Business Poll, San Francisco, 2010
Figure 7. Measures to be taken in order to strengthen public confidence in the business environment (2010)
3. CONCLUSIONS
The analysis of the main results of the survey allows highlighting the following aspects (Iamandi, 2010):
The approach regarding the inclusion of CSR within the business strategies of companies is a particularly optimistic one. Optimism regarding the strategic importance of CSR demonstrates the awareness of the role businesses may have in dealing with major global challenges. Most of those polled expected to increase their activities in the fields of CSR;
Reassessing and strengthening public trust in business organizations requires positive impact at the level of society and transparency for the sustainability of business organizations. Companies should take two categories of measures to regain the public trust which was lost as a result of the economic crisis: demonstration of a positive social and ecological impact of CSR activities and increasing the transparency of business practices; in addition, the consumer products industry is the market leader in the field of social responsibility in recent years;

Overview of the State of Corporate Social Responsibility within … 93
Forecasts regarding the budgets allocated to CSR are also optimistic: 84% of those polled considered that these budgets will remain at the same level or will increase in the years to come;
Return on investments related to the programs carried out by companies in the field of CSR is already measured or to be measured in the near future by most companies. As an evidence of the financial benefits that CSR can bring, it will certainly strengthen public confidence in the business conducted by SMEs as well, at global level. The main conclusion of our study is that the vast majority of companies are considering, nowadays, the transformation of corporate social responsibility/ sustainability in one of the main priorities on the agenda of their business. 4. ACKNOWLEDGEMENT
The paper represents an output of the research activity carried out by authors
during the international project: COST 281/ 2009 Brussels, Action IS0905 - The Emergence of Southern Multinationals and their Impact on Europe. REFERENCES: [1]. Aston, A.C.; Stanciu, J.; Rusu, E.D. Responsabilitate Socială (Corporativă) în România.
Analiză situațională și recenzie a practicilor actuale, Raport realizat în cadrul Proiectului POSDRU/64/3.3/S/41722 ”Întărirea capacității companiilor românești de dezvoltare a parteneriatelor sociale – RSC”
[2]. Băleanu, T.; Chelcea, E.; Stancu, A. (2011) Responsabilitatea socială corporatistă a primelor 100 de companii din România. O analiză a Website-urilor corporatiste, Revista Amfiteatru Economic, Vol. XIII, Nr. 29, februarie, pp. 237-250
[3]. Bradu, C. What Do Consumers Expect from Companies regarding Social Responsibility?, Munich Personal RePEc Archive no. 2847
[4]. Carroll, A.B.; Shabana, K.M. (2010) The Business Case for Corporate Social Responsibility: A Review of Concepts, Research and Practice, International Journal of Management Reviews, Blackwell Publishing Ltd and British Academy of Management, pp. 85-105
[5]. Dumitru, V.; Ionescu, I.; Calu, A.; Oancea, M. (2011) O investigaţie privind prezentarea informațiilor de tip responsabilitate socială corporativă în cazul firmelor cotate la Bursa de Valori din România, Revista Amfiteatru Economic, Volumul XIII, Nr. 29, Februarie, pp. 146-162
[6]. Dura, C.; Isac, C. (2012) Current State and Perspectives of the Social Responsibility within Romanian Multinational Companies, Proceedings of the 5th International Multidisciplinary Simposium Scientific Symposium “Universitaria Simpro”, Petroşani, 12-14 October
[7]. Dura, C; Isac, C. (2012) The Concept of Corporate Social Responsibility within the Romanian Multinational Companies – Theoretical and Practical Aspects, The International Conference Competitiveness and Stability in Knowledge Based Economy, Section: Economy and International Business, Working Paper No.217, University of Craiova, Faculty of Economics and Business Administration, 26-27 October
[8]. Iamandi, I.E. (2010) Responsabilitatea socială corporativă în companiile multinaționale, Editura Economică, București, pp. 246-257

94 Dura, C.; Ghicajanu, M. [9]. Ionescu, G. (2005) Marketizarea, democratizarea și etica afacerilor, Editura Economică,
București [10]. Săvoiu, G.; Čudanov, M. (2010) Corporațiile multinaționale – o abordare statistică
comparativă în România și Serbia, Revista Română de Statistică, nr. 11/2010 [11]. Tony Edwards, P.; Marginson, P.; Edwards, A.; Ferner, O.T. (2007): Corporate
Social Responsibility in Multinational Companies: Management Initiatives or Negotiated Agreements?, Geneva, International Institute for Labour Studies
[12]. Voinea, L. (2007) Corporațiile transnaționale și capitalismul global, Editura Polirom, Iași
[13]. BSR/GlobeScan (2010) State of Sustainable Business Poll, San Francisco [14]. BSR/GlobeScan (2012) State of Sustainable Business Poll, San Francisco [15]. *** (2010) Strategia națională privind promovarea responsabilității sociale a
companiilor în România 2011-2016, realizată în cadrul proiectului „Responsabilitatea Socială a Companiilor axată pe Mediul Înconjurător și Dezvoltarea Comunităților Locale”, Septembrie

Annals of the University of Petroşani, Economics, 12(4), 2012, 95-102 95
CHARACTERISTICS OF PUBLIC SECTOR MANAGEMENT
ANCA JARMILA GUŢĂ * ABSTRACT: The work presents principal characteristics of public management and it principles from an angle of public administration where they reign over. Also the mechanisms, by which are managed public organizations, are presented as well as the reciprocal and administrative sphere and not in the last row the principal rules which reign over the relation government – market during the last two centuries. KEY WORDS: public management; management relations; public administration; public organizations; political sphere; administrative sphere; public affairs; government – market relation. JEL CLASSIFICATION: M
The public management represents the set of processes and management relations, well defined, which exist between the components of the administrative syste by, which, in a public power, the laws are put into force and/or the activities in delivery of services satisfying the public interest are planned, organized, coordinated, managed and supervised.
By definition we find the following characteristics:
- Public management brings together a set of management processes and relations that occur between the components of the administrative system;
- Public management objective is to satisfy the public interest by creating an appropriate institutional framework, allowing the application of normative acts, which means also the adoption of normative acts with inner juristics force, the adoption of laws or according to circumstances of decrees, ordinances, regulations, organization regulations or effective implementation of public services;
- The processes undertaken in the public sector are both management processes and execution;
* Lecturer, Ph. D., University of Petroşani, Romania, [email protected]

96 Guţă, A.J - The management relations in public institutions are reports that appear in the
administrative system. In the state administration those are realized in a public power, namely through powers granted by the Constitution (and the public power at a time when it is in conflict with private interests).
Therefore, public management is a specialized discipline that aims at knowledge of management processes and relations in public administration in all their complexity with the view of the formulation of principles and laws for continuous improvement of the organization and functioning of administrative structures, depending on the values of political power , socio-economic needs, the degree of technical equipment, the general level of culture and civilization etc., in order to achieve some effective public services, appropriate social need and satisfying public interest.
The multidimensionality of public management attracts, obviously, a number of characteristics that contribute to a better understanding of its content (see figure no. 1. Characteristics of public management).
Figure 1. Characteristics of public management
1. Integrating character. The public management investigates the management processes and relations in public administration, in order to substantiate the improvement and rationalization solutions of the administrative system.
The public management studies, essentially the way of leading public institutions in society, in the broad sense of the term, integrating the elements of all areas of social life: education, administration, social welfare services, etc.
2. Political character. The public management is a management area influenced by political factors. This is obvious because they can not be identical goals
Characteritics of public management
Integrated character
Diversity character
Political character
Complexity character
Synthesis character

Characteristics of Public Sector Management 97 pursued by public administration representatives in the states with different political regimes.
3. Diversity character. The public management has a character of diversity, as there are institutions with general material competence and social competence institutions, central and local institutions. This makes that the management also suffers the differentiation according to the administrative level to which it relates.
4. Complexity character. The public management has a complex character because it gathers specific elements of management in different areas of public sector: education, culture, social welfare services, health etc. The mere enumeration of these areas makes us understand the difficulties in approach of public management problems in general and of management in these different fields, particularly.
5. Synthetic character. The public management takes over from other fields methods, theories that aew successfully used by civil servants. It is required on adaptation of knowledge of sociology, psychology, statistics, ergonomics, law, economics, etc. to the peculiarities of the public sector.
There are the following principles of public management: a) The principle of unified leadership - established the hierarchical subordination,
since the Romanian Parliament, as the supreme institution, and continuing with other institutions of central and local public administration. By applying this principle provided an overview of the objectives to be achieved and a better understanding of the processes and activities.
b) The principle of self-management - aims the adaptation of the system to the conditions of time and place which supposes the accurate knowledge of the situation and events, identifying the key elements and solutions by public servants.
c) The principles of adaptation (of flexibility) - aims to adapt quickly the public institutions to changing taking place in the socio-economic environment, focusing also the adaptation capability of public servants, their flexibility in thought and action.
d) The principle of hierarchy and order. The administrative discipline is achieved as a result of subordination of administration institutions to each other allowing simultaneously vertical and horizontal communication, the exact division of tasks and monitoring their execution.
e) The principle of restructuring. The need of restructuring results of avoidance of oversized or on the contrary undersized activities carried out from the need of improvement of the quality of offered public services, the increase of efficiency of public management, the optimization of the administrative structures, creating an effective administrative apparatus.
f) The principle of legality. The administration acts in a legal framework, after certain procedures clearly established.
The public administration represents a system that is governed by laws, rules and procedures that prescribe roles, skills, responsibilities but also boundaries. Bureaucracy may seem natural state of public organizations. The organizational culture of role type represents a social construction type appeared in the late nineteenth

98 Guţă, A.J century, meant to rationalize the kind of functioning of organizations, both private and public.
Max Weber, the German sociologist and economist of XIX century, has theorized the operating principles of bureaucratic organizations that will impose in XX century in western administrative systems Weber identified three types of authority, encountered throughout history:
Traditional authority based on the belief in the sanctity of tradition, norms and customs as well as the perception of moral and spiritual superiority of those who exercise the authority in this context
Charismatic authority based on exceptional traits, heroic character and exemplary behavior of the leader.
Rational-legal authority emanating from written laws rationally substantiated.
Downs believes that offices differ from other forms of organization by the fact that output of such an organization isn’t evaluated and traded on a foreign organization market. This is a fundamental condition of efficiency of the organization. Its consequence is that the offices can not rely on the objective comparison of profitability in the assessment of undertaken activity. Thus the financial allocations are not the result of action between the supply and demand as it happens in the market, but of some assessments and administrative and / or political decisions. However the evaluation is imperfect because of information asymmetry between bureaucrats (beneficiaries of budget allocations) and politicians (representatives of citizens in their name and for interests of whom the public money is allocated for offices). The bureaucrats, being rational actors will strategically manipulate the situation of information asymmetry in their own advantage to detriment of social efficiency (by omitting the inconvenient data and promotion of the indicators which favour them, creating the distorted information of the offices).
The mentioned theories and studies show that the bureaucracy is characterized by efficiency, as Weber expected, but its operating mechanisms are focused on its survival and development. The public offices operate in conditions of some complex and often ambiguous objectives, making the contractual relations to be incomplete. The measurement of the contribution of the offices to the public good as well as of each employee to realization of the organization objectives to which he belongs is the least imperfect in the public sector; if in private sector there is a key indicator of performance by which resources are allocated, namely the profit, in the public sector the allocation of resources is made by the availability of factors of polictical decision.
The mechanisms by which public organizations are managed are: 1. The adoption of collective decisions; 2. The implementation of adopted decisions; 3. The organizations are answerable for the public and citizens problems.
The government is the forum where the resources of society are managed through the implementation of decisions by the legislative body. The relationship between the two courts is one of the principal-agent types. The government ministries and agencies are political parties by which a government political program is implemented. What we call executive structure: all agencies and ministries, is one that

Characteristics of Public Sector Management 99 carries out policy decisions and public policy operationalizes (adopts detailed rules), implements and evaluates the results of taken decisions. The executive power is composed on the one hand of political officials, elected or appointed and public servants. The latter represent a stable body but also numerous, human resources managing public affairs, within the regulations adopted by public servants and members of legislative body.
The policy officials, like members of parliament, adopt political decisions, based on some concepts of equitable development of the society, for which the respective actors plead within the framework of legitimate for a political discussions. They can act to impose institutional changes in order to change the rules to ultimately alter the boundary between public and private. They work thus in the framework which allow them the free expression and inexpensive of own options to present to debates and to support them publicly (immunity mechanism).
The public officials make decisions of an administrative nature regarding implementation, in conditions of observance of stipulations being in force, of development concepts (embodied in law) proposed by political forum. Their methods of actions are severely limited by the regulations and procedures in force, to whom they must obey. They can not take policy initiatives, sometimes being unable carriers of personal opinion. They can not initiate actions to change norms and institutions, they are called to optimize the applications of norms and operation of institutions.
The mechanism that ensures practicing of public office is the independence towards policy and its fluctuations in the idea of setting up a professional stable body, that apply consistently what happens at the legislative level.
The distinction between public and administrative function, between politicians and civil servants is classical, having its origin in the work of Woodrow Wilson, professor of political economy and jurisprudence at Princeton University. He believes that in addition to the fundamental question: Who should make laws and how must be these laws? the other question neglected enough in administration is: How can the law be managed wisely, with the equity, efficiency, without friction? The answer to this last question lies in the independence of administration: "The administration area is like the business area. It is beyond the turmoil and political struggle "(Wilson).
The administration is an ethnic area in the sense of Wilson, whose operating principles must be studied and implemented. He talks about the sanctity of public office, not subjected to politics and partisanship as guarantee for efficiency of public service. The administration is outside of the politics sphere. The administrative issues aren,t political issues. Although politics settless administrative tasks, it hasn,t the right to manipulate. Hughes argues that the traditional system of administration in parliamentary regimes aims at separating politics from administration. The minister both with ministerial structure headed by him elaborates politics which then will be administered by a department headed by a permanent official, who will remain in office until the government changes. This would ensure the legality of policy implementation, thebresponsability of employees against superiors, and also their neutrality, independence and competence. The officials remain anonymous: they don,t assume their responsibilty of policies result, but of its proper implementation especially legal.

100 Guţă, A.J
In practice, the distinction between civil servants and politicians is relative, the administration sphere can,t be separated from politics as long as it has and exercises the power to implement political decisions.
The arguments of mutual influences between the political and administrative sphere are:
• The officials acquire expertise in a particular field implicitly ideology, eventually shared by colleagues on solving public problems. This ideology will be reflected in implementing policies set by ministers and politicians. The author believes that the large bureaucratic organizations with influence, such as the European Comission, become even to have their own political agendas.
• Decentralization and deconcentration of policy decision centers until the level of agencies and new public management reforms associated with new public management enlarge the sphere of political action of officials who occupy the managerial positions, thus increasing their responsibility of policies but also the public visibility (they come out of clasic anonymity of the officials). Examples U.S., UK and Sweden where the role of agencies is important in supporting and promoting policies, are eloquentfor classic tendency of indistinctness between political and administrative sphere.
• Competition between agencies to achieve budgets implies also a fight between them, they mobilize political support co-opting the politicians or network of policies in supporting their own causes.
• Concentration of expertise at lower levels of bureaucracy determines also a substantial information and control levers to influence policy at this administrative level to detriment of higher levels of political nature.
Beyond the issues of rationalization and the impartial administration, especially in the relationship between politicians and officials, modern societies face the problem of effective management of public affairs in the context of solicitation of more complex and expensive services more complex and expensive services on the part of citizens.The public affairs try to solve problems concerning the whole community and seeking common solutions required at social level.
The public sector represents all activities and provided services, financed or heavily regulated by organizational entities of state, local or supranational authority. As an indicator of the share of public sector in society, a measure almost general of approximation constitutes the share of governmental and local authorities’ expenses in GDP. The indicator is used to measure the relative size of the public sectors in different countries.
During the last two centuries, government-market relation has known a series of changes.
• Theory of Adam Smith (English economist, XVIII century) mercantilist period: the state must intervene only minimally in society, allowing individual actors to act freely on the market, in this way an efficient use of resources would realize in a conception of the minimal state of kind laissez faire.

Characteristics of Public Sector Management 101
• The great society – US and The strong society –Sweden - increasing of political settlement, by regulation and redistribution. The objectives are to increase public expenses for extensive providing of some public services of education, health, infrastructure, fighting against poverty, the fact which will determine the increasing of management in economy. The state intervention in economy was recommended by solving social problems caused by the reconstruction of war affected societies.
• Welfare state (Germany, XX century) - State must intervene in society through welfare programs offered by the state for those in need, the conception become gradually more inclusive, reaching to cover all citizens. In famous attention of state about citizens from birth to death (from the cradle to the grave). The disadvantage is generated by the resources allocated by the state by political and administrative decisions so that politics prevail over the market and collective action prevails over individual action. The period has known until 90 years an enormous expansion by providing comprehensive public services (health, education, social services, infrastructure, utilities), summarized under the denomination of welfare state.
• The state failure beginning with 80's - the budget deficits begin to grow amply.
The demand for goods and services increases being, considered by citizens as a legitimate right.
The budgets become insufficient on the one hand because of economic stagnation, on the other hand because of the tendency of bureaucracy to increase in size, being a big consumer of resources. The economic changes of the right-wing orientation determined in the U.S. and Europe reforms regarding the decrease of public sector or its reformation according on the model of corporations of the private system. It is the moment of implementation of the policies of disinstitutionalization of the state. The Adam Smith's conception of invisible hand is raised in the context of increasing failure of public bureaucracies. Today it is considered that the common good is achieved by means of rational and selfish interests of the bureaucrat.
Not only the acute financial crisis in the 80s justifies public reform, but other factors began to outline the need for a different kind of public governance. The globalization, digitization, the reinforcement of supranational organizations of governance, the liberalization of capital flows and labor market, globalization of training market (universities) determined that government systems become inoperable.
Two solutions to overcome the state crisis are outlined: • The new public management in response to the financial crisis and the need to
make efficient state. • The new pluralistics government pluralistic as a consequence of demographic
and technological changes.

102 Guţă, A.J REFERENCES: [1]. Hinţea, C.; Mora, C. (2000) Management public, vol. 1 şi vol. 2, Editura Accent, Cluj
Napoca [2]. Cole, G.A. (1992) Management, Theory and Practice, Londod, D.P. Publications Aldine
Press [3]. Constantinescu, D.A. şi colectiv (2000) Management strategic, Colecţia Naţională,
Bucureşti [4]. Mariş, M. (ed.) (2002) Administraţie publică, Editura Accent, Cluj. [5]. Slusariuc, G.C. (2010) Financing the Programs of Local Development in Tourism,
Conferinţa Internaţională “European Integration – New Challenges”, Ediţia a VI-a, Facultăţii de Ştiinţe Economice, Oradea

Annals of the University of Petroşani, Economics, 12(4), 2012, 103-108 103
THE PLACE OF FACEBOOK IN INTERNATIONAL SOCIAL NETWORK PORTFOLIO
ALIN CRISTIAN ISAC *
ABSTRACT: The paper aims to present a structure for social networks by various criteria, such as: user types, informational technology used as support and developed applications. Based on these elements, we presented Facebook not only in terms of user numbers and their evolution but also regarding the Facebook business, starting from share listing on international markets. KEY WORDS: social networks; Web 3.0; informational logistic support; users. JEL CLASSIFICATIONS: F23, O32 1. INTRODUCTION
The study of social networks is the information on capital that a person from a particular network holds and presents how people interact within that network, respectively some of their preferences, attitudes or manifestations. When they were started, the social networks had a minimal role of interaction between registered users and some of them remained at this early stage of development, such as “Friendster” or “Tribe.net”, developed in 2003. So, if the original role of social networks was limited to an interaction platform between signed up users, the transition to Web 2.0 and, in the future, to Web 3.0 makes these networks become a complex economic phenomenon necessary within the globalization context and within the transition to a new global economic order based on the development of the informational society.
Currently there are over 200 social networks, some of them famous, whose development had a major social and financial impact with multiple influences from online marketing, human relations to capital markets. On Wikipedia, these web networks are called "social networks”. Lately, a social network is also described as an informational network of internet users from certain websites where users can register and interact with others already signed up.
* Lecturer, Ph D, University of Petrosani, [email protected]

104 Isac, A.C.
The members of a social network are informally connected, without obligations, but they usually contribute actively to collecting and spreading information across the globe through the Web [5]. 2. WHY STUDY SOCIAL NETWORKS ?
Studying social networks allows us to understand how people communicate, how they prioritize and value interactions, what are their needs underlying connections between people, why and how people socialize [1]. The study of social networks should be analyzed from the perspective of the one who wants to use its results.
A sociological studies the social network to understand group dynamics, relationships and relations between age, sex, professional fields and areas, unlike a specialist in marketing who tries to obtain as much information about consumer habits, preferences and how they can be contacted directly. HR managers can find useful information about their employees and they can take decisions regarding the implementation of communication strategies which to increase cohesion and functional relations between the members of the coordinated teams, so they can understand better the formal and informal organizational relations and can act accordingly.
At company level, the benefits can be multiple and different depending on the social network. Generally, specialists show that the presence on such a network generates high visibility, attracting visitors interested in the business of the company, an efficient relation between the money invested for page management and the increase in the number of followers, increased position in search engines etc.
Obviously, the usefulness of social network analysis can get a major role in case of economic, social and political phenomenon, not only national but also at regional or even worldwide. Therefore, it’s already acknowledged the role of social networks like Facebook and Twitter in organizing the social events in Egypt and Tunisia and how they succeeded in turning a virtual protest into real events. 3. CLASSIFICATION AND CHARACTERISTICS
The digital interaction recorded a massive development during the past five
years through social networks with Web 2.0 and Web 3.0 technologies, which allowed not only the increase in user numbers but also in the type of applications developed.
Table 1. Social networks classification and characteristics
Classification criterion
Network type Features Examples
Universal networks
Addresses all internet users, regardless of age, training, geographical space.
Facebook with over 1100 million users Hi5
User category
Networks of niche or specialized that targets a smaller group of users compared to universal networks.
Professionals networks Linkedln for professional contacts, focused especially on business, an environment of recruitment for HR departments Academia.edu - network for

The Place of Facebook in International Social Network Portfolio 105
researchers interaction Social video sharing platform
Viewing platforms and video sharing
YouTube uses Adobe Flash Player technology to display a wide range of videos, some even created by users Vimeo - site for art and for filmmakers needs
Technology
Blogging and microblogging platformsare the new ways of disseminating information in a Web 2.0 social [4]
Limited length - only 140 characters - world press
WordPress is the most popular and powerful blogging platform and one of the most popular CMS that can be used to develop websites of any kind
Complex platforms They have built satellite applications that allow beside socializing and gaming related applications, platform rebates, electronic stores, etc.
SiteTalk – has a Cashback platform, auction for electronic products, deals for offering discounts to network members
Application complexity
Simple platforms They allow the interaction between user and promotion component
Netlog an online social portal, which is aimed for young Europeans
Generally, media specialists state that the use of internet and social networks
vary by demographic characteristics, which allows the development of custom advertising applications not only for companies but also for political organizations, government or social organizations.
The multitude of social networks developed made necessary their classification on several criteria (table 1). 4. SOCIAL NETWORKING - INFORMATIONAL LOGISTIC SUPPORT
Obviously presenting the advantages or weaknesses of using one or more social networks, not only from the perspective of the individual user and of the specialists who use the information, is a non-realistic approach because the evolution of operating mechanisms and advertising tools is very quick in this area and may be supported by eloquent statistics.
Thus, one of the social media dedicated sites, www.socialmediatoday.com, shows some of the variables with an accelerated development in the field, as follows [2]: • 27% of total US internet time is spent on social networking sites; • 21% of marketers say that social media has become more important to their
company over the past 6 months; • Social media produces nearly double the marketing leads of trade shows,
telemarketing, direct mail or PPC; • Women (48%) are more likely than men (43%) to regularly check out a brand's
social page; • 23% of marketers are investing in blogging and social media this year—a 9%
annual increase.

106 Isac, A.C. 5. FACEBOOK
By far the most popular networking website, Facebook is a internet social network type website created by Mark Zuckerberg in 2004 to provide the opportunity to contact close persons, but also unknown people.
At this time Facebook is the most popular social network in the world and is supported by the fact that: 74% of all marketers say Facebook is important to their lead generation strategies, companies that generate more than 1,000; Facebook likes also get close to 1,400 website visits daily; 52% of all marketers have found a customer through Facebook in 2013 so far; on Facebook, brand posts achieve 50% of their reach within 30 minutes; 85% of Facebook fans of brands recommend them to others, compared to 60% of average users.
If we consider the spectacular increase number of users, we can predict a significant increase in the next 10 years for both the number of Facebook users and for the applications developed through the network. Thus, only during 2008-2012, the number of users increased 18+ times. During 2010-2012 the average number of users experienced a divergent development in different parts of the world.
In the U.S. and Canada there was a moderate growth with an average annual rate of 12.5%, while in Europe the average growth rate was nearly 40%. Unlike these two traditional areas regarding the use of social networks, in Asia the growth is over 80%, while for other areas South America, Australia and Africa, the growth was over 220%.
Figure 1. Monthly active users from 2004 to 2012
Regarding the number of Facebook users forecast, we found an interesting statistic on www.emarketer.com which compared the total number of social networks users to the number of internet users worldwide and to the global population.
The 2017 forecast shows an increase of the Facebook position, so if currently, the number of Facebook users represents 42.6% of the total number of Internet users and over 15% of the global population, for 2017 experts consider a relatively moderate increase, not as spectacular as in the first 7 years of Facebook.

The Place of Facebook in International Social Network Portfolio 107
For the 4 years predicted, the average growth rate is over 2%, considering that more than half of the world internet users will be on Facebook (Table 2).
The situation in Romania of Facebook users is presented eloquently on www.facebrands.ro showing a spectacular increase of 2.5 times for Facebook users within the past two years, reaching more than 6.2 million users.
Given that in June 2012 the total number of Internet users in Romania was 9,642,383 and the Romanian population on October 20, 2011 was 20,121,641 inhabitants, Facebook users share is over 62% of all internet users, while over 31% Romanians have Facebook accounts.
Table 2. Facebook Users and Penetration Worldwide 2011-2017
Indicators 2013 2014 2015 2016 2017
1 Facebook users
(millions) 1098,2 1265,3 1443,7 1609,9 1771,6
2 % of social network
users 63 64,4 66,3 67,9 69,5
3 % of internet users 42,6 45,8 49,1 52 54,7
4 % of world population
15,4 17,7 19,9 22 23,9
Source: www.emarketer.com [3]
Source: http://www.facebrands.ro/demografice.html [6]
Figure 2. Evolution number of Facebook users in Romania

108 Isac, A.C. 6. CONCLUSIONS
As a standard for social networks, Facebook has been embarked on the Nasdaq stock market in New York with largest IPO so far conducted in IT, having the certification of more than 1,000 millionaires in dollars and the price of $ 38 per share.
Although it initially attracted $16 billion, the third largest IPO in the U.S. history after Visa and General Motors, the evolution of Facebook shares was oscillatory, with a downward trend.
As shown in the figure below, 2012 was a year of significant oscillations of share value, although most of the financial indicators predicted a historical growth of network value.
Figure 3. The evolution of Facebook shares
Many times the share valuation is limited to a complex set of financial indicators, without taking into consideration a portfolio of less measurable aspects and features, but with significant effects on the image of a company. Facebook is also this case. The social and political implications mentioned in the above paragraphs, youth Internet addiction as discussed by psychologists or sociologists, aggressive promotional strategy are a few issues that may affect the future share values.
REFERENCES:
[1]. Mazili, C. (2011) Necesitatea utilizării reţelelor sociale, Web Marketing PCG, february [2]. Romeri, M. (2013) New Statistics Highlight the Power of Social Media Marketing, Social
Media Todaz, May [3]. www.emarketer.com [4]. http://mediadigitala.ro/images/retele_sociale/retele_de_socializare_pe.pdf [5]. http://ro.wikipedia.org/wiki/Re%C8%9Bea_de_socializare [6]. http://www.facebrands.ro/demografice.html

Annals of the University of Petroşani, Economics, 12(4), 2012, 109-116 109
COMPARATIVE ANALYSIS OF THE UNEMPLOYMENT BETWEEN ROMANIA AND MOLDOVA
CLAUDIA ISAC, MIHAELA BAHNARU, ANA-PETRINA STANCIU
ABSTRACT: Recently, the social security literature noted a major change towards the legal aspects in this field, lowering the importance of the expense and tax issues pursued by economists in their activities. Without minimizing the consistent and continuous importance of the legal foundations of the social security policy implementation, it is necessary that not only the media and the governmental authority websites to disclose information in the social insurance field, but the role of specialists, researchers and academics in finance, tax and even accounting have the role to interpret and give relevant solutions to these issues. Therefore, in this paper, we present in detail the comparative aspects of how the social security segment is organized, mainly the unemployment insurance in both Romania and Moldova by highlighting the financial differences and similarities of these systems.
KEY WORDS: unemployment; social insurance; financial statements; unemployment allowance.
JEL CLASSIFICATION: J64; J65. 1. UNEMPLOYMENT - LABOR MARKET ADJUSTMENT LEVER
Etymologically, the term unemployment is synonymous with "inactive", and after a derivation from the latin expression "high heat" which caused every activity to stop, we get to the French "chomage" and thus is taken into Romanian "şomaj".
The International Labor Office defines the unemployed as a person who reached 15 and meets all the following requirements: is able to work, is deprived of a job, is looking for a paid job, is available for a paid or unpaid activity.
Assoc. Prof., Ph.D., University of Petrosani, Romania, [email protected] Student, University of Petrosani, Romania, [email protected] Assoc. Prof. , University of Petrosani; Ph.D. Student, Academy of Economic Studies, Bucharest, Romania, [email protected]
110 Isac, C.; Bahnaru, M.; Păun, A.P.
As a recent economic phenomenon in Romanian economy, the unemployment was perceived as a major labor market dysfunction defined by a surplus of labor compared to the demand or as a negative aspect of the economy, whose consequences affect a part of the population which is able to work by failing to assign jobs (figure 1).
Source: Dobre-Baron, O.; Niţă, D.; Fleşer, A. (2009) Economics II, Manual for distance learning, Petrosani, p.89
Figure 1. Unemployment effects
Stimulates the employed to respond positively to the professional development employers and prepares the workforce for a greater mobility and adaptability.
Unemployment effects (costs)
Positive Implications
Negative implications
Personal level
- economically – the income reduction and thus the consumption possibilities for the entire family
- moral - being unemployed entails nervous stress, a depressed mood, which, unlike the economic consequences, cannot be measured
Economic and social
level
- Lower overall revenues reduces the country budget incomes (lower wage taxes, VAT, excise, etc.) resulting in a reduction of public expenditure;
- the pressure on employees which leads to the reduction of their wage incomes and to the overall reduction of the venues which diminishes the country budget income.
- Underutilization of labor, which affects negatively the output, resulting in income decrease (wages, profits) and, consequently, a decrease in consumption and investment;
- Underutilization of labor, which affects negatively the output, resulting in income decrease (wages, profits) and, consequently, a decrease in consumption and investment;
- the increase of the country expenses for placement office activities, the unemployment payments and other social expenses related to the qualification, professional reconversion and others;

Comparative Analysis of the Unemployment between Romania and … 111
Following the trend of increasing the human role at micro and macro economic level, the unemployment becomes a normal phenomenon in a well developed economy, where the mechanisms are self adjusting and operate from the equilibrium given by the ratio of supply and demand which is freely and continuously active in all the business and social sectors of the national economy. Therefore, unemployment should be seen as an economic adjustment process and as a normal social phenomenon as long as the unemployment rate and other indicators do not notice any threats on the labor market. We should not develop a negative view on the unemployment, but rather a better perspective on its positive and negative consequences and a more effective focus on how to increase the employment ratio and to offer training flexibility to the subjects (Niță & Fleșer, 2011). The opinions of specialists from national and international literature, emphasize that even though generally the characteristics, effects, costs for this phenomenon are relatively similar in countries with the same level of development, the specific aspects of every country have to be studied, analyzed and compared separately. Starting from this premise, we will present several elements of the unemployment problems and unemployment insurances in Romania and Moldova. 2. STATISTICAL ANALYSIS ON THE UNEMPLOYMENT AND WORKFORCE IN MOLDOVA AND ROMANIA Unemployment represented for Moldova and Romania, as former communist countries, a new phenomenon, whose appearance caused multiple social effects and costs for reducing these effects. Thus, to reduce the negative influences of the unemployment and to increase the employment of labor in both countries there were established government organizations to manage this phenomenon. The main indicators which are monitored by the two institutions, called National Employment Agency, are calculated using the methodology of the International Labor Office.
Figure 2. International Bureau of Labor unemployment levels in absolute and relative values in Romania
Unemployment at International Bureau of Labor No. of unemployed Unemployment rate (left scale)

112 Isac, C.; Bahnaru, M.; Păun, A.P.
Thus, when we analyze the unemployment rate in the two countries, we observe that in Romania during November 2008 and- November 2011, although the rate is generally increasing with a ratio of over 2% in the first year of the period, it records a slight decrease towards the end of the interval. Meanwhile Moldova records less fluctuating unemployment ratios, but higher values of about 9% in the beginning of every year. As shown in figures 2 and 3, both countries have at the end of 2011 unemployment values of about 7%.
Source: http://www.statbank.statistica.md
Figure 3. International Bureau of Labor unemployment levels in absolute and relative
values in Moldova during 2008-2011
Related to the structural unemployment evolution it may be identified the following estimation elements: A. Distribution by level of education. Generally, statistics show that the unemployment ratio is inversely proportionate with people’s training level, therefore, as an example, in Romania in 2013, there is a low percent of unemployed with high education, only 7%. Instead, the unemployment of non-educated and of those with only primary, secondary or vocational studies represents 73% of total unemployment (figure 4). Surprisingly, Moldova has equal ratios of unemployment for those with high education studies and for those with high school, while lower education levels have low ratios of unemployment, a reversed situation compared to Romania. The explanation is that the most common jobs do not require higher education, from the industrial and services fields, while, on the other hand, most high school graduates leave the country to continue their studies and are not taken into evidence by the Labor National Agency in Moldova. The persons with no education or primary school are least affected by unemployment, the low level of 0.2 – 1.9 thousands is reasoned by the fact that most people easily accept the labor market offers while other categories look for a appropriate job for their qualification and training level.

Comparative Analysis of the Unemployment between Romania and … 113
73
20
7
0
10
20
30
40
50
60
70
80
Nivel primar, gimnazial,profesional şi fără studii
Nivel liceal şi post-liceal Nivel universitar
Dis
trib
uţi
a n
umăr
ulu
i d
e şo
mer
i, %
Source: http://www.legestart.ro/somaj-februarie-2013
Figure 4. Unemployment distribution by level of education in Romania in 2013
0
10
20
30
40
50
2000 2001 2002 2003 2004 2005 2006 2007 2008 2009 2010 2011 2012
Ani
Şo
mer
i B
IM,
mii
per
soan
e
Superior Mediu de specialitate Secundar profesional
Liceal, mediu general Gimnazial Primar sau fără școală
Figure 5. Unemployed distribution by level of education in Moldova during 2000-2012
B. Urban / rural distribution. According to figure 6 in Romania during 2008-2011, the unemployment rate in urban areas is higher than in rural areas, the recorded values are ranged between 7.2% and 9.9%. The unemployment in rural areas is constant between 5.3% -5.9%. Roughly, the same trend occurs in Moldova, namely the higher unemployment ratios in urban areas. However, if we consider a longer period, since 2000, the conclusions of the analysis are quite different from some simple or normal unemployment and its influence within the two environments. Moldova is a very interesting case considering that, in the beginning of the period, the urban unemployment rate was 4 times higher than in rural areas, while lately this proportion was halved. This positive phenomenon is expressed by the development of some
Un
empl
oym
ent
dist
rib
uti
on %
No education, primary, secondaryor vocational school
High school High education
IBL
un
empl
oyed
, tho
usa
nds
peo
ple
Years

114 Isac, C.; Bahnaru, M.; Păun, A.P. specific urban sectors, respectively services, commerce and even industry. Another explanation given by sociologists is the population migration from rural areas to abroad looking for work, unlike Romania, where most citizens who left the country to work comes from urban areas.
7,2 7,5
9,98,8
5,3 6 5,8 5,9
0
2
4
6
8
10
12
2008 2009 2010 2011
Ani
Rat
a şo
maj
ulu
i, %
Urban Rural
Source: www.insse.ro
Figure 6. Unemployment distribution in urban/rural areas in Romania
0
20
40
60
80
100
120
2000 2001 2002 2003 2004 2005 2006 2007 2008 2009 2010 2011 2012
Ani
Şo
mer
i B
IM,
mii
per
soan
e
Urban
Rural
Source: http://www.zf.ro
Figure 7. Unemployment distribution in urban / rural areas in Moldova 4. COMPARATIVE ANALYSIS OF THE UNEMPLOYMENT ALLOWANCE BETWEEN ROMANIA AND MOLDOVA
Elements that differentiate the unemployed financial protection system,
respectively the payment period and the value of the unemployment allowance are presented in the following tables:
Un
emp
loym
ent
rate
, %
Years
IBL
un
empl
oyed
, tho
usa
nds
peo
ple
Years

Comparative Analysis of the Unemployment between Romania and … 115
Table 1. The payment period of the unemployment allowance
Length period in: Romania Moldova
The payout period of unemployment allowance in Romania and Moldova
1 to 5 years 9 months to 5 years 6 months From 5 to 10 years 9 months For over 10 years 12 months
Table 2. The amount of unemployment allowance
Romania Moldova
The value of unemployment allowance is determined differently depending on the reason of activity cessation for the individual:
The amount of unemployment benefits in% of the average salary of the person calculated in the manner prescribed by the Government
Death of the individual employer, declared dead by a court decision
50%
Activity liquidation or end of the individual employer
50%
Decrease of the number of staff 50%
Company activity license withdrawal
40%
Fixed term individual employment contract end
40%
The employee does not meet the health requirements of the job, according to the medical certificate
40%
Unemployment allowance is determined in proportion to the past work period of the person. Percentage rates vary depending on the length in service for each person. The calculation basis is 75% of the actual social reference indicator and is provided in case of a minimum contribution period of one year. To the base is added: a) 3% for individuals whose contribution period is at least 3 years; b) 5% for individuals whose contribution period is at least 5 years; c) 7% for individuals whose contribution period is at least 10 years; d) 10% for individuals whose contribution period is at least 20 years.
Ceased the work abroad, through a preliminary individual social insurance contract
30%
Table 3. The unemployment allowance payment is stopped
in the following cases
In Romania In Moldova Similarities
In case of unreasonable refusal of a proper job provided by the Agency In case of unjustified refusal to participate in to work training and stimulating courses or in case of their stoppage In case of fulfilling the age conditions for retirement In case of death of the individual
Differences At the date of legal employment for a period of at least 12 months
On employment

116 Isac, C.; Bahnaru, M.; Păun, A.P. At the date when he / she gets, through authorized activities, higher incomes than the actual social reference indicator
On obtaining the entrepreneurship authorization
On individual's departure abroad for more than 3 months
On the abroad departure of the individual
On the start of an imprisonment sentence for at least 12 months
At the date of conviction decision
On admission to an educational institution for school graduates or special disability schools graduates of at least 16 years
The individual studies full time in an education institution
5. CONCLUSIONS Based on the comparisons from this paper we can conclude that the two unemployment insurance systems are similar and the differences can be eliminated in favor of more efficient ones. Therefore, changing the unemployment allowance conditions by lowering the contribution period from 12 to 9 months or lowering from 3 to 2 years the compulsory enrollment period of the graduates by the employers which get financial grants and facilities from Labor National Agency for their employment are two measures which can be taken by Romania in order to have a positive influence on unemployment. For Moldova, it can be considered the introduction of the social reference indicator as base for calculating unemployment allowance, an indicator based on a minimum budget/person.
REFERENCES: [1]. Dobre-Baron, O.; Niţă, D.; Fleşer, A. (2009) Economics II, Manual for distance learning,
Petrosani, p.89 [2]. Niță, D.; Fleșer, A. (2011) Youngster disadvantage group on the labour market –
alternative employment, Annals of the University of Petroşani, Economics, 11(1), pp.179-186
[3]. http://www.statbank.statistica.md [4]. http://www.legestart.ro/somaj-februarie-2013 [5]. www.insse.ro [6]. http://www.zf.ro

Annals of the University of Petroşani, Economics, 12(4), 2012, 117-128 117
INCOME INEQUALITY IN SOME MAJOR EUROPEAN UNION ECONOMIES A DISCRIMINANT ANALYSIS
JYOTIRMAYEE KAR *
ABSTRACT: This exercise is an attempt to assess the importance of some social, economic, demographic and infrastructural factors which account for the prevailing income inequality across some of the EU countries. Using discriminant analysis the study suggests that crime recorded by police is the most important predictor in discriminating between the group of countries with relatively more equitable distribution of income from those with less. This variable is followed by number of students in the country. Reduction in the level of crime and improvement in the student strength could help in reducing income inequality. Quite intuitively, improvement in all the economic factors like GDP per capita and agricultural index will help to reduce income inequality. Identical is the case of the demographic factors. This calls for implementation of developmental policies towards improvement in these areas. KEY WORDS: income inequality; GDP per capita; EU countries. JEL CLASSIFICATION: C82, E66, E69, O22, O29, O52. 1. INTRODUCTION The European Union (EU) is an economic and political union or a confederation of 27 states, located primarily in the Europe. The Union was originated from the European Coal and Steel Community (ECSC) and the European Economic Community (EEC). Started by six countries, in 1958 the membership has increased to 27. In the intervening years the EU has grown in size by inclusion of new member states, and in power by the addition of policy areas to its remit. The Maastricht treaty established the European Union under its prevailing name, EU in 1993. The latest amendment to the constitutional basis of the EU, the Treaty of Lisbon, became operative in 2009. The European Union is composed of 27 sovereign Member States: Austria, Belgium, Bulgaria, Cyprus, the Czech Republic, Denmark, Estonia, Finland, France,
* Prof., Ph.D., ICFAI Business School, Bhubaneswar, Orissa, India, [email protected]

118 Kar, J. Germany, Greece, Hungary, Ireland, Italy, Latvia, Lithuania, Luxemburg, Malta, The Netherlands, Poland, Portugal, Romania, Slovakia, Slovenia, Spain Sweden and The United Kingdom. The Union's membership has grown from the original -Belgium, France, (then-West Germany, Italy, Luxembourg and the Netherlands-to the present day 27 by successive enlargements as countries acceded to the treaties and by doing so, pooled their sovereignty in exchange for representation in the institutions. The EU operates through a system of cross national independent institutions and negotiated decisions by the member states. The European Commission, the Council of the European Union, the European Council, the Court of Justice of the European Union and the European Central Bank are some of the major institutions of the EU. The European Parliament is elected every five years by the EU citizens. Within the Schengen Area (which includes EU and non-EU states) passport controls have been abolished. EU policies aim to ensure free movement of people, goods, services and capital and enact legislation in justice and home affairs, and A monetary union, the Eurozone, using a single currency, was established in 1999. As of January 2012, it is composed of 17 member states. Through the Common Foreign and Security Policy, the EU has developed a limited role in external relations and defense. EU is represented as a unified body at the United Nations, the WTO, the G8 and the G 20. With a total population of over 500 million, which comprises 7.3% of the world total the EU had a nominal GDP of 16,242 billion US dollars in 2010, which represents an estimated 20% of global GDP, measured in terms of purchasing power parity. This made EU, the largest economy in the world. The EU has developed a single market through a standardized system of laws which apply in all member states. It is the largest exporter, the largest importer of goods and services, and the biggest trading partner to several large countries such as China, India and the United States. As declared by the Fortune Global 500, in 2010, of the top 500 largest corporations measured by revenue, 161 have their headquarters in the EU. In May 2007 unemployment in the EU was 7%, while investment was at 21.4% of GDP. Inflation stood at 2.2% and public deficit at −0.9% of GDP. Though member of a single union, there exist wide disparity in the income across the EU countries. GDP per capita is often used as an indicator of countries' level of welfare. But this does not reflect the extent of income disparity across the countries. Often an alternative welfare indicator is adapted to better reflect the situation of households. It is the Actual Individual Consumption (AIC) per capita. Generally, levels of AIC per capita are more homogeneous than those of GDP. In this respect also, the Member States of EU exhibited substantial differences across themselves. In 2010, AIC per capita, expressed in terms of purchasing power parity, in the member states, ranged from 42 per cent to 150 percent of the EU 27 average. It ranged between 50% above the EU 27 average in Luxembourg and nearly 60% below average in Bulgaria. Another factor, which can reflect comparative welfare condition across the EU economies, is the extent of income inequality. Present study has incorporated this variable. Inequality of income ranges from a low of 3.2 in Slovenia to the high of 7.3 in

Income Inequality in Some Major European Union Economies ... 119 Latvia. The correlation between GDP per capita and the extent of inequality of income is negative, but insignificant (-0.395). High per capita income reflecting high growth does not indicate greater development. Developed economy like UK has a high extent (5.3) of income inequality (figure 1.).
0
2
4
6
8
Belgium
Bulgaria
Czech Republic
Denm
ark
Germany
Estonia
Ireland
GreeceSpain
France
Italy
CyprusLatvia
Lithuania
Luxembourg
HungaryMalta
Netherlands
Austria
Poland
Portugal
Romania
Slovenia
Slovakia
Finland
Sweden
United Kingdom
Norway
Switzerland
FYR of M
acedonia
Croatia
Turkey
Iceland
Inequalityof income distribution
Figure 1. Inequality of income distribution Then what explains development and equitable distribution of income across the EU countries? Is it a political factor like membership of EU or other socio-economic factors? To explore this, present exercise has segregated the economies on the basis inequality of income and using Discriminant Analysis, has attempted to explain which of the 12 selected factors could be the most important in defining inequality. 2. SOME EARLIER STUDIES Decade’s worth of scholarship has examined the inequality issue. Tárki european social report (2008) presents the scenario in detail. Niehues (2009) has examined income inequality within and between European countries. The study concludes that inclusion of new EU member countries has significantly increased inequality. Overall trend in EU-15 observes changing within-country inequality but there has been no significant reduction of the inequality between countries. The study records contradiction of convergence process of mean incomes across the EU-15 member states. It also explains that lower mean incomes of new member countries are responsible for substantial increase in overall EU income inequality. Checch et al (2010), observe the extent of income inequality and opportunity inequality in 25 European countries. Their work contributes to understanding the origin of standard income inequality, which helps to identify potential institutional setups that are associated with opportunity inequality. They have distinguished between ex ante and ex post opportunity inequality. They find that ex ante equality of opportunity exhibits positive correlation with public expenditure in education, whereas ex post equality of opportunity is positively associated with union presence and to fiscal redistribution.

120 Kar, J. Atkinson et al (2010), highlight financial dimensions of poverty and inequality in the European households. They have examined the distribution of income in the 27 Member States of the EU to assess the magnitude of difference within and across the countries. Examining changes overtime in income inequality and poverty, they have concluded in which countries the differences are the largest. They have highlighted those households, which according to the EU definition are ‘at-risk-of-poverty’. Aaberge et al (2010) have evaluated the effects of the value of education and health care services on estimates of income inequality and poverty in the EU countries and Norway. They have examined whether and eventually to what extent, estimates of inequality and poverty will be affected by extending the definition of income to include basic in-kind transfers, and whether the ranking of countries, according to the level of inequality and poverty, changes. An M Sc thesis guided by Dr. Tom van Veen (2009) examines the relationship between economic freedom and income inequality, across the 27 European Union Member States over a time-period from 1975 to 2006. The study has made a distinction between 15 old and 12 new Member States of the European Union to investigate whether the recent changes in the new Member States have any impact on the level of economic freedom, political freedom, and their relation to income inequality. Results of the study show that economic freedom positively influences income inequality. This was most evident for the 12 new Member States. Political freedom is observed to positively influence economic freedom as well as income inequality. However, in the case of the 15 old member states the relationship between political freedom and income inequality is found to be negative. Overall, for the 27 EU Member States the level of income inequality in a country is highly influenced by the governmental role in the economy. Biewen (2001) develops a discrete variant of the semi-parametric methodology to measure the effects of socio-economic variables on the income distribution. This method is based on the calculation of hypothetical income distributions by reweighting the original population. The study has applied this framework to examine the distributional effects of rising unemployment, decreasing female labor market participation, and widening income structure in East Germany following the reunification with West Germany in 1990. The empirical results suggest that these factors contributed considerably to the recent increase in income inequality in East Germany. Večerník (2010) has studied the simultaneous changes in earnings disparities, inequality of household income, and the connections between them. The work presents various data on four Central and East European (CEE) countries and, for the sake of comparison, partially on Austria and Germany. First, the study compares the changes in both the distributions over time since the communist period and seeks to answer how much did disparities and inequalities increase during the transition? Second, it examines how should the association between personal and household earnings be analyzed? Third, it observes how strong was and currently is the association in CEE countries and how do they differ in packaging family income? The study categorizes income under two perspectives: employed persons (examining the association between their earnings and the income of the households they live in) and employee households

Income Inequality in Some Major European Union Economies ... 121 (examining the sources of their income by decomposing their inequality). The findings that, earnings disparities and income inequalities rose more or less in all four CEE countries after 1989, are confirmed by various sources. This is visible in the individual countries in various phases of their transition. However, as reveled by the the EU-SILC surveys, no increase occurred from 2004 to 2007. Rodríguez-pose and Tselios (2009) have considered regional disparities using microeconomic data aggregated at the regional level. They have not only used the average, but also inequality levels of individual incomes within regions. The study maps regional personal income distribution in Western Europe, using data from the European Community Household Panel (ECHP) data survey covering more than 1,00,000 individuals, for 102 regions, and over the period 1995–2000. The study observes a strong U-shaped relationship between income per capita and inequality. It also observes that regions with similar income conditions tend to cluster within and across the national borders. It is interesting to record that there exists a North-South and an urban-rural divide in terms if inequality. The northern regions and city-regions have the highest economic development, as well as the lowest levels of inequality. Directorate-General for Research Report (2010) containing the results of the EU Framework Programme projects found that poverty and intergenerational transmission of inequality is considerable in all countries studied, but its levels vary among EU Member States. This highlights the role of the welfare state in reducing inequality. The study prescribes policies facilitating generation of good quality and well rewarding jobs. This will effectively redistribute resources in favour of the poor and facilitate children with education and care. The study highlights that education and learning policies can contribute to overcome intergenerational transmission of inequality in addition to policies combating poverty. However, education and learning should be viewed in connection with other social factors like employment, economy, youth, healthcare, justice, housing and social services, related to exclusion. Harjes (2007) examines the impact of globalization on high and evenly shared living standards. Measures of income distributions, based on household disposable income suggest that inequality has increased in most of the industrialized countries. But this development was very uneven and much less pronounced in euro-area countries, suggesting that broad phenomena such as trade liberalization and technological change may not be major drivers of inequality. His paper analyzes the evolution of income distributions based on household data across industrialized countries over the past decades to identify stylized facts that could help discriminate between competing hypotheses for the evolution of income inequality. The paper presents more detailed measures of income distributions than Gini coefficients. Present exercise, however, attempts to explain income inequality by using some socio-economic factor. The objective is to find out which socio-economic factor help in reducing income inequality so that policy measures could be chalked out accordingly. It is also expected to add value to the existing literature. After the introductory note and review of some earlier studies the next two sections present broad objectives and limitations of the study. The fourth examines the factors included to explain the extent of inequality. The fifth section conducts a discriminant analysis to determine the influence of these factors. This section also

122 Kar, J. discusses the results and summarizes the issue. The last section contains concluding remarks and policy prescription. 3. OBJECTIVES Broad objectives of the study are: - to segregate the EU countries on the basis of prevailing income inequality, - to find out which social, economic, demographic or infrastructural factor
contributes to this inequality. - to come up with necessary policy suggestions on the basis of the results 4. METHODOLOGY AND LIMITATIONS The 27 EU countries are segregated into two groups applying Beta analysis. This method is widely used for developmental studies. The calculation has been done in Excel. Then the study uses discriminant analysis to identify which factor contributes to income inequality across EU countries. The disscriminant score of the independent variables are estimated by using SPSS. Due to missing variables all the 27 members could not be considered in the analysis, which has included 20 cases. 5. DATA AND VARIABLE SPECIFICATION Inequality of income measures the ratio of total income received by the 20 % of the population with the highest income (top quintile) to that received by the 20 % of the population with the lowest income (lowest quintile). This means a high value of the ratio reflects more inequality. Disposable income is considered as income for the analysis. The study has incorporated some economic variables like GDP per capita as per Purcasing Power Standard (PPS), index of agricultural income, annual growth rate of retail trade; demographic factors like population (65+), total life expectancy at birth, number of students; social development indicators like number of persons with a second job, number of crime recorded by police and infrastructal development representing inland freight by rail, energy prices and domestic expenditure on R & D by businesses. In 2010, the Gross Domestic Product (GDP) per capita in Luxembourg, expressed in purchasing power standards (PPS), was more than two and a half times the EU27 average, while that of the Netherlands was one third above the average. Ireland, Denmark, Austria and Sweden had GDP per capita between 20% and 30% above the EU27 average, while Belgium, Germany and Finland had that between 15% and 20% above average. The United Kingdom and France registered GDP per capita around 10% above the EU27 average, while Italy, Spain and Cyprus were very close to the average. Greece, Slovenia, Malta, Portugal and the Czech Republic were between 10% and 20% lower than the EU27 average, while Slovakia was around 25% below.

Income Inequality in Some Major European Union Economies ... 123 Hungary, Estonia, Poland, Lithuania and Latvia, with a low per capita income were place between 35% and 50% lower, while Romania and Bulgaria were around 55% below the EU27 average. There exists a significant variance for annual per capita income within individual EU states, which ranges from €11,000 to €70,000 (about US$14,000 to US$90,000) (figure 2).
0,00
200,00
400,00
Belgium
Bulgaria
Czech
Den
mark
German
yEstonia
Irelan
dGreec
eSp
ain
Fran
ceItaly
Cyp
rus
Latvia
Lithuan
iaLu
xembourg
Hunga
ryMalta
Netherlands
Austria
Poland
Portuga
lRoman
iaSlove
nia
Slova
kia
Finland
Swed
enUnited
Norw
aySw
itzerlan
dFY
R of
Cro
atia
Turkey
Icelan
d
GDPPer Capita
Figure 2. GDP Per Capita The study has incorporated GDP per capita as one of the determining variables of income inequality. It is expected that per capita GDP will well explain higher and lower income inequality. Agriculture does not contribute much to the GDP of the EU countries, despite 31% of the total budget expenditure. This is reflected by Gross value Added by Agriculture (% share of total value added) (figure 3).
0
50
100
150
200
250
300
Belgium
Bulgar ia
Czech R
epublic
Denm
ark
Germany
Estonia
IrelandGreece
Spain
France Ita
ly
Cyprus
Latvia
Lithuania
Luxembourg
Hungary
Malta
Nethe
rlandsAustria
Poland
Portugal
Roma
nia
Slovenia
Slovakia
Finland
Sweden
United KingdomNorway
Switzerland
Croatia
Iceland
%Shareof Agcle
GDPPer Capita
Figure 3. Gross value Added by Agriculture (% share of total value added) The index of income from agricultural activity is also not very impressive. The correlation between agricultural index and income inequality is positive but insignificant (0.142). It is expected that a country with a larger share of agricultural income will have high income inequality. Of these two variables index of income from agricultural activity is used as a discriminating variable.

124 Kar, J. Another economic factor included in the study is annual growth rate of retail trade. Growth in retail trade is expected to reduce inequality. The correlation between these two is negative and significant at 0.01 levels (-0.543). Demographic factors like population (65+), number of students and total life expectancy at birth are expected to bring about greater equality in income distribution. Similarly, social development indicators like number of persons with a second job and reduction in the number of crimes recorded by police are expected to reduce inequality. Infrastructural development is represented by inland freight by rail, energy prices and domestic expenditure on R & D by businesses. All these variables have negative correlation with income inequality. In the case of rail freight the coefficient is insignificant (-0.065), while those of the latter two, -0.463 and -0.462 respectively, are significant. Improvement in all these, are expected to reduce income inequality. 6. DATA ANALYSIS Using beta distribution the 20 EU countries for which data are available are categorized into two groups. The first one comprises 12 countries with less income inequality (Slovenia, Czech Republic, Slovakia, Finland, Sweden, Belgium, Netherlands, Ireland, Luxembourg, France, Germany and Denmark) and the second group has 8 countries (Estonia, Poland, Bulgaria, Spain, Portugal, Lithuania, Romania and Latvia) with relatively high income inequality
Table 1. Case Summaries of 12 countries with relatively low Income Inequality
GDP Per
Capita
Ag Index
%Share Of
Agcle
Age Life Exp
Studnt 2nd Job
Crime Gr Retail
Rail Energy Prices
R&D Exp
N 12 12 12 12 12 12 12 12 12 12 12 12 Minimum 72 56,7 0,3 11,05 74,93 80,20 1,01 28,25 -10,48 2,7 7,83 0,2 Maximum 267 125,1 2,7 20,40 81,46 14065,40 9,31 6284,66 2,21 44,7 15,8114 2,78 First 87 83,4 2,4 16,44 79,14 387,90 3,47 88,20 -10,48 23,4 10,5315 1,07 Last 118 56,7 1,1 15,89 78,77 1151,60 9,31 445,27 -4,27 22,2 15,8114 1,91 % of Total N
100 100 100 100,0
0 100,0
0 100,00 100 100,00 100 100 100 100
Mean 121,08 90,50 1,61 15,66 79,50 3416,62 4,33 1241,10 -3,18 22,10 9,91 1,43 Range 195 68,4 2,4 9,35 6,52 13985,20 8,3 6256,41 12,69 42 7,9814 2,58 Std. Deviation
49,506 20,51 0,78 2,52 1,83 4654,50 2,58 1873,18 4,12 12,51 2,24 0,77
% of Total Sum
100 100 100 100 100 100 100 100 . 100 100 100
Case summaries of the 12 countries with less income inequality are presented in the table 1 and those of the other 8 countries with relatively high income inequality are presented in Table 2. As depicted in the two tables, the 12 country group, on an average has relatively higher GDP per capita, life expectancy, student ratio, persons with a second job, crime, growth of retail trade, energy prices, railway freight and R&D expenditure than those of the 8 countries in the other group. The latter exceed the former in terms of agricultural index, share of agriculture and population above 65. However, share of agriculture, life expectancy, growth of retail trade and railway freight of the latter group exhibit greater variation, as reflected by higher standard deviation, than those of

Income Inequality in Some Major European Union Economies ... 125 the former. Table 3 presents a comparative statistics of means and standard deviations of both the groups.
Table 2. Case Summaries of 8 countries with relatively high Income Inequality
GDP Per
Capita
Ag Index
%Share Of
Agcle
Age Life Exp Studnt 2nd Job
Crime Gr Retail
Rail Energy Prices
R&D Exp
N 8 8 8 8 8 8 8 8 8 8 8 8 Minimum 44 91,8 2,3 13,4946081 71,9631361 257,5 0,62 50,375 -27,96 0,6 6,1916 0,15 Maximum 104 136,9 7 17,6358795 81,1795085 8168,4 7,4 2309,859 2,9 41,9 8,9116 0,76 First 63 93,9 2,6 17,1168631 74,2763457 257,5 4,25 50,375 -18,27 0,6 8,0011 0,56 Last 49 98,6 3,1 17,2845282 72,471188 430,6 4,65 55,62 -27,96 41,9 7,1726 0,15 % of Total N
100 100 100 100 100 100 100 100 100 100 100 100
Mean 62,38 106,44 3,88 16,31 75,21 3045,46 4,21 556,65 -11,38 15,89 7,58 0,36 Range 60 45,1 4,7 4,14127139 9,2163724 7910,9 6,78 2259,484 30,86 41,3 2,72 0,61 Std. Deviation
20,071 16,152 1,66 1,45 3,36 3213,82 2,21 797,65 10,44 13,38 0,89 0,27
% of Total Sum
100 100 100 100 100 100 100 100 . 100 100 100
Table 3. Comparative Analysis
Mean
Difference in Group
Mean Std. Deviation
Group of 12
Group of 8
Total Group of 12
Group of 8
Total
GDP Per Capita 121,08 62,38 97,60 58,71 49,51 20,07 49,38 AG INDEX 90,5 106,44 96,88 -15,94 20,51 16,15 20,10 %Share of Agcle 1,61 3,88 2,52 -2,27 0,78 1,66 1,63 Age 15,66 16,31 15,92 -0,65 2,52 1,45 2,13 Life Exp 79,50 75,21 77,79 4,30 1,83 3,36 3,28 Studnt 3416,62 3045,46 3268,16 371,15 4654,50 3213,82 4047,54 2nd Job 4,33 4,21 4,28 0,12 2,58 2,21 2,38 Crime 1241,10 556,65 967,32 684,45 1873,18 797,65 1544,07 Gr Retail -3,18 -11,38 -6,46 8,20 4,12 10,44 8,18 Rail 22,10 15,89 19,62 6,21 12,51 13,38 12,90 Energy Prices 9,91 7,58 8,98 2,33 2,24 0,89 2,14 R&D Exp 1,43 0,36 1,01 1,07 0,77 0,27 0,81
6.1. Discriminant Analysis Model The discriminant analysis model involves linear equation of the underwritten form: D = b0+b1x1+b2x2+b3x3+……..+bixi where: D = discriminant score; b’s= discriminant coefficient or weight; x’s= independent variables or predictors Application of the discriminant function estimates the discriminant coefficient or weight (b’s), so that the groups differ as much as possible on the values of the estimated discriminant function. This occurs only when the ratio of between-group sum of squares to within-group sum of squares for the discriminant scores is at a maximum. Different linear combination of the results will give smaller ratios. 6.2. Results and Interpretation

126 Kar, J. Present exercise has used the direct method of estimating the discriminant function in which all the predictors, the independent variables are used simultaneously, irrespective of their discriminating power. The other method, stepwise method is appropriate when the researcher needs to select a subset of the predictors for inclusion in the discriminant function. The results are obtained by using SPSS. The first segment reporting the group means and the standard deviation give approximation of the results. It appears that the two groups are more widely separated by the record of crime than any other variable. There appears to be more of a separation on the basis of the number of students than GDP per capita. Extent of crime has the highest standard deviation in both the groups and this is followed by the number of students. The study has considered two groups and as such, only one discriminant function has been estimated. The function estimates the eigen value to be 5.436, which accounts for 100 percent of the explained variance. The canonical correlation of the function is calculated to be 0.919. Square value of this correlation: (0.919)2 = 0.84, reveals that 84 percent of the variance in the dependent variable, inequality of income distribution is explained or accounted for by this model. Wilks’s λ tests the significance of the discriminant function. Here the estimated value is 0.155. This gives the chi-square value of 23.27, with 11 degrees of freedom. It is statistically significant at 0.01 levels. Relative importance of the variables is presented by the standardized discriminant function coefficients. Predictors with large standardized coefficient contribute more to the discriminating power of the function than those with small ones. On the basis of SPSS output we can suggest that crime recorded by police is the most important predictor in discriminating between the groups, followed by number of students. Comparison of the group means of these variables exhibit largest difference. The structure matrix contains the simple correlation between the predictors and the discriminant function listed in order of magnitude. The result provides unstandardised discriminant function coefficients. These represent the raw values of the variables in the process of classification. These coefficients could be used to formulate a multiple regression equation estimating income inequality as the dependent variable. Next table gives the group centroids which contain the values of the discriminant function evaluated at the group means. Group 1, economies with less income inequality has a negative value (-1.806) while that of the group 2, encompassing economies with high income inequality is positive (2.709). It may be observed that the signs of the coefficients associated with some of the variables are positive while some are negative. Out of the economic variables, GDP per capita, agricultural index have positive values. Improvement in these values will contribute to improve income inequality. Growth of retail trade, with a negative coefficient, exhibits opposite effect on income equality across the selected EU countries.

Income Inequality in Some Major European Union Economies ... 127 Demographic factors like population (65+) and number of students have positive coefficients; indicating improvement in these factors will contribute to improvement in equality. Possibility of having a second job will improve equality while crime rate will reduce the same. This is revealed by the respective positive and negative coefficients. Infrastructural factors, inland freight by rail, energy prices and gross domestic expenditure on R&D by the business sector as a percentage of GDP come up with negative coefficients. This speaks of improvement in these factors may not result in improvement in income equality.
Table 4. Standardized Canonical Discriminant Function Coefficients
Function
1
GDP Per Capita .534
AG INDEX .340
AGE 1.515
LIFE EXP -.330
STUDNT 2.438
2ND JOB .753
CRIME -2.674
GR RETAIL -.616
RAIL -.552
ENERGY PRICES -.667
R&D EXP -.733
It could be noted that the variables identified in order of importance in the structure matrix does not match with those in the standardized discriminant coefficients. While R & D expenditure comes as the most important factor in the structure matrix, in the standardized discriminant function crime has the largest coefficient. The signs of some of the coefficients in both the tables also do not match. This anomaly is due to presence of multicollinearity. The classification results show that the hit ratio, i.e., the percentage of cases correctly classified is 100 per cent. This implies that validity of the discriminant function is satisfactory. 7. CONCLUSION AND POLICY PRESCRIPTION Present exercise attempted to assess the importance of some social, economic, demographic and infrastructural factors which account for the prevailing income inequality across 20 EU countries. Using discriminant analysis the study suggests that crime recorded by police is the most important predictor in discriminating between the groups, followed by number of students. Reduction in the level of crime and improvement in the student strength could help in reducing income inequality. Quite

128 Kar, J. intuitively, improvement in all the economic factors like GDP per capita and agricultural index will help to reduce income inequality. Identical is the case of the demographic factors. This calls for implementation of developmental policies towards improvement in these areas. REFERENCES: [1]. Aaberge, R.; Langørgen, A.; Lindgren, P. (2010) The Impact of Basic Public Services on
The Distribution of Income in European Countries, in Income and Living conditions in Europe, Anthony B. Atkinson and Eric Marlier (Ed), Luxembourg: Publications Office of the European Union
[2]. Atkinson, A.B.; Marlier, E.; Montaigne, F.; Reinstadler, A. (2010) Income Poverty and Income Inequality in Income and Living conditions in Europe, Anthony B. Atkinson and Eric Marlier (Ed), Luxembourg: Publications Office of the European Union
[3]. Biewen, M. (2001) Measuring the Effect of Socio Economic Variables on the Income Distribution: An application to the East German Transition Process, The Review of Economic and Statistics, Vol 83, No 1, pp 185-202
[4]. Checchi, D.; Peragine, V.; Serleng, L. (2010) Fair and Unfair Income Inequalities in Europe, Discussion Paper No. 5025, IZA , P.O. Box 7240, 53072 Bonn, Germany
[5]. Harjes, T. (2007) Globalization and Income Inequality: A European Perspective, IMF Working Paper, WP/07/169
[6]. Niehues, J. (2009) Income Inequality Within and Between European Countries, European User Conference for EU-LFS and EU-SILC, Mannheim, GK SOCLIFE, University of Cologne
[7]. Rodríguez-Pose, A.; Tselios, V. (2009) Mapping Regional Personal Income Distribution in Western Europe: Income Per Capita and Inequality, Journal of Economics and Finance, 59, 2009, no. 1
[8]. Večerník, J. (2010) Earnings disparities and income inequality in CEE countries: an analysis of development and relationships, Working Paper No. 540, Luxembourg Income Study
[9]. Directorate-General for Research Report (2010) Why socio-economic inequalities increase? Facts and policy responses in Europe, Based on an extensive review of 13 research projects financed by DG Research under Framework Programme that investigated the processes underlying inequality, poverty and exclusion and the effectiveness of strategies designed to promote social cohesion in EU Member States (MS)
[10]. (2008) Tárki european social report, Edited by: István György Tót, H-1112 Budapest, Budaörsi út 45
[11]. (2009) The Relationship between Economic Freedom and Income Inequality in the European Union: A Must for Government Interference? Maastricht University, Faculty of Economics and Business Administration, Maastricht, April 9th, MSc in International Economic Studies, Master Thesis, Supervisor: Dr. Tom van Veen
[12]. http://en.wikipedia.org/wiki/European_Union#cite_note-IMF [13]. http://epp.eurostat.ec.europa.eu/portal/page/portal/publications/eurostat_ yearbook_2011

Annals of the University of Petroşani, Economics, 12(4), 2012, 129-136 129 THE DECENTRALIZATION PROCESS IN ROMANIA HAS BEEN AFFECTED BY THE FINANCIAL CRISIS OR NOT;
ARGUMENTS IN FAVOR OR AGAINST DECENTRALIZATION IN THE MANAGEMENT OF THE
FINANCIAL CRISIS
OLIVIA MANOLE, CONSUELA NECȘULESCU * ABSTRACT: Typically, the decentralization process is extremely complicated and involves many challenges, if we were to take into account local conflicts, the interests of the central government and the complexity of simultaneous decentralization in administrative, political and economic plan. The financial crisis has added another dimension to the complexity of this phenomenon, misbalancing the economy and creating a fiscal pressure both at central and local level. In this context it rises the problem whether the management of the financial crisis can be better realised within a decentralized system or whether it may lay pressure on the return to the centralized government form. KEY WORDS: financial crisis; decentralization; centralization; local budget; local budget; local revenues. JEL CLASSIFICATION: H71G01 1. GENERAL TRENDS OF GLOBAL CRISIS MANAGEMENT
The financial crisis has given rise to problems at the governmental level, or
more, served as a pretext for latent conflicts that have now surfaced. The crisis that affected most countries a few years ago resulted in a concentration of power in the Ministry of Finance, and generated control at this level which was maintained since then until now. Centralizing this control was justified as a necessary measure to resolve
* Ph.D. Student, University of Craiova, Romania Lecturer, Ph.D., University of Pitești, Romania

130 Manole, O.; Necșulescu, C. the problems generated by the crisis locally manifested by high unemployment and social needs, as well as difficulties in financing investments. When a crisis occurs, regardless of its nature, usually the central government exercises control over policy and seeks to impose its priorities in management. Therefore, we can expect that the usual reaction to the crisis is the move of power to the center. On the other hand, crisis management requires general consensus or at least certain solidarity among citizens and decentralization can be a useful tool in this regard. If the state must take extreme political initiatives, then local governments should get more involved. Also, in times of crisis, the cooperation between central and local authorities is very important. Currently there are very few studies on the effects of the financial crisis in countries where decentralization process has been implemented. In this situation, governments have several options: they can either keep the established course, engage in an accelerated rhythm of decentralization (e.g. Cambodia), implement fiscal stimuli (Indonesia), etc. Moreover, central governments might use the financial crisis as an excuse to reduce subsidies to local governments. The need to manage the financial crisis that put pressure on the idea of returning to the centralized government is a reaction against the general trend towards decentralization. For example, “Great Britain that has tended to centralization in government policy has experienced a broad movement toward centralization during the crisis to hold control over the new situation. Also, Finland has managed the crisis by adopting a slightly centralized form of government. On the other hand, Sweden has maintained the tradition of involvement of local authorities in the decision-making at governmental level. Slovenia, which developed a complex of coordinating committees, emphasizing a strong decentralization, is at the other extreme. A direct effect that the financial crisis had and continues for most countries is this movement of oscillation between centralization and decentralization. It can be said that this problem is one of the classic dichotomies that arises along with the study of public administration in general. On the one hand, centralized government supposes uniform and equal standard, but places the weight of financial and organizational responsibility to the state authorities. On the other hand, decentralization allows the government to share financial and organizational responsibilities with local governments, but also deprives the State of the opportunity to exercise direct control. 2. ARGUMENTS IN FAVOUR OR AGAINST DECENTRALIZATION Even if it is generally agreed on the fact that decentralization is almost in every case an eminently political process, and that political processes are seldom promoted such as they are, or mainly only from economical reasons, such as the case of federalization from ethnical reasons, it is compulsory that, in the end, the decentralized system government should be able to provide public services that are less expensive or of better quality, or „closer to the citizens’ preferences” than the ones provided by a centralized system.

The Decentralization Process in Romania Has Been Affected by the … 131
ARGUMENTS
In favour of decentralization
Against decentralization
The transfer of responsibilities to local governments is based on the goodwill, enthusiasm and knowledge of the local officials; Services provided are easier adapted, according to the citizens demands which may be different from one region to another; Local diversity facilitates the implementation of some innovative and experimental projects; Local officials are more open to adopt some good ideas if the latter have been already adopted and positive results have been obtained; Decentralization is a means to overcome the limits of a plan controlled by the state, by transferring to the local officials a greater authority, since the latter are closer to the problems of citizens; It brings about economic growth.
First of all, decentralization is considered to be a threat at the principle of equity in front of the law; it wouldn’t be reasonable towards some farmers from a region to comply with some standards of environment protection, while, the very same farmers but from a neighbouring region wouldn’t have restrictions in this respect. One may notice that the standards on education, social assistance and local taxes should be the same for every community; The most serious negative effects of decentralization are believed to be the fact that they support a competitive environment between regions, local governments, and that eventually, this would ruin some of them, as the regions that would offer an economic environment more profitable by setting low local taxes, would attract investments and a great number of taxpayers; The third argument would be that small communities are unable to cope with some inevitable complex problems; Local officials seldom make use of decentralization as an excuse to save money as far as services are involved; It favours corruption.
A better penetration of national politics towards the farthest local communities; A better representation of different groups or tribal, ethnic and religious communities in the local politics; A better administration at the local level; It may promote a structure in which local projects may be coordinated; It may stimulate the involvement of the citizens; It may bring about the growth of political
stability and of national unity, improves the quality of the services.
Results

132 Manole, O.; Necșulescu, C.
What between 1980-1990 were considered the main advantages of decentralization, (the possibility of adapting the local politics to the needs of the citizens within the respective region, the direct link between revenues and delegation of responsibilities, the provision of efficient local services due to the exact identification of the citizens needs, a direct involvement of the citizens in the local politics, a more efficient allocation of public goods and services, the support of the democracy, a local economic development), are at present quite controversial issues.
Despite the fact that both developed and developing countries have presented a trend towards decentralization, at present, there are clear proofs in favour of the idea that some governmnents come back to the initial tendency towards a centralized system (Popkewitz, 1996, pp.27-51; Regulska, 1997, pp.187-207). For instance in Netherlands, one takes prudent measures towards recentralization. In this respect, there are researchers that pronounced themselves either in favour or against decentralization, as one may notice from Figure 1.
In favour: Oates (Oates, 1972, p.35), Imman and Rubinfeld (Imman & Rubinfeld, 1997, pp.43-64), Mello (Mello, 2000, pp.365-380). Against decentralization: Prud’homme (Prud’homme, 1995, pp.201-220), Tanzi (Tanzi, 1995, pp.295-316), Treissman (Treissman, 2002), Rodden (Rodden, 2002, pp.670-687), Rodriguez-Pose and Gill (Rodriguez-Pose & Gill, 2003, pp.1477-1492). Since theoretical arguments give birth to some ambiguous answers concerning decentralization or centralization, and the fact that the theoretic convincing answer to the question whether adopting centralization or decentralization is or not a correct decision, depends on a series of factors, one may wonder whether this theoretic debate loses some essential elements. In my opinion, there are two things that are missing. First of all an analysis of the development of the decentralization process seen from a historic and comparative perspective, and secondly, to pronounce in favour or against decentralization is also a subjective issue. The opinions of the actors directly involved in such processes may reveal important ideas about decentralization that have not been taken into account yet. Thus, the problems generated by the crisis can thus be solved by transferring revenue collection responsibility to local level, or by recentralizing expense skills. The first option is more desirable to keep the decision-making closer to the citizen in a democratic manner. This is much more difficult in a poor economy where local governments are unable to raise their own revenues” (Boschamann, 2009, p.83). 3. EFFECTS OF ECONOMIC CRISIS ON THE DECENTRALIZATION PROCESS IN ROMANIA
In Romania, the economic crisis has influenced pretty much the revenues and expenses of local budgets. Although decentralization reform was under development when the crisis appeared, central authorities have decided to continue this process, in spite of reduced funding opportunities for new tasks delegated at the local level. Thus in 2010, 374 public hospitals have been decentralized. Local authorities co-finance part of the investment, repair and endowment costs (O.U.G.no.48/2010). Also in 2010, the local police replaced the community police, but funding remained the

The Decentralization Process in Romania Has Been Affected by the … 133 same, the costs of establishing and operating being covered from the local budget. In 2011 important news regarding the responsibilities of local authorities in the organization, operation and financing of schools were brought, in the sense of decentralizing the competences (Law no.1/2011). Core funding of schools was provided from the state budget, based on cost standards per student. Other expenses, respectively complementary and supplementary funding, were provided in a combined manner from the state budget and local budgets (Agenda of Communes in Romania - 2012).
In terms of revenue, as it can be seen in Table 1, along the occurrence of financial crisis, these have diminished. The weight of own revenues in total local revenues declined. At the beginning of the crisis, in 2008, own revenues accounted for 90.03% of total local revenues, and in 2012 their weight reached 84.11%. It is found that tax revenues have the largest weight in own revenues in the period under review since the economic crisis affected the state transfer of the amounts deducted from the VAT and the quotas from income tax. In 2012 compared to 2011, the weight of subsidies in total revenues of local budgets decreased by 3.76 percentage points (from 12.58% to 8.82%). Contrary to the downward trend in the other categories of revenues, the economic crisis seems not to affect non-tax revenues. Although their weight in total revenues is not significant, there is a spectacular jump of this category of revenues from 2.97% in 2008 to 18.49% in 2012.
Table 1. Evolution of certain categories of revenues in the local budgets centralized at the country level during 2008-2012
2008 2009 2010 2011 2012
mil. lei 43629,10 42817,90 43902,80 44671,10 43453,00 Total revenues
% 100,00 100,00 100,00 100,00 100,00 mil. lei 39280,60 38435,60 36362,90 35587,80 36547,80 Own revenues (without
quotas from income tax and the amounts deducted from VAT)
% 90,03 89,77 82,83 79,67 84,11
mil. lei 37348,00 36731,60 34523,50 33023,50 28287,80 Tax revenues
% 85,60 85,79 78,64 73,93 65,10 mil. lei 1295,30 1342,90 1547,50 2169,10 8033,80
Non-tax revenues % 2,97 3,14 3,52 4,86 18,49
mil. lei 639,30 361,10 292,00 395,20 226,20 Capital revenues
% 1,47 0,84 0,67 0,88 0,52
mil. lei 4345,10 4379,20 5294,80 5619,70 3834,20 Subsidies
% 9,96 10,23 12,06 12,58 8,82
mil. lei 18644,80 14988,10 14982,80 13175,40 11682,00 Amounts ded. from VAT % 42,73 35,00 34,13 29,49 26,88
mil. lei 14250,20 15004,50 14327,20 14242,00 11686,10 Quotas and amounts ded. from income tax % 32,66 35,04 32,63 31,88 26,89 Source: Statistic Annuary of Romania, 2010, www. dpfbl.mai.gov.ro (Direction for Local Tax and Budget Policies)

134 Manole, O.; Necșulescu, C. The way in which the economic crisis affected the overall financial capacity of territorial administrative units, translates mainly by the taxes from the incomes of individuals and legal persons. Especially in the case of legal persons, “according to the White Paper on SME’s, considering the development of activity in this sector during October 2008 - March 2012, we may observe that 35,4%of the companies, have reduced activity; 50,57% of the units operate at the same parameters and 14,02% of the companies have led an upward trend, in the sense that they have increased their activity (White Paper of SME’s 2012). In this context, we can see that the economic downturn has affected a large part of the Romanian companies, and only a small percentage managed to consolidate and develop their business” (Fleşer & Criveanu, 2012). All this has a direct impact on the revenues obtained from local taxes and duties. Thus, to better study the effects of the economic crisis on local budgets, an analysis of the weight of taxes on income, profits and capital gains from private individuals and legal persons in total revenues in the period 2008 – 2012 was carried out, as it can be seen in Figure 2.
Source: Statistic Annuary of Romania, 2010, www. dpfbl.mai.gov.ro (Direction for Local Tax and Budget Policies)
Figure 2. Weight of taxes on income, profit and capital gains from private individuals and
legal persons in total revenues
Income tax from private individuals has an important contribution to the formation of local revenues, a contribution that had a downward trend during the period under review, from 40.84% of the total in 2008 it reached to 29.76% of the total in 2012. Thus, the weight of income tax from private individuals in 2012 decreased by

The Decentralization Process in Romania Has Been Affected by the … 135 11.09 percentage points compared to 2008 and by 9.09 percentage points compared to 2011. Income tax from legal persons (profit tax) is an insignificant source in the formation of local revenues. In the period 2008-2012, this contribution has fluctuated, the highest value of 0.69% occurs in 2010 and the lowest 0.20% in 2009. The weight of income tax from legal persons in 2012 compared to 2008 increases by 0.25 percentage points, and by 0.31 percentage points compared to 2011.
Although the impact and effects of the crisis are large at economic and social level (closing a large number of SMEs, increasing pressure on the unemployment fund and social benefits) the decentralization process supported by increased financial autonomy must be continued but this should be done with caution, given the economic problems Romania is facing.
In conclusion, after the analysis of the evolution of local revenues in recent years, one can not say with certainty whether the phenomenon of the crisis will have a steady trend affecting the overall course of decentralization reform. REFERENCES: [1]. Boschamann, N. (2009) Fiscal Decentralization and Options for Donor Harmonisation,
DPWG-LGD, Berlin, www.delog.org, accessed on 13.07.2011 [2]. Fleşer, A.; Criveanu, R.C. (2012) Câteva consecinţe ale crizei economice în România,
Annals of the University of Petroşani, vol.XII, Part II, p.135 [3]. Imman, R.P; Rubinfeld, D.L. (1997) Rethinking Federalism, Journal of Economic
Perspectives, vol.4, pp.43-64, www.law.berkeley.edu, accessed on 19.02.2012 [4]. Mello, L.R. (2000) Fiscal Decentralization and Intergovernmental Fiscal Relations: A
Cross-Country Analysis, World Development, vol.28, no.2, Elsevier, U.K, pp.365-380, www.biblioteca.unmsm.edu, accessed on 11.11.2012
[5]. Oates, W. (1972) Fiscal Federalism, Haracourt Brace Jovanovich, New York [6]. Popkewitz, T.S. (1996) Rethinking Decentralization and the State/ Civil Society
Distinctions: The State as a Problematic of Governing, Journal of Educational Policy, vol.11, S.U.A., www.ed.ntnu.edu.tw, accesat la 11.04.2012
[7]. Prud’homme, R. (1995) The Dangers of Decentralization, Article presented on the Annual Conference about the Development of the Economy of the World Bank , pp.201-220, www.wbro.oxfordjournals.org, accessed on 03.01.2012
[8]. Regulska, J. (1997) Decentralization or (Re)Centralization: Struggle for Political Powerin Poland in Environment and Planning C: Government and Policy, vol.15, Polonia, www.umich.edu, accesat la 23.04.2012
[9]. Rodríguez-Pose, A.R.; Gill, N. (2003) The Global Trend Towards Devolution and its Implications, Environment and Planning C: Governmnet and Policy, Pion Ltd., vol. 35(8), London, pp.1477-1492, www.Ise.ac.uk, accessed on 17.08.2012
[10]. Rodden, J. (2002) The Dilemma of Fiscal Federalism: Grant and Fiscal Performance around the World, American Journal of Political Science, 46, Washington, pp.670-687, www.web.mit.edu, accessed on 11.01.2012
[11]. Tanzi, V. (1995) Fiscal Federalism and Decentralization, A Review of Some Efficiency and Macroeconomic Aspects, Annual World Bank Conference on Development Economics, Washington, pp.295-316
[12]. Treissman, D. (2002) Decentralization and the Quality of Government, UCLA-2002, available at http://www.polisci.ucla.edu/faculty/treisman/ accessed on 27.04.2009

136 Manole, O.; Necșulescu, C. [13]. O.U.G. no.48/2010 for the modification and completion of acts in the field of health for
decentralization, published in M.Of., Part I, nr.384 of 10.06.2010 [14]. Law no.1/2011 of national education, published in M.Of. nr.18 of 10.01.2011 [15]. Agenda Comunelor din România - 2012, Orizonturi 2020, Ediţia a II-a, pp. 15-18,
www.acor.ro [16]. The Yearly Statistics Book of Romania, Bucureşti, 2008, 2009, 2010 [17]. www.mfinante.ro, Ministery of Finance [18]. www.insse.ro, National Institute of Statistics [19]. www.dpfbl.mdrap.ro [20]. www.uat.mai.gov.ro

Annals of the University of Petroşani, Economics, 12(4), 2012, 137-146 137
IMBALANCES IN FINANCIAL AUTONOMY AT DIFFERENT LEVEL OF LOCAL GOVERNMENT IN
ROMANIA
GHEORGHE MATEI, OLIVIA MANOLE *
ABSTRACT: Fiscal decentralization is an important influence factor on the autonomy of local government. To the extent in which a local government benefits from amounts and transfers from the central government, it depends on it and has a reduced capacity to make decisions about the services they provide to citizens, local autonomy being limited. Even if the legal framework for decentralization was created in Romania, we still can not talk about a high degree of financial autonomy of local governments. Further, significant amounts from the state budget are transferred to local budgets to cover local expenses. Moreover, despite consistent efforts to implement the decentralization process, there is a series of imbalances, especially in smaller territorial administrative units that are clearly disadvantaged both in terms of financial capacity to finance themselves through local taxes and duties, and especially in terms of the low absorption capacity of European funds. In general, in Romania, the degree of financial autonomy differs nationally from the city level and from the village level. KEY WORDS: financial decentralization; financial independence; local revenues; local expenses. JEL CLASSIFICATION: H71; H72; C58. 1. INTRODUCTION
The underperforming stage of economy and the central bureaucracy have led economists to believe that decentralization would be a solution to the problems of developing countries, so most states have begun to include decentralization in their development programs.
* Professor, Ph.D., University of Craiova, Romania Ph.D. Student, University of Craiova, Romania

138 Matei, G.; Manole, O.
Decentralization involves the transfer of authority and responsibility of public functions from central government to local governments. It is a process with many variants that emerged in the 1980s and to become effective, it requires a substantial reorganization of the public sector in terms of financing. Through this long-term and complex process the role and importance of local authorities expands. Optimum management of funds at the local level, their allocation for the fulfillment of public goods in accordance with the requirements of the local community generates a process of development of the administrative-territorial units much higher than if their production would be done centrally and would be distributed equally without taking into account local demand.
Thus, fiscal decentralization is an important influence factor on the autonomy of local government. To the extent in which a local government profits by amounts and transfers from the central government, it depends on it and has a reduced capacity to make decisions about the services they provide the citizens with and local autonomy is limited.
European Charter in Strasbourg (1985) states that: "Local self-government denotes the right and effective capacity for local authorities to regulate and administer an important part of public affairs within the law, under their own responsibility and in favor of that population". It is also considered that “local autonomy and decentralization of public services is the guarantee of the stability of a functioning democracy” (Drăcea, et al., 1999, p.267).
In general, fully self-financing of local governments is not feasible or desirable. The generally accepted rule is that local governments must raise their own funds up to a certain limit and operate with budget constraints, which means that deducted revenues and transfers or grants should be only a collateral funding.
2. METHODS AND INDICATORS FOR THE DETERMINATION OF THE DEGREE OF AUTONOMY: CASE STUDY
Local financial autonomy is evidenced by a series of financial indicators of
which the most important are: a) “the degree of financial autonomy results from the independence in the formation of revenues and shows the percentage of own revenues in total revenues of local budgets.
where: GAF = degree of local financial autonomy; VP = own revenues of local budgets; VT = total revenues of local budgets.
b) the degree of local financial dependence shows us the weight of the amounts deducted from VAT, as well as the one held by quotas and amounts deducted from income tax in the total revenues of local budgets.

Imbalances in Financial Autonomy at Different Level of Local … 139
where: GDF = degree of local financial dependence; STVA = amounts deducted from VAT of local budgets; CStax = quotas and amounts deducted from income tax.
c) the degree of expense coverage on account of own revenues shows us the degree in which total expenses are covered by own revenues of local budgets.
where: GVC = the degree of expense coverage on account of own revenues of local budgets; CT = total expenses of local budgets” (Dogariu, 2010, pp.68-69).
To get an overview of financial autonomy at the level of local governments, we performed a statistical analysis of own revenues, total revenues and expenses taken from the revenue and expenditure budgets of local government centralized at national level, from the local budget of a municipality and from the local budget of a commune. Data from the local budget execution accounts are analyzed over a period of 8 years, from 2005 to 2012, as shown in Table 1. Table 1. Own revenues, amounts deducted from VAT, quotas and amounts deducted from
income tax, total revenues and expenses of local budgets centralized at national level, of the Town Hall of Piteşti municipality and of Boteni commune in the period 2005-2012
mil lei
Indicator 2005 2006 2007 2008 2009 2010 2011 2012 IPC (%) 100 106,56 104,84 107,85 105,59 106,09 105,79 103,33
national level
19480,90 27708,60 36805,20 43629,10 42817,90 43902,80 44671,10 43453,00
Piteşti 170,12 249,25 288,85 302,75 325,80 290,41 266,48 277,81
Total revenues (mil lei current prices) Boteni 1,16 1,92 5,65 4,6 4,12 3,02 4,98 3,14
national level
19480,90 26002,82 35106,07 40453,50 40551,09 41382,60 42226,20 42052,65
Piteşti 170,12 233,91 275,52 280,71 308,55 273,74 251,90 268,86
Total revenues (mil lei compared prices) Boteni 1,16 1,80 5,39 4,27 3,90 2,85 4,71 3,04
national level
3547,00 12152,20 17475,00 20635,80 21175,10 21385,60 22399,60 23191,30
Piteşti 81,98 128,59 153,55 180,37 192,65 179,70 174,92 169,40
Own revenues (mil lei current prices) Boteni 0,39 0,53 0,88 1,45 1,19 1,33 0,84 1,18
national level
3547,00 11404,09 16668,26 19133,80 20054,08 20157,98 21173,65 22443,92Own revenues (mil lei Piteşti 81,98 120,67 146,46 167,25 182,45 169,38 165,35 163,94

140 Matei, G.; Manole, O. compared prices)
Boteni 0,39 0,50 0,84 1,34 1,13 1,25 0,79 1,14
national level
75,29 52,47 39,54 42,73 40,31 34,15 29,51 30,74
Piteşti 87,54 120,17 111,92 105,01 113,56 95,24 78,53 92,16
Amounts deducted from VAT (mil lei current prices)
Boteni 0,78 1,40 2,80 2,98 2,92 1,55 2,01 1,80
national level
14667,10 13643,96 13880,68 17287,71 16346,72 14133,00 12460,91 12926,16
Piteşti 87,54 112,77 106,75 97,37 107,55 89,77 74,23 89,19
Amounts deducted from VAT (mil lei compared prices)
Boteni 0,78 1,31 2,67 2,76 2,76 1,46 1,90 1,74
Piteşti 46,47 74,15 94,80 119,68 126,80 111,39 101,69 95,37Quotas and amounts deducted from income tax (mil lei current prices)
Boteni 0,23 0,29 0,65 1,20 0,92 1,06 0,53 0,85
Piteşti 46,47 69,59 90,42 110,97 120,09 105,00 96,12 92,30Quotas and amounts deducted from income tax (mil lei compared prices)
Boteni 0,23 0,28 0,62 1,12 0,87 1,00 0,50 0,82
national level
18777,00 25392,80 33982,30 42270,20 42074,50 41207,00 44003,00 46333,00
Piteşti 169,70 166,49 267,98 300,71 322,72 282,60 250,46 289,71
Total expenses (mil lei current prices) Boteni 1,24 1,92 5,65 4,62 4,14 3,03 4,96 3,16
national level
18777,00 23829,58 32413,49 39193,51 39847,05 38841,55 41594,67 44839,83
Piteşti 169,70 156,24 255,61 278,82 305,64 266,38 236,75 280,37
Total expenses (mil lei compared prices) Boteni 1,24 1,81 5,39 4,28 3,92 2,85 4,69 3,06
Source: Ministry of Public Finances, Local budgets of the Town Hall of Piteşti municipality, local budgets of the Town Hall of Boteni commune
During 2005 - 2012, revenues of local budgets at the national level have a positive development from year to year (average annual increase by 12.14%) from 19,480.90 million lei in 2005 to 43,453 million lei in year 2012. This increase is largely due to the positive evolution of own revenues (weights of up to 53.37%).
Pitesti Municipality budget revenues increase by an annual average with 7.26% (from 170.12 million lei current prices in 2005 to 277.81 million lei current prices in 2012), but those of the Town Hall of Boteni commune have an increase of 15.29% (from 1.16 million lei current prices in 2005 to 3.14 million lei in 2012 current prices),

Imbalances in Financial Autonomy at Different Level of Local … 141 which is significant compared to those of Pitesti municipality and those at national level.
In compared prices, a significant increase in revenues to local budgets nationwide takes place in 2007 compared to 2006, to 35.01% for 2012 compared to 2011, they decrease by 0.41%. Significant increases in revenues for Pitesti Municipality budget are in 2006 compared to 2005 (37.5%) and in 2010 compared to 2009, these have the most significant reduction (11.28%). Budget revenues of the Town Hall of Boteni commune have the largest oscillations, so in 2012 compared to 2011 they decrease by 35.46% and in 2007 compared to 2006 they increase by 199.44%.
Unlike Pitesti municipality, own revenues of the Boteni commune are well below those of Pitesti municipality, which shows a greater dependence on the central budget. This is evidenced also by the fact that the main source of income is represented by the amounts deducted from VAT. Access to EU funds was performed since 2011, but the amounts drawn are almost insignificant.
In 2006, 2007 and 2011, as can be seen in Figure 1, and Figure 3, the dynamics of the revenues of the budget of Boteni commune has the most significant values, but at the national and at the level of Pitesti municipality the dynamics has close values .
Source: Accomplished by the author based on the data from Table no.1
Figure 1. Modification rate of total revenues of local budgets (precedent year = 100%)

142 Matei, G.; Manole, O.
Source: Accomplished by the author based on the data from Table no.1
Figure 2. Modification rate of total expenses of local budgets (precedent year = 100%)
Increasing or decreasing the local budget revenues centralized at national level is accompanied by an increase in expenses. The same thing happens with the budget of Boteni commune. In 2007, 2008 and 2012, the dynamics of the expenses of the budget of Pitesti Municipality is greater than that of the revenues.
Since 2006, the dynamics of own revenues of local budgets centralized at national level is a descendent one, with a maximum increase of 221.51% in 2006 compared to 2005 and 46.16% in 2007 compared to 2006. At the end of the period analyzed, the dynamics of own revenues begins to grow, so in 2012 compared to 2011, we have an increase of 6%. The dynamics of own revenues of Piteşti Town Hall budget has a negative evolution, from 47.19% in 2006 compared to 2005 to – 0.85% in 2012 compared to 2011. For Boteni commune, the dynamics of own revenues has an oscillating evolution, with the most significant increase of 68% in 2007 compared to 2006.

Imbalances in Financial Autonomy at Different Level of Local … 143
Source: Accomplished by the author based on the data from Table no.1
Figure 3. Modification rate of total revenues of local budgets (precedent year = 100%)
3. RESULTS OF THE RESEARCH Local autonomy has different stages of implementation at national, municipal and community level, as it results from the analysis of the three indicators of financial autonomy in Table no 2. The results obtained are data processed from the case study presented above.
Table 2. Analysis indicators of local financial autonomy
Indicator 2005 2006 2007 2008 2009 2010 2011 2012 national level
18,21 43,86 47,48 47,30 49,45 48,71 50,14 53,37
Piteşti 48,19 51,59 53,16 59,58 59,13 61,88 65,64 60,98 Degree of financial autonomy (%)
Boteni 33,62 27,60 15,58 31,52 28,88 44,04 16,87 37,58 national level
0,39 0,19 0,11 0,10 0,09 0,08 0,07 0,07
Piteşti 51,46 48,21 38,75 34,69 34,86 32,80 29,47 33,17
Degree of financial dependence of local authorities (%) Boteni 67,24 72,92 49,56 64,78 70,87 51,32 40,36 57,32
national level
18,89 47,86 51,42 48,82 50,33 51,90 50,90 50,05
Piteşti 48,31 77,24 57,30 59,98 59,70 63,59 69,84 58,47
Degree of local expenses coverage on account of own revenues (%) Boteni 31,45 27,60 15,58 31,39 28,74 43,89 16,94 37,34 Source: Processing based on the data in table no.1

144 Matei, G.; Manole, O. Nationally the degree of financial autonomy is reduced in 2005 (18.21%) compared to Pitesti municipality and Boteni commune (48.19% and 33.62%, respectively). This highlights a strong centralization of local budget at national level in relation to the two territorial administrative units. Tax changes made in 2006 (year in which the structure of income categories changes, the category “samples from the state budget" presented separately in the budget, does not appear in subsequent years, in exchange the quotas allocated from income tax and amounts deducted from VAT are included in the category "tax revenues"), led to a sharp increase of this indicator to 43.86% nationally. Following the economic crisis in 2008 there was a slight decrease in the degree of financial autonomy, to 47.30%. In 2012, the degree of national autonomy has the highest level of 53.37% of the entire analyzed period. The degree of financial autonomy of Pitesti City has significantly higher values (p = 0.001) compared to the national level (values between 48% and 61% for the city of Pitesti and between 18% and 54% nationally, respectively). For Boteni commune self-financing capacity has fluctuated with a maximum value of 44.04% in 2010 and a low value of 15.58% in 2007. The degree of financial dependence for the three administrative levels analyzed has evolved inversely to the degree of financial autonomy. Nationally the degree of financial dependence during the analyzed period of time is between 0.39% and 0.07%, for Pitesti city between 51.46% and 33.17%, and for Boteni commune between 67.24% and 57.32%. The degree of local expenses coverage on account of own revenues has elevated values for Pitesti City (48.31% in 2005 and 58.47% in 2012, with the highest value of 77.24% in 2006, due to the Law on decentralization of public services, Law no. 195/2006). At the national level there is an increase in the degree of expense financed through own revenues by 2010 (from 18.89% to 51.90%) and then it begins to decrease as a result of the decentralization of hospital management which was not followed by adequate funding. For Pitesti City, the analyzed indicator has an increasing trend until 2011 (from 48.31% to 69.84%) and in 2012 it decreases by 11.37 percentage points compared to 2011. The degree of expense coverage on account of own revenues has fluctuated for Boteni commune with high values in 2010 (43.89%) and 2012 (37.34%). 4. CONCLUSIONS
The conclusion that emerges from this type of approach is the fact that financial autonomy differs at the national level, at the municipality level and commune level, as demonstrated by the three indicators analyzed. If nationally we are dealing with partial financial autonomy, with an approximately constant evolution as a result of the decentralization process development at city level, compared to financial autonomy at commune level, values recorded are extremely contradictory and oscillating. According to the case study presented, it was observed that unlike the city, at the commune level the degree of financial dependency on the center is extremely high.

Imbalances in Financial Autonomy at Different Level of Local … 145 So presently despite consistent efforts to implement the decentralization process, there is a series of imbalances, especially in smaller administrative units that are clearly disadvantaged both in terms of the financial capacity to finance themselves through local taxes and duties, and especially in terms of the low absorption capacity of European funds. The problem of imbalances at rural level in contrast to the city or county level has been taken into account by other economists too (Ungureanu & Bâldan, 2011, pp.279-290; Avrămescu, 2012, p.42). Current balancing formula manages to compensate to some extent the initial imbalances within the categories of local communities. “Communes benefit most from the positive effects of balance. Even nationally poorest communities climb to medium thus reducing the dispersion” (Agenda of Communes in Romania, 2012, p.41). However, given the current economic and social conditions that do not allow an increase in transfers for balancing from the state budget and the precarious condition of communes with unfinished investments and unpaid suppliers, it is considered that the reorganization of the administrative system by adopting regionalization to transfer to communes substantially higher amounts than those currently allocated and attracting significant amounts from structural funds would be a real solution to redress imbalances of local financial autonomy. It is very important to know “the hierarchy of development regions because it allows to determine accurately the regional development policy priorities. Thus, we can allocate resources to undevelopment regions in terms of the economic development level” (Avrămescu, 2012, p.42). Even if the legal framework for fiscal decentralization of local governments was created in Romania, we still can not talk about high financial autonomy. Further, significant amounts are transferred from the state budget to local budgets to cover their expenses. It appears that there are big problems at the level of local communities: not enough funds for investments and the dependence on central authority is still felt with an intensity high enough, especially in villages, even if over twenty years since the fall of socialist centralized system have already passed. REFERENCES: [1]. Avrămescu, T.C. (2012) A Multifactorial Statistical Model for Development Regions
Hierarchy in Romania, Annals of the University of Petroşani, vol.XII, Part II, p.42, www.upet.ro/annals/economics
[2]. Dogariu, E. (2010) Studiu privind autonomia financiară locală în România, în Economie teoretică şi aplicată, 17(6), Bucureşti, pp.68-69, www.store.ectap.ro
[3]. Drăcea, M. and Co. (1999) Finanţe publice, Editura Universitaria, Craiova, p.267 [4]. Văcărel, I. and Co. (2007) Finanţe publice, Editura Didactică şi Pedagogică, Bucureşti [5]. Ungureanu, E; Bâldan, C. (2011) Strategic Model to Attenuate the Rural Inequalities in
the South – West Region, Annals of the University of Petroşani, vol.XI, Part III, pp.279-290
[6]. Agenda Comunelor din România (2012) Orizonturi 2020, Ediţia a II-a, www.acor.ro [7]. European Charter of local authority, adopted in Strasbourg on 15th October 1985, art.2,
alin.1

146 Matei, G.; Manole, O. [8]. Law no.195/2006 of administrative and fiscal decentralization, published in M.Of., Part I,
no. 453/25.05.2006 [9]. www.statistici.insse.ro [10]. www.primariapitesti.ro [11]. www.uat.mai.gov.ro [11]. www.comunaboteni.ro

Annals of the University of Petroşani, Economics, 12(4), 2012, 147-154 147
ENVIRONMENTAL MANAGEMENT IN THE ENERGY SECTOR ON THE EXAMPLE OF POWER PLANT IN
BELCHATOW
BARTŁOMIEJ OKWIET *
Abstract: The environment is the area which includes forests, fields, lakes, rivers, ponds, mountains, hills and valleys. In Poland, the environment is visible from all sides, as opposed to fully urbanized areas, such as occurring in China, bigger parts of our country has not yet been destroyed by human activities. And, for a few years, awareness of environmental protection gradually increases in both, private individuals and large companies. This article shows how the power plant in Belchatow, one of the biggest polluters and the units responsible for environmental degradation, can cope with the problem of what is the impact of its activities on the environment. In this article will be presented all the activities of power plant in order to minimize its negative impact on the surrounding environment. Key words: environmental management, power plant, energy sector JEL Clasification: D0, H1, L11. 1. INTRODUCTION The concept of "environmental protection" is not a new concept. This definition has been known from the beginning of the civilization. At the beginning, in ancient Rome, the issue of urban waste water which caused pollution of the Tiber was recognized. In modern times the cause of many negative occurrence which disturbing agreement between the man and the environment was a constant technological progress. Many people are familiar with a short video showing the new marvel of technology as it was at that time a car capable of breakneck speeds 20km/h and producing huge quantities of gas. In general, the twentieth century is a symbol of rapid growth with the simultaneous degradation of the environment. At the time, concern for environmental protection was neglected topic because everyone aspired above all to achieve the greatest profits without paying attention to costs, whether it was
* Ph.D. Student, Czestochowa University of Technology, Faculty of Management, Poland

148 Okwiet, B. appropriate treatment for a worker, or just the environment. The effects of some of these activities are still visible today, and many of them will affect our environment, for a few or for a several dozen years. Today, the idea of environmental protection is gaining wider acceptance in our society. It is almost fashionable to be "organic" - sort the garbage, save water, energy and gas, have solar panels and drive a car with a hybrid engine. Eco -Fashion has reached to a many large companies, which are now willing to implement pro-ecological solutions, trying on all fronts of its business to reduce its negative effects on the environment. Almost all companies, both small and large, make tools, procedures and regulations which can be described as the environmental management
2. ENVIRONMENTAL MANAGEMENT
Environmental management is the management of company’s operations that have, had or may have an impact on the environment. The aim environmental management is to preserve the natural resources and environmental and occupational health and employee’s and population’s protection (Szydłowski, et al., 2005). Throughout the 1990s and the beginning of XXI century, most of the companies in America and Europe became more aware that environmental issues and regulations required a new approach. It was recognized that environmental laws are products of ideas and social forces (most of them) whose time had come. Companies saw that enforcement of these laws is very important as a matter of public policy and the companies who ignore that law can be no longer more competitive to the others. In addition, the recognized that public (customers in other words) with the environment, together, cannot be asked to take all the risks associated with scientific uncertainty. And the industry must accept controls before all the evidences of science become conclusive. It is because, the public is their customers and the main companies’ policy is to satisfy the public even they are wrong. Acceptance of the reality of environmental costs, liability, and risks led to the development and increasing importance of the field of environmental management. Until 1998, there were no environmental management courses in business schools. Now many business schools incorporate “environmental business” courses into their curricula, as well as consider other social impact issues (Friedman, 2006). Today, most of the companies are working to make environmental issues effectively-cost and spend the money in a right way; the reason of this is the costs of various environmental programs are very high. Sometimes, the companies and government agencies are working together to make sure that the money are well spent. Companies can also use many management techniques to improve their environmental performance and control costs. These techniques can include: Total Quality Management, careful, Life-cycle analysis, sustainable manufacturing and full cost accounting. Now, environmental management has grown and achieved the international level, and many various companies (now eco-friendly) have developed lots of programs and initiatives in purpose to help managers and businesses in making changes and, more important, identifying opportunities to make further improvement in environmental management field.

Environmental Management in the Energy Sector on the Example … 149 There are many definitions, terms and concepts in such a wide field which is environmental management, the short descriptions a few of them can be very helpful to gain a general understanding what is environmental management (Wilson & Sasseville, 2008): Life Cycle Assessment - the main definition of LCA is that life-cycle assessment is a technique to assessing the environmental aspects and potential impacts associated with a product, by compiling an inventory of relevant inputs and outputs of a product system, evaluating the potential environmental impacts associated with those inputs and outputs and interpreting the results of the inventory analysis and impact assessment phases in relation to the objectives of the study (ISO 14040). Cleaner Production - involves the application which continuously integrates preventive environmental strategy to products, services and processes in purpose to increase efficiency together with risks minimalisation. Cleaner production also includes the conservation of raw materials and energy, reduction of quantity and toxicity of all emissions and wastes. Design for Environment (DfE) - it is a technique which can be used to incorporate environmental considerations into the process’, products’ and services’ design. By assessing environmental impacts over the whole life cycle at the development stage, firm can practice DfE to reduce material and energy intensity as well as emissions and waste. DfE also provides a framework through which to undertake eco-efficiency, pollution prevention, cleaner production (Fiksel, 2009). Eco-Efficiency - this term describes the goods and products with the price and service that satisfy human needs and bring quality of life. In addition these goods and products progressively reduce ecological impacts. At the beginning the Eco-Efficiency term contains two elements: economics and ecology. To be fulfilled, companies must take other steps to add the third element which is social progress. Pollution Prevention - this term is close to “cleaner production” and is often used to describe the strategy of continuously reducing pollution into environment, i.e. eliminating waste during the process. EPA defines “pollution prevention” in terms of source reduction, i.e., preventing or reducing waste where it originates, at the source, including practiced that conserve natural resources by reducing or eliminating pollutants through increased efficiency in the use of raw materials, energy, water and land (Collin, 2006). Industrial Ecology - it is a field of science that checks global, regional and local flows of materials and energy in products, processes, economies and industrial sectors. It focuses on the industry’s role in reducing environmental burdens through the products life cycle - beginning from the raw materials, production process, use those goods till the end of its life (products’). Industrial Ecology’s aim is to achieve closed loop system, in which wastes from one product can be reused or become raw materials for other goods. Supply Chain Environmental Management - this definitions contains a wide range of activities, such as screening suppliers, working collaboratively with them on a green design initiatives or providing training to build environmental management capacity for the suppliers. It involves a co-working with the suppliers from the top of the supply chain and with the consumers and distributors from the

150 Okwiet, B. bottom of the supply chain. This definition is also being applied to promote sustainability development. Enviromental Management Systems (EMS) - it is a part of business’ overall management system that includes organizational structure, planning activities, responsibilities, practices, procedures, processes and resources for developing, implementing, achieving, reviewing and maintain environmental policy (Cortes & Poch, 2009). Total Quality Environmental Management (TQEM) - this definition describes the process to approach a constantly improvement the quality of products’, processes’ and services’. This field has a few primary key elements: a very high level of management commitment, a strong customer, employee involvement, teamwork and a long term focus. According to Global Environmental Management Initiative (GEMI), in TQEM four basic elements assure right guidelines for planning in business: customers’ identification, continuously improvement, eliminating environmental problems before they occur and looking at each environmental part as a system.
3. ISO 1400 SERIES ISO 14000 is a series (Piper, et al., 2003) of standards which can be very helpful with establishing and maintaining a structured and systematic environmental effort to improve companies’ performance at an environmental field. These standards are using tested and internationally methods to provide the most accurate guidelines to the companies. ISO (International Organization for Standardization) 14000 series is divided between organization and production parts. Organizations’ part includes the following (Johnson, 2007): environmental management systems and communication (ISO 14001, ISO 14004 and ISO 14063; environmental auditing (ISO 14010 and ISO 19011; environmental performance (ISO 14030) and productions’ part includes: environmental labels and environmental declarations (ISO 14020); Life Cycle Assessment (ISO 14040); environmental aspects (ISO guide 64 and ISO/TR 14062). All these standards have been developed in the way that they can be used together or independently and they constitute a rational flow of activities which is presented in figure 1.
As the environmental management and Life Cycle Assessment were presented in the first part of this article, below are shortly presented the following standards. Environmental performance provides a way of describing and expressing a company’s environmental aspect which are significant for it. These forms or “key-terms” can be very helpful when it comes to recognizing and judging the relevance of the environmental work as a whole, separate part.
Environmental labelling and environmental declarations provide many different tools that company can use during the communication between various parties about the products’ and services’ impact on the environment. These tools also are clearly related to other tools in the ISO 14000 series.
Environmental review is very close to environmental management. The review gives the company a guideline for following-up and checking the result if their

Environmental Management in the Energy Sector on the Example … 151 environmental work agree with the starting points. The reviews should compare, regularly, the results of the company’s environmental work in many various areas.
Source: Author’s elaboration based on Marcus P. A., Willig J. T., Moving ahead with ISO 14000. Improving Environmental Management and Advancing Sustainable Development.
Figure 1. The ISO 14000 Family 4. BELCHATOW POWER PLANT ACTIVITY AND ITS IMPACT ON THE ENVIRONMENT
The government decision to build a team of Mining and Energy Station was taken in 1971 on the basis of discovered in the 60's brown coal’s large deposits in those surroundings. Start of construction of the plant occurred in 1975. After carrying out research on plant location, the resort decided on Rogowiec, placed 1.5 km from the northern slope pit. The plant has a power of 4,320 MW and consists of 12 power units of 360 MW each. Since the 90s the plant provides heat in the amount of power needed and the entire city estates. It is the largest both in Poland and Europe, coal-fired power plants. Its annual consumption of coal is approximately 28 billion kWh and due to its favourable location, modern technology and the size scale, Belchatow power plant produces the cheapest electricity in Poland.
Negative aspect of Power Plant is its negative impact on the environment, both at the local level and, also, national as well as the entire continent. The losses which arise in the environment under the influence of power can be classified as follows: 1. Depletion of non-renewable resources - a process which is due to overexploitation
of resources during the wastage of raw materials are associated with major raw material extraction, mining activities also significantly affects the degradation of the surface;
152 Okwiet, B. 2. Air pollution - is caused by burning fossil fuels (coal and lignite) as a result of
penetration into the atmosphere of large quantities of dust and gases: sulfur oxides, nitrogen compounds and carbon monoxide.
3. Pollution of water - they are associated with atmospheric pollution and soil. This phenomenon is extremely dangerous for the sake of fundamental importance of water in sustaining life processes and the important role it plays in many industries. Power by discharges of waste heat changes affects the habitat and the aquatic environment biocenosis, leaving one organisms killed with new organisms appearing instead.
4. Contamination of soil - the destruction of soil structure changes its water retention, which is very important in terms of flora and fauna. Excessive soil chemization brings catastrophic consequences, resulting in the soil is excluded from crop production. To restore the original condition of the soil time, money and experience is needed;
5. Negative changes in the flora - as a result of diminished power of communities of bogs and meadow vegetation, have increased the derelict former agricultural areas;
6. Lowering the standard of living - all these negative aspects of power significantly contributes to the deterioration of living conditions in its close neighborhood.
5. ENVIRONMENTAL MANAGEMENT AT BELCHATOW POWER STATION
Since the inception of the Power Station has taken actions whose main purpose was to reduce its negative impact on the environment. Used in the power system of environmental protection includes: air protection; water conservation; rational management of water resources and waste; noise protection. The system consists of research and measurement to investigate the activities of the Power Plant on the environment. From the beginning of its, power is working closely with a number of measurements and research institutions within which are conducted the following tests: environmental monitoring in the area of landfill furnace; measurement of dust around a waste landfill furnace; monitoring the environment in the storage area of the FGD gypsum which is located on the outer dumping; study of the effects of dust in storage on the environment.
The Regulations MOSZNiL of 12 February 1990 on air protection against pollution, presented of emission standards in the exhaust gas boiler has set the Power Station to the task - meet the required standards. At the beginning the power applied dry flue gas desulfurization method, but after a while it was found that this method is insufficient and must be applied highly effective method - wet and semi-dry. The choice of the wet it was decided because of the following advantages: a high desulfurization efficiency, above 90%; relatively low operating costs; high flexibility of the system; high reliability technology and equipment; availability of sorbent and its low cost; the possibility of development of gypsum as a high-quality waste; entries in the "National Program for SO2 reduction by 2010"; the universality of this method in the world, extensive knowledge about technology.

Environmental Management in the Energy Sector on the Example … 153
After a decision on the method, Power signed a contract with Dutch company Hoogovens HTS to build flue gas desulphurization system - the first four were built in 1994-1996, a further four were built in 1999-2003 (by the Polish company Rafako), and in 2007 the construction of the next two installations was completed. Since the installation of FGD Plant observed a significant reduction of SO2 in the coming years:
Table 1. SO2 reduction, years 2000-2008
Year 2000 2001 2002 2003 2004 2005 2006 2007 2008
Reduction (%) 33,6 36,8 45,8 51,0 50,8 55,9 62,6 64,0 70,0 Reduction (thousand tones)
128,4 166,8 208,3 210,9 180,0 184,4 234,3 203,3 216,3
Source: Environmental report, Power station in Belchatow 2009
As the energy sector is seen as a source of negative impacts on the environment, the Power Station shall take any action to change that opinion. To this end, the power station was implemented Environmental Management System which is based on meeting the requirements of the PN-EN ISO 14001 The purpose of this system is a comprehensive approach to action to protect the environment, meaning, the desire to reduce the negative impact of power on the surrounding environment through monitoring and continuous reduction of the contamination. Power Station has also received PCBC and IQNet certificates in 2003 as a confirmation of the implementation and integration of the Quality Management System, Environmental, Health and Safety in the area: manufacture and sale of electricity and heat; repair, telecommunications and supply service; improving safety and health of workers. Additional evidence of the fulfillment by the power of all these standards for the protection of the environment is to issue "Licenses Integrated" which arises from the IPPC Directive. The permit is an administrative decision and represents a sort of license to conduct the installation, under the conditions set for all components of the environment as well as meeting the technical studies identified as the best available techniques (BAT). The permit specifies the type and amount of energy used, materials and raw materials and fuels, while also assessing the methods used by the power to prevent the emission of pollutants into the environment.
6. CONCLUSION
The main purpose of this article was to present how the introduction of environmental policy to the company in the energy sector, which is the Belchatow power plant, may affect its activities in the field of environmental protection. Crew from the Power Station seems aware of this for many years, and has long been taking important, both for power and the environment, measures to minimize its negative impact on the surrounding environment. It can be safely said that the Power Station is an extremely involved in matters of care for the environment is using. Its purpose is to provide to a market a product, which is environmentally friendly and can already boast achievements. It may take great satisfaction from the activities carried out since the

154 Okwiet, B. effects of these activities are considered and the positive assessment by the environment, institutions and government organizations. Confirmation of this may be the next licenses obtained to operate the License Integrated and let generating electricity and heat power of not less than 300 MW and permits for a water abstraction from groundwater source through upper cretaceous level. REFERENCES:
[1]. Cichy, D.; Michajłow, W.; Sandner, H. (2008) Ochrona I kształtowanie środowiska.
WSiP, Warszawa [2]. Collin, R.W. (2006) The Environmental Protection Agency. Cleaning up America’s act.
Greenwood Press, Connecticut [3]. Cortes, U.; Poch, M. (2009) Advanced Agent-Based Environmental Management Systems.
Girona University, Girona [4]. Dima, I.C. (2010) Elements of logistics, used in industrial operational management, Apeiron
Eu, Presov [5]. Dima, I.C.; Marcincin, I.N.; Grabara, J.; Pachura, P.; Kot, S.; Man, M. Operational
management systems of the production achieved in flexible manufacturing cells. Presov, Slovakia: Techinical University of Kosice 2011
[6]. Dima, I.C.; Grabara, I.; Pachura, P.; Kot, S.; Modrak, V.; Marcincin, I.N.; Man, M. (2011) Multiserving - operational management system of the production achieved in flexible manufacturing cells, WWZPCz, Czestochowa
[7]. Fiksel, J. (2009) Design for Environment. McGraw-Hill, New York [8]. Friedman, F.B. (2006) Practical Guide to Environmental Management. Environmental
Law Institute, Washington [9]. Johnson, P. (2007) ISO 14000. The business manager’s complete guide to Environmental
Management. John Wiley&Sons, Canada [10]. Marcus, P.A.; Willig, J.T. (2007) Moving ahead with ISO 14000. Improving
Environmental Management and Advancing Sustainable Development. John Wiley&Sons, Canada
[11]. Piper, L.; Ryding, S.O.; Henricson, C. (2003) Continual improvement with ISO 14000. IOS Press, Netherlands
[12]. Szydłowski, M.; Werner-Engel, H.; Ociepa, A. (2005) Wprowadzenie do systemów zarządzania środowiskowego. NFOS, Warszawa
[13]. Wilson, G.W.; Sasseville, D.R. (2008) Sustaining Environmental Management Succes. John Wiley&Sons, Canada
[14]. PGE Działalność PGE Elektrowni Bełchatów SA w dziedzinie ochrony środowiska. Raport środowiskowy, Elektrownia Bełchatów, 2008
[15]. Rozporządzenie MOŚZNiL z dnia 12 lutego 1990 r. w sprawie ochrony powietrza przed zanieczyszczeniami
[16]. ISO 14040, Draft: Life Cycle Assesment- Principles and Guidelines

Annals of the University of Petroşani, Economics, 12(4), 2012, 155-168 155
CSR-ISSUES IN THE VALUE CHAINS OF MULTI NATIONAL COMPANIES (MNCS) – CHALLENGES AND
BEST PRACTISE
BARTŁOMIEJ OKWIET *
ABSTRACT: The following article presents the historical basis of Corporate Social Responsibility and the most common definitions of it. Another part of the article presents the fuel company and the bank with the description of its main activities in the area of CSR. KEY WORDS: CSR; enterprise; environment; safety; oil company; bank. JEL CLASSIFICATION: L11; F61. 1. THE HISTORICAL BACKGROUND OF CSR
The concept of Corporate Social Responsibility (CSR) first appeared in the
50s, however, for the 80's remained only a definition. During the '80s, researchers began to collect empirical data on the results of the CSR. Development of CSR in America began with a moment of decision by the Supreme Court that legalized corporate contributions and its impact on social issues. This decision caused a change in the perception of the level of responsibility by the American people and led to the first engagement of companies and enterprises in social affairs. The first action of CSR activities were purely philanthropic, and very often based on personal benefits, they are rarely undertaken for the benefit of business for the company or enterprise. First of all, they were not considered as strategic activities, bringing substantial benefits to the company. Only in later years, when the event happened as an oil spill into the ocean from the Exxon Valdez oil refinery in 1989 and subsequent oil spill from the refinery, Shell's Brent Spar in the late '90s, when the corporations did not show any responsibility towards the society for the damage caused. As a result of this indifference, these companies recorded a significant drop in income, because they began to lose customers en masse, as were seen as polluters of
* Ph.D. Student, Czestochowa University of Technology, Faculty of Management, Poland

156 Okwiet, B. the environment. In response to the behavior of customers, many enterprises and companies began to consider CSR as an integral part of business strategy and lead the practice to implement CSR (Kotler & Lee, 2005).
The next event, which clearly showed that the poor CSR can significantly contribute to the decline in revenues of the company and its negative perception, were bound with Nike, Enron and Parmalat scandals. From that moment it became clear that a properly conducted CSR policy can contribute to achieve a significant competitive advantage in the market. Other factors that caused that CSR has become an integral part of the activities that are strategic measures for enterprise development, are (McElhaney, 2007):
• The impact of information technology which allows shareholders and consumers access to information and also allows for replacement,
• Increase professionalism of the NGO sector (Non-Governmental Organizations) allows to reveal and publish all the critical behaviors and offenses committed by businesses and corporations,
• The requirements placed on employers, employees responsible for conducting employment practices with the needs of companies to source highly skilled professionals from around the world
• The growing importance of theme of global warming and climate change, along with its impact on the consciousness of the shareholders on aspects of sustainable development.
On the other hand, in Europe, the approach to social issues was somewhat different than in America. In Europe social responsibility was the responsibility of governments and organizations whose main task was to take action in accordance with legal requirements. Therefore, the introduction of the concept of CSR into practice was many years later than in America. The explanation for this may be it is also in Europe, the implementation of the requirements of CSR by businesses was also much more difficult, were the cause of the strict regulations and restrictions that were formulated by the governments of European countries. In Europe, the responsibility initially was seen as an obligation to meet and not as a way to expand business (Crane & Matten, 2004).
Over the years, CSR has remained very controversial issue and being the subject of much discussion. One of the opponents of the concept of CSR is "The Economist", the newspaper says that since the beginning of a negative effect on CSR, in the 90's, said that CSR is just a temporary fad and practice of CSR, companies are only cosmetic changes in the nature (Guthey & Lange, 2006). However, at present, CSR has more supporters than critics, and the discussion on CSR has moved from purely academic considerations for having the nature of practical considerations, such as how to introduce CSR Today, CSR is understood as a central function in the business strategies of companies, including large energy companies resources are used to the idea of CSR. An example of this may be spending large corporations (an international) on CSR: GM issued 51.2 million dollars and Merck - 921 million dollars (Polonsky & Jevons, 2006).

CSR - Issues in the Value Chains of Multi National Companies ... 157 2. CSR DEFINITION
Theoretical approach to CSR is based on the question for what companies are
responsible and how they are motivated to accept this responsibility. According to the theory of Milton Friedman’s, the only responsibility of business is to maximize profit (increase the value of the shares of shareholders), but today, there is the view that companies also have a social responsibility (Porter & Kramer, 2003).
Corporate Social Responsibility is a concept defined in various ways, as each author of economics defines them in its own way. One of the broader definition of CSR is the definition given by Vogel who sees CSR as: ”Policies and programs of private firms that go Beyond legal requirements as a response to public pressures and societal expectations” (Baron, 2006). Some sources stress the altruistic nature of the motivation to implement CSR, and also that the activities of companies in CSR is not only accepted by a group of shareholders, but they also expect the next steps. Another definition of CSR is the definition created by Business for Social Responsibility who understands CSR as: „achieving commercial success in ways that honor ethical values and respect people, communities, and the natural environment” (Bhattacharya, et al., 2004). However, the definition that summarizes the key aspects of CSR is the definition given by the European Commission in 2001, contained in the Green Paper: „Social and environmental concerns in their business operations and in their interaction with their stakeholders on a voluntary basis. Being socially responsible mean not only fulfilling legal expectations, but also going beyond compliance and investing ‘more’ into human capital, the environment and the relations with stakeholders” (Promoting a European framework for Corporate Social Responsibility, 2001).
It is also worth quoting the definition of CSR given by Kellie McElhaney'a, a professor at the University of California, who stated that: „CSR is not about how you spend the Money – it is about how you the Money!” (Bueble, 2008).
The importance of CSR in maintaining long-term competitive advantage was confirmed by a person widely regarded as the "guru" in the field of management - Kotler, Drucker and Porter and Freeman. The European Commission also mentions CSR as one of the major factors affecting the competitiveness of the European economy. Even formed a company whose main task is to provide consulting services on CSR. Clearly, CSR is a business strategy is peeled by a majority of companies operating in the market.
3. STAGES OF CSR’ IMPLEMENTATION IN THE ENTERPRISE (Kompendium CSR, 2009)
The first stage of implementation of CSR in the company is to define business objectives in the long term. After their definition, it becomes important to answer the following question: "why in relation to the above, defined objectives of the company the CSR is needed?". Because the assumption of CSR is based on the socially responsible company that tries to maximize its profits and value both for itself and its shareholders (the investors), while respecting their work and ethical conduct. At the

158 Okwiet, B. same time trying to minimize any negative effects of their activities. The company, along with the market, society and environment are the dishes together, therefore, introducing a measure to improve the condition of one of these elements, a positive impact on other elements may be expected. The same effect can be noted in the other direction - worsening the condition of one element, the other elements also deteriorate.
The second step is to define the implementation of CSR purposes but for business strategy and its shareholders. At this stage, the first action the company should define the term "sustainable development" - that is, a development that will be possible to achieve and maintain over a long period of time and which also will be beneficial for the environment - society, economy and environment. At this stage, companies must ask ourselves, depending on the nature of its activities, many questions that require answering. These questions in fact are part of the market analysis by which it may be that the conduct of business in its present form (without CSR) in the long run may become unprofitable. This analysis allows defining the company in relation to four areas:
The company and the market - building company in accordance with the precepts of sustainable development, and issue clear message to all market participants on the effects and consequences of actions taken by the company;
The company as a place of work - building a culture based on dialogue with employees and addressing the needs of workers and their value in the company's strategy;
The Company and Society - building relationships with society through dialogue, acceptance of feedback messages and the desire to establish cooperation;
The company and the environment - minimizing any business activities that have an adverse impact on the environment, such as improvement of technology, keeping proper waste management.
CSR objectives should be closely linked with the strategic objectives of companies - their implementation should support business objectives and impact on minimizing the risks accompanying business activities. The ideal situation would be a situation in which the objectives of CSR leads to new business opportunities and lead the implementation of any kind of innovation in the enterprise. At this stage, it becomes important to also make a complete identification of the persons connected with the company (customers, employees, suppliers, contractors) and to determine the relationships between them and the company. This also applies to business relationships with governments, NGOs or the environment. With this identification will be possible to identify a group that has strategic importance for the company and by understanding their role in setting the company will gain more knowledge about the factors that significantly affect the success of the company. The third step of the implementation of CSR is planning and benchmarking, this step is treated as a project and the company is prepared in accordance with the methodology used by various projects. The basic tasks and milestones are determined, a group of people responsible for implementing them are assigned and who is determined and how will be responsible for CSR after its implementation. It should be noted here that this step is treated as a project may take several months and his

CSR - Issues in the Value Chains of Multi National Companies ... 159 artificial acceleration may result in improper implementation of CSR will result in its malfunctioning. Useful tool in the implementation of this step may be to compare CSR with leaders operating in the same economy, the environment or sector. It is here more to learn from "the best" than the same competitiveness. Implementation and communication is the next stage of implementation of CSR. At this stage, after completion of the project of CSR, the next steps of actions and their effects should be communicated both within the company and outside. Adequate communication allows creating transparency and is the basis of an appropriate relationship with the environment. Lack of communication makes it impossible to carry out the project or the continuation of activities which are socially responsible. Lack of communication leads to lack of capital base to build trust, so necessary to conduct effective business operations. The last step is the evaluation of CSR implementation, monitoring and reporting. Evaluation covers all activities that relate to previously established goals. After the payment, all due to be presented to all interested parties and persons connected with the company. It is also important that the CSR strategy has found its permanent place in the communication that exists between employees and company. At this stage there is continuation of the company in accordance with accepted principles of social responsibility. This activity requires a systematic monitoring and reporting of results. Monitoring may include the level of CO2 emissions, waste and environmental response to the actions of the company. Note, that the conduct of business in accordance with CSR requires consistency and continuous improvement. CSR is not only on increasing competitiveness, CSR is a strategy which results in greater competition but also more beneficial to the environment business. CSR ensures consistency of the company in the sphere of economic, social, ecological and ethical. 4. CSR IN POLISH OIL CONCERN LOTOS
Polish Oil Concern Lotos is the result of the decision taken in 1971, starting construction of the refinery in Gdansk. Construction of the refinery was to be a response to costly imports of petroleum products from the west. In 1975, the refinery came first cargo of crude oil originating from the United Arab Emirates on the tanker "Kasprowy Wierch". Currently, the activities of the Lotos Group focused on three main areas:
Mining Area – Lotos Group is the only Polish company which conducts mining operations in the Baltic,
refining – Lotos Group’s activity in this area is focused on delivering to the market high quality products with optimal use of production potential. In order to increase the efficiency of this area, Lotos Group has pledged to implement the 10+Programme1,
1 10 + Programme is a strategic task of investment realized by Grupa LOTOS in the development of the company belonging to the refinery in Gdansk. In terms of scale and value is one of the biggest projects implemented in the Polish economy until 2010. Within the 10 + at the refinery in Gdansk created several new technologically advanced plant, which will effectively produce sought on domestic and foreign oil

160 Okwiet, B.
commercial - the main objective of the Lotos Group in the area of this activity is to further strengthen its market position, achieving 30% share in the Polish fuel market by 2012 and to strengthen the image of a modern and dynamically developing company. The mission of the LOTOS Group is an innovative and sustainable
development in the area of exploration and extraction and processing of hydrocarbons, trade in products of the highest quality, ensuring sustained growth of shareholder value and achieving total customer satisfaction. Development which enables continuous improvement and use of potential employees, implemented in a responsible manner towards society, environment-friendly and consistent with the policy of energy security. Lotos Group strives to be best assessed by oil company in the Baltic Sea region in terms of: the quality of petroleum products; quality customer service; professional management. Lotos Group as a company operating in the area of fuel is received very negatively by the environment, because it is the oil companies are regarded as The Master polluters of the environment. Therefore, from the very beginning of its activity is trying to be a socially responsible company. The task group is to reconcile the various expected from both customers and society as well as shareholders and employees. Therefore, realizing what the company's primary task is to systematically increase its value, the company also draws attention to how it is pursued. CSR in Lotos Group is understood as a long-term management strategy, in which the company takes responsibility not only for financial performance but also the impact on the environment. Therefore, since 2003, Lotos Group is involved in the Global Compact initiative, following the guidelines as well as presenting their own practices in CSR. Participation in this initiative ensures transparency and is also the company's public commitment and willingness to submit to verification of the solutions. As a result of CSR policy in 2009, the company joined a group of 16 companies which are listed on the Stock Exchange within the index RESPECT2.
The strategy of corporate social responsibility (CSR) is an undertaking given to the implementation of the Lotos Group, along with business strategy. Long-term strategy for social policy is not only a source of competitive advantage, but also complement and support the business strategy. This follows from the belief that the achievement of business objectives would not be possible without taking into account social and environmental objectives in relation to key stakeholder groups.
products of the highest quality. Its implementation will ensure an increase in national energy security, which will also contribute to diversification of supply sources and increasing their oil production. Sulfur-free fuel, reducing emissions of heavy metals and particulates as a result of the 10 + is a direct benefit to the environment. The scheme will significantly improve the competitiveness of the Group's largest production facility of LOTOS, and investment in infrastructure is outsourced Polish companies new opportunities for businesses and new jobs. 2 November 19, 2009 after months of effort made its debut on the Stock Exchange Securities in Warsaw, the first in Central and Eastern Europe index of socially responsible companies – RESPECT Index. The idea underpinning the creation of the index, this award of companies which, in respect of social responsibility and sustainable development endeavor going well beyond their obligations under law and include an element of social responsibility internship in the business. The possibility of finding in the index is all companies listed on WSE excluding NewConnect and beyond WSE (dual listing).

CSR - Issues in the Value Chains of Multi National Companies ... 161 Social responsibility strategy of Lotos Group defines short and long term objectives, actions and measures of the following areas: human resource management; occupational safety and health; environmental protection; relationships with the local environment; Market Partnership; community involvement. Lotos Group is one of the most dynamic oil companies in the Central European region and also one of the largest Polish companies. Responsibility for the environment, community, employees and contractors, and energy security of the country is seen as a duty to the company. Principles of corporate social responsibility are therefore permanently inscribed in the mission and values of the company. 5. MAIN ACTIVITIES IN THE CSR AREA
Below the main key activities of Lotos Group in the area of Corporate Social Resaponsibility are presented.
The company uses its facilities exclusively the best available technologies to preserve the purity of production, namely the systematic reduction of emissions, reduction of raw materials, energy and water, solid waste treatment and prevention of accidents. Implemented in the company monitoring system enables continuous monitoring of the environmental impact of the plant. Today Lotos Gropu is continuing its modernization program guides sewage treatment and containment facilities, which will reduce the level of pollutants emitted to the lowest possible today to reach the level. Thanks to this production company currently has the smallest possible environmental impact. According to an independent expert conducted in 2007, implemented in the Lotos Group projects in the field of the 10 + Programme do not cause significant deterioration of the environment in areas adjacent to the refinery, including sites belonging to the Natura 2000 network. The new investments will be used among other solutions such as dissipation of any leakage directly into the sewer system to prevent leakage of pollutants into soil and groundwater, an early warning sensor system for leakage apparatus, a closed drainage system, version of the device in a reduced volume of work, constant monitoring of sources pollution and low emission burners in furnaces.
Another way to reduce any negative impact on the environment is the philosophy of producing only safe products - high quality fuel with the lowest achievable disturbance to the environment and humans. As the first manufacturer in Poland, Lotos Group started to use in fuel additives, which ensure proper cleanliness of the intake of fuel and the combustion chamber and protect engines from corrosion, which ensures proper combustion of fuel and thereby reduces air pollution.
This year, the Lotos Group has been working with the Foundation for the Development of Gdansk University and provided financial support to environmental activities related to protection of biodiversity of the Baltic Sea. The transferred funds are to be purchased include equipment supporting protection against by-catch of porpoises. The scale of involvement of LOTOS in the environment provides the best amount earmarked for this purpose. Environmentally friendly investments in 2008 amounted to approximately 225 million plz and accounted for almost 12% of all investments (1.911 billion plz).

162 Okwiet, B.
Lotos Group’s initiative directed towards the region of Pomerania in operation since 2005. Assumes cooperation with Regional Authorities of concern in the implementation of economic projects and major events located in the Pomerania region, promoting the metropolis and the region in Poland and the European Union. The initiative in January 2007 an agreement was signed between the presidents of Lotos Group Gdansk, Gdynia and Sopot and the governor and the Speaker of the province. The aim of the initiative was to create a platform for the development agreement and the Tri-Pomerania - both economic and social as well as cultural. The agreement provides for on-going communication between Lotos Group and provincial and local authorities on joint ventures of cultural and social life. The individual events are selected taking into account the social dimension and importance for the promotion of the Pomeranian region. Co-operation and care of the communities surrounding the refinery are entered permanently in the company's social responsibility strategy. The company is committed to local initiatives - both those that are used to solve local economic and social problems, and those that support and promote the culture of the region in Poland and abroad. In May 2008, Lotos Group joined the public campaign "not only save the fuel." The campaign is conducted in 29 countries by the European Petroleum Industry Association (Europe) and the European Commission. The campaign aims to initiate a social dialogue with the environment of consumers - through their car users to encourage efficient driving style, allowing the fuel savings, but also reducing traffic nuisance for the environment. The campaign was based on the ten tips to help motorists to drive in such a way to increase fuel efficiency.
Lotos Group cooperates with many universities, including the Technical University of Gdansk, Gdansk University and the Academy of Mining and Metallurgy in Krakow. In collaboration education students have access to concern’s internship programs, internships and scholarships. The best of them receive job offers at Lotos Group. To support educational projects Lotos Group is working with the Department of Chemistry, Gdansk University of Technology. In cooperation substantive experts and representatives of the group of universities in academic year 2007/2008 a new specialization was created - Technology refinery and petrochemical industry. Employees of the Lotos Group support in the conduct of University classes in the specialization of their experience and substantive knowledge. Students also have the opportunity to participate in practices and organized by the group in laboratory classes conducted in the laboratories of LOTOS Lab. Experts from Lotos Group also sit on the Advisory Council at the Faculty of Chemistry. The emergence of a new specialization is, on the one hand, the answer to the lack of professionals in this field in the labor market, on the other - a chance for universities to attract new volunteers to study at the faculty and the students themselves the opportunity to acquire specialized training, attractive from the perspective of employers.
Lotos Group contributes to the improvement of road safety, not only by improving product quality, but also engaging in social actions. One of them is directed to children education program - preventive "Safe route to school with Lotos", realized by Lotos Group. The program is targeted at early school age children and their coverage in 2007 took over nine thousands children in the Pomeranian province and

CSR - Issues in the Value Chains of Multi National Companies ... 163 four thousands children from Jasło and Czechowice. The initiative aims to prevent road accidents involving children. This program cooperates with the police and local authorities. In 2007, the company also took an active part in the social campaign "Safe Eight" organized by the General Directorate for National Roads and Motorways. The campaign aimed to raise awareness of drivers in driving safety. Campaign concerned the national road No. 8, but it has to be extended by another road. The campaign was attended by 21 Lotos petrol stations located along the road No. 8.
Lotos Group also financially supports public medical institutions. Donations are forwarded to purchases of medical equipment and activities in the field of health promotion. Activity of concern related to health care focuses on the territory of Pomerania, and in the south of the country, where the largest manufacturing companies are located. In cooperation with medical institutions, Lotos Group purchased equipment for the nitric oxide therapy for Traumatology Centre of the Pomeranian Voivodeship Specialist Hospital - Pediatric Cardiac Surgery Department, pulsoxymetru for internal medicine hospital pediatric Polanki Gdansk, gamma-ray detector for Division of Surgical Oncology Cancer Center, apparatus for diagnosis of coronary artery disease heart for the University Hospital in Krakow. Lotos Gropu endowed in 2007, the Department of Diabetology, Children's rooms in Gdansk Medical Academy. The company does not forget about their employees, in view of these programs are created to improve the professional qualifications of employees. The most important activities the group carried out in this area are:
Academy of LOTOS "On the way to excellence" - a comprehensive program of professional development and continuing education of employees, operating since 2004. The aim of the Academy is to implement an organizational culture where employees are motivated to consciously participate in creating added value for customers and shareholders. University employees can improve in a systematic way and to achieve continuous improvement in work efficiency,
"Leader of the Future 2007-2009" - a program aimed at developing the best managers in the company, whose task will be to meet the challenges that may face the concern in the future,
"Staff 2009 - 10 + Programme" - a project set to attract employees involved in the 10 + Programme,
"The certification of knowledge for employees in the area of production" - a project which aims to support the preparation of production workers to perform the tasks within the 10 + Programme,
"The development of human resources" - its purpose is to provide business continuity management processes.
All these actions taken by the Lotos oil company, show clearly that the company is fully aware that the implementation of CSR strategies will not only improve the company's financial results, but will contribute to its perception as a business friendly environment, not only but also the environment, both internal as and external.

164 Okwiet, B. 6. CSR IN ING BANK
In 1988, as a result of arrangements made by the Council of Ministers the Bank of Silesia region was created. At the beginning, the bank was owned by the state, but in 1991 it was transformed into a limited company. And in 1993, the bank is permitted to introduce its shares to the public. Since the bank has been introduced on the stock exchange, its shares are successively bought by ING Group (International Nederlanden Group), and in 1996, the number of shares held by this group causes that ING has a 54.08% of share capital. This share risen to 82.81% in 2001, causing, that in the same year, Bank Slaski has begun a member of the ING group, and runs its business under the name ING Bank Slaski.
Today, the bank offers a wide range of products, both, for individual and corporate clients (companies, concerns and local states). Bank offers products such as private accounts, savings, loans and credits, also, offers insurance and investments services. The bank’s offer, directed to the corporate clients, it can be found service, profits management, financing and risk management. And the concerns may use the services such as finance market service, securities service and cooperation with other banks services.
ING Bank Slaski was the first polish bank, which has started a cooperation with a very famous polish actor – Marek Kondrat, he has been a “face” of the bank for ten years. Thanks to the commercials with this actor, bank not only, increased the number of its clinets, but also, got many prizes, especially prizes granted for commercials campaign.
In a daily work, ING Bank Slaski, is guided by the follows values: act with integrity; act in an open and clear way; mutual respect; act in a responsible way towards the environment and society. These values fully reflect what the bank wants to highlight and in what way it wants to be perceived by the customers.
The CSR strategy adopted by the ING Bank Slaski, is based on international standards and relates directly to Universal Declaration of Human Rights and UN Global Compact principles3. Since the year 1991, bank as a body of public trust, has used the Principles of Good Banking Practices4 and Corporate Governance5. Its action have been run towards to the Best Practices Principles, which had been adopted by the Board of Stock Exchange. Confirmation of these practices is bank’s presence at the Respect Index (like Lotos Group).
Bank’s action carrying out the Corporate Social Responsibilty are taken in the following areas: relation with the clients; relations with the employees; relation with the community; environment,
3 Global Compact is the world's largest initiative for corporate responsibility and sustainable development. Global Compact is a call directed to a business that in its operations guided by the 10 basic principles of human rights, labor rights, environmental protection and anti-corruption and to promote corporate social responsibility (CSR). 4 Principles of Good Banking Practice are a set of rules of conduct related to the activities of banks and relate to the banks, people are employed and those through which banks carry out banking transactions. 5 That the rules defining standards of relations between listed companies and their market environment, can be an important instrument strengthening the competitiveness of the market. They can also be an innovative approach to the problems of the stock market, and by building its international attractiveness.

CSR - Issues in the Value Chains of Multi National Companies ... 165 Relation with the clients. In this area, the bank focuses on efforts to adapt products and services according to customer’s needs and expectations, particularly for continuous quality improvement in its services. For the bank, the responsibility for the business relationships with customers is a clear and understandable offer, ethical marketing and communications, reaching for the highest standards of its services, fair complaint process and a dialogue with the clients. With these realized values, today, the bank is a leader in the field of Internet banking, in the year 2011, it was the first bank in Poland, had conducted a survey directed to the users, in order to rebuild the site and improvement on its use. Thanks to this survey, and its opinion, the bank’s website has been rebuilt. As a result of this, the bank received the "Crystal Symmetry" award for the best website. And thanks to the high quality of service, the bank was among the TOP 100 most friendly companies in Poland, taking the third place in the banking and finance category, it has also won the "Quality Emblem Service 2011" which is awarded on the basis of the consumers’ opinion. In the year 2011, the bank has continued its activities related to research in the areas of customer satisfaction:
individual clients - thanks to the method of Walker Information6, and Net Promoter Score7, it was possible to diagnose the level of customer satisfaction resulting in bank’s recommendation to other customers;
Corporate and strategic clients – the carries out studies has related to quality of service, financial circumstances, to carry out any improvements or adjustments to customers' expectations.
Also in the year 2011, the bank continued to modernize its facilities (67 retail branches). Changes made to the facilities are intended to bring interior design to customer needs and expectations together with ensuring the access to modern and comfortable handling. Customers can use the Waiting Zone and a meeting room, and for the little ones are the corners of children's media. Additionally, for the corporate customers, bank has made a service of ING Meeting Place available – the bank's customers can use the conference rooms of the bank. In order to conduct a dialogue with the customers, to which the bank pays a great attention, the bank uses tools such as a forum, Skype, Facebook, the channel on the You Tube and video calls. And in the year 2011, the bank has introduced a procedure for supplier management, which is the basis for determining a coherent vision and strategy for collaboration with suppliers. By taking a consistent and uniform supplier management process, it is possible to maintain the right balance and efficiency, cost optimization and the minimization of the risk occurring in co-operation. Relation with the employees. The Bank strives to offer a friendly, safe, attractive and stimulating the development job positions. With the implementation of solutions such as the ability to work from home (at least one day during the month), it facilitates a balance between the work and private life. The Bank also supports the professional development of employees by encouraging them to achieve high results, including to provide tools such as Navigator
6 This method is used for the diagnosis of attachment, satisfaction, customer loyalty and satisfaction with services received. 7 This method is used to diagnose satisfaction..

166 Okwiet, B. Development (the path for planning their own development) and development internships (used to know the specifics of work of other units of the bank). Bank runs the initiatives directed to the outstanding employees and managers: Conference with the authorities and the Academy of Arts and Orange meeting. Employees also have the opportunity to anonymously express an opinion on the work at the bank - this objective is carried out by yearly employee satisfaction survey WPC (Work Performance Culture), the last study included 88% of employees’ opinions, providing valuable information on issues such as the realization of the strategy, openness and attractiveness of the bank's growth in the labor market. Relation with the community. Together with ING Foundation for Children8, the bank supports and promotes social activities among the employees through the implementation of employee volunteering program (8 hours of annual working time, bank employees can devote to volunteering). Under this program, the bank throughout the year, performs volunteer actions:
• projects for local communities - as a part of the competition for the good idea of volunteering initiatives. In 2011, 560 employees realized the 39 actions in favor of social clubs, hospitals, schools, kindergartens,
• projects for selected social partner - actions in most of the gathering a large number of employees working for the benefit of selected individuals – including children's homes, treatment centers, in 2011, was held on 16 of such shares, the largest of which was attended by nearly 100 employees.
Bank supports education and development of entrepreneurship among high school students, the result of this support was to obtain the bank's active title on Enterprise Businesses, for the 130 preparation of practice and conduct training day. Another initiative was the Global Challenge of the bank - the bank's volunteers organized a meeting for children on which the book "Snapper lion, which was not" issued by ING Bank Slaski, was read. The effect of this action was to give to local community centers, hospitals, schools and kindergartens more than 3,500 copies of this book. The tradition of the bank are also charities collections organized by the employees, for children who are the wards of the ING Foundation for Children - in September, schoolchildren received a dowry gifts, and Christmas presents in December. Environment. Besides all the above activities, the bank also leads efforts to protect the environment and its resources. These actions are manifested, among others:
Organization of the "I turn trash to the parking lot for a mouse," whose purpose was to limit the number of baskets and discarded plastic bags;
8 The Foundation was established on the foundations established in 1991, the Foundation Bank. With the knowledge and involvement of people associated with the Foundation and ING employee volunteers help already received several thousands of children throughout the country. The Foundation's mission is to equalize opportunities for children from deprived areas, both geographic and social. The Foundation implements educational programs such as Internet Day-ING. It helps chronically ill children, provides financial assistance to schools educating children and youth with special needs, and organizes educational rehabilitation stays Smile for dependents of those institutions.

CSR - Issues in the Value Chains of Multi National Companies ... 167
"clean office" action, through which was collected collect 150 tons of waste (paper, electronic equipment or furniture), which were disposed of in an environmentally friendly way;
"Spring teleCleaning" action, during which was carried out the collection of used cell phones. The purpose of this action was the realization that thrown into the dustbin the mobile phones are a hazardous waste, and ultimately carried out the collection - no longer phones have been safely disposed of;
"Earth Hour" action is a worldwide actions which the aim is to express support for the climate of the planet. Awareness is to turn off lights for an hour in the headquarters and branches;
"A week for Earth" action which aims to raise employees' environmental awareness, shaping attitudes that promote good practice at work and at home as well as paying attention to the impact that each employee can have on the environment. With actions undertaken, the bank was the winner of the Pantheon of Polish
Ecology, which is a prestigious award for operators to protect and improve environmental quality. In addition, the report Responsible Business Forum on "Responsible Business in Poland" is presented to implement the Environmental Management System according to ISO 14001 in ING Bank Slaski, as an example of good practice in CSR companies in Poland. 7. CONCLUSION
CSR (Corporate Social Responsibility) is taking action today by companies,
and treated them as a natural duty. Increasingly it is known that the company has focused solely on maximizing profit rather remiss in matters relating to their immediate environment: workers, the environment and society, in a certain period of time will feel the negative effects of their ignorance. Employees as the power of the companies and often has an impact on the results achieved by the financial and market position, should be adequately treated, as well as motivated and rewarded. With this treatment of workers, the company is gaining a solid and reliable opinion of the employer. By limiting the negative impact of its activities on the environment becomes, in popular opinion, the company cares about the environment. While taking care of the immediate community - gaining the opinion of the company responsible. Today, more and more companies are trying to be "socially responsible", because looking at companies that were leaders in CSR can be certain that the introduction of CSR brings many benefits and adverse effects of CSR has not yet been found. REFERENCES: [1]. Baron, D. (2006) Corporate Social Responsibility and Social Entrepreneurship, Journal of
Economics and Management Strategy [2]. Bhattacharya, C.B.; Sen, S.; Korschun, D. (2004) The Role of Corporate Social
Responsibility in Strengthening Multiple Stakeholder Relationships: A Field Experiment”.,Journal of the Academy of Marketing Science

168 Okwiet, B. [3]. Bueble, E. (2008) Corporate Social Responsibility: CSR. Communication as an instrument
to Consumer-Relationship Marketing, Grin Verlag, Auflage [4]. Crane, A.; Matten, D. (2004) Cusiness Ethics: A European Perspective, Oxford
University Press [5]. Dima, I.C.; Man, M.; Vladutescu, S. (2012) The Company’s Logistic Activity in the
Conditions of Current Globalisation in Globalization - Education and Management Agendas, InTech, Rijeka
[6]. Dima, I.C.; Marcincin, I.N.; Grabara, J.; Pachura, P.; Kot, S.; Man, M. (2011) Operational management systems of the production achieved in flexible manufacturing cells. Presov, Slovakia: Techinical University of Kosice
[7]. Dima, I.C.; Grabara, I.; Pachura, P.; Kot, S.; Modrak, V.; Marcincin, I.N.; Man, M. (2011) Multiserving – operational management system of the production achieved in flexible manufacturing cells, WWZPCz, Czestochowa
[8]. Guthey, E.; Lange, R. (2006) Corporate Social Responsibility is a Management Fashion – So What?, Djof Publishers
[9]. Kotler, P.; Lee, N. (2005) Corporate Social Responsibility. Doing the most good for Your Company and Your Cause”, John Wiley&Sons
[10]. McElhaney, K. (2007) A Catechism on Corporate Social Responsibility, Ernst&Young, Silberhorn and Warren
[11]. Polonsky, M.; Jevons, C. (2006) Understanding issue complexity when building a socially responsible brand”, European Business Review
[12]. Porter, M.E.; Kramer, M.R. (2003) The Competitive Advantage of Corporate Philanthropy, Harvard Business Review on CSR, Harvard Business School Publishing Corporation
[13]. (2009) Kompendium CSR, Media Planet [14]. (2001) Promoting a European framework for Corporate Social Responsibility, Green
Paper, Commission of the European Communities. http://eur-ex.europa.eu/LexUriServ/ site/en/com/2001/com2001_0366en01.pdf

Annals of the University of Petroşani, Economics, 12(4), 2012, 169-176 169
COMPETITIVENESS IN REGIONAL DEVELOPMENT
ELENA MĂDĂLINA OPRIȚESCU *
ABSTRACT: The development and diversification of the economic activities, the stimulation of investments both in the public sector, but mainly in the private one, the reduction of unemployment, the improvement of living standards are just some of the concepts aimed at by the regional development. The main method which can lead to a balanced development of the regions is financing them differentially so that the underdeveloped regions would obtain proportionally more funds that the developed ones. At a region level, the main objective is represented by the more accelerated growth of the less developed regions, in an effort to diminish the inter-regional and intra-regional development disparities. A key role is played by the sustainable economic growth concept, while also analyzing the competitiveness at a regional level, as well as the main development factors.
KEY WORDS: competitiveness, regional development, sustainable economic growth, efficiency, equity
JEL CLASSIFICATION: G01, R11 1. INTRODUCTION The current economic and financial crisis has not just changed the global economic environment, but has also highlighted the fact that the financing sources were, in many countries, not safe enough, emphasizing the need to improve the economic performance measurements. In the last two or three decades, one of the key elements used in the regional development’s economic analysis has been the regional competitiveness. Also, the regional development is a concept that aims at stimulating investments, both in the public sector, but mainly in the private one, at developing and diversifying the economic activities, at contributing to a reduction in unemployment and, last, but not least, at leading to an improvement in the living standards. Thus, the main method which can lead to a balanced development of the regions is financing them differentially, so that the underdeveloped regions would obtain proportionally more funds than the more developed ones. At a regional level, the main objective is
* Ph.D. Candidate, University of Craiova, Romania, [email protected]

170 Oprițescu, E.M. represented by the more accelerated growth of the less developed regions, in an effort to diminish the inter-regional and intra-regional development disparities.
2. COMPETITIVENESS AT THE EU LEVEL
Competitiveness is a wide notion, with multiple valences which converge towards a concept whose content has not been precisely established. According to the Statistical Office of the European Union, competitiveness is “the capacity of an enterprise, economic branch or trans-national ensemble to generate, in a sustainable manner and under competition conditions, relatively high income levels and factor occupancy levels”.
According to the general development objective, the national strategy will give priority to the underdeveloped regions which make use of national and regional resources, while the other sectoral strategies do not benefit from a spatial approach, but have an obvious regional impact. Implementing the regional strategy will, ultimately, lead to a reduction in inter-regional disparities, as well as in disparities within regions, between the rural and urban areas, between urban centres and adjacent areas and, within cities, between the areas which are attractive for investors and the unattractive ones.
Both the highly developed regions and the less developed ones have been equally affected by the economic crisis in the last few years. As a result, the regions have remained at approximately the same level and the general regional disparities have not changed significantly.
The World Economic Forum annually publishes a report regarding global competitiveness in the countries. By adopting a similar approach, a new competitiveness index has been created for all NUTS 2 regions. It consists of twelve pillars which are based on a total of 96 indicators organized in three groups, basic group, efficiency group, innovation group). These indicators have a much wider scope than just limited economic aspects and also include many indicators regarding the quality of life, life expectancy, health etc.
The twelve pillars distributed into the 3 groups present themselves as follows: The Basic Group represents the main engines of any type of economy:
1. Institutions 2. Infrastructure 3. Macroeconomic environment 4. Health and primary education
The Efficiency Group represents the aspects which become important as a region develops:
5. Higher education and training 6. Goods market efficiency 7. Labour market efficiency 8. Financial market development 9. Technological readiness 10. Market size
The Innovation Group includes the engines of advanced regional economies:

Competitiveness in Regional Development 171
11. Business Sophistication 12. Innovation
Source: The Global Competitiveness Report, 2012–2013
Figure 1. The Global Competitiveness Index (GCI)
Each of these pillars allows evaluating a region’s performance in relation with all other regions. As a result, they can be considered as indicators of the strengths and weaknesses for each region.
Once the regions advance by means of own development, the social and economic conditions also change and other determining factors become increasingly important for their competitiveness. Thus, the optimal method to improve the competitiveness of a more developed region can differ from those of a less developed one. Considering this aspect, the proportions associated to each of these groups are related to the region’s GDP per capita, as follows:
In the less developed regions, the distribution is: 40% for the basic group, 10% for the innovation group, while the efficiency group receives a fixed percentage of 50%;
In the regions with an average development, the distribution is: 30% for the basic group, the innovation group practically doubles reaching 20%, while the efficiency group receives the same fixed percentage of 50%;
In the more developed regions, the basic groups receives only 20%, the innovation group triples, reaching 30%, while the efficiency group, again, receives the same fixed percentage of 50%.

172 Oprițescu, E.M.
All these show that the competitiveness of a less developed region can be consolidated rather by improving institutions and primary education, than by increasing innovation expenditures. Moreover, one can notice that developed regions can lose competitiveness if they do not invest more in innovation.
In the image below, one can notice the high levels of competitiveness and the regions or countries with low performances in relation to the Global Competitiveness Index (GCI). The ten best performances are highlighted with dark red. The rest of the countries have intermediate colours, ranging from orange – the second best performance group, through yellow, light blue, normal blue and dark blue – this last colour identifies the least competitive countries, according to the GCI. The map reveals that the most competitive countries remain concentrated in Europe, North America, while also comprising some of the advanced economies from Asia and the Pacific. Despite decades of intense economic growth, in some developing regions (such as Latin America and Africa), the map shows that these regions’ competitiveness gap persists compared to the much more advanced countries.
* The interval [x,y] is inclusive of x but exclusive of y. † Highest value; †† lowest value. Source: The Global Competitiveness Report, 2012–2013
Figure 2. Competitiveness at a global level
At the European Union level, the general competitiveness is higher in the northern regions, in the south of Germany, in the Benelux and in the south-east of England. As far as competitiveness is concerned, the differences between regions are higher within certain member states. For example, most of the regions in Germany and Poland, as well as some regions in Greece which are specialized in tourism, but also the regions around the capitals from the EU-12 zone have been relatively little affected by the crisis. By contrast, almost all the regions in the Baltic countries, the regions in

Competitiveness in Regional Development 173 the north of Hungary, some regions in Italy and southern Spain, Greece, Ireland have suffered a significant economic contraction. A relatively fast recovery has been observed in some prosperous regions from Germany and northern Belgium, as well as in the capital regions in the north and centre of the EU. Also, one can notice a relatively good performance in the case of some regions in Poland, as well as a rather rapid recovery in most of the other EU-12 regions. At the other extreme, forecasts are much less favourable for the regions from Greece and, in a lesser degree, for those from Spain, France, Italy and Portugal.
Figure no. 3 displays the competitiveness at the level of each region, as the bright red highlights the highly competitive regions, while the dark blue highlights the least competitive ones.
* The interval [x,y] is inclusive of x but exclusive of y. † Highest value; †† lowest value. Source: The Global Competitiveness Report, 2012–2013
Figure 3. Competitiveness at the EU level
At the level of Romania, the Global Competitiveness Index is presented in Figure no. 4. The first column displays the country’s rank among the 144 analyzed economies, while the second column displays the score. Each sub-index’s proportional contribution to the GCI score is also reported separately in the above figure, split into three main groups, weighted correspondingly according to the low development level. These weightings vary depending on the country’s level of development. On the right hand side, a diagram shows the country’s performance for the 12 pillars of the GCI (the blue line), measured in regard to the average scores of all economies which undergo the same development stage (the black line).

174 Oprițescu, E.M.
Source: The Global Competitiveness Report, 2012–2013
Figure 4. The Global Competitiveness Index at the level of Romania
Regardless of their level of development, generally, in most of the countries, the regions around the capitals record higher values as far as competitiveness is concerned. Whereas in the developed countries, the competitive regions are surrounded by other competitive regions, in the less developed countries, these regions are usually surrounded by less competitive ones. This reveals the fact that the competitiveness factors are distributed more uniformly in the developed countries and the competitiveness tends to extend upon the neighbouring regions. In the less developed countries, the competitiveness factors are concentrated in the capital region, due to limited transportation connections and to a different business environment.
Although the areas most affected by the economic crisis were those specialized in craftsmanship, the highest unemployment rates have been recorded in the regions which were highly dependant on the construction sector. Regions with an increased proportion of public sector employment have also been significantly affected. Those which have been moderately affected specialize in financial and business services, as mostly are capital regions or developing metropolitan regions. Generally, the industrial regions, specialized in production, or those with a higher proportion of financial or business services are forecast to recover more quickly, while those that are dependant on tourism, construction and public administration are estimated to recover more slowly.
The exchange of goods between the EU and the rest of the world has also been deeply affected by the economic crisis. The recession, which has affected EU more strongly than other parts of the world, has led to a higher decrease of imports than that of exports and to a fall in the trade deficit. More and more companies are relocating different parts of their production facilities in different parts of the world and this

Competitiveness in Regional Development 175 increasingly dispersed production system is boosting the demand for logistics and command and control systems. Such a process is creating both opportunities and threats for the EU regions. The sectors in which the EU has become less competitive include the textile, metal or electrical and optical equipment industries. Some regions have lost their markets as they have engaged in competition with developing economies outside the EU in the field of low cost and quality products. This fact highlights the essential role of investing in the human capital, in the entrepreneurial spirit and in a favourable business environment.
In order to understand the economic development in the EU regions, one must perform an analysis of the factors which the diversity of the economic performance or a region’s competitiveness is based upon. Specialized papers tend to group the development factors in the following general categories: production factors; human and physical capital; technology.
It is assumed that an accumulation of the aforementioned factors is facilitated by functional financial and labour markets and it is affected by different other characteristics, such as population age structure, available natural resources, access to the large production markets, economic activity density within the region, administration quality, political context, macroeconomic environment etc.
Starting from the factors enumerated above, econometric techniques have been employed in order to calculate which of the more than 60 potential growth factors represent the most important engines in the regional development, as follows: - the human capital, in other words the education level, is one of the most important
development factors, especially the proportion of superior education population. This is in correlation with the innovation, as these people facilitate the rapid spread of new technologies and knowledge, in general;
- the fixed capital is another important factor, mainly due to the fact that it directly affects a company’s productive capacity, but also because this factor also influences innovation, as the capital tends to incorporate the latest technologies;
- unemployment reflects the healthy functioning of the labour market, as well as the regional flexibility and social cohesion;
- existing neighbours, meaning that a region’s development performance partially depends on the neighbouring regions’ development.
All these results reveal the fact that national measures cannot express this strong regional dimension – competitiveness.
The development of the regional economies remains a major priority for each country, as it generates employment and finances social expenditures and environment protection, as well as social cohesion and cleaner and more efficient technologies which, in turn, contribute to development. For a sustainable development, the three axes of the Europe 2020 Strategy are: • Intelligent growth: developing an economy based on knowledge and innovation; • Sustainable growth: promoting a more efficient and ecological use of resources and
promoting a more competitive economy; • Growth favouring inclusion: promoting an economy with a high level of
employment which would ensure social and territorial inclusion.

176 Oprițescu, E.M. 3. CONCLUSIONS
The main goal of the regional development policies consists in reducing regional disparities, achieving a balance between the different regions’ social and economic development levels.
One objective of the regional policy, specific to this period, is to facilitate structural and sectoral adjustments, to support the economic restructuring and recovery processes, to rebuild and stimulate the regions’ competitive capacity and to support the European integration processes.
Most of the countries, including the economically developed ones, are facing regional disparities and, consequently, are applying regional development strategies and policies. One must also consider that the difficulties generated by the regional imbalances and the ways to solve them, cannot be approached without taking into account each country’s level of development. The process of reducing the discrepancies between the developed and underdeveloped regions takes time and can be performed through small steps. Even if the economic growth rhythms are superior in the less developed regions, the developed regions’ economies do not stagnate, but situate themselves on ascending trend, reflected in the disparity reduction intensity.
For this reason, diminishing the territorial disparities should represent an essential component of each country’s post-adhesion strategy. REFERENCES: [1]. Fischer, S. (1993) The Role of Macroeconomic Factors in Growth, Journal of Monetary
Economics 32 (3) [2]. Grossman, G.; Helpman, E. (1994) Endogenous Innovation in the Theory of Growth,
Journal of Economic Perspectives- Volume 8, Number 1 [3]. World Economic Forum (2012) The Global Competitiveness Report 2012–2013, 2012
edition, Geneva [4]. World Economic Forum (2012) The Europe 2020 Competitiveness Report: Building a
More Competitive Europe, 2012 edition, Geneva [4]. http://europa.eu, Luxembourg: European Union Publications Office, 2010

Annals of the University of Petroşani, Economics, 12(4), 2012, 177-184 177
EXTENDED NETWORK FOR BACKPROPAGATION ALGORITHM
MIRCEA PETRINI *
ABSTACT: This paper presents the backpropagation algorithm based on an extended network approach in which the algorithm reduces to a graph labeling problem. This method is not only more general than the usual analytical derivations, which handle only the case of special network topologies, but also much easier to follow. It also shows how the algorithm can be efficiently implemented in computing systems in which only local information can be transported through the network.
KEYWORDS: Artificial Neural Network (ANN); backpropagation; extended network; feed-forward computation; training pattern.
JEL CLASSIFICATION: C 1. BACKPROPAGATION ALGORITHM The backpropagation algorithm used in artificial neural network (ANN) looks for the minimum of the error function in weight space using the method of gradient descent. The combination of weights which minimizes the error function is considered to be a solution of the learning problem. Since this method requires computation of the gradient of the error function at each iteration step, we must guarantee the continuity and differentiability of the error function. Obviously we have to use a kind of activation function other than the step function used in perceptrons, because the composite function produced by interconnected perceptrons is discontinuous, and therefore the error function too. One of the more popular activation functions for backpropagation networks is the sigmoid.
* Lecturer, University of Petroşani, Romania, [email protected]

178 Petrini, M. 2. EXTENDED NETWORK
We will consider a network with n input sites, k hidden, and m output units.
The weight between input site i and hidden unit j will be called . The weight
between hidden unit i and output unit j will be called . The bias of each unit is implemented as the weight of an additional edge. Input vectors are thus extended with a 1 component, and the same is done with the output vector from the hidden layer. Figure 1 shows how this is done. The weight between the constant 1 and the hidden
unit j is called and the weight between the constant 1 and the output unit j is
denoted by .
Figure 1. Notation for the three-layered network There are weights between input sites and hidden units and
between hidden and output units. Let denote the matrix with
component at the i row and the j column. Similarly let denote the
matrix with components . We use an overlined notation to emphasize that the last row of both matrices corresponds to the biases of the computing units. The matrix of weights without this last row will be needed in the backpropagation step. The n-dimensional input vector is extended, transforming it to
the excitation of the j hidden unit is given by

Extended Network for Backpropagation Algorithm 179
The activation function is a sigmoid and the output of this unit is thus
The excitation of all units in the hidden layer can be computed with the vector-matrix multiplication . The vector whose components are the outputs of the hidden units is given by
using the convention of applying the sigmoid to each component of the argument vector. The excitation of the units in the output layer is computed using the extended vector . The output of the network is the m-dimensional vector
, where
These formulas can be generalized for any number of layers and allow direct computation of the flow of information in the network with simple matrix operations. 3. THE ALGORITHM Figure 2 shows the extended network for computation of the error function. In order to simplify the discussion we deal with a single input-output pair (o, t) and generalize later to p training examples. The network has been extended with an additional layer of units. The right sides compute the quadratic deviation or the i
component of the output vector and the left sides store . Each output unit i in the original network computes the sigmoid s and produces the output . Addition of the quadratic deviations gives the error E. The error function for p input-output examples can be computed by creating p networks like the one shown, one for each training pair, and adding the outputs of all of them to produce the total error of the training set.
After choosing the weights of the network randomly, the backpropagation algorithm is used to compute the necessary corrections. The algorithm can be decomposed in the following four steps: i) Feed-forward computation; ii) Backpropagation to the output layer; iii) Backpropagation to the hidden layer; iv) Weight updates.
The algorithm is stopped when the value of the error function has become sufficiently small. i) First step: feed-forward computation. The vector o is presented to the network. The vectors and are computed and stored. The evaluated derivatives of the activation functions are also stored at each unit. ii) Second step: backpropagation to the output layer. We are looking for the
first set of partial derivatives . The backpropagation path from the output of the network up to the output unit j is shown in the B-diagram of figure 3.

180 Petrini, M.
Figure 2. Extended multilayer network for the computation of E
Figure 3. Backpropagation path up to output unit j
From this path we can collect by simple inspection all the multiplicative terms
which define the backpropagated error . Therefore
and the partial derivative we are looking for is

Extended Network for Backpropagation Algorithm 181
Remember that for this last step we consider the weight to be a variable and its input a constant.
iii) Third step: backpropagation to the hidden layer. Now we want to
compute the partial derivatives . Each unit j in the hidden layer is connected to
each unit q in the output layer with an edge of weight , for q = 1,...,m. The backpropagated error up to unit j in the hidden layer must be computed taking into account all possible backward paths, as shown in figure 4.
Figure 4. All paths up to input site i The backpropagated error is then
Therefore the partial derivative we are looking for is

182 Petrini, M.
The backpropagated error can be computed in the same way for any number of hidden layers and the expression for the partial derivatives of E keeps the same analytic form.
iv) Fourth step: weight updates. After computing all partial derivatives the network weights are updated in the negative gradient direction. A learning constant defines the step length of the correction. The corrections for the weights are given by
and
where we use the convention that . It is very important to make the corrections to the weights only after the backpropagated error has been computed for all units in the network. Otherwise the corrections become intertwined with the backpropagation of the error and the computed corrections do not correspond any more to the negative gradient direction. 4. TRAINING PATTERN In the case of p>1 input-output patterns, an extended network is used to compute the error function for each of them separately. The weight corrections are computed for each pattern and so we get, for example, for weight the corrections
The necessary update in the gradient direction is then
We speak of batch or off-line updates when the weight corrections are made in this way. Often, however, the weight updates are made sequentially after each pattern presentation (this is called on-line training).
In this case the corrections do not exactly follow the negative gradient direction, but if the training patterns are selected randomly the search direction oscillates around the exact gradient direction and, on average, the algorithm implements a form of descent in the error function.
The rationale for using on-line training is that adding some noise to the gradient direction can help to avoid falling into shallow local minima of the error function. Also, when the training set consists of thousands of training patterns, it is very expensive to compute the exact gradient direction since each epoch (one round of presentation of all patterns to the network) consists of many feed-forward passes and on-line training becomes more efficient.

Extended Network for Backpropagation Algorithm 183 5. ERROR DURING TRAINING Figure 5 shows the evolution of the total error during training of a network of three computing units.
After 600 iterations the algorithm found a solution to the learning problem. In the figure the error falls fast at the beginning and end of training. Between these two zones lies a region in which the error function seems to be almost flat and where progress is slow. This corresponds to a region which would be totally flat if step functions were used as activation functions of the units. Now, using the sigmoid, this region presents a small slope in the direction of the global minimum.
Figure 5. Error function for 600 iterations of backpropagation 6. CONCLUSIONS The Back-propagation Neural Network (BPNN) is a supervised learning neural network model highly applied in different engineering fields around the globe. Although it is widely implemented in the most practical ANN applications and performed relatively well, it is suffering from a problem of slow convergence and convergence to local minima. This makes Artificial Neural Network’s application very challenging when dealing with large problems.
One of the lessons learned over the past years is that significant improvements in the approximation capabilities of neural networks will only be obtained through the use of modularized networks. In the future, more complex learning algorithms will deal not only with the problem of determining the network parameters, but also with the problem of adapting the network topology.

184 Petrini, M. REFERENCES: [1]. Albrecht, R.F.; Reeves, C.R.; Steele, N.C. (1993) Artificial Neural Nets and Genetic
Algorithms, Springer-Verlag, Vienna [2]. Kosbatwar, S.P.; Pathan, S.K. (2012) Pattern Association for character recognition by
Back-Propagation algorithm using Neural Network approach, (IJCSES) Vol.3, No.1, February
[3]. Rajapandian, J.V.V.; Gunaseeli, N. (2007) Modified Standard Backpropagation Algorithm With Optimum Initialization For Feedforward Neural Networks” JISE, GA, USA, ISSN:1934-9955, vol.1, no.3
[4]. Rehman, M.Z.; Nawi, N.M.; Ghazali, M.I. (2011) Noise-Induced Hearing Loss (NIHL) Prediction in Humans Using a Modified Back Propagation Neural Network, in: 2nd International Conference on Science Engineering and Technology, pp. 185--189
[5]. Schiffmann, W.; Joost, M.; Werner, R. (1933) Comparison of Optimized Backpropagation Algorithms, in: M. Verleysen (ed.), European Symposium on Artificial Neural Networks, Brussels, pp. 97–104
[6]. Zweiri, Y.H.; Seneviratne, L.D.; Althoefer, K. (2005) Stability Analysis of a Three-term Back-propagation Algorithm, J. Neural Networks. 18, 1341-1347

Annals of the University of Petroşani, Economics, 12(4), 2012, 185-192 185
IMPROVEMENTS TO THE BACKPROPAGATION ALGORITHM
MIRCEA PETRINI *
ABSTACT: This paper presents some simple techniques to improve the backpropagation algorithm. Since learning in neural networks is an NP-complete problem and since traditional gradient descent methods are rather slow, many alternatives have been tried in order to accelerate convergence. Some of the proposed methods are mutually compatible and a combination of them normally works better than each method alone.
KEYWORDS: Artificial Neural Network (ANN), backpropagation, extended network
JEL CLASSIFICATION: C 1. INTRODUCTION Artificial Neural Networks (ANNs) are logical methods modeled on the learning processes of human brain. Artificial Neural Networks (ANNs) works by processing information like biological neurons in the brain and consists of small processing units known as Artificial Neurons, which can be trained to perform complex calculations. As human being, we learn how to write, read, understand speech, recognize and distinguish pattern – all by learning from examples. In the same way, ANNs are trained rather than programmed. The traditional Backpropagation Neural Network (BPNN) Algorithm is widely used in solving many practical problems. The BPNN learns by calculating the errors of the output layer to find the errors in the hidden layers. Due to this ability of Back-Propagating, it is highly suitable for problems in which no relationship is found between the output and inputs. Due to its flexibility and learning capabilities, it has been successfully implemented in wide range of applications.
A Backpropagation network consists of at least three layers of units: an input layer, at least one intermediate hidden layer, and an output layer. Typically, units are
* Lecturer, University of Petroşani, Romania, [email protected]

186 Petrini, M. connected in a feed-forward fashion with input units fully connected to units in the hidden layer and hidden units fully connected to units in the output layer.
Backpropagation Neural Network algorithm is the most popular and the oldest supervised learning multilayer feed-forward neural network algorithm proposed by Rumelhart, Hinton and Williams (Rumelhart, et al., 1986). 2. INITIAL WEIGHT SELECTION A well-known initialization heuristic for a feed-forward network with sigmoidal units is to select its weights with uniform probability from an interval [−α,α]. The zero mean of the weights leads to an expected zero value of the total input to each node in the network. Since the derivative of the sigmoid at each node reaches its maximum value of 1/4 with exactly this input, this should lead in principle to a larger backpropagated error and to more significant weight updates when training starts. However, if the weights in the networks are very small (or all zero) the backpropagated error from the output to the hidden layer is also very small (or zero) and practically no weight adjustment takes place between input and hidden layer. Very small values of α paralyze learning, whereas very large values can lead to saturation of the nodes in the network and to flat zones of the error function in which, again, learning is very slow. Learning then stops at a suboptimal local minimum (Lisboa & Perantonis, 1991). Therefore it is natural to ask what is the best range of values for α in terms of the learning speed of the network.
Some authors have conducted empirical comparisons of the values for α and have found a range in which convergence is best (Wessels & Barnard, 1992). The main problem with these results is that they were obtained from a limited set of examples and the relation between learning step and weight initialization was not considered. Others have studied the percentage of nodes in a network which become paralyzed during training and have sought to minimize it with the “best” α (Drago & Ridella, 1992). Their empirical results show, nevertheless, that there is not a single α which works best, but a very broad range of values with basically the same convergence efficiency. 2.1. Maximizing the derivatives at the nodes Let us first consider the case of an output node. If n different edges with associated weights point to this node, then after selecting weights with uniform probability from the interval the expected total input to the node is
where is the input values transported through each edge. We have assumed that these inputs and the initial weights are not correlated. By the law of large numbers we can also assume that the total input to the node has a Gaussian distribution Numerical integration shows that the expected value of the derivative is a decreasing

Improvements to the Backpropagation Algorithm 187 function of the standard deviation . The expected value falls slowly with an increase of the variance. For = 0 the expected value is 0.25 and for = 4 it is still 0.12, that is, almost half as big. The variance of the total input to a node is
since inputs and weights are uncorrelated. If n = 100, selecting weights randomly from the interval [−1.2, 1.2] leads to a variance of 4 at the input of a node with 100 connections and to an expected value of the derivative equal to 0.12. Therefore in small networks, in which the maximum input to each node comes from fewer than 100 edges, the expected value of the derivative is not very sensitive to the width α of the random interval, when α is small enough. 2.2. Maximizing the backpropagated error In order to make corrections to the weights in the first block of weights (those between input and hidden layer) easier, the backpropagated error should be as large as possible. Very small weights between hidden and output nodes lead to a very small backpropagated error, and this in turn to insufficient corrections to the weights. In a network with m nodes in the hidden layer and k nodes in the output layer, each hidden node h receives a backpropagated input h from the k output nodes, equal to
where the weights whi, are the ones associated with the edges from hidden node h to output node i, si
’ is the sigmoid derivative at the output node i, and i0 is the difference
between output and target also at this node. After initialization of the network’s weights the expected value of h is zero. In
the first phase of learning we are interested in breaking the symmetry of the hidden nodes. They should specialize in the recognition of different features of the input. By making the variance of the backpropagated error larger, each hidden node gets a greater chance of pulling apart from its neighbors. The above equation shows that by making the initialization interval [−α, α] wider, two contradictory forces come into play. On the one hand, the variance of the weights becomes larger, but on the other hand, the expected value of the derivative s0
k becomes lower. We would like to make h as large as possible, but without making si
’ too low, since weight corrections in the second block of weights are proportional to si
’. Figure 1 shows the expected values of the derivative at the output nodes, the expected value of the backpropagated error for the hidden nodes as a function of α, and the geometric mean of both values.

188 Petrini, M.
Figure 1. Expected values of the backpropagated error
The figure shows, again, that the expected value of the sigmoid derivative falls slowly with an increasing α, but the value of the backpropagated error is sensitive to small values of α. In the case shown in the figure, any possible choice of α between 0.5 and 1.5 should lead to virtually the same performance. This explains the flat region of possible values for α found in the experiments published in Wessels & Barnard (1992) and Drago & Ridella (1992). Consequently, the best values for α depend on the exact number of input, hidden, and output units, but the learning algorithm should not be very sensitive to the exact α chosen from a certain range of values. 3. CLIPPED DERIVATIVES
One of the factors which lead to slow convergence of gradient descent methods is the small absolute value of the partial derivatives of the error function computed by backpropagation. The derivatives of the sigmoid stored at the computing units can easily approach values near to zero and since several of them can be multiplied in the backpropagation step, the length of the gradient can become too small. A solution to this problem is clipping the derivative of the sigmoid, so that it can never become smaller than a predefined value. We could demand, for example, that . In this case the “derivatives” stored in the computing units do not correspond exactly to the actual derivative of the sigmoid (except in the regions where the derivative is not too small). However, the partial derivatives have the correct sign and the gradient direction is not significantly affected.
It is also possible to add a small constant " to the derivative and use for the backpropagation step. The net effect of an offset value for the sigmoid derivative is to pull the iteration process out of flat regions of the error function. Once this has happened, backpropagation continues iterating with the exact gradient direction.
It has been shown in many different learning experiments that this kind of heuristic, proposed by Fahlman (1989), among others, can contribute significantly to

Improvements to the Backpropagation Algorithm 189 accelerate several different variants of the standard backpropagation method (Pfister & Rojas, 1993). Note that the offset term can be implemented very easily when the sigmoid is not computed at the nodes but only read from a table of function values.
The table of derivatives can combine clipping of the sigmoid values with the addition of an offset term, to enhance the values used in the backpropagation step. 4. REDUCING THE NUMBER OF FLOATING-POINT OPERATIONS Backpropagation is an expensive algorithm because a straightforward implementation is based on floating-point operations. Since all values between 0 and 1 are used, problems of precision and stability arise which are normally avoided by using 32-bit or 64-bit floating-point arithmetic. There are several possibilities to reduce the number of floating-point operations needed. 4.1. Avoiding the computation of the squashing function If the nonlinear function used at each unit is a sigmoid or the hyperbolic tangent, then an exponential function has to be computed and this requires a sequence of floating-point operations. However, computation of the nonlinearity can be avoided by using tables stored at each unit, in which for an interval in the real line the corresponding approximation to the sigmoid is stored. A piecewise linear approximation can be used as shown in figure 2, so that the output of the unit is
when and where and Computation of the nonlinear function is reduced in this way to a
comparison, a table lookup, and an interpolation. Another table holding some values of the sigmoid derivative can be stored at each unit for the backpropagation step. A piecewise linear approximation can also be used in this case. This strategy is used in chips for neural computation in order to avoid using many logic gates.
Figure 2. Piecewise linear approximation to the sigmoid

190 Petrini, M. 4.2. Avoiding the nonlinear function at the output
In some cases the sigmoid at the output of the network can be eliminated. If the output vectors in the training set are m-dimensional vectors of the form
with 0 < ti < 1 for then a new training set can be defined with the same input vectors and output vectors of the form , where the function s−1 is the inverse of the sigmoid. The sigmoid is eliminated from the output units and the network is trained with standard backpropagation. This strategy will save some operations but its applicability depends on the problem, since the sigmoid is equivalent to a kind of weighting of the output error. The inputs 100 or 1000 produce almost the same sigmoid output, but the two numbers are very different when compared directly. 4.3. Fixed-point arithmetic Since integer operations can be executed in many processors faster than floating-point operations, and since the outputs of the computing units are values in the interval (0,1) or (−1,1), it is possible to adopt a fixed-point representation and perform all necessary operations with integers. By convention we can define the last 12 bits of a number as its fractional part and the three previous bits as its integer part. Using a sign bit it is possible to represent numbers in the interval (−8,8) with a precision of . Care has to be taken to re-encode the input and output vectors, to define the tables for the sigmoid and its derivatives and to implement the correct arithmetic (which requires a shift after multiplications and tests to avoid overflow). Most of the more popular neural chips implement some form of fixed-point arithmetic. Some experiments show that in many applications it is enough to reserve 16 bits for the weights and 8 for the coding of the outputs, without affecting the convergence of the learning algorithm (Asanovic & Morgan, 1991). Holt and Baker compared the results produced by networks with floating-point and fixed-point parameters using the Carnegie-Mellon benchmarks (Holt & Baker, 1991). Their results confirmed that a combination of 16-bit and 8-bit coding produces good results. In four of five benchmarks the result of the comparison was “excellent” for fixed-point arithmetic and in the other case “good”.
Based on these results, groups developing neural computers like the CNAPS of Adaptive Solutions (Hammerstrom, 1990) and SPERT in Berkeley (Asanovic, et al., 1992) decided to stick to 16-bit and 8-bit representations. Reyneri and Filippi (1991) did more extensive experimentation on this problem and arrived at the conclusion that the necessary word length of the representation depends on the learning constant and the kind of learning algorithm used. This was essentially confirmed by the experiments done by Pfisteron a fixed-point neurocomputer (Pfister, 1995). Standard backpropagation can diverge in some cases when the fixed-point representation includes less than 16 bits. However, modifying the learning algorithm and adapting the learning constant reduced the necessary word length to 14 bits. With the modified algorithm 16 bits were more than enough.

Improvements to the Backpropagation Algorithm 191 5. DATA DECORRELATION If the principal axes of the quadratic approximation of the error function are too dissimilar, gradient descent can be slowed down arbitrarily. The solution lies in decorrelating the data set and there is now ample evidence that this preconditioning step is beneficial for the learning algorithm (Holt & Baker, 1991; Silva & Almeida, 1991). One simple decorrelation strategy consists in using bipolar vectors. We know that the solution regions defined by bipolar data for perceptron are more symmetrically distributed than when binary vectors are used. The same holds for multilayer networks. Pfister showed that convergence of the standard backpropagation algorithm can be improved and that a speedup between 1.91 and 3.53 can be achieved when training networks for several small benchmarks (parity and clustering problems) (Pfister, 1995). The exceptions to this general result are encoded-decode problems in which the data consists of sparse vectors (n-dimensional vectors with a single 1 in a component). In this case binary coding helps to focus on the corrections needed for the relevant weights. But if the data consists of non-sparse vectors, bipolar coding usually works better. If the input data consists of N real vectors it is usually helpful to center the data around the origin by subtracting the centroid of the distribution, in such a way that the new input data consists of the vectors . Silva and Almeida have proposed another data decorrelation technique, called Adaptive Data Decorrelation, which they use to precondition data (Silva & Almeida, 1991). A linear layer is used to transform the input vectors, and another to transform the outputs of the hidden units. The linear layer consists of as many output as input units, that is, it only applies a linear transformation to the vectors. Consider an n-
dimensional input vector . Denote the output of the linear layer by . The objective is to make the expected value of the correlation coefficient rij of the i and j output units equal to Kronecker’s delta ,
The expected value is computed over all vectors in the data set. 6. CONCLUSION
The Backpropagation Neural Network (BPNN) is a supervised learning neural network model highly applied in different engineering fields around the globe. Although it is widely implemented in the most practical ANN applications and performed relatively well, it is suffering from a problem of slow convergence and convergence to local minima. This makes Artificial Neural Network’s application very challenging when dealing with large problems. From this paper we can conclude that even though several variations to this algorithm have been suggested to improve the performance of BPNN, no one guarantees global optimum solution which is still need to be answered.
192 Petrini, M. REFERENCES: [1]. Asanovic, K.; Beck, J.; Kingsbury, B. (1992) SPERT: A VLIW/SIMD
Microprocessor for Artificial Neural Network Computations, International Computer Science Institute, Technical Report, TR–91-072, Berkeley, CA
[2]. Asanovic, K.; Morgan, N. (1991) Experimental Determination of Precision Requirements for Back-Propagation Training of Artificial Neural Networks, International Computer Science Institute, Technical Report TR–91-036, Berkeley, CA
[3]. Drago, G.P.; Ridella, S. (1992) Statistically Controlled Activation Weight Initialization (SCAWI), IEEE Transactions on Neural Networks, Vol. 3, No. 4, pp. 627–631
[4]. Fahlman, S. (1989) Faster Learning Variations on Back-Propagation: An Empirical Study, in Touretzky et al. 1989, pp. 38–51
[5]. Hammerstrom, D. (1990) A VLSI Architecture for High-Performance, Low- Cost, On-Chip Learning, in IEEE 1990, Vol. II, pp. 537–544
[6]. Holt, J.; Baker, T. (1991) Back Propagation Simulations Using Limited Precision Calculations, in IEEE 1991, Vol. II, pp. 121–126
[7]. Lisboa, P.G.; Perantonis, S.J. (1991) Complete Solution of the Local Minima in the XOR Problem, Network – Computation in Neural Systems, Vol. 2, No. 1, pp. 119–124
[8]. Pfister, M. (1995) Hybrid Learning Algorithms for Neural Networks, PhD Thesis, Free University Berlin
[9]. Pfister, M.; Rojas, R. (1993) Speeding-up Backpropagation – A Comparison of Orthogonal Techniques, International Joint Conference on Neural Networks, Nagoya, Japan, pp. 517–523
[10]. Reyneri, L.; Filippi, E. (1991) An Analysis on the Performance of Silicon Implementations of Backpropagation Algorithms for Artificial Neural Networks, IEEE Transactions on Computers, Vol. 40, No. 12, pp. 1380–1389
[11]. Rumelhart, D.E.; Hinton, G.E.; Williams, R.J. (1986) Learning Internal Representations by error Propagation, J. Parallel Distributed Processing: Explorations in the Microstructure of Cognition
[12]. Silva, F.; Almeida, L. (1991) Speeding-up Backpropagation by Data Orthonormalization, in Kohonen et al. 1991, pp. 1503–1506
[13]. Wessels, L.; Barnard, E. (1992) Avoiding False Local Minima by Proper Initialization of Connections, IEEE Transactions on Neural Networks, Vol. 3, No. 6, pp. 899–905

Annals of the University of Petroşani, Economics, 12(4), 2012, 193-202 193
RETURN MIGRATION – REASONS, CONSEQUENCES AND BENEFITS
RAMONA PÎRVU, GHEORGHE AXINTE *
ABSTRACT: Return migration is probably the aspect of the migration cycle, which was granted the lowest attention, perhaps because most research resources are located in highly developed countries, while most of the returning most returnees return to developing countries.. This is especially unfortunate because perceptions about the process of returning to the country of origin and attitudes towards returning migrants have a significant impact on migrants and their host communities. Rollback, sometimes called remigration, is considered by some authors as the final stage of the migration process, which further comprises the step preparation / decision to migrate and actual migration phase or installation of migrant destination country selected. KEY WORDS: international migration; employment; return migration; remittances. JEL CLASSIFICATION: J21; J08; J64. 1. INTRODUCTION
In the context of transnationalism paradigm in the study of migration, the
return is no longer regarded as a last step of a linear process because migrants prepare this stage through numerous visits and financial and social remittances (Vlase I., 2011).
Decisions to migrate or to return permanently to their home country are not taken at the individual level but at the level of domestic groups or families, although the reasons for those members may be diverse, sometimes conflicting. But empirical studies show that reintegration in the country of origin is not exactly a smooth one. In reality, migrants are not always aware of the rapid changes that can let them know their society of origin, even under intense communication with other family members or community of origin. On the other hand, the migrant returned home after 10 or 20 years of residence in another country is not the same as the person who left the country * Assoc. Prof. Ph.D., Faculty of Economics and Business Administration, Economy Department, University of Craiova, Romania, [email protected] Lecturer Ph.D., University of Pitesti, Romania, [email protected]

194 Pîrvu, R.; Axinte, G. at that time, his expectations and those of the company to him can be completely different (Vlase, 2011).
Faini (Faini, 2002) believes that migrants can be encouraged to study abroad for improve training quality and employability. Not all migrants remain in the receiving countries forever, nor do they necessarily cross over great periods of time. They can return, bringing with them experience and entrepreneurial spirit (Ratha, 2003). 2. CURRENT DEVELOPMENTS AND THE CHARACTERISTICS OF THE PHENOMENON OF MIGRATION FOR EMPLOYMENT
In the context of transnationalism paradigm in the study of migration, the
return is no longer regarded as a last step of a linear process because migrants prepare this stage through numerous visits and financial and social remittances (Vlase, 2011).
Decisions to migrate or to return permanently to their home country are not taken at the individual level but at the level of domestic groups or families, although the reasons for those members may be diverse, sometimes conflicting. But empirical studies show that reintegration in the country of origin is not exactly a smooth one. In reality, migrants are not always aware of the rapid changes that can let them know their society of origin, even under intense communication with other family members or community of origin. On the other hand, the migrant returned home after 10 or 20 years of residence in another country is not the same as the person who left the country at that time, his expectations and those of the company to him can be completely different.
Faini (Faini, 2002), believes that migrants can be encouraged to study abroad for improve training quality and employability. Not all migrants remain in the receiving countries forever, nor do they necessarily cross over great periods of time. They can return, bringing with them experience and entrepreneurial spirit (Ratha, 2003). We consider two types of questionable effects associated with return migration. The first is related to the increase of income which the experience of working abroad brings to the migrant. Thus, it must be assessed whether the income which the migrant has the ability to obtain after return, on the basis of new skills acquired abroad, are greater than those carried out by similar workers, who have not experienced the work abroad. The second concerns the professional choices that the migrants make when they return to their country of origin, by bringing a greater inclination towards independence and the development of small enterprises of the repatriated migrants than non-migrants.
Work experience abroad is an important aspect in the reintegration in the country. It depends on the accumulation of specific skills, abilities, and knowledge that can help, or hinder access to the labor market of the country of origin. Work experience is relevant in our case, both in terms of duration and type of skill or new skills (Vlase, 2011).
Remaining migrants abroad have succeeded in a significantly greater proportion than returned migrants to enter the labor market in Romania before the first departure. Almost half (48%) of the people that came back (compared with 38% of the remaining migrants) have left Romania without trying or not being able to enter the

Return Migration – Reasons, Consequences and Benefits 195 labor market in the country. Most have found work abroad, but given the lack of experience and qualifications, in terms of labor market in contraction, have entered the most vulnerable positions.
As a general rule, returning emigrants who have achieved financial success abroad are seen favorable and can even acquire a role model status. On the other hand, those who return home having failed in an attempt of employment and residence abroad may be made to feel that they have not fulfilled the expectations of family and friends. Perceptions are nuanced by their voluntary or involuntary return (IOM, 2011).
At the destination Romanian migrants are employed most often in the secondary sector. In the absence of institutional support, informal migration networks took over the responsibility for the integration of migrants in the host country, favoring the secondary sector employment, but offering limited possibilities of occupational mobility. The modest social status abroad opens opportunities for social ascent in the community of origin, where they spend/invest the savings from migration and remittances.
The recession has affected all sectors of the economy, and especially those areas in which the migrants worked, whether they were workers from the EU or not.
Among the remaining migrants abroad and those returning to the country during the economic crisis, there are some significant differences, which indicates that the remaining migrants were still at the first departure from the country better qualified, better prepared to adapt to the demands of the labor market from abroad. The return of the Romanians is a recent phenomenon, but it already occurs differently depending on gender, age, occupational skills, social and economic capital transferable in the community of origin. For understanding the behavior of return of migrants and sustainability projects for reintegration in the country of origin is important a historical analysis of the phenomenon of migration of that community. Romania is still a country with a recent history of emigration, in contrast to other countries where there are such studies (Vlase, 2011).
Migration has many positive effects, such as a style and a better standard of living, and a relationship of quality in relation to public institutions, access to education, to new values and social and cultural practices that promote openness, equal opportunities and a new understanding of the relationship between the sexes.
A study of Soros Foundation (Migration and development) appreciates the positive effects of local economic development, stimulating entrepreneurship and increased tolerance in areas with high migration index and migration associated negative effects such as dependence to income from migration, abandoned children, human trafficking (Soros Foundation, 2010).
In principle, the tastes and motives of migrants suffer changes as a result of the experience in developed industrial countries. Individuals acquire the "habit" of a lifestyle, including consumption that are difficult to support in the country of origin on their return increasing the likelihood of re-turns in the previously destination space. In this respect, it is clear that does not increase the likelihood of migration of other individuals but that of those with migration experience. In the new economy of migration explanation could be considered as a permanent risk reduction strategy of the household income in circumstances where the economic situation does not improve at

196 Pîrvu, R.; Axinte, G. the destination in order to obtain incomes comparable to those from abroad (Ailenei). Return migration contributes to local development even more than remittances. Remittances are used largely for consumption, while the savings, that often are a prerequisite for the purpose of return migration, are rather used for productive activities. The savings reinvested and entrepreneurial activities of migrants returning home can be a real and important benefit of migration.
At the same time we appreciate that there is a certain intellectual gain as a result of migration; a number of migrants have achieved qualifications or have developed knowledge of new technologies while working abroad.
In certain circumstances migration may be favorable to the formation of human capital. Indeed the Governments of certain countries are perhaps less apprehensive about this migration of brain drain than the literature suggests. The lack of job opportunities for graduates means that migration can be seen as a political and economic strategy. Stark (Stark, 2005), claims that migration policy can limit the strategic use and behavioral response to the concept of migration for the benefit of all workers.
Many migrants ' skills and experience gained abroad did not help to find a better work at home, especially because they have worked in areas other than those for which they have qualified in their home country. Rarely migrants find their jobs in the same sector in which they worked abroad. Other migrants have acquired new skills or knowledge. Failure to integrate into the job market in the home country, as well as poor infrastructure, especially in rural areas, have become motivating factors (push factors) to continue the migration (CIVIS, IASCI, 2010)..
In general the Romanians demonstrate a strong desire to return home and to reside permanently in their country of origin. No matter how hard they worked or how long they stayed abroad, many migrants feel strangers in the land of migration. Returning home is subject to a number of factors. The most important and the most often mentioned are the following: A secure and well paid job; Economic, political, environmental and social best in country; Achieving the objectives of making savings through migration and the ability to
save data; The continuation of the global economic crisis; Other factors: homesickness, relatives, health, etc.
The period 2008-2010 becomes the subject of the discussion centered on the idea of return migration – economic and financial crisis being intended as a cause of such a circular phenomenon. The reality is, however, another, delaying the return migration to manifest as a spectacular phenomenon, Romanian labor migrants defying the logic of this narrowing of all labor markets. In the opinion of an expert, a representative of an institution of state, expressed in an interview aired by mass-media, there seems to be a crisis, no matter how tough it will be less harsh in a rich country than in a poorer country. Intuitively, without substantiation of claims statement on statistical data, the statistician expert seems to be right: “reverse migration”, return migration, delay to occur (Soros Foundation, 2011).
At the same time it is a plausible the hypothesis that through superior capacity for integration in the country of destination, the characteristics of social worlds they

Return Migration – Reasons, Consequences and Benefits 197 carry with them (different from those of the migrants with secondary education, for example), migration for work, even temporary at first , can form the final migration, because „depending on the duration of residence and forms of incorporation in destination companies we can distinguish several layers of Romanian diaspora recently emigrated. On the one hand, there are those for whom migration has meant a possibility of mobility not only spatial, but also an increase in their social status: high qualified specialists, small entrepreneurs, workers employed in various formal and integrated systems and social protection schemes. They, as a rule, are not only legal residents of the respective countries but they reunited families, and have developed linguistic and cultural skills, interacting with the states in which they live. Long-term, they don't exclude returning to the country, but in the medium term they strengthen their roots in countries of emigration (Horvath, 2011).
The period 2008-2010 generated in Romania concerns and discussions of public policy related to return migration – economic and financial crisis being intended as a cause of such circulatory phenomenon. As is evident from the interviews conducted in the empirical research, experts from the Romanian system of migration management have denied in the autumn of 2009 such a comeback. Their arguments are simple: „if he has legal work permit he has no reason to return, because he has welfare benefits abroad, at shares which Romania cannot enjoy; if he does not have a legal work permit, he rather find work there than in Romania, in order to meet the needs of survival.” Indeed, the phenomenon of massive return of the Romanians gone to work abroad hasn’t occurred. Migration rollback does not manifest itself as a spectacular phenomenon, Romanian labor migrants defying the logic of this all compactions of labor markets in the EU. Intuitively, without substantiation of claims statement on statistical data, the statistician expert seems to be right: “reverse migration”, return migration, delay to occur.
The labor market in Romania is not overpopulated with a new generation of unemployed coming from return migration, in addition to the generation of unemployed produced by the national crisis in Romania. Such overpopulation through massive return migration at a number of nearly three millions of Romanians working abroad would have created an unbearable social pressure at the national level (Soros Foundation, 2011).
The return of the Romanians is a recent phenomenon, already occurs differently depending on gender, age, skills, social and economic capital transferable in the community of origin. For understanding the behavior of return of migrants and sustainability projects for reintegration in the country of origin is important a historical analysis of the phenomenon of migration of that community. Romania is still a country with a recent history of emigration, in contrast to other countries where there are such studies (Vlase, 2011).
The highest values of emigration (recorded) in Romania were between 1990-1995 and in particular in the 1990-1991. The first wave of emigrants from 1990-1995 had an ethnic character, most emigrants were from villages and towns with a high proportion of ethnic minorities. A massive migration occurred among the Saxons and Jews and lower among the Hungarian population. For example, the Saxons in Braşov and Sibiu emigrated to Germany, Hungarians from Harghita, Covasna and Mureş in

198 Pîrvu, R.; Axinte, G. Hungary, and Jews in Israel. Ethnic emigration was so the first wave of migration from Romania, which had begun even before 1989 and which continued for several years after the revolution, with those who do not managed to leave. Since 1995 started the second wave of emigration and now the new forms of emigration are: emigration through mobility scholarships for students, emigration of labor, emigration affairs, the export of "brain drain" and migration to other former Communist countries for which there was no need of visas. Students begin to migrate through the mobility programmers offered by Soros Foundation, Fulbright, IREX or through individual applications to colleges in the U.S., and after graduation some of them decide not to return to Romania. On the other hand, many faculties and U.S. companies are interested in students or graduates with good results in terms of technical and thus begins the export of "brains". In 1995, one can observe an increase in the number of arrivals up to 25765 but after this year, there has been a decrease in the value continuing until 8154 immigrants in 2002.
In 2002, begins the third wave of emigration, the number of emigrants grow again until 14197 in 2006 and working abroad becomes a mass phenomenon with a rate of migration between 10-30%. Initially, in the first stage, departures were conducted overwhelmingly by men (88%), subsequently the process goes in the direction of establishing a gender ratio, so after 2001, departures of men compared with those of women are 55% and 45% respectively. After the first wave of emigration was triggered foreign labor migration, which has the largest share of all forms of emigration, its direction is variable over time depending on the facilities or the obstacles raised by the various Western States that were presented as potential receiving countries. How migration has encountered restrictions on the part of Western countries, this phenomenon has grown more and more to the informal side. Only through the year 2002 Romanian immigrants begin to break into the labour market legally. According to data provided by the National Institute of statistics of Romania permanent emigration had the following trails
in the first phase, 1990-1995, the main destinations where Romanians have emigrated permanently are Italy, Hungary, Austria and the USA followed;
in the second stage, from 1996 to 2001, the main destinations where Romanians have emigrated permanently are Italy, USA, Canada, followed by France, Israel, Hungary;
in the third stage, 2002-2007, main destinations where Romanians have emigrated are Canada, Germany followed by Italy and the USA. According to the study conducted by the Open Society Foundation
"Temporary dwelling abroad" in November 2006, the directions of emigration for work abroad, temporary emigration, has changed over time and were given the following trails. In the early 1990s, Israel and Turkey were the main centers of attraction to work. Italy, Germany and Hungary were second rank destinations. Nearly one-fifth of the total departures for work during the period 1990-1995 were to Israel. Subsequently, in 1996-2001, Italy becomes leader of the Romanians who want to work abroad. Israel passes on second place in the order of preference in that period. In the third period, beginning with 2002, the hierarchy is changing again. Maximum attraction is towards Italy and Spain. Departures (not departees) to Italy, at that time, holding a share of

Return Migration – Reasons, Consequences and Benefits 199 50%. For Spain, the departure was 25%. Romanian roads to look for work in the world (especially Europe) are going to focus to a small number of countries, not linear, but after a phase of expansion of search: • in the first phase, 1990-1995, there were five destinations with over 7% share of
the total departures-Israel, Turkey, Italy, Hungary and Germany; • in stage two, 1996-2002, to the five countries from the first stage plus Canada and
Spain. Exploration extends to the farthest to the European continent and to America;
• in the third phase, starting in 2002, there is a massive concentration of temporary migration for work in Spain and Italy.
Table 1. Romanian emigrants who have established domicile abroad, by sex
2006 2007 2008 2009 2010 2011
Total 14197 8830 8739 10211 7906 18307 Male 5341 3088 3069 3768 2917 8527 Female 8856 5742 5670 6443 4989 9780
Source: The National Commission of statistics, Statistical Yearbook of Romania, 2012, p.76-78
Table 2. Romanian emigrants after the country of destination, which have established domicile abroad
2006 2007 2008 2009 2010 2011
Total 14197 8830 8739 10211 7906 18307 By country of destination Australia 125 83 82 128 81 112 Austria 581 313 345 421 569 1089 Belgium 59 34 35 70 46 129 Canada 1655 1787 1738 2045 858 967 France 529 372 431 576 405 663 Germany 3110 1902 1788 1938 1399 2014 Greece 134 72 85 124 133 160 Jordan 26 21 23 21 16 139 Israel 128 57 50 111 62 2857 Italy 3393 1401 1098 984 844 1906 United Kingdom 227 71 130 211 264 251 The Republic of Moldova
112 149 189 217 349 254
Spain 330 138 238 547 882 3352 USA. 1982 1535 1591 1793 1086 1350 Hungary 900 266 354 331 266 514 Other countries 906 629 562 694 646 2550
Source: The National Commission of statistics, Statistical Yearbook of Romania, 2012, p.76-78

200 Pîrvu, R.; Axinte, G.
After testing the life and working conditions from multiple destinations, Romanians decide in particular to two Latin speaking countries, Italy and Spain. The changes between the stages are not only in the field of migration. The volume of departures changes also.
Current developments and the characteristics of the phenomenon of migration for employment after entering the EU on 1 January 2007, provides an opportunity to discuss a fourth wave of Romanian migration in good measure as migration for work. This wave of migration for employment has as a feature for mobility of professionals in the context of economic and financial crisis, which seems to set the migration of highly skilled and qualified personnel for the job.
The analyses show that Romania's accession to the EU did not bring, at first, changes within the phenomenon of migration. Initially, only 11 Member States opened borders for labor migration altogether, while others imposed various types of temporary restrictions (between 2-7 years). At this point, a number of 15 countries recognize the right of Romanian migrants to work in the labor market, given that we know that, for a period of three years, the number of workers with legal right to work in the labor market of the countries of the EU has grown from 1.2 million (in mid-2007) to 2.5-2.7 million workers with legal right in June-July 2010. The period 2008-2010 generated in Romania concerns and discussions of public policy related to return migration – economic and financial crisis being intended as a cause of such circulatory phenomenon.
Is recognized in the scientific literature the beneficial impact over the countries of origin of the return of skilled migrants – with work experience, skills, savings and contacts accumulated abroad. If the return of migrants cannot be easily influenced, such decisions depending on the existence of professional opportunities, the quality of institutions, infrastructures and, last but not least, family situation, then the temporary return of migrants can be encouraged through specific policies and programmers (Berlinschi & Clipa, 2012). 3. CONCLUSION
It was noted that migrants in the EU when they lose their job, they are more
inclined to return to their countries of origin. This comeback is mostly temporary, strategy aimed at returning migrants in the destination country in case of economic opportunities and the emergence of a labor market recovery. On the other hand, migrants from outside the EU prefer to remain in countries of destination, even if they lose their jobs. This decision is due to the difficulties of obtaining visas or work permits, administrative barriers, costs and lack of alternatives related to re-entry in the host country. In addition, it adds the often high travel costs, the fact that the survival of the remaining family home depends on the money sent by the migrant or the total lack of horizon in the country of origin, where the crisis puts even more trouble (Stoiciu, 2011).
It is known that, after a period spent working abroad, migrants can reach all or part of the objectives of the migration and then the propensity to returns higher. It is quite possible that in fact we are dealing with a temporary comeback. Also, should be

Return Migration – Reasons, Consequences and Benefits 201 taken into account the hypothesis according to which the crisis may be more tolerable in countries of destination than in the countries of origin in circumstances where neither locally nor at the country level there are no targeted measures aimed at facilitating the return and the Romanians leave to work abroad, in the context of the lack of public policies that are supported by these and Romania does not have a strategy regarding labor migration/mobility of labor within the European area and to capture the benefits of migration and to maximize the impact that migration has in the development of communities of origin of the migrants, we consider that further consideration will prevail in the decision to return to Romanian.
This category of migrants – affected by the crisis, but without the necessary resources to return to Romania-and whose return is most often temporary and which is prone to a variety of cyclical migration, oscillating between the host country and the country of origin is different, also temporary, comeback is returning to Romania for the period in which the migrant is receiving unemployment allowance in the destination country. This range enables a migrant to try their luck in Romania and to test the local labor market and to cover their costs of living from the unemployment money. The chances of returning to the country of destination after expiry of the period of unemployment benefits are reduced if the former migrant manages to find a satisfactory job in Romania. As a rule, however, migrants who get in unemployment or who lose work prefer to combine the livelihood of unemployment welfare with illegal work or temporary jobs.
Regarding the differences between workers of EU migrants/and those outside the EU, in the case of the first category there is the inclination to return to their countries of origin when they lose their job, this comeback has mainly temporary a nature, the strategy for the return of migrants, in the country of destination in case of arising of economic opportunities or a comeback of the labor market. Representatives of the second group prefer to remain in countries of destination, even if they lose their jobs, this decision is motivated by difficulties in obtaining visas or work permits and other administrative barriers related to re-entry into the host country, the high costs of travel and the inability to earn a living for themselves and their families back in their country where the crisis is even more serious. REFERENCES:
1. Ailenei, D. (coord.) The diminution of inequalities – a prerequisite for the economic and
social cohesion, research project PN II, phase 3, p. 35 2. Beine, M.; Docquier, F.; Rapoport, H. (2006) Measuring Internațional Skilled Migrațion:
New Estimates Controlling for Age of Entry, World Bank Research Report 3. Berlinschi, R.; Clipa, V. (2012) Migrations, remittances and development: a few ideas in
the recent literature and recommendations in the case of the Republic of Moldova, no. 1(24), March
4. Birks, I.S.; Sinclair, C.A. (2009) International Migrațion and development, .I.L.O. , Geneva
5. Buziernescu, R.; Nanu, R.; Spulbar, C. (2009) Methods and estimation models of underground economy, Anale, Seria Științe Economice, Timișoara

202 Pîrvu, R.; Axinte, G. 6. David, M. (2008) The underground economy and money laundering - criminological study,
Pro Universitaria Press 7. Faini, R. (2002) Migration, remittances and growth, www.wider.unu.edu/conference 8. Hara, A. (2006) Skill Difusión by Temporary Migrațion? Returns to Western European
Working Experience în the EU Accession Countries, Institute of Economics, Hungarian Academy of Science, http://econ.core.hu/doc/dp/dp/mtdp0607.pdf
9. Horvath, I. (2011) Colonists, workers and opportunists, Dilema veche, no. 254, http://www.dilemaveche.ro/sectiune/tema-saptamanii/articol/
10. Niessen, J.; Schiebel, Y. (2004) Handbook on Integration for policy-makers and practitioners, European Communities
11. Mănăilă, I. Decent work for the Romanians in the European Union. Legal work or moonlighting? Project developed by the National Association of Human Resources Specialists
12. Page, J.; Plaza, S. (2005) Migration and Economic Development: A Review of Global Evidence, Human Movement Science, Springer Publishers
13. Pîrvu, R. (2011) The Link Between Migration and Economic Development, Proceedings Bulletin USAVM Hortculture, 68
14. Pisică, S.; Vasile, V.; Voineagu, V. (2012) The labor market between formal and informal, Expert Press
15. Ratha, D. (2003) Workers’ remittances: An important and stable source of external finance, Global Development Finance Report, World Bank, Washington D.C
16. Stark, O. (2005) The new economics of the brain drain: Mapping the gains, World Economics no.6
17. Stoiciu, V. (coord) (2011) The impact of the crisis on labour migration in Romania, Bucharest, p.15
18. Vlase, I. (2011) Romanians’ back migration from Italy. Case study, in Vulturu, Vrancea County, “Quality of life”, Journal, XXII, no. 2, p. 155-176
19. CIVIS, IASCI (2010) Consolidating the link between migration and development in Moldova, Chișinău
20. European Union: Council of the European Union (1999) Presidency Conclusions, Tampere European Council, 15-16 October, www.unhcr.org/refworld/ docid/3ef2d2264.html
21. IOM (2011), World Migration Report, p. 18 22. Soros Foundation (2010), Romania, studies: Migration and development; Policies and
institutions in the international migration; The effects of migration: children staying home; temporary living abroad
23. Soros Foundation (2011) The forth wave. Brain migration via Romania-Occident, p. 46 24. Communication of the Commision on Undeclared Work, European Commision,
Bruseseles, COM (98), 219 25. http://www.aiel.it/bacheca/SASSARI/papers/martin_radu.pdf, p. 8 26. http://www.fes.ro/common/pdf/Impactul%20crizei.pdf, p.70-76

Annals of the University of Petroşani, Economics, 12(4), 2012, 203-210 203
COMPETITIVENESS IN SERVICES, DRIVING FORCE OF ECONOMIC DEVELOPMENT
RAMONA PÎRVU, MARIA DANATIE ENESCU *
ABSTRACT: The competitiveness of a nation is ensured by the profitable activity of firms. They strengthen their position in the domestic and international markets through global strategies whose purpose is to increase productivity and maintain it at a high level. For this, the company must take into account both the internal economic environment which ensures operating conditions and the external economic environment’s development. The five competitive forces determine the industry’s profitability because they configure firms’ selling prices, production costs and investments needed to be competitive in the field. The threat of new competitors limits the potential profit since they involve new production units and the opportunities for market expansion. Economic strength of the buyers and bidders attracts profits to them. Rivalry among existing competitors erodes profits by increasing costs of competition (like advertising, selling expenses or those required for research and development). The presence of substitutive goods or services limits competitors’ prices through buyers’ transfer phenomena limiting and eroding market share of industry / firm in the total production output. KEY WORDS: services; development; competitiveness. JEL CLASSIFICATION: J21; F22; F20. 1. INTRODUCTION
Both at the micro, middle, macro or mega economic level, the new feature
influencing competitiveness in our century is the intensity of competition, both national and international, enhanced by the globalization phenomena, rapid evolution of technological changes, especially in computer science and telecommunications and progressive liberalization of international trade etc. (Ioncică, et al., 2008).
* Assoc. Prof. Ph.D., Faculty of Economics and Business Administration, Economy Department, University of Craiova, Romania, [email protected] Lecturer, Ph.D. Student, University of Craiova, [email protected]

204 Pîrvu, R.; Danatie Enescu, M.
Lisbon Agenda defines competitiveness as the ability of a country to improve and raise the standard of living of its people by providing more jobs of higher quality and achieving a greater social cohesion. In the context of social and economic factors that contribute to these objectives a major role is assigned to competitiveness in the field of trade in goods and services, considered to be a confirmation of the performance of export (and import) of the EU and, respectively, of the member countries. Keeping in mind this narrower definition that focuses just on the commercial aspect, it seems appropriate to evoke the definition formulated by the OECD (2005) stating that competitiveness is a measure of the advantage / disadvantage of a country in the process of selling its products on international markets.
United Nations Conference on Trade and Development considers that competitiveness of a national economy is "the ability of a nation, in terms of free and fair competition, to produce and sell on the international market goods and services that meet global market requirements and to maintain or increase simultaneously the internal rate of growth.” The concept of competitiveness has initially emerged as an aspect of micro economy, referring to the level of a firm’s activity. In this respect, it is considered that an economic activity or firm is competitive if it sells its products at market price while covering costs and obtaining a profit and these conditions are valid and necessary both in the short and medium term and long term.
Moreover, competitiveness can be seen as an indicator "of the ability of providing goods and services in the form, place and moment when they are sought by buyers at prices as good or even better than those of other bidders so that consumers can obtain at least the opportunity cost of revenues obtained from the resources involved" (Freebairn, 1986). Thus competitiveness includes two types of competition: competition of products in domestic and foreign markets, and the ability to gain and maintain its market share; competition in the market of factors involved in the production of goods which must ensure at least the opportunity cost. 2. CURRENT DEVELOPMENTS AND THE CHARACTERISTICS OF THE PHENOMENON OF MIGRATION FOR EMPLOYMENT
In the economic literature, the concept of competitiveness applied to service
activities was defined as all those factors that promote and impede the internationalization of those activities. The definition of competitiveness proposed by Trabold (Trabold, 1995) that competitiveness is defined as a consolidation of four skills seems particularly relevant. These abilities are: 1. ability to sell goods and services internationally; 2. ability to attract resources, especially FDI; 3. ability to adjust to continuously changing external conditions through structural
changes and modernization; 4. ability to gain, which can be measured by GDP and economic growth. Although it
is characterized by pragmatism, this definition neglects the labor factor.

Competitiveness in Services, Driving Force of Economic Development 205 In addressing economic competitiveness, theory goes from microeconomic level and reaches the industrial branches and economy; Porter's competitive diamond model (Porter, 1986) identifies five forces that influence a firm's competitiveness: competition between incumbent competitors, threat of new competitors, threat of new substitutes for their products or services, bargaining power of the bidders and seekers’ purchasing power. The competitiveness of a nation is ensured by the profitable activity of firms. They strengthen their position in the domestic and international markets through global strategies whose purpose is to increase productivity and maintain it at a high level. For this, the company must take into account both the internal economic environment which ensures operating conditions and the external economic environment’s development. The five competitive forces determine the industry’s profitability because they configure firms’ selling prices, production costs and investments needed to be competitive in the field. The threat of new competitors limits the potential profit since they involve new production units and the opportunities for market expansion. Economic strength of the buyers and bidders attracts profits to them. Rivalry among existing competitors erodes profits by increasing costs of competition (like advertising, selling expenses or those required for research and development). The presence of substitutive goods or services limits competitors’ prices through buyers’ transfer phenomena limiting and eroding market share of industry / firm in the total production output. One of the determining factors in the competitiveness of firms is the economic environment in which firms operate. Michael Porter defines economic environment by the following factors: General conditions: refers to the position of the national economy in terms of inputs necessary to compete in a particular industry, such as: human resources, their training and cost; natural resources, with their abundance, availability and cost; the level of knowledge, involving not only stock-specific knowledge and technical expertise required, but also means of training (activity in universities and research institutes, statistical agencies etc.); capital resources (the size and cost of capital available to finance the branch in question); infrastructure (infrastructure’s type, quality and cost of use affects competition). Conditions of application: domestic demand for goods and services of the industry which depends on the needs of buyers, but is influenced by many other factors (the solvency of buyers; most of them prefer cheap goods, but can always be identified a segment that prefers unique or sophisticated goods; consumer habits and traditions; rivalry of import products etc.). Competitiveness on the internal market will be analyzed by considering the indicator "single market share" and the correlations that exist between industries and support industries analyzed. For a thoroughgoing study at microeconomic level, researches are needed to identify the level of domestic demand, the number of potential buyers, and the growth rate of domestic demand so to anticipate the possibility of saturation of the domestic market. Regarding the external demand, we shall analyze the structural developments in the exporting industries group and the competitiveness in external market will be approached by the pointer "export

206 Pîrvu, R.; Danatie Enescu, M. intensity" and the correlations with productivity level. Particular attention is given to supporting industries. Related and supporting industries: the presence or absence of the national economy of supporting industries and those related to the respective branch that are internationally competitive; the existence of competitive advantage in the supporting industries confers a potential advantage to the branch because they produce the necessary inputs to international standards and at competitive costs. Necessary inputs can be imported, but to have them available domestically confer a benefit to the industries that use them. Firms’ strategies, industry structure and rivalry: meaning the conditions in which the companies can be created, organized and managed and the nature of domestic rivalry. There is no universal management system available to any company; it depends primarily on internal conditions. Objectives are strongly determined by the ownership structure and reflect the characteristics of capital markets. It is the only point of M. Porter's model for which the input-output tables do not provide the information required for analysis. In this domain of interest, there are other interesting approaches in the specialized literature with direct reference to the Romanian economy. Government policies can positively or negatively influence each of these four determinants: the general conditions relating to the factors of production can be influenced by subsidies granted or withdrawn by scientific research. Regarding internal market, government’s influence is manifested by setting standards that affect consumer preferences, like state orders for certain industries (arms and not only), as well as through foreign trade policies (tariffs, quota, various barriers to import or export). Support industries are also affected by this type of policies and business strategy depends crucially on capital markets regulations, tax policy, antitrust laws etc.
Another crucial element influencing the firm's competitive advantage is determined by the action of governmental authorities. The government's role is to influence and potentiate national economic factors. This influence can be directly achieved through subsidies, industrial policy and other or more diffuse actions such as modeling internal demand by standards and regulations. The role of government in the market as an important buyer of property and advanced technologies such as telecommunications equipment, weapons, computers, vehicles and others must not be forgotten (Crâng-Foamete, 2008).
Competitiveness problems (definition, measure, drivers, growth strategies, etc.) can be addressed by presenting elements of differentiation and inter-conditioning at the microeconomic level (firms, organizations etc.) and mezoeconomic level (economic sectors or branches), macroeconomic level (in a country) or megaeconomic level (of a number of countries - such as the EU). Also, the competitiveness of firms, industries, countries, etc. can be considered at a certain statistical time by mean of issues such as: market share, profitability and position in world trade or long-term dynamic. In the second case, the competitiveness of a company, for example, is seen as its long-term ability to thrive in a competitive economic environment. Similarly, at the macroeconomic level, the competitiveness of a nation can be regarded as the country's

Competitiveness in Services, Driving Force of Economic Development 207 ability to achieve long-term growth in such a way that its economic structure is able to adapt effectively to global economic developments (Ioncică, et al., 2008).
We believe it is essential to specify the angle of approach in the scientific debate on the concept of competitiveness, namely:
A. If we approach it in terms of the creation, maintenance and development of competitive advantages that ultimately lead to competitiveness, the only place in which this process operates is the sphere of activity of economic operators, the productive sector. A business company is the only entity providing economic competitiveness.
B. If we address competitiveness, in terms of level and opportunities of commensuration, the situation is completely different since, although it is achieved only within the company, competitiveness spreads, through its effects, to higher stages of aggregation and it can be more or less precisely measured, depending on the scope, tools used and perceived effects on the national economy (Crâng-Foamete, 2008).
Amplification of the economic relevance of services must be associated, above all, with the accelerated internationalization of these activities and, respectively, their increased capacity to constitute the object of international trade. This process occurs through two interrelated dimensions: (1) The sustained growth of trade in services; (2) The rapid expansion of foreign direct investment flows (FDI) in services.
The relationship between competitiveness and services must be understood within a framework that takes into account both the effects of services on the global economy and the challenges posed by the competitive economies onto service sector. Since the late '80s, many important studies have examined the role of services as agents of globalization and a driving force of international trade. Precisely for these reasons, we can speak of biunivocal relationship competitiveness - services. Therefore it is obvious that services require a specific approach as their internationalization process differs from that of the manufacturing industry. Two types of factors affecting trade in services: (1) expansion factors, which force opening of markets - due to intrinsic economic dynamics; and (2) limiting factors restricting the growth of trade opportunities - due to inherent peculiarities of services and features related to their regulation (Ghibuţiu, 2010).
Moreover, the main economic factors affecting the development of the tertiary sector are: economic growth - the rate at which economy evolves (for better or worse) in a
period of time – it influences the development of services, which are both a precondition and an effect of the evolution of the economy;
final household consumption expenditures are influenced by real income, saving trend, taxes and budget subsidies (grants, aids, etc..), consumer loans, etc. Increased consumer spending by individuals and households leads to a growth in a higher rate of the demand for services;
investments in the infrastructure, technical development and modernization of the service branches influence the increase of supply in services and their quality level;
government spending and private sector consumption expenses influence the evolution of public services, non-available on the market, meant for the community or groups of households;

208 Pîrvu, R.; Danatie Enescu, M. exchange rates – the exchange rate of the national currency against major
currencies influence the evolution of international trade services, stimulating or rather discouraging exports, in spite of the multiplier effects on the economy;
interest rates - determine the cost of borrowing, encouraging or not the demand for loans for both investment and consumption;
inflation rate - changes in the general price index affects the purchasing power of the population, the cost of products, with implications for demand and supply of services.
Other economic factors such as the level of taxation (taxes, excise etc.), fiscal policy (allocation of state budget expenditures for public services), the growth rate of labor productivity, and others also influence the development of services and therefore should be carefully analyzed for a rigorous foundation of the tertiary sector development strategies.
In the economic literature have been identified many determinants with a potential impact on competitiveness in services - as in the case of material goods - which can be found at meta, macro, mezzo and microeconomic level. The UNCTAD (2003) and Fischer and Schornberg (2007) distinguish the following determinants of competitiveness in services (Ghibuţiu, 2010): • at metaeconomic level: the regional economic framework, regional policy, socio-
cultural factors; • at macroeconomic level: the national economy, national policies, vocational skills,
technology, and infrastructure; • at mezoeconomic level: industry structure, sector policies and lobbying,
supporting industries, the conditions regarding the application; • at microeconomic level: specialization, investments (including Research &
Development) internationalization (FDI, exports). Among the competitiveness indicators, the sources mentioned include: profitability, productivity and growth.
In the production of services, developments in recent years can be described by the following coordinates: • constant increase in the share that services hold in the GDP; • structural balancing of the services rendered; • differentiated but significant growths, as mentioned above, in various areas of
production, which means a concern for the development of services production; • engaging a significant number of people in the business of providing services,
which should be continuing to evolve the same in the next period; • improving the quality of services rendered to population; • improvement of the hotel business which meant a better hotel occupancy and
contribution to the achievement of GDP; • a contribution of approx. 50% of the production of services in GDP (in some
developed countries, such as Sweden, Switzerland and so on, the services represent over 70% in GDP);
• development of the activity of providing banking and financial services and of the capital market.

Competitiveness in Services, Driving Force of Economic Development 209
Reconsidering the role and importance of services in Romania's development strategy is in fact a necessity due to insufficient development of this sector in our country compared to developed countries. At least three aspects of the report "Development - Services" give substance to the assessment that the way towards the effective integration of Romania in the European and global economic structures inexorably imposes amplifying the position and role of services in the economy, namely (Ghibuţiu, 2000): • inextricable link between services and the process of building and operating the
markets; • deepening interconnection and integration relationships between services and the
rest of the economy in general, and between services and industry in particular; • enhancing opportunities for growth and development by virtue of extending the
scope of international transactions in services as a result of their progressive liberalization; the institutional framework for this approach is GATS (at global level) and the European Agreement (in Europe), and as a partner, Romania has made specific commitments to liberalize.
The service sector is very heterogeneous, covering a wide variety of economic activities. Theoretically, this diversity masks a fundamental function that many services provide in relation to the economic growth and development process, namely that services facilitate the transactions in terms of space (transport, telecommunications) or time (financial services). Another dimension is that services are frequently direct inputs in economic activities and thus determinants of the 'fundamental' production factors’ productivity - labor and capital - that generates knowledge, goods and services (education, healthcare, research and development - are examples of inputs in the production of human capital). As the outsourcing processes amplify - like business models put in practice by more companies both domestically and internationally (especially manufacturing firms) - the demand for services as intermediate inputs for production has increased considerably.
In parallel with the growing importance of intermediary services and emphasizing international relocation process, the combination of decay processes of production functions / tasks that could be sold and rapid progress in ICT domain has enabled a considerable increase in the share of intermediary services in the total trade in services. Wide-scale application of new ICT and reducing barriers to access the services markets, following the liberalization in autonomous, regional and multilateral plan of trade and investment regimes in services, have affected not only the production and consumption of services, but contributed to the growth of productivity in many segments of services and transformed the nature of products, processes, companies, markets’ structure and competition in services. 3. CONCLUSION
Competitive advantages of companies providing services seem to be less the
result of comparative advantages in terms of costs of production, and more the ability of suppliers to help meet specific customer needs, to reduce uncertainty regarding the quality of services and transaction costs of their customers. However, it can be

210 Pîrvu, R.; Danatie Enescu, M. concluded that the features that distinguish services from goods, and thus influencing their internationalization process, make the competitiveness indicators based on prices and costs be less relevant in the service sector than in the production of goods. However, a major role in international trade competitiveness in services belongs to quality and differentiation of products, economic and socio-cultural barriers.
Unlike manufacturing companies, competitive advantages of service providers constitute in a lesser extent the result of advantages associated with the production, but rather the ability of suppliers to respond to the specific needs of the buyer with a quality performance, to maintain close contact with the client, to exploit market imperfections and reduce transaction costs for the client. Such ownership advantages may lead - in combination with the location advantages related to the country of provider - to competitive advantages in export markets compared to firms based in the buyer's country. Increasingly more specialists, including those from our country, are concerned about the development of the competitiveness of services. Their conclusion is that to achieve this we need to act with competence, energy and conviction on the determinants of competitiveness of the services, as follows: 1. technical factors: technical features; 2. financial factors: price / rate, payment conditions; 3. support factors; auxiliary services associated with a product / service in order to
increase its added value (e.g. through maintenance, training, consultancy, supply of spare parts, etc.);
4. factors of outlet / sale: delivery time, delivery conditions, methods of distribution / sale etc.
All these factors should in principle be oriented towards satisfying as much as possible the exigencies, the requirements and expectations of customers. REFERENCES: 1. Crâng-Foamete, C. (2008) The competitiveness of the national economical structures,
published in Contemporary Economy of Romania. Analysis. Research. Studies, Universitaria Publishing House, Craiova, vol. 4, p. 82-92 coordinator Pîrvu Gh.
2. Freebairn, J. (1986), Implication of Wages and Industrial Policies on Competitiveness of Agricultural Export Industries, Canberra, Australia
3. Ghibuţiu, A. (2000) Services and development. From bias to new horizon, Expert Publishing House, Bucharest, p.329
4. Ghibuţiu, A. (2010) Competition in services: conceptual and methodological issues, pp. 5-12
5. Ioncică, M.; Petrescu, E.; Ioncică, D. (2008) Micro and macroeconomic approaches of the competitiveness into the services, Journal of Marketing, vol.2, no.1, p.76-82
6. Porter, M. (1985) The Competitive Advantage of Nations, Harvard Business Scholl 7. Trabold, H. (1995), Die internationale Wettbewerbsfaehigkeit einer Volkswirtschaft,
DIWVierteljahresheft, No.2, Berlin, p. 169-83

Annals of the University of Petroşani, Economics, 12(4), 2012, 211-218 211
MONETARY AGGREGATES - INSTRUMENT OF THE POLICY PROMOTED BY THE
NATIONAL BANK OF ROMANIA
CORALIA EMILIA POPA * ABSTRACT: A summary analysis of the economic theory and practice indicates the fact that the attempts to establish and delimit the importance of the economic-financial last resorts to the effects produced in macro and micro-economy have not lead to infallible truth. The goal of these last resorts is to organize an economic system in difficulty, to try to minimize its imperfections and non-functionalities. The society development has brought along the need to improve these attempts, so that together with other administrative methods to produce viable and productive solutions for the economy progress. This paper aims at emphasizing the advantages of using monetary aggregates, as well as their limitations under the direct influence of monetary factors, considering that these indicators are commonly used in many models of monetary analysis, especially in Neo-Keynesian ones. KEY WORDS: monetary aggregates; monetary policy; NBR; monetary policy interest rate. JEL CLASSIFICATION: E52; E43. 1. INTRODUCTION
The drawing up of monetary policy should consider the past, present and future evolutions of economy and for this purpose, both economic models and economic indicators are used. In order to achieve the ultimate goal of ensuring the stability of the power of purchasing of national currency, the Central Bank must go through many steps. Otherwise we should set intermediate objectives as well as how to achieve them.
The national economies respond differently to various stimuli used by the central bank so there is great importance attributed to the way these intermediate objectives are conceived. Depending on the degree and timing for completion of intermediate objectives, the central bank is informed of the possibility of achieving or
* Ph.D. Candidate, University of Craiova, Romania, [email protected]

212 Popa, C.E. not the final objective proposed, having also the opportunity to take measures to fulfil or maintain it. The literature, as well as recent practice of many central banks confers a special role to currency and monetary analysis in drafting and fulfilling the main objective of monetary policy.
The academic interest in connection to the above mentioned issue dates back to Milton Friedman writings, when he accepted the importance of monetary aggregates and he tried to achieve relevant analyses by using several database of significant size. However, the choice of role and content of each monetary aggregate represents a permanent source of discussion in the vast literature devoted to this area. The monetary practice of developed countries in the last decades uses interest rate and monetary aggregates as the main indicators of monetary policy management.
Even though the use of monetary aggregates is considered a priority, it does not exclude the use of interest rate in the evaluation of monetary policy in economy. The potential unbalances between real economy and monetary supply are felt equally by economic agencies and population, a fact that made the central bank keeping a close control on the evolution of monetary supply with major implications in achieving the balance with the quantity of goods and services existent on the market.
2. MONETARY AGGREGATES - EVOLUTION AND INFLUENCES
Monetary aggregates represent combinations of different elements that are part
of money supply. A very important thing is the choice of that monetary aggregate that can meet efficiently the objectives of monetary policy in a certain period of time. The composition of monetary aggregate is the one that determines also its efficiency.
The use of monetary aggregates as an intermediate objective of monetary policy has its origins in Fisher’s equation:
M*V = P*Q (1)
The multiplication between P (Price level) and Q (real income) may show both the value of all goods that were traded in a certain period of time, as well as GDP on the market price. Also the rotation speed of money (V) is used to determine the trading potential of money. In the utopian situation where the speed of money circulation and the quantity of goods and services in economy are constant or they are varying in the same way and with the same value, the monetary supply becomes a directly proportional size with the price level of goods and services.
The structure of monetary aggregates varies from one economy to another and even from one period to another. Although their structure is established according to general ideas that dominate the economic and political life of a state, there are also common features.
The Central Bank gets through very important steps in choosing the monetary aggregate used:
• firstly, a special importance should be given to the structure of monetary aggregates;
• secondly we should seek the results of a certain monetary aggregate obtained in relation to GDP( gross domestic product);

Monetary Aggregates - Instrument of the Policy Promoted by the … 213
• finally an important role is assigned to appropriate aggregation of selected categories of assets.
Taking into account all the aspects mentioned above we can present a clear image on the monetary aggregates used by National Bank of Romania (BNR) to reach the objective of the monetary policy promoted. The structure of these instruments was altered over time; the changes were due to internal elements as well as to external factors of influence (creating the European System of National and Regional Accounts (ESA 95). Therefore, until 2007 there were only two monetary aggregates symbolically called M1 and M2.
The monetary aggregate M1 represents a narrow monetary supply and it is constituted of currency in circulation (banknote and coins) and demand deposits in Lei, while the monetary aggregate M2 represents the monetary supply in a broad sense and it comprises besides the monetary aggregate M1, the quasi-money. January 2007 brought significant changes in the structure, number and consistency of monetary aggregates, when the monetary aggregate M3 appeared and the M2 lost the name of broad money.
Therefore, the monetary aggregate M1 (narrow monetary supply) comprises besides currency in circulation (banknotes and coins) also demand deposits in Lei as well as public savings at sight in Lei and sight deposits in foreign currency of population and economic agents. The monetary aggregate M2 becomes intermediate money and it will comprise deposits of a maturity of up to two years and deposits redeemable at a period of notice of up to three months.
The new monetary aggregate - M3 (broad money) comprises the elements of M2 and marketable instruments, monetary market instruments, in particular money market fund shares/units and repurchase agreements are included in this aggregate(a high degree of liquidity makes the instruments close to substitutes for deposits.
Broad money (M3) recorded on 31 December 2011 the value of 216.208,1 mil lei, up from December 2010 and December 2009 when it recorded 202.763,4 mil lei, respectively 189.634,5 mil lei. Therefore, we can notice the upward trend of M3 and therein, the overnight deposits have an important place and also the deposits with an initial maturity up to two years and including two years.
We can notice that repurchase agreements, money market fund shares/units and debt securities up to two years, although they have a very dynamic growth rate, because of their insignificant value they don’t have an important influence on M3.
The growth rate of M3 in the period September – November, + 2.9 % compared to– 1.2% in the period June – August 2011, however it remains low if we consider the historical point of view. The sign changing of M3 expressed both temporary growth of inflation in July 2010 following the increase of VAT, and the statistical influence of the modification of Leu –Euro exchange rate, but also the relative stimulation of private sector credit.
All main components of M3 have contributed to its dynamic growth, but the defining role was of that of term deposits up to two years. Their sign changing is due to the growth of placements made by the population. The monetary aggregate M1 passes from negative to positive following the positive evolution of currency in

214 Popa, C.E. circulation, as well as overnight deposits, their growth rate remaining however negative, due to the evolution of short-term deposits of the population.
Table 1. Monetary aggregates*
INDICATORS 31/12/2009(mil. lei)
31/12/2010(mil. lei)
31/12/2011 (mil. lei)
M1 (narrow monetary supply) 79 369,3 81 604,8 85 835,0
Currency in circulation 23 973,0 26 792,9 30 608,7
Overnight Deposits 55 396,3 54 811,9 55 226,3
M2 (Intermediate money) 188 017,3 199 586,4 212 059,3
M1 79 369,3 81 604,8 85 835,0
Deposits with maturity up to two years and including two years (deposits redeemable at a period of notice up to three months are included)
108 648,0 117 981,6 126 224,3
M3 (broad money) 189 634,5 202 763,4 216 208,1
M2 188 017,3 199 586,4 212 059,3
Other financial instruments (repurchase agreements, market fund shares/units, debt securities up to 2 years)
1 617,2 3 177,0 4 148,8
* Preliminary data; Source: BNR, Press release - Monetary indicators – December 2009, 2010, 2011, www.bnro.ro
In case we would try an analysis of net foreign assets and net domestic assets we can notice slight fluctuations upward and downward. If in case of net domestic assets the trend is obviously an upward one, the net foreign assets represent variations both upward and downward. Therefore, if we report to the balance at December 2010 we will see a growth of 6, 6% towards December 2010 and a decrease of cu 12, 8% towards December 2011. Table 2. Monetary supply and its counterpart*
Indicators/Years 2009(mil. lei) 2010(mil. lei) 2011(mil. lei)
Monetary supply(M3) 189 634,5 202 763,4 216 208,1
Net foreign assets** 22 208,4 23 682,9 20 925,8
Net domestic assets*** 167 426,1 179 080,5 195 282,3 ** Preliminary data; ** it is calculated by subtracting the foreign assets from the foreign liabilities Allocations of SDR from IMF. *** It is calculated by subtracting domestic liabilities from domestic assets (except elements of M3). Source: BNR, Press release - Monetary indicators – December 2009, 2010, 2011, www.bnro.ro

Monetary Aggregates - Instrument of the Policy Promoted by the … 215
Looking through the monetary supply counterparties we can say that their positive dynamics reflected first of all the growth of dynamics for both private sector credit and central public administration, trying to eliminate the negative effect that the dynamics of net external assets had and enhancing the growth rate of financial liabilities on long-term.
The value of non-government loans at 31 December 2011 increased significantly compared to the same period of 2010, their balance went up from 209.298,0 million Lei to 223.033,6 mil lei, and this trend should be kept if we report it to 31 December 2009 when it recorded a value of 199.881,9 million Lei.
Lei denominated loans increased to 5, 6 % (increase due to non-government loans granted to legal persons), while foreign currency loan expressed in Lei increased by 7, 2 % (if we keep reporting in euro, foreign currency loan increased by 6, 3%). As well as in the non-government loan in Lei, also in the foreign currency loan the growth is due to the facilities granted to legal entities.
The two main categories of customers (individuals and legal) have recorded an upward evolution in case of credit dynamics. In case of individuals the positive evolutions are determined by the growth of overdrafts, credit cards and home loans. Legal entities reached the maximum in the last two years in the second half of 2011 primarily due to boosting of the component on short-term.
Table 3. Non-government loan*
INDICATORS 31.12.2009 (mil. lei)
31.12.2010 (mil. lei)
31.12.2011 (mil. lei)
Non–governmental credit (total) 199 881,9 209 298,0 223 033,6
Non–governmental credit in lei: 79 710,9 77 351,0 81 655,2
- households 38 808,9 35 914,0 35 047,4
- legal entities (non-financial companies and non-monetary financial institutions)
40 902,0 41 437,0 46 607,8
Non –governmental credit in foreign currency:
120 171,0 131 947,0 141 378,4
- households 61 407,3 66 185,5 69 210,6
- (non-financial companies and non-monetary financial institutions)
58 763,7 65 761,5 72 167,8
* Preliminary data; Source: BNR, Press release - Monetary indicators – December 2009, 2010, 2011, www.bnro.ro
Non-resident deposits increased in December 2011 by 5, 6% compared to
December 2010, until the level of 187.291,3 million Lei. Residents Deposits in LEI increased in December 2011 by 9, 75 compared to 2010 reaching 124.533,5 million Lei. Unlike non-governmental loans, in which growth was due to legal entities, in case of savings we notice a more pronounced tendency of individuals.

216 Popa, C.E.
Household deposits in LEI rose by 12, 1 %, until 72.101,8 million lei at 31 December 2011. If we analyse the component of M3 owners, we can notice an improvement of deposit dynamics of both player categories on the economic market.
For the population this improvement is due to the positive evolution of real annual growth of income from salaries and also to the lower interest in money market funds. In case of legal entities, the decrease of inflation played a key role in the growth of dynamics.
Deposits for legal entities in LEI (non-financial companies and non-monetary financial institutions) increased by 6, 6%, until 52.431,7 million lei at 31 December 2011.
Foreign currency deposits of resident household and legal entities (non-financial companies and non-monetary financial institutions), expressed in lei, have recorded a decrease of 1, 9 per cent, until the level of 62 757, 8 million Lei (expressed in euro, deposits in foreign currency decreased by 2, 1 per cent). As we mentioned previously, the decrease is due to the downward trend related to savings in case of legal entities. If the foreign currency deposits of households expressed in Lei increased by 2, 1 per cent in December 2011 compared to December 2010, the foreign currency deposits of legal entities declined 8, 4 per cent towards the same period. Thus we can see an improvement of M3 due to the share increasing of loans denominated in Lei.
Table 4. The deposits of the residents non-governmental clients*
INDICATORS 31 December
2009 (mil. lei)
31 December 2010
(mil. lei)
31 December 2011
(mil. lei) The deposits of the residents non-governmental clients (total)**
167 742,1 177 438,7 187 291,3
Deposits in Lei of residents: 102 691,1 113 486,5 124 533,5
- households 59 197,2 64 228,2 72 101,8
- legal entities (non-financial companies and non-monetary financial institutions)
43 493,9 49 261,3 52 431,7
Deposits in foreign currency of residents:
65 051,0 63 949,2 62 757,8
- households 38 107,9 39 786,3 40 651,7
- legal entities (non-financial companies and non-monetary financial institutions)
26 943,1 24 162,9 22 106,1
* Preliminary data; ** Current accounts, demand deposits and all term deposits, regardless of maturity Source: BNR, Press release - Monetary indicators – December 2009, 2010, 2011, www.bnro.ro
The data presented in table no.5 sustain the connection between the values of the three indicators of monetary supply and inflation rate for the period analysed.

Monetary Aggregates - Instrument of the Policy Promoted by the … 217
Therefore we can notice that, although the monetary base decreases by 14,2% in 2009, we assist to a growth of 9% of monetary supply and a price growth by 5,59%. The evolution of M3 reflects in a very eloquent manner, the influences exerted by the decline of economic activity over the monetary supply.
Therefore, while narrow money continued contraction also in 2009 compared to the previous period, the annual growth rate of term deposits under 2 years knew a new record, which led to a positive growth of Broad Money.
The evolution of monetary supply in 2010 continues the trend from 2009 represented by the contraction of economic activity that, together with the VAT, will lead to the increase of inflation. As far as the 2011 is concerned, we can notice a modification of monetary supply trend, this sign change of M3 dynamics reflected firstly the evolution of inflation (5, 79%), but also a boosting of the private sector through the growth of credits granted.
Table 5. Correlation of final and intermediary objectives pursued by BNR in 2009 – 2011
Indicators/ years
M1 (% compared to the end of previous
years)
M2 (% compared to the end of previous
years)
M3 (% compared to the end of previous
years)
Inflation rate (% - annual
average level)
2009 -14,2 8,3 9,0 5,59 %
2010 2,8 6,2 6,9 6,09
2011 5,2 6,3 6,6 5,79 Creation: author Source: BNR, Press release - Monetary indicators – December 2009, 2010, 2011, www.bnro.r; INSSE, Annual indices of consumer price and inflation rate in the period 1971-2011.
3. CONCLUSIONS
The structure of monetary aggregates is permanently pursued by economic analysts because it reflects the amount of money economy needs to function properly.
Practically, in economic terms through the stability of the currency we aim price stability, which is a certain level of inflation. This is also the direction of monetary policy promoted by NBR, but for an efficient result we should consider and monitor other components of economic life: interest rate, exchange rate.
The relations that cannot be denied between monetary aggregates and the instruments of the monetary policy promoted by NBR intend to provide indicative predictions on changes occurred in the economic life and the evolution of inflation.

218 Popa, C.E. REFERENCES: [1]. Gherghinescu, O.; Gherghinescu, G. (2007) The approach and role of monetary
aggregates in Frankfurt and Bucharest , Universitaria Craiova Publishing [2]. Opriţescu, A.G. (2003) Legal and economic regime of interest, Universitaria Craiova
Publishing [3]. BNR, Press release - Monetary indicators – December 2009, 2010, 2011, www.bnro.ro [4]. INSSE, Annual indices of consumer price and inflation rate in the period 1971-2011
www.insse.ro

Annals of the University of Petroşani, Economics, 12(4), 2012, 219-226 219
INDEPENDENCE AND OBJECTIVITY - A SINE QUA NON PRINCIPLE IN AUDITING
BOGDAN RĂVAŞ
ABSTRACT: Objectivity is an independent mental attitude that the auditors should maintain in performing engagements. The auditors are not to subordinate their judgment on audit matters to that of others. Objectivity requires the auditors to perform engagements in such a manner that they have an honest belief in their work product and that no significant quality compromises are made. Internal auditors are not to be placed in situations in which they feel unable to make objective professional judgments. KEY WORDS: independence, objectivity, audit, team, professional. JEL CLASIFICATION: M41. 1. INTRODUCTION In the process of the decision and the economic activity must be controlled and by another external control structure other than the internal control system, enabling any third party to inform its heritage status. This form of control is known as audit and is performed by independent professionals organized into distinct structures or unincorporated. Broadly speaking, professional audit means the examination of information responsible for expressing an independent opinion by comparing them to a standard or a standard quality for clear and complete image of the legal heritage. According to the Dictionary of Economic and Management at the European Commission audit or auditing means checking records of a company in accordance with professional standards in order to establish the regularity of truthfulness and accuracy of records and financial statements of the company. The financial audit is the verification and certification of annual accounts by a competent and independent professional in order to express its opinion on the
Lecturer, Ph.D., University of Petroşani, Romania, [email protected]

220 Răvaș, B. reliability of the data contained in the annual summary documents. Although the literature is not a clear delineation of accounting and audit financial audit, we can say that the two types of audit are complementary. Thus, if accounting audit work aimed particularly strict accounting, record fair and lawful economic operations, the audit is to assess the economic outcomes represented in the summary documents and annual financial statements. In these circumstances, the role of auditors to check the first part of the course of the audit method to the principles of accounting as a prerequisite for the relevant audited annual financial statements so that ultimately they can make an accurate assessment of the economic situation of the company in order to ensure accurate information to those interested in the results of the company audited. 2. DISCUSSION The auditors are independent when they can carry out their work freely and objectively. Independence permits the auditors to render the impartial and unobliged judgments essential to the proper conduct of engagements. That is achieved through organizational status and objectivity. The auditors should have the support of senior management and of the board so that they can gain the cooperation of engagement clients and perform their work free from interference. The chief audit executive should be responsible to an individual in the organization with sufficient authority to promote independence and to ensure broad audit coverage, adequate consideration of engagement communications, and appropriate action on engagement recommendations. Ideally, the chief audit executive should report functionally to the audit committee, board of directors, or other appropriate governing authority, and administratively to the chief executive officer of the organization. The chief audit executive should have direct communication with the board, audit committee, or other appropriate governing authority. Regular communication with the board helps assure independence and provides a means for the board and the chief audit executive to keep each other informed on matters of mutual interest. Direct communication occurs when the chief audit executive regularly attends and participates in meetings of the board, audit committee, or other appropriate governing authority which relate to its oversight responsibilities for auditing, financial reporting, organizational governance, and control. The chief audit executive's attendance and participation at these meetings provide an opportunity to exchange information concerning the plans and activities of the internal auditing activity. The chief audit executive should meet privately with the board, audit committee, or other appropriate governing authority at least annually. Independence is enhanced when the board concurs in the appointment or removal of the chief audit executive. At times, an internal auditor may be asked by the engagement client or other parties to explain why a document that has been requested is relevant to an engagement. Disclosure or nondisclosure during the engagement of the reasons why documents are needed should be determined based on the circumstances. Significant

Independence and Objectivity - A Sine Qua Non Principle in Auditing 221 irregularities may dictate a less open environment than would normally be conducive to a cooperative engagement. However, that is a judgment that should be made by the chief audit executive in light of the specific circumstances. Objectivity is an independent mental attitude that the auditors should maintain in performing engagements. The auditors are not to subordinate their judgment on audit matters to that of others. Objectivity requires the auditors to perform engagements in such a manner that they have an honest belief in their work product and that no significant quality compromises are made. Internal auditors are not to be placed in situations in which they feel unable to make objective professional judgments. Staff assignments should be made so that potential and actual conflicts of interest and bias are avoided. The chief audit executive should periodically obtain from the auditing staff information concerning potential conflicts of interest and bias. Staff assignments of the auditors should be rotated periodically whenever it is practicable to do so. The results of the auditing work should be reviewed before the related engagement communications are released to provide reasonable assurance that the work was performed objectively. It is unethical for an auditor to accept a fee or gift from an employee, client, customer, supplier, or business associate. Accepting a fee or gift may create an appearance that the auditor's objectivity has been impaired. The appearance that objectivity has been impaired may apply to current and future engagements conducted by the auditor. The status of engagements should not be considered as justification for receiving fees or gifts. The receipt of promotional items (such as pens, calendars, or samples) that are available to the general public and have minimal value should not hinder internal auditors' professional judgments. Internal auditors should report the offer of all material fees or gifts immediately to their supervisors The auditors should report to the chief audit executive any situations in which a conflict of interest or bias is present or may reasonably be inferred. The chief audit executive should then reassign such auditors. A scope limitation is a restriction placed upon the internal audit activity that precludes the audit activity from accomplishing its objectives and plans. Among other things, a scope limitation may restrict the:
scope defined in the charter. audit activity's access to records, personnel, and physical properties relevant to
the performance of engagements. approved engagement work schedule. performance of necessary engagement procedures. approved staffing plan and financial budget.
A scope limitation along with its potential effect should be communicated, preferably in writing, to the board, audit committee, or other appropriate governing authority. The chief audit executive should consider whether it is appropriate to inform the board, audit committee, or other appropriate governing authority regarding scope limitations that were previously communicated to and accepted by the board, audit

222 Răvaș, B. committee, or other appropriate governing authority. This may be necessary particularly when there have been organization, board, senior management, or other changes. Internal auditors should not assume operating responsibilities. If senior management directs internal auditors to perform non audit work, it should be understood that they are not functioning as internal auditors. Moreover, objectivity is presumed to be impaired when internal auditors perform an assurance review of any activity for which they had authority or responsibility within the past year. This impairment should be considered when communicating audit engagement results. If internal auditors are directed to perform non audit duties that may impair objectivity, such as preparation of bank reconciliations, the chief audit executive should inform senior management and the board that this activity is not an assurance audit activity; and, therefore, audit-related conclusions should not be drawn. In addition, when operating responsibilities are assigned to the internal audit activity, special attention must be given to ensure objectivity when a subsequent assurance engagement in the related operating area is undertaken. Objectivity is presumed to be impaired when internal auditors audit any activity for which they had authority or responsibility within the past year. These facts should be clearly stated when communicating the results of an audit engagement relating to an area where an auditor had operating responsibilities. At any point that assigned activities involve the assumption of operating authority, audit objectivity would be presumed to be impaired with respect to that activity. Persons transferred to or temporarily engaged by the internal audit activity should not be assigned to audit those activities they previously performed until a reasonable period of time (at least one year) has elapsed. Such assignments are presumed to impair objectivity, and additional consideration should be exercised when supervising the engagement work and communicating engagement results. The internal auditor's objectivity is not adversely affected when the auditor recommends standards of control for systems or reviews procedures before they are implemented. The auditor's objectivity is considered to be impaired if the auditor designs, installs, drafts procedures for, or operates such systems. The occasional performance of non audit work by the internal auditor, with full disclosure in the reporting process, would not necessarily impair independence. However, it would require careful consideration by management and the internal auditor to avoid adversely affecting the internal auditor's objectivity. Acceptance of such responsibilities can impair independence and objectivity and, if possible, should be avoided. Some internal auditors have been assigned or accepted non-audit duties because of a variety of business reasons that make sense to management of the organization. Internal auditors are more frequently being asked to perform roles and responsibilities that may impair independence or objectivity. Given the increasing demand on organizations, both public and private, to develop more efficient and effective operations and to do so with fewer resources, some internal audit activities

Independence and Objectivity - A Sine Qua Non Principle in Auditing 223 are being directed by their organization's management to assume responsibility for operations that are subject to periodic internal auditing assessments. When the internal audit activity or individual internal auditor is responsible for, or management is considering assigning, an operation that it might audit, the internal auditor's independence and objectivity may be impaired. The internal auditor should consider the following factors in assessing the impact on independence and objectivity:
the requirements of The HA Code of Ethics and Standards for the Professional Practice of Internal Auditing (Standards);
expectations of stakeholders that may include the shareholders, board of directors, audit committee, management, legislative bodies, public entities, regulatory bodies, and public interest groups;
allowances and/or restrictions contained in the internal audit activity charter; Disclosures required by the Standards; and
subsequent audit coverage of the activities or responsibilities accepted by the internal auditor.
Internal auditors should consider the following factors to determine an appropriate course of action when presented with the opportunity of accepting responsibility for a non audit function The IIA Code of Ethics and Standards require the internal audit activity to be independent and internal auditors to be objective in performing their work. If possible, internal auditors should avoid accepting responsibility for non-audit functions or duties that are subject to periodic internal auditing assessments. If this is not possible, then impairment to independence and objectivity are required to be disclosed to appropriate parties, and the nature of the disclosure depends upon the impairment. - Objectivity is presumed to be impaired if an auditor provides assurance services for an activity for which the auditor had responsibility within the previous year. If on occasion management directs internal auditors to perform non-audit work, it should be understood that they are not functioning as internal auditors. Expectations of stakeholders, including regulatory or legal requirements, should be evaluated and assessed in relation to the potential impairment. If the internal audit activity charter contains specific restrictions or limiting language regarding the assignment of non-audit functions to the internal auditor, then these restrictions should be disclosed and discussed with management, if management insists on such an assignment, the auditor should disclose and discuss this matter with the audit committee or appropriate governing body. If the charter is silent on this matter, the guidance noted in the points below should be considered. All the points noted below are subordinated to the language of the charter. The results of the assessment should be discussed with management, the audit committee, and/or other appropriate stakeholders. A determination should be made regarding a number of issues, some of which affect one another. The significance of the operational function to the organization (in terms of revenue, expenses, reputation, and influence) should be evaluated.

224 Răvaș, B. The length or duration of the assignment and scope of responsibility should be evaluated. Adequacy of separation of duties should be also evaluated. The potential impairment to objectivity or independence or the appearance of such impairment should be considered when reporting audit results. Audit of the function and disclosure - Given that the internal audit activity has operational responsibilities and that operation is part of the audit plan, there are several avenues for the auditor to consider. The audit may be performed by a contracted, third party entity, by external auditors, or by the internal audit function. In the first two situations, impairment of objectivity is minimized by the use of auditors outside of the organization. In the latter case, objectivity would be impaired. Individual auditors with operational responsibility should not participate in the audit of the operation. If possible, auditors conducting the assessment should be supervised by, and report the results of the assessment to those whose independence or objectivity is not impaired. Disclosure should be made regarding the operational responsibilities of the auditor for the function, the significance of the operation to the organization (in terms of revenue, expenses, or other pertinent information) and the relationship of those who audited the function to the auditor. Disclosure of the auditor's operational responsibilities should be made in the related audit report and in the auditor's standard communication to the audit committee or other governing body. 3. CONCLUSION The audit is an independent and objective assurance that gives an entity in terms of the degree of control over operations, guides to improve its operations and contribute to adding value. The audit helps the organization to achieve its objectives by evaluating, in a systematic and methodical approach, its processes of risk management, control, and governance of the organization, and making proposals to enhance their effectiveness. The Code of Ethics of the Institute of Internal Auditors (IIA) is Principles relevant to the profession and practice of internal auditing, and Rules of Conduct that describe behavior expected of internal auditors. Code of Ethics applies to both individuals and organizations providing internal audit services. The purpose of the Code of Ethics is to promote an ethical culture in the global profession of internal auditing. The responsible for the internal audit activity should report the establishment of a hierarchical level that allows the internal audit activity to fulfill its responsibilities. Auditing should not be subject to any interference in the definition of its range, carrying out and communicating the results. Internal auditors should have an impartial and unbiased attitude and avoid conflicts of interest.

Independence and Objectivity - A Sine Qua Non Principle in Auditing 225 If the objectivity or the independence of auditors are affected in fact or in appearance, stakeholders need to be informed of the details of situations that create such damage. The shape of this communication will depend on the nature of injury. For example, internal auditors should refrain from assessing specific operations that were responsible in the past. The objectivity of an auditor is considered to be impaired when it made an assurance engagement for an activity for which he was responsible during the year. Assurance engagements aimed at responsible positions responsible for the internal audit activity must be supervised by a person who is not a part of IAC. Internal auditors may provide consulting services in connection with the implementation of projects for which they were responsible in the past. The attitude and actions of the Management Board and of the importance of control in the entity framework and structure is meeting the primary objectives of the internal control system. Control environment include the following:
integrity and ethical values; management philosophy and management style; organizational structure; the allocation of powers and responsibilities; policies and practices related to human resources competence of personnel.
Impediments or damage to a person's objectivity and independence of the entity may include conflicts of interest, scope limitations, restrictions on access to documents and electronic records, goods, or certain persons employed or resource limitations (funding). Objectivity is therefore an impartial attitude of mind which allows auditors to carry out their tasks in a manner that demonstrates their sincere faith in the results of their work and that no significant compromises were made about the quality of work performed. Objectivity requires auditors not to subordinate their judgment to others. The internal audit activity should adopt a process to monitor and evaluate the overall effectiveness of quality control program. This process should include both internal assessment and external evaluation. Internal evaluations should include: ongoing review of internal audit performance; Periodic reviews performed through self-assessment or by other persons within the entity known internal audit practices and standards. External evaluations, such as quality assurance reviews must be conducted at least every five years by an independent auditor or an audit team and qualified independent outside entity. If independence or objectivity of the auditors could be affected in relation to proposed consulting services, they must be informed about the client that requested the task before accepting it. Independence is therefore the absence of conditions that threaten objectivity in fact or objectivity in appearance. Such threats to objectivity must be kept under control in the auditor's mission, operational and organizational level. In conclusion concerns the auditing department, division, department, team of consultants or other practitioner providing independent and objective assurance and consulting services that contribute to adding value to and improve the operations of the

226 Răvaș, B. entity. Auditing helps the organization to achieve its goals bringing a systematic and methodical approach to evaluating and improving the effectiveness of risk management processes, control, and governance of the entity. REFERENCES: [1]. Bătrâncea, I.; Dumbravă, P. (2007) Controlul şi auditul financiar al entităţii economice,
Editura Risoprint, Cluj Napoca [2]. Brezeanu, P.; Braşoveanu, I. (2008) Audit financiar, Editura Cavallioti, Bucureşti [3]. Dănescu, T. (2007) Proceduri şi tehnici de audit financiar, Editura Irecson, Bucureşti [4]. Greuning, H. (2009) Standarde Internaţionale de Raportare Financiară, Editura Irecson,
Bucureşti, 2009 [5]. Man, M.; Monea, A.; Mihăilă, E. (2003) Bazele contabilităţii, Editura Focus, Petroşani [6]. Popa, I.; Man, A. (2009) Auditul financiar de la teorie la practică, Editura Risoprint, Cluj
Napoca [7]. Răvaş, B. (2010) Audit financiar, Editura Universitas, Petrosani [8]. Răvaş, B. (2013) Auditul performanţei entităţilor economice din domeniul turismului,
Editura Sitech, Craiova [9]. *** Legea contabilităţii nr. 82/1991 cu modificările ulterioare [10]. *** Ordinul Ministrului Finanţelor Publice nr. 3055/2009

Annals of the University of Petroşani, Economics, 12(4), 2012, 227-234 227
INFORMATION AND STRATEGIC DECISIONS IN ECONOMIC ENTITIES MANAGEMENT
LUCIAN IOAN SABĂU *
ABSTRACT: Information and decision are two key elements economic entities management. Information represents the support of decision making by those managing the economic entity, helping them take the right decision for them to achieve set objectives. Strategic decisions provide long-term success of the economic entity outlining its internal and external stand. Those responsible for making strategic decisions have the ability to influence the economic entity’s success through these decisions they take, the role of the strategy being to ensure perfect correspondence between what the economic entity can do and what it could do, given the opportunities and threats in the environment they conduct business.
KEY WORDS: information; decision; strategy; strategic decision; strategic
management. JEL CLASSIFICATION: M12.
1. INFORMATION AND DECISION Everyone today uses information to help decision making. “Information
includes facts, ideas, and concepts that help us understand the world” (Ingram & Albright, 2007, p.3). However, to use information, we must be able to interpret and to understand its limits. Little information or even their misuse often leads to poor decisions, or, we might even say, inappropriate decisions.
Accounting provides information that is useful in decision making within an entity. This information is like a map for the entity, helping decision makers to know where they are, where they were and where they are heading. Unlike measuring distances on a map, which is made by using measurement units such as kilometers, accounting measures the activities of an entity in monetary units.
Accounting information is “specific economic information produced from the processing through methods, processes and instruments appropriate to accounting data.
* Ph.D. Student, “West ”University of Timișoara, Romania, [email protected]

228 Sabău, L.I. It is real, precise, complete, representing the dashboard, the support of economic, financial and management decisions taken by managers” (Epuran, et al., 2004, p.29).
In this way, we are passing to a decision and see that it is “the commitment to an action intended to produce satisfaction to certain parties, called beneficiaries, to those actions” (Yates, 2003, p.24). In his vision, an effective decision is one that “leads to satisfactory working conditions for its beneficiaries” (Yates, 2003, p.31).
Other author viewed the decision as “a choice of a course of action to achieve the desired future state” (Butler, 1998, p.37). It follows that for choice to occur, the presence of participants is needed, these need to be aware of the possibility of choice, and they must also be aware of an uncertainty level so that they can decide what action to take.
Reason represents the basic concept in decision making based on that decision makers can determine preferred outcomes, and can find ways to do so to achieve the desired results.
A decision is actually a choice between several alternatives. Lack of several alternative means no decision should be taken. Making rational decisions requires information. Decisions that managers, leaders of the economic entities, make have great importance for the economic entity, for its own employees, business partners and for the company as a whole.
Some authors noted that “there is no doubt that the long-term image of the accountant as a conservative, unsociable employee hidden behind an office in the back of a company has been completely shattered” (Gelinas & Dull, 2008). In the post Enron and WorldCom period, the primary objective of an entity is its administration. From this point of view, even the professional accountant is expected to take a leading role in enhancing administration, in identifying and mitigating an entity’s risks.
It can be said that decision is a characteristic both of human beings and of economic entities. Without decisions, an economic entity cannot conduct business, cannot evolve by taking advantage of opportunities and benefits that arise. At the same time, decisions help economic entities exceed crisis moments.
Before a decision is taken, the objectives, as well as available variants, alternatives, the manager has must be known.
Thus, we note that information is the key element in decision making. There are three types of information used to substantiate decisions (Clarke, 2002, pp.6), namely:
- Accounting information – which is quantified in financial terms (money);
- Information expressed in numerical terms, such as market share owned;
- Qualitative information (which can be quantified), such as, for example, information on employees’ experience and moral behavior. Accounting has as purpose “the recording and summarizing of the financial
information that is considered most relevant to different types of users to enable them to evaluate the performance and financial position of the reporting entity” (Clarke, 2002, p.6).
Just as capital, raw materials, labor are considered resources for an entity, so is information very important. We could say that it is sometimes crucial for the survival

Information and Strategic Decisions in Economic Entities Management 229 of the entity in the current economic environment, where competition is becoming stronger.
Information is used by decision makers and by other users to satisfy their internal needs. They represent internal users of information within an entity. Also, information is disseminated outside the entity to external users such as suppliers, customers and shareholders with an interest in the entity.
Some authors (Anthony, 1965, Kleindorfer et al., 1998, p.299) classify decisions into three types:
Routine decisions; Tactical decisions; Strategic decisions.
The transition from routine to strategy is in fact an increase in complexity, results with a wider coverage, much larger time horizons, justifying the time and resources assigned to their analysis.
Routine decisions are, by nature, repetitive, with a relatively small purpose, and minor consequences, being guided by organizational rules. Such decisions may be those relating to maintenance of equipment, purchase orders, invoicing, payroll, advertising, administrative costs. Routine decisions are taken in particular by clerks, secretaries, managers, salespeople, etc.
Tactical decisions refer to decisions on pricing, recruitment, marketing strategy, purchasing of raw materials and other resources, decisions on production and operations planning. These tactical decisions fall in middle management responsibilities. However, some of these decisions may contain strategic elements, but mostly these decisions do not have as effect changing the direction of an economic entity. Thus, the impact of tactical decisions on an economic entity is secondary compared to the impact of strategic decisions, although they can pretty much affect individuals, groups or entire departments. But given that tactical decisions in a certain period of time are more in number than strategic ones, their collective effect is as large as that of strategic decisions.
Strategic decisions have the following characteristics (Stellmaszek, 2010, p.34):
- They have a comprehensive perspective. Strategic decisions impact on the entire economic entity having a significant contribution to shaping its future development;
- They provide the long-term success of the economic entity. The main objective of strategic decisions is to create long lasting benefits the enabling economic entity to overcome its competitors;
- Delineate internal and external position of the economic entity. To obtain the advantages mentioned above, strategic decisions adapt the economic entity to the business environment in which it conducts business, sizing internal resources and its capabilities to achieve the desired position on the external market.

230 Sabău, L.I.
2. STRATEGIC DECISIONS
The term “strategy” is derived from the Greek word “strategos” being used as a
military term that refers to a general plan of arrangement and leading of an army to defeat the enemy army. We could say that businessmen like comparisons with their military counterparts. Therefore, they began to think about developing a strategy as a plan to control and use available resources, human, physical and financial ones, in order to promote and ensure the achievement of their own interests.
Unlike economists who do not take into account a wide range of issues, managers do this by outlining the economic entity’s future, considering a strategy to move towards the needs of the company, examining how efforts made lead to the achievement of objectives.
Research in the field of strategic decisions constitutes a concern not only in our times. Thus, we see that in 1958, March and Simon believed that decision making is in fact synonymous with the management of an entity (March & Simon, 1958). The very high dynamics of an entity requires an understanding of decision making. Managers are often forced to make choices from a wide range of alternatives that can sometimes be considered doubtful and they have to rationally choose so that both the entity and its owners benefit from these decisions.
Using the term “strategic” indicates that important decisions are taken in all types of entities.
Strategic decisions are actually more than simple judgments to choose from more possible solutions. Using mathematical models we can determine the existing risks, options we have and the best solutions we can take. All these mathematical models are useful in understanding the process of solutions’ choice, but are less useful when decisions are taken by individuals within an entity.
Over time we see that the use of the term “strategic” has done nothing else but create confusion rather than clarifying this term. Nutt & Wilson believe that strategic decisions have the following characteristics (Nut & Wilson, 2010):
- they are elusive problems that are difficult to define exactly;
- they require an understanding of the issue in order to offer a viable solution;
- in very rare cases, they have only a “best solution”, often having more possible solutions;
- in the solution arise questions about compromises and priorities;
- solution benefits are difficult to estimate, especially because most times they do not have a clear objective whose effectiveness can be measured;
- a high degree of uncertainty and ambiguity is associated with solutions. A definition of the terms “strategy” and “strategic decision” is found given by
Mintzberg. He defines strategy as “a model or plan which integrates major objectives of an organization and sequences of action into a coherent whole” (Mintzberg et al., 2003, p.10), while strategic decisions are defined as those that “determine the overall course of a company and its viability depending on expected, unpredictable and

Information and Strategic Decisions in Economic Entities Management 231 unknown changes from the environment in which the company conducts business” (Mintzberg et al., 2003, p.10). Strategic decisions actually define the true objectives of the entity. They establish the resources that the entity will have available to meet objectives and how these resources will be allocated.
Often we are tempted to interpret the word “strategy” as “plan” or “program”. But the meaning of the word “strategy” is actually more complex, it leading to increased economic performance. Joan Magretta believes that an effective strategy means “a way to get better performance by the fact of being different” (Magretta, 2012). 3. MANAGERS AND STRATEGIC MANAGEMENT
Starting from the fact that those who make these strategic decisions have a very important role in determining future strategy, we believe it is necessary to determine their role in making these strategic decisions.
In the literature we often encounter the term “managers”, “top management”. These are responsible for the results of strategic decisions. Therefore they will
check in detail starting data and will closely observe the results of these strategic decisions, even if not directly involved in activities.
Managers are those who have the executive position within the economic entity and are responsible for the origination and coordination of a whole system rather than carrying out specific tasks.
Drucker notes that, throughout history, the manager was defined as the one who is “responsible for the work of other individuals” (Drucker, 1999, p.15).
The successful manager is in Witzel’s vision the one that “has the ability to recognize opportunities when they arise and to exploit them” (Witzel, 2003, p.29).
The manager is the one who makes decisions “in mobilizing domestic stocks and exploiting opportunities to reduce them, with favorable consequences for improving economic stability and increasing economic performance” (Burja & Burja, 2010, p.43-50).
The manager is not merely an employee who proves that he/she obtained good results. In fact, the manager is the one who has leadership skills, he/she interrelates with employees, not being only concerned with his/her tasks. The manager does not rely only on himself/herself in his/her work, but also draws on the work of others. Manager may be assimilated with an artist, because leadership is a subjective and complex activity. We can say that the manager does not only have as activity decision making, but also has the role of a leader, a negotiator in relationships with third parties, and liaison with shareholders or associates.
Power believes that good decisions’ obstacles over which managers can act with some control over them are: traditions and prejudices and lack of information. (Power, 2002)
The first obstacle mentioned above on traditions is generated mainly due to the idea that managers sometimes have that “they have always done [things] this way”, they do not want to take into account a better alternative because of traditions and prejudices they have. This exaggerated closeness to tradition is actually a reflection of

232 Sabău, L.I. fear manifested towards new ideas, change, and the fear of fail by adopting new ideas, new decisions. These managers would rather stay behind old decisions and not risk new decisions that cannot provide the safety threshold they consider old traditions offer.
Regarding the lack of information, the second obstacle to a good decision, we can say that good and accurate information in due time is very important to reach a decision, but its absence can lead to bad decisions.
Today is very important for any economic entity to establish a strategy to follow.
Strategy determines where economic entity invests its resources, is responsible for ensuring that the economic entity has the flexibility to respond to changes that occur in the operating environment. We are witnessing in our days at major changes in the economy, customers having growing needs, becoming more demanding, while competitors in the local, national or international benefits of any weakness of the economic entity to get an advantage. However, before developing a strategy is necessary to developt an internal analysis of the economic entity.
This analysis is necessary to identify preferred areas of activity, the resources at its disposal, the organizational structure that is best suited for the type of activity they want to perform.
Unlike operational management which focuses on current activities in the economic entity on existing products and services, strategic management focuses on the future success of the economic entity.
Strategic management is defined as “the directing process of the organization in competition with other organizations” (Grant et al., 2011, p.4), or as “the establishment of corporate strategies in relation to market and the business environment opportunities and threats” (Hussey, 1998, pp.38).
Strategic management involves four basic components, namely: • explore the environment, by analyzing the internal and external factors that
affect the economic entity. This includes assesing market competition on which it acts and the impact of globalization on the economic entity's financial performance.
• Strategy formulation, which involves making strategic decisions regarding economic entity's objectives, its policies and its methods of achieving its objectives.
• Implementation of the strategy, which involves making decisions about organizational structure of the economic entity, type and source information systems, and not least, the control mechanism which will be implemented.
• Evaluation and control, which is the evaluation systems used to ensure that strategic planning leads to economic entity objectives. Evaluation, is actually the action of comparing the expected results with those realized.
Two of the most popular types of strategies are offensive and defensive strategies.
Offensive strategies are those that ensure the expansion of economic entities and entering new markets with new products and services. Offensive strategies are those that improve long term survival of the economic entity, economic entities forcing the competitors to adopt defensive strategies and consume resources to defend their position on the market. Defensive strategies, in contrast to the offensive, have as main

Information and Strategic Decisions in Economic Entities Management 233 features maintaining and enhancing existing market position. Such strategies allow economic entities vulnerable, giving competitors time to take them from the market held by them by creating a certain advantage.
Today there are various economic entities: small, medium, large, private or public, economic entities that have as object of activity production or services, local or global economic entities. The success of an economic entity depends on the characteristics of that economic entity and the environment in which it conducts business.
From this point of view, the role of strategy is to ensure perfect correspondence between what the economic entity can do (depending on its strengths and weaknesses) and what it could do (given the opportunities and threats in the environment it conducts business).
Those responsible for strategic decision making have the ability to influence the economic entity’s success through these decisions they make. Success is not the effect of chance or luck, it being assured by those responsible for decision making through strategic management. 5. CONCLUSIONS
We believe that today, strategic management has become a basic component of the management of economic entities, helping it in implementing and achieving strategies. This actually represents the way of managing an economic entity perfectly adapted to detect future problems that the economic entity may face, opportunities and threats that will arise in the future in a business environment where change occurs faster and faster.
Strategic management improves the results of economic entities, development, expansion and then maintaining and strengthening its economic environment in which they operate, while also improving its competitiveness.
We believe, that nowadays, economic entities should pay more importance to strategic management, to ensure their sustainable development and allow them to deal with the economic difficulties in the current period.
ACKNOWLEDGMENTS: This work was partially supported by the strategic grant POSDRU/ CPP107/DMI1.5/S/78421, Project ID78421 (2010), co-financed by the European Social Fund within the Sectorial Operational Program Human Resources Development 2007 – 2013.
REFERENCES: [1]. Alkhafaji, A.F. (2003) Strategic management: formulation, implementation, and control in
a dynamic environment, The Haworth Press, Inc., , New York [2]. Analoui, F.; Karami, F. (2003) Strategic Management in Small and Medium Enterprises,
Thomson Learning, Londra [3]. Anthony, R. (1965) Planning and Control Systems, Division of Research, Harvard
Business School, Boston

234 Sabău, L.I. [4]. Burja, C.; Burja, V. (2010) Analysis model for inventory management, Annals of the
University of Petroșani, 10(1), 2010, 43-50 [5]. Butler, R. (1998) Strategic Decision Making: A Contingency Framework, and Beyond, în
Strategic Decisions, Vassilis Papadakis și Patrick Barwise, Kluwer Academic Publishers, Massachusetts, USA
[6]. Clarke, P.J. (2002) Accounting Information for Managers. Second Edition, Oak Tree Press, Dublin
[7]. Drucker, P.F. (1999) Management :tasks, responsibilities,practices, Reed Educational and Professional Publishing Ltd., Wobrun
[8]. Epuran, M.; Băbăiță, V.; Imbrescu, C. (2004) Teoria contabilității, Editura Economică, București
[9]. Gelinas, U.G.; Dull, R.R. (2008) Accounting Information Systems, Ediția a 8-a, South-Western Learning, Manson OH
[10]. Grant, R.; Butler, B.; Hung, H.; Orr, S. (2011) Contemporary Strategy Analysis: an Australian perspective, John Wiley & Sons Australia
[11]. Hussey, D. (1998) Strategic Management: from theory to implementation - 4th edition , Reed Educational and Profesional Publishing Ltd, Woburn
[12]. Ingram, R.W.; Albright, T.L. (2007) Financial Accounting. Information for Decisions, Ediția a 6-a, South-Western Learning, Manson OH,
[13]. Kleindorfer, P.R.; Kunreuther, H.C.; Schoemaker, P.J.H. (1998) Decisions Sciences AnIntegrative Perspective, Cambridge University Press, Cambridge
[14]. Magretta, J. (2012) Understandng Michael Porter: the essential guide to competition and strategy, Harvard Business School Library, Boston,
[15]. March, J.G.; Simon, H.S. (1958) Organizations, John Wiley & Sons, New York [16]. Mintzberg, H.; Lampel, J.; Quinn, J.B. (2003) The strategy process: concepts, contexts,
cases, Person Education Limited, Harlow [17]. Nutt, P.C.; Wilson D.C. (2010) Handbook of decision making, John Wiley & Sons,
Chichister [18]. Power, D.J. (2002) Decision supportsSystems: concepts and resources for managers.,
Greenwood Publishing Group, Inc., Westport [19]. Stellmaszek, F. (2010) Real Options in Strategic Decisions. An Empirical Case Study
Analysis of How Companies Intergrate Real Options into Strategic Decisions, Pro Business, Berlin,
[20]. Witzel, M. (2003) Fifty Key Figures in Management, Routledge, New York [21]. Yates, J., F. (2003) Decision Management: How to Assure Better Decisions in Your
Company, John Wiley & Sons, San Francisco

Annals of the University of Petroşani, Economics, 12(4), 2012, 235-242 235
THE PERCEPTION OF TOURISM DEVELOPMENT IN WEST REGION OF ROMANIA
GABRIELA CORINA SLUSARIUC, ILIE RĂSCOLEAN *
ABSTRACT: The main goal of this study is the evaluation of impact perception upon West region of various programmes that have financed the development of touristic projects. KEY WORDS: tourism; economic development; European funds; employment; investments. JEL CLASSIFICATION: G32; H54; O11; O12. International economic integration represents a major characteristic of global economy evolution and a target of European and Romanian economy. The history of specialized literature has proven that in some stages the agriculture has been seen as an important source of economic growth, industry was considered a prime source of development, and now staple industries and services in top fields, based on advanced technologies, and also tourism to play an essential role. Of course these sources should be seen differentiated according to the region’s level of development, its potential, international, national and regional context where strategies and local policies are implemented and financing sources are used. Therefore, for economic recovery, we consider that an important point in the strategy of regional development of West area is tourism development, a goal that can be achieved mostly by financing this important field with European funds. The impact of European funds upon real convergence of European Union is a very analysed and debated subject, and the final conclusions show the fact that there is a positive correlation between structural funds, economic growth and occupancy at region level. The role of structural funds is basically co-financing investments in human and physical capital, with and impact upon demand and labour force occupancy (Ignat & Paraschiv, 2009, pp. 138-139).
* Lecturer., Ph.D., University of Petroşani, Romania, [email protected] Assoc. Prof., Ph.D., University of Petroşani, Romania, [email protected]

236 Slusariuc, G.C.; Răscolean, I. West Region is considered a developing region with significant economic results but which still confronts with economic and social problems. West Region of Romania is comprised by Banat historical province and adjacent areas and has a total area of 32034 km2.
Romania and West Region benefit of European financing resources, which were aimed among others for tourism, in pre-accession phase and also after.
So between 2000 and 2008, touristic projects were financed by Phare and National Fund for regional development. Phare program is one of the three instruments of pre-accession used by European Union to assist candidate countries from Central and East Europe to European Union. Created in 1989 to help just Poland and Hungary, the Phare Program was directed to a group of ten countries: Poland, Hungary, Slovakia, Slovenia, Bulgaria, Romania, Czech Republic, Estonia, Latvia and Lithuania. The main target of this study was the evaluation of the impact upon West Region of different PHARE programs and of those financed with National Fund of Regional Development carried out between 2000 and 2008. So during the period 2000-2008, in West Region have been financed by PHARE programs and NFRD a total number of 422 projects in a total amount of 101662482 Eu, the distribution of these funds over counties being balanced.
Table 1. Projects financed by PHARE programs and NFRD in West Region, including tourism, in period 2000-2008
Area Number of
projects Value of
projects-euro Tourism
projects % West Region 422 101.662482 Timiş 91 8% Arad 55 25.540.424 6% Hunedoara 165 25.868.373 12% Caraş Severin 99 24.808.719 4% More that one county 11 638.524 o%
Source: date processed by authors
The rate of sums allocated to tourism in West Region and in its counties represents approximately 8%. In the tourism sector, a total number of 23 financed projects have been implemented between 2000 and 2008, by private sector, public sector and also NGO institutions. Private sector wins by far the first place with 74%.

The Perception of Tourism Development in West Region of Romania 237
Figure 1. Kind of institution who financed tourism project
County distribution of the funds shown in figure no. 2 points out the fact that Hunedoara and Caras Severin counties have a higher rate of 35% ,respectively 30%
Figure 2. Distribution on Countyof Tourism Project in period 2000-2008 Analysing the type of financing in 2000-2008 can be observed the preponderance of national funds.
Figure 3. Tourism component –kind of finance
Between 2007 and 2013 Romania has benefit from European funds within the Regional operational programme. The Regional Operational Programme 2007 - 2013 is one of the Romanian operational programmes agreed with the European Union and a very important tool for implementing the national strategy and the regional development policies. It is applicable to all eight development regions of Romania.

238 Slusariuc, G.C.; Răscolean, I. In West region at the Regional Development Agency West which is an intermediary organism for the implementation of Regional Operational Programme 2007-2013, until May 2012 have been put in 713 projects in view of demanding non-refundable funds by Regional Operational Programme (ROP 2007-2013). Financial allocation for the West Region, administrated by Regional Development Agency West, is 417,92 million Euros.
Table 2. Total project in West Region financed by Regional Operational Programme in 2007-2013 period
Value of
projects in 2008
Value of projects in
2009
Value of projects in
2010
Value of projects in
2011
Value of projects in
2012 West Region
191167298.11 461209122.55 815213986.25 819905776.18 459974268.19
Timiş 104863344.26 33300993.99 295934198.12 288248858.31 164398748.99 Arad 73274179 62938398.93 209215159.75 200032464.42 59541416.84 Hunedoara 13029774.85 239663662 283707321 253607833.9 105231826.93 Caraş Severin
124306717.36 26357307.38 78016619.55 130802275.43
Source: data extracted from ADR Vest and processed by authors In order to finance tourism projects has been open a special axis, respectively Priority Axis 5: Sustainable development and tourism promotion, which financial allocation was 47.74 million Euros. Within the Axis that targets financing tourism there are 2 branches:
Restauration and sustainable exploitation of cultural patrimony, and also creation/modernisation of related infrastructure
Creation, development and modernization of tourism infrastructure for exploitation of natural resources and rising the quality of touristic services
For first branches „Restauration and sustainable exploitation of cultural patrimony, and also creation/modernisation of related infrastructure” Financial allocation was 25.32 million Euros.
Table 3. Projects for Restauration and sustainable exploitation of cultural
patrimony, and also creation/modernisation of related infrastructure
Project Number of project Non-refundable
value- million Euros Total projects 18 64,83
Contracted projects 4 31,80 Standby projects 5 6,06 Rejected projects 9 26,97
Source: data extracted from ADR Vest
Non-refundable funding applied for by these projects exceeds with 49.53% regional allocation.

The Perception of Tourism Development in West Region of Romania 239 For second branches „Creation, development and modernization of tourism infrastructure for exploitation of natural resources and rising the quality of touristic services” Financial allocation was 25,91 million Euros
Table 4. Projects for Creation, development and modernization of tourism infrastructure
for exploitation of natural resources and rising the quality of touristic services
Project Number of
project Non-refundable value
million Euros Total Projects 30 91,83 Contracted Projects: 8 29,10 Standby Projects 5 18,37 Rejected Projects 17 44,36
Source: data extracted from ADR Vest
Non-refundable funding applied for by these projects exceeds with 83,21% regional allocation. After projects implementation in tourism domain, financed by european funds since 2000 till present, there are several direct effects:
new jobs created new tourists new services and products qualified personnel rehabilitated and new infrastructure modern leisure time spending areas.
The inquiry has been realized by using questionnaire as an instrument of investigation. The target group is made out of tourists in a proportion of 60% and 40% is from promoting organizations of services and touristic offer. The questionnaires have 24 questions, of all types: closed, open, variable, filter and appreciation scale. Filling the questionnaire was estimated to take about 10 to 13 minutes. Sending the questionnaires was mad by post. After receiving the questionnaires from the respondent there were created data bases by introducing the information from the questionnaires. To analyse the data, statistic analysis software like SPSS 16 and Microsoft Office Excel were used. Percentage distribution of the actual activities achieved after the financing by European funds of afferent actions of tourism show the following: promoting activities of touristic area with web pages, tourism publications, flyers activities of touristic consultancy development and modernization of accommodation units personnel training in tourism investments in equipment.

240 Slusariuc, G.C.; Răscolean, I.
Figure 4. Percentage distribution of the actual activities achieved after the financing by European funds
At impact level of the analysis it has been followed the way the projects influenced the development of tourism. Therefore, the respondents have been given an appreciation scale of the impact of financing touristic activities. Within the analysis of the results of questionnaires the following results revealed: the impact upon growth of satisfaction factor of tourists was considered strong
40%; the impact upon tourism promotion, was considered powerful and medium 40% ; the impact upon quality of touristic services was considered strong 60%; the impact upon growth of tourist number was medium; the impact upon diversifications of touristic offer was considered strong and
medium 40%; the impact upon improvement of access infrastructure to touristic objectives is
strong.
Table 5. Appreciation of financing impact of tourism activities
Question None Poor Mediu
m Strong
Very strong
Not the case
Diversification of touristic offer 0% 0% 40% 40% 0% 20% Promotion of touristic area 0% 0% 40% 40% 0% 20% Growth of hotel occupancy 0% 0% 60% 20% 20% 0% Development of touristic objectives
0% 20% 60% 0% 0% 20%
Growth of tourists satisfaction 0% 20% 20% 40% 0% 20% Growth of services quality 0% 0% 20 60 0% 20

The Perception of Tourism Development in West Region of Romania 241
Growth of reservation number/day
0% 0% 60% 20% 0% 20%
Improvement of touristic infrastructure
0% 40% 60% 0% 0% 0%
In the following table are presented the average numbers and standard deviation values resulted by every indicator appreciation of the impact. The appreciation scale allows an average of rank of a minimum 1 for a very poor impact and a maximum 5 for very strong impact.
Table 6. Average numbers and standard deviation values resulted by every indicator appreciation of the impact
Question Average Standard deviation
Unemployment decrease 2,5 0,7 Diversification of touristic offer 3,5 0,5 Promotion of touristic area 3,5 0,58 Growth of hotel occupancy 3,25 0,5 Development of touristic objectives 2,75 0,5 Growth of tourists satisfaction 3,25 0,96 Growth of services quality 3,75 0,5 Growth of reservation number/day 3,25 0,5 Improvement of touristic infrastructure 2,0 0 Also the respondents assessed the overall impact level of the unrolling projects and the way in which the projects helped to development of organization: from the point of view of overall impact related to program objectives, 43%
assessed a strong level, this situation being reflected also in the level of obtained average (3.4) with a standard deviation value of 0.89;
from the point of view of impact upon development of organization was assessed an average level of 37% and subsequently strong (31.3%), this generating a decrease of the average to a value of 3.8 for a standard deviation of 0.84.
Figure 5. Assessing the impact of financing

242 Slusariuc, G.C.; Răscolean, I. In conclusion, the perception tenderers and tourism consumers is strongly positive concerning the favourable impact of European funds in development of touristic West Region. Therefore, regional economic development, seen as an economic progress factor needs at national level but especially at regional level, important financial non-refundable resources. Structural instruments of European Union can contribute decisively to modernization and development of tourism and to ensure of a durable development in Europe. REFERENCES: [1]. Ignat, I.; Paraschiv, R. (2009) Educatie si performanta economica, Editura Universitatii
Alexandru Ioan Cuza, Iasi, pp.138-139 [2]. Flauzat, D. (1999) Economie contemporaine, P.U.F., Paris [3]. Martin, H.P.; Schumann, H. (1999) Capcana globalizării: atac la democratie si
bunăstare, Editura Economica, Bucuresti [4]. Oţil, M.; Părean, M. (2010) Macro-Regional Disparities in Romania, Annals of the
University of Petroşani, Economics, 10(2), pp.255-266 [5]. Slusariuc, G. (2009) Considerations Regarding Strategic Plan Of Rural Development,
Simpozion Stiintific International, Universitatea de Stiinte Agricole si Medicina Veterinara a Banatului, Timisoara, pp.459-467
[6]. Slusariuc, G. (2007) Regional Development From European Programms, Annals of the University of Petrosani, vol 2, Universitas, Petrosani
[7]. http://eufinantare.info/Documente/analiza_impact_phare-3iunie2009-adrvest.pdf [Accessed October 2012]
[8]. http://www.strategvest.ro/media/dms/file/Studii/Analiza%20de%20impact%202000- 2008.pdf [Accessed October 2012]

Annals of the University of Petroşani, Economics, 12(4), 2012, 243-254 243
THE PROGNOSIS OF TOTAL PUBLIC EXPENDITURES AND TYPES OF EXPENDITURES IN ROMANIA
ANA-PETRINA STANCIU, PETRE BREZEANU *
ABSTRACT: The purpose of the paper is to provide a prognosis of total public expenditure and types of expenditures, starting from the evolution in time of total public expenditure and spending on public services, defense, public order and safety, economic affairs, environmental protection, housing and community amenities, health, recreation, culture and religion, education and social protection.
KEY WORDS: public expenditure; time; evolution; prognosis. JEL CLASSIFICATION: E60; H50.
For the analysis to be made, we considered as input time and as output variable each category of public expenditure individually.
To analyze the time evolution of different categories of public expenditure in Romania we took into considered a period of 16 years, between 1995 and 2010.
For forecasting, we used the following data (Table 1), expressed in million EUR, obtained from Eurostat. Since data provided by Eurostat at the time are available only up to 2010, the analysis of the evolution of public expenditure stops at the level of this year, and for the years 2011 and 2012 we are making a prognosis to predict public spending. To ensure international comparability, we used the euro as monetary unit.
Table 1. The volume of total public expenditure and types of expenditures in Romania, 1995-2010
- mil. Euro-
Years Total public expenditure
Public services National defense Public order and national security
Economic affairs
1995 9807.3 1047.4 686.8 385.5 2354.0 1996 9629.8 1095.3 686.6 459.9 1973.1
* Ph.D. Student, Academy of Economic Studies, Bucharest, Romania, [email protected] Prof., Ph.D., Academy of Economic Studies, Bucharest, Romania, [email protected]

244 Stanciu, A.P.; Brezeanu, P.
1997 10894.7 2132.1 792.8 229.1 1771.0 1998 13277.8 2720.2 294.9 200.3 2044.0 1999 13237.8 3482.8 622.5 551.6 1523.7 2000 15674.1 3212.2 878.0 913.8 2274.6 2001 16424.7 2926.9 858.7 718.7 2218.5 2002 17020.0 2604.7 1080.8 967.6 2133.2 2003 17588.7 2181.9 1331.7 973.8 2579.4 2004 20489.7 2384.7 1340.9 1118.2 3431.2 2005 26808.0 2611.8 2375.5 1682.9 4208.2 2006 34743.9 3211.3 2253.6 2340.8 6760.3 2007 47690.7 5406.7 2237.3 3054.9 10400.4 2008 54906.0 6533.5 2074.3 3139.1 10955.4 2009 48585.6 4959.9 1770.6 2554.4 9087.1 2010 49875.0 5522.1 1828.4 3008.2 8466.8
Table 2. The volume of total public expenditure and types of expenditures in
Romania, 1995-2010 -mil. Euro-
Years Environmental
protection Constructions
and arrangementsHealth
Recreation, culture
and religion Education
Social protection
1995 51.5 427.9 684.9 179.2 960.6 3029.5 1996 37.5 441.1 671.1 223.9 1053.7 2987.6 1997 78.6 452.2 616.3 346.7 997.6 3478.3 1998 12.0 502.1 975.5 525.6 1502.3 4500.9 1999 10.2 454.1 1274.4 190.7 1059.7 4068.0 2000 90.6 585.2 1699.7 297.3 1293.4 4429.3 2001 120.8 654.8 1855.3 264.1 1752.5 5054.2 2002 115.0 940.4 2002.9 306.6 1950.1 4918.7 2003 104.1 1078.3 1815.6 376.4 1864.4 5283.3 2004 75.1 1264.2 1553.8 415.8 2208.1 6697.8 2005 254.5 1288.5 2147.8 532.1 2869.5 8837.4 2006 344.1 1435.4 2633.4 988.3 4027.1 10749.6 2007 520.8 1938.0 3864.8 1354.6 4914.8 13998.4 2008 678.1 1833.4 4506.3 1583.7 6252.9 17349.3 2009 679.4 1638.7 4530.2 1275.6 4830.9 17258.7 2010 910.2 1624.1 4498.7 1313.7 4160.3 18542.6
Source: http:epp.eurostat.eu.europa.eu Next, we are making predictions of components involved in the calculation of
public expenditure in relation to time. From the evolution in time of total public expenditure (Figure 1), we notice that it is approximated by a third degree polynomial of the following form:
2 30 1 2 3p x p p x p x p x (1)
Polynomial interpolation parameter values above are:

The Prognosis of Total Public Expenditures and Types of … 245
0p 104347653508.07 ; 1p 155861584.35 ; 2p 77599.7595 ;
3p -12.877938763
Figure 1. The evolution of total public expenditure in Romania, 1995-2010
Values forecasted for total public expenditure for 2011 and 2012 are given in Table 3.
Table 3. Forecast of total public expenditure for 2011 and 2012
Time [years] Total expenditure [mil Euro] 2011 60188 2012 64903
Source: Own processing If we follow the graph given in Figure 1, the increase of total public spending in 2011 and 2012 is obvious. The evolution in time during the period under consideration of spending on public services is given in Figure 2.
This is well approximated by a polynomial of degree three:
2 30 1 2 3p x p p x p x p x (2)
Polynomial interpolation parameter values above are:
0p -37276233826.59 ; 1p 55871678.3 ; 2p -27914.556472 ;
3p 4.6488882323
Values forecasted for expenditure on public services for 2011 and 2012 are given in Table 4. We can observe a similar growing trend for spending on public services, such as in case of total public expenditure.

246 Stanciu, A.P.; Brezeanu, P.
Figure 2. The evolution of spending on public services in Romania, 1995-2010
Table 4. Forecast of expenditure on public services for 2011 and 2012
Time [years] Public services [mil Euro] 2011 7586.7 2012 9055.3
Source: Own processing
The evolution in time during the period under consideration of spending on national defense is shown in Figure 3, and they can be approximated by a polynomial interpolation of degree five:
Figure 3. The evolution of spending on national defense in Romania, 1995-2010
2 3 4 50 1 2 3 4 5p x p p x p x p x p x p x (3)

The Prognosis of Total Public Expenditures and Types of … 247 Polynomial interpolation parameter values above are:
0p -2445555949363593 ; 1p 6104703676093.988 ;
2p -6095513282.404293 3p 3043159.374245 ; 4p -27914.556472 ;
5p 0.0758489685661
Values forecasted for expenditure on national defense for 2011 and 2012 are given in Table 5.
Table 5. Forecast of expenditure on national defense for 2011 and 2012
Time [years] National defense [mil Euro] 2011 1686.5 2012 1971.5
Source: Own processing If we look at the forecast of expenditure on national defense , we see in Figure 3, that while in 2011, an year when Romania was still affected by the crisis, there were significant decreasing in spending for national defense, for the next year it registered an increase. Regarding spending on public order and safety in Romania, the evolution in time is given in Figure 4. The interpolation polynomial that approximates these values is degree three:
2 30 1 2 3p x p p x p x p x (4)
Polynomial interpolation parameter values above are:
0p 16213454844.39 ; 1p -24266379.0836 ; 2p 12106.1945991 ;
3p -2.01318431764 .
Figure 4. The evolution of spending on public order and national security in Romania, 1995-2010

248 Stanciu, A.P.; Brezeanu, P. Values forecasted for expenditure on public order and national security for 2011 and 2012 are given in Table 6.
Table 6. Forecast of expenditure on public order and national security 2011 and 2012
Time [years] Public order and national security [mil Euro]
2011 3193.0 2012 3204.3
Source: Own processing It can be seen that for the two years for which the forecast was made,
expenditure on public order and national security registered a slight increase from previous years. The evolution of spending on economic affairs for the period under consideration is given in Figure 5. The interpolation polynomial that approximates these values is degree three:
2 30 1 2 3p x p p x p x p x (5)
Polynomial interpolation parameter values above are:
3p -8.102572158966 ; 2p 48734.84694 ; 1p -97708054.551 ;
0p 16213454844.394
Values forecasted for expenditure on economic affairs for the two years taken into consideration are given in Table 7.
Figure 5. The evolution of spending on economic affairs expenditure in Romania, 1995-2010

The Prognosis of Total Public Expenditures and Types of … 249
Table 7. Forecast of expenditure on economic affairs for 2011 and 2012
Time [years] Economic affairs [mil Euro] 2011 10282 2012 10279
Source: Own processing Another category is spending on environmental protection. As shown in Figure
6, it appears that this sector was not affected by the economic crisis, and therefore, the values for expenditure on environmental protection are increasing for 2011 and 2012.
Figure 6. The evolution of spending on environmental protection in Romania, 1995-2010 Interpolation polynomial which approximates the time evolution of spending
on environmental protection is:
2 30 1 2 3p x p p x p x p x (6)
Polynomial interpolation parameter values above are:
0p 16213454844.394 ; 1p 3652798.9142 ; 2p -1830.80491 ;
3p 0.30586944768
Table 8. Forecast of expenditure on environmental protection for 2011 and 2012
Time [years] Environmental protection [mil Euro] 2011 1128.7 2012 1364.2
Source: Own processing

250 Stanciu, A.P.; Brezeanu, P.
Figure 7. The evolution of spending on constructions and arrangements in Romania, 1995-2010
Figure 7 presents the evolution in time of spending on constructions and
arrangements. The interpolation polynomial that approximates these values is degree two:
20 1 2p x p p x p x (7)
Polynomial interpolation parameter values above are:
0p 6565750.38764 ; 1p -6665.34955 ; 2p 1.69142156872
Table 9. Forecast of expenditure on constructions and arrangements for 2011-2012
Time [years] Constructions and arrangements [mil Euro] 2011 2045.9 2012 2185.1
Source: Own processing Values forecasted for expenditure on constructions and arrangements for 2011 and 2012 are given in Table 9. We can notice that although the sector has been affected by the crisis, there is still an increase in this category.
Figure 8 presents the evolution in time of spending on health. Data series considered are approximated by a polynomial of degree four:
2 3 40 1 2 3 4p x p p x p x p x p x (8)
Polynomial interpolation parameter values above are:
0p -6148938754394.371 ; 1p 12278736736.05201 ; 2p -9194681.7287 ;
3p 3060.09853 ; 4p -0.38191225308
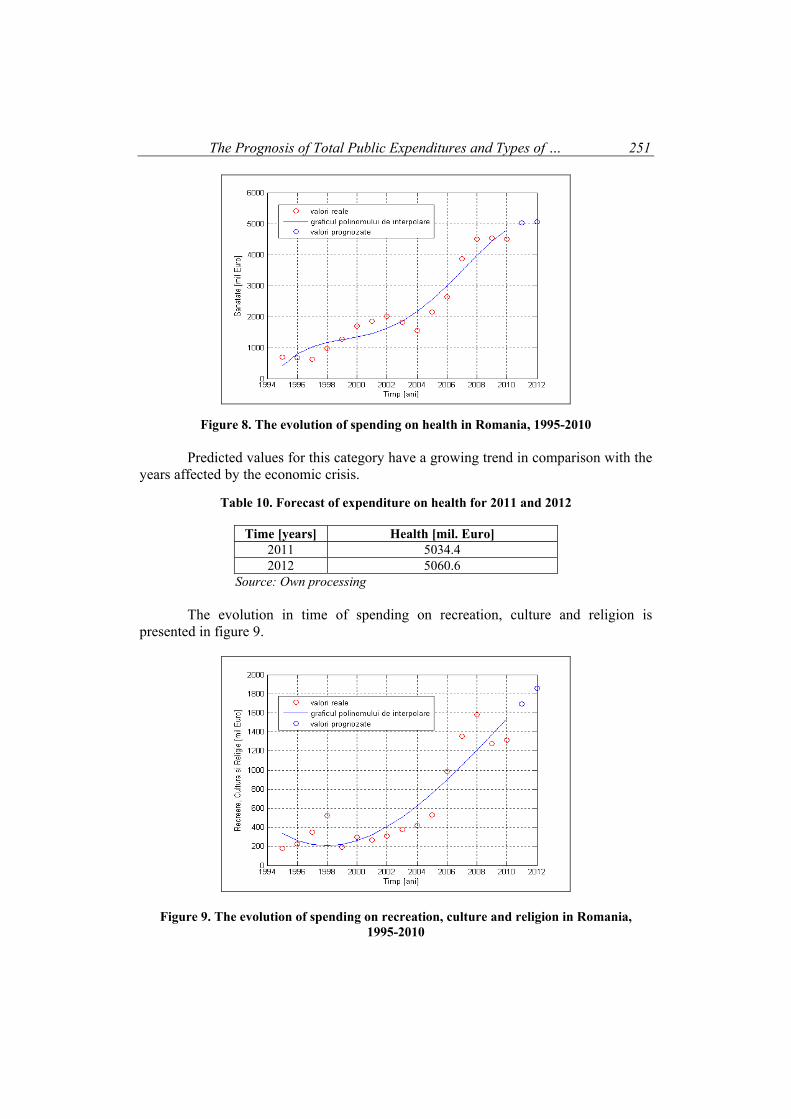
The Prognosis of Total Public Expenditures and Types of … 251
Figure 8. The evolution of spending on health in Romania, 1995-2010
Predicted values for this category have a growing trend in comparison with the years affected by the economic crisis.
Table 10. Forecast of expenditure on health for 2011 and 2012
Time [years] Health [mil. Euro] 2011 5034.4 2012 5060.6
Source: Own processing The evolution in time of spending on recreation, culture and religion is presented in figure 9.
Figure 9. The evolution of spending on recreation, culture and religion in Romania, 1995-2010

252 Stanciu, A.P.; Brezeanu, P. Although expenditure on recreation, culture and religion has been affected by the economic crisis, in years 2011 and 2012 more funds were allocated for this sector. Polynomial interpolation resulted from approximating the data series is:
2 30 1 2 3p x p p x p x p x (9)
Polynomial interpolation parameter values above are:
0p 3226285332.7476 ; 1p -4816438.7658 ; 2p 2396.69912 ;
3p -0.397525504947 .
Table 11. Forecast of expenditure on recreation, culture and religion for 2011 and 2012
Time [years] Recreation, culture and religion [mil Euro] 2011 1695.1 2012 1854.5
Source: Own processing
For the period taken into considered, spending on education has the following evolution (figure 10):
Figure 10. The evolution of spending on education in Romania, 1995-2010
The polynomial interpolation is degree three:
2 30 1 2 3p x p p x p x p x (10)
Polynomial interpolation parameter values above are:
0p 33270444518.294 ; 1p -49809928.484 ; 2p 24856.9405 ;
3p -4.134793560825 .

The Prognosis of Total Public Expenditures and Types of … 253
Table 12. Forecast of expenditure on education for 2011 and 2012
Time [years] Education [mil Euro] 2011 4974.1 2012 4751.7
Source: Own processing Estimated data in Table 12 show that the education budget is still very small, but slightly increasing. Expenditure on social protection in Romania for the period 1995-2010 has the following evolution (figure 11):
Figure 11. The evolution of spending on social protection in Romania, 1995-2010
2 30 1 2 3p x p p x p x p x (11)
Polynomial interpolation parameter values above are:
0p -8659575252.2007 ; 1p 13174167.4593 ; 2p -6679.75558 ;
3p 1.128783346282
Table 13. Forecast of expenditure on social protection for 2011 and 2012
Time [years] Social protection [mil Euro] 2011 22829 2012 25960
Source: Own processing It may be noted that expenditure on social protection is increasing in comparison with previous years, the share in GDP is significant compared to other sectors.

254 Stanciu, A.P.; Brezeanu, P. Because of the global financial crisis, that occurred in August 9, 2007, mainly due to unrest in the American market which was reflected on the Stock Exchange, many economies were adversely affected, including our country that has been severely tested over the last years. CONCLUSION
As shown in graphical representations of the evolution in time of total public expenditure and by category, in 2009, 2010 and 2011 curves that approximate the data are affected by their low values, except those for environmental and social protection. However, predictions made in the years 2011 and 2012 show a slight increase of public expenditure values overall and by category. REFERENCES: [1]. Ilie, A.G.; Dumitru, D.; Zaharia R.M.; Colibaşanu O.A. (2009) Public Expenditure on
Higher Education. Case Study: Romanian Universities, International Review of Business Research Papers, Vol.5, No.1
[2]. Moşteanu, T. (coord.) (2008) Finanţe publice, Editura Universitară, Bucureşti [3]. Obreja Braşoveanu, L. (2010) The impact of defense expenditure on economic growth,
Romanian Journal of Economic Forecasting, Volume 13, No. 4 [4]. Văcărel, I. (coord.) (2007) Finanţe publice, Editura Didactică şi Pedagogică, Bucureşti [5]. Eurostat - European statistics

Annals of the University of Petroşani, Economics, 12(4), 2012 255
Index of Authors
A Atanasoaie, G. (5) Axinte, G. (193) B Bahnaru, M. (109) Bratu (Simionescu), M. (17) Brezeanu, P. (243) C Cenuşe, M. (33) Chaiboonsri, C. (39) Chaitip, P. (39) Cucu, C. (53) D Danatie Enescu, M. (203) David, A. (33) Dobre-Baron, O. (61) Dumbravă, G. (77) Dura, C. (85) G Ghicajanu, M. (85) Guță, A.J. (95) I Isac, A.C. (103) Isac, C. (109)
K Kar, J. (117) M Manole, O. (129, 137) Matei, G. (137) N Necșulescu, C. (129) O Okwiet, B. (147, 155) Oprițescu, E.M. (169) P Petrini, M. (177, 185) Pîrvu, R. (193, 203) Popa, C.E. (211) R Răscolean, I. (235) Răvaş, B. (219) S Sabău, L.I. (227) Slusariuc, G.C. (235) Stanciu, A.P. (109, 243)
The authors are entirely responsible for the content of their article. The publication of the papers in the Annals of the University of Petroşani - Economics
is the result of a peer review evaluation process. The papers were reviewed by the members of the Advisory Board.