Annals of Internal Medicine Academia and Clinic · In an article published in Annals of Internal...
16
Do Oscar Winners Live Longer than Less Successful Peers? A Reanalysis of the Evidence Marie-Pierre Sylvestre, MSc; Ella Huszti, MSc; and James A. Hanley, PhD In an article published in Annals of Internal Medicine in 2001, Redelmeier and Singh reported that Academy Award–winning ac- tors and actresses lived almost 4 years longer than their less suc- cessful peers. However, the statistical method used to derive this statistically significant difference gave winners an unfair advantage because it credited an Oscar winner’s years of life before winning toward survival subsequent to winning. When the authors of the current article reanalyzed the data using methods that avoided this “immortal time” bias, the survival advantage was closer to 1 year and was not statistically significant. The type of bias in Redelmeier and Singh’s study is not limited to longevity comparisons of persons who reach different ranks within their profession; it can, and often does, occur in nonexperimental studies of life- or time-extending benefits of medical interventions. The current authors suggest ways in which researchers and readers may avoid and recognize this bias. Ann Intern Med. 2006;145:361-363. www.annals.org For author affiliations, see end of text. T he large survival advantage—almost 4 years—for Acad- emy Award–winning actors and actresses over their less successful peers (1) continues to receive attention. We point out that the statistical method used to derive the statistically significant survival difference gave the Oscar winners an unfair advantage. We suggest how readers might recognize and avoid similar biases in other research reports. Redelmeier and Singh’s report (1) was based on 235 Oscar winners, 527 nominees (nonwinners), and 887 per- formers who were never nominated (controls). Controls were selected from performers who were the same sex and approximately the same age in years as the nominees and who performed in the movies for which the nominees were nominated. In the primary analysis, survival was measured from performers’ day of birth, but other definitions of “time zero” were also used. In all but 1 of the Kaplan– Meier, log-rank, and Cox proportional hazards analyses re- ported, each performer was classified as a winner or non- winner from the outset. One reported analysis used winner as a time-dependent covariate to reflect the fact that all started out as nonwinners but that some changed status over time. In Redelmeier and Singh’s more emphasized compar- ison, Kaplan–Meier curves showed that life expectancy was 3.9 years longer for winners. The Cox model, with winner as a fixed-in-time covariate, yielded mortality rate reduc- tions ranging from 28% (no adjustment) to 23% (adjust- ment for 7 other covariates), all with 95% confidence lim- its more than 0%. The 1 reported set of analyses that treated each performer’s status as dynamic (time-depen- dent) yielded a mortality rate reduction of 20%; the lower limit of the CI was 0%, that is, the reduction was just significant at the conventional level (P 0.05). Re- delmeier and Singh’s abstract and their Figure focused on the 3.9-year life-expectancy advantage and the 28% mor- tality rate reduction for winners, which were obtained without adjustment and without taking into account that a performer’s status changed with time. The analyses that classified those who ultimately won as winners from the outset gave them an inbuilt survival advantage by crediting the winner’s life-years before win- ning toward survival subsequent to winning. These “im- mortal” years (2, 3) were a requirement for membership in the winners’ group: Winners had to survive long enough to win—more than 79 years in the 2 most extreme cases (Fig- ure). Performers who did not win had no minimum sur- vival requirement, and some died before some winners had won, that is, before some “longevity contests” could begin. For example, 145 nonwinners had already died by age 65 years, that is, before 15 of the winners had won. These unfair pairings (for example, Richard Burton vs. George Burns) were implicitly included in the overall longevity contest between the 2 groups and contributed to the ap- parent survival advantage of the winners, even if winning brought no survival benefit. To estimate the longevity benefits of winning an Os- car, the comparison should begin at the time that each performer first wins, and the “remaining longevity” contest should only include those alive at the same age as the winner was when he or she won. A winner may legiti- mately be included in comparisons (risk sets) before win- ning, but only as a nonwinner. An analysis in which the status of a performer who won is treated as a winner throughout, even in risk sets before winning, produces an “immortal time” bias. As we illustrate in the Figure, a longevity that is measured from a time zero that precedes the performer’s Oscar win (for ex- ample, an individualized one, such as the day each per- See also: Print Related letters............................. 392 Web-Only Appendix Appendix Figure Conversion of figures and table into slides Annals of Internal Medicine Academia and Clinic © 2006 American College of Physicians 361
Transcript of Annals of Internal Medicine Academia and Clinic · In an article published in Annals of Internal...

Do Oscar Winners Live Longer than Less Successful Peers?A Reanalysis of the EvidenceMarie-Pierre Sylvestre, MSc; Ella Huszti, MSc; and James A. Hanley, PhD
In an article published in Annals of Internal Medicine in 2001,Redelmeier and Singh reported that Academy Award–winning ac-tors and actresses lived almost 4 years longer than their less suc-cessful peers. However, the statistical method used to derive thisstatistically significant difference gave winners an unfair advantagebecause it credited an Oscar winner’s years of life before winningtoward survival subsequent to winning. When the authors of thecurrent article reanalyzed the data using methods that avoided this“immortal time” bias, the survival advantage was closer to 1 year
and was not statistically significant. The type of bias in Redelmeierand Singh’s study is not limited to longevity comparisons of personswho reach different ranks within their profession; it can, and oftendoes, occur in nonexperimental studies of life- or time-extendingbenefits of medical interventions. The current authors suggest waysin which researchers and readers may avoid and recognize this bias.
Ann Intern Med. 2006;145:361-363. www.annals.orgFor author affiliations, see end of text.
The large survival advantage—almost 4 years—for Acad-emy Award–winning actors and actresses over their less
successful peers (1) continues to receive attention. Wepoint out that the statistical method used to derive thestatistically significant survival difference gave the Oscarwinners an unfair advantage. We suggest how readersmight recognize and avoid similar biases in other researchreports.
Redelmeier and Singh’s report (1) was based on 235Oscar winners, 527 nominees (nonwinners), and 887 per-formers who were never nominated (controls). Controlswere selected from performers who were the same sex andapproximately the same age in years as the nominees andwho performed in the movies for which the nominees werenominated. In the primary analysis, survival was measuredfrom performers’ day of birth, but other definitions of“time zero” were also used. In all but 1 of the Kaplan–Meier, log-rank, and Cox proportional hazards analyses re-ported, each performer was classified as a winner or non-winner from the outset. One reported analysis used winneras a time-dependent covariate to reflect the fact that allstarted out as nonwinners but that some changed statusover time.
In Redelmeier and Singh’s more emphasized compar-ison, Kaplan–Meier curves showed that life expectancy was3.9 years longer for winners. The Cox model, with winneras a fixed-in-time covariate, yielded mortality rate reduc-tions ranging from 28% (no adjustment) to 23% (adjust-ment for 7 other covariates), all with 95% confidence lim-its more than 0%. The 1 reported set of analyses thattreated each performer’s status as dynamic (time-depen-dent) yielded a mortality rate reduction of 20%; the lowerlimit of the CI was 0%, that is, the reduction was justsignificant at the conventional level (P � 0.05). Re-delmeier and Singh’s abstract and their Figure focused onthe 3.9-year life-expectancy advantage and the 28% mor-tality rate reduction for winners, which were obtainedwithout adjustment and without taking into account that aperformer’s status changed with time.
The analyses that classified those who ultimately won
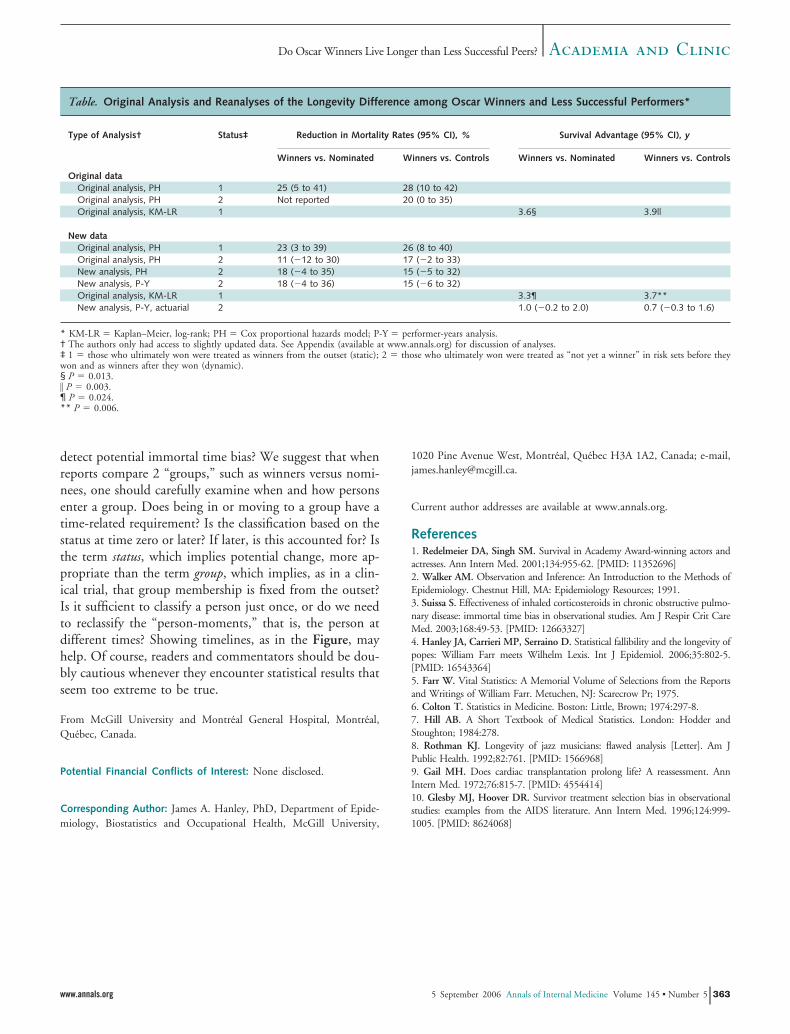
as winners from the outset gave them an inbuilt survivaladvantage by crediting the winner’s life-years before win-ning toward survival subsequent to winning. These “im-mortal” years (2, 3) were a requirement for membership inthe winners’ group: Winners had to survive long enough towin—more than 79 years in the 2 most extreme cases (Fig-ure). Performers who did not win had no minimum sur-vival requirement, and some died before some winners hadwon, that is, before some “longevity contests” could begin.For example, 145 nonwinners had already died by age 65years, that is, before 15 of the winners had won. Theseunfair pairings (for example, Richard Burton vs. GeorgeBurns) were implicitly included in the overall longevitycontest between the 2 groups and contributed to the ap-parent survival advantage of the winners, even if winningbrought no survival benefit.
To estimate the longevity benefits of winning an Os-car, the comparison should begin at the time that eachperformer first wins, and the “remaining longevity” contestshould only include those alive at the same age as thewinner was when he or she won. A winner may legiti-mately be included in comparisons (risk sets) before win-ning, but only as a nonwinner.
An analysis in which the status of a performer whowon is treated as a winner throughout, even in risk setsbefore winning, produces an “immortal time” bias. As weillustrate in the Figure, a longevity that is measured from atime zero that precedes the performer’s Oscar win (for ex-ample, an individualized one, such as the day each per-
See also:
PrintRelated letters. . . . . . . . . . . . . . . . . . . . . . . . . . . . . 392
Web-OnlyAppendixAppendix FigureConversion of figures and table into slides
Annals of Internal Medicine Academia and Clinic
© 2006 American College of Physicians 361

former’s first film was released, or a common one, such aseach performer’s initial or 50th birthday, as used in Re-delmeier and Singh’s analysis [1]) will necessarily containsome immortal time. No immortality guarantee exists forthose who do not win. In a similar manner, the matchingprocess, involving a performer who played opposite a nom-inee, ensured that a control was alive when a person whoultimately won was nominated but not necessarily whenthat winner won (the comparison of 235 winners vs. 527other nominees did not involve a matching process).
The authors reported 1 analysis in which each per-former’s status was updated in each risk set. In the Table,we compare the results from the types of analyses they used(original) with our reanalyses (new). Our methods are de-scribed more fully in the Appendix, available at www.annals.org. All of our analyses treat each performer’s statusas dynamic. The database on which our analyses are basedis available at www.annals.org. In our reanalyses, whichtake the immortal time as well as the covariates sex andyear of birth into account, the point estimate of the actu-arial advantage is approximately 1 year and is not statisti-cally significantly different from 0 (the 95% CI is compat-ible with 0). The estimated percentage mortality ratereduction is also correspondingly smaller.
We directly estimated the magnitude of the immortaltime bias (Appendix, available at www.annals.org). In ourcomparison of winners versus nominees, we estimated thatnot accounting for immortal time produced an artifactuallongevity advantage of 0.8 year and a mortality rate ratio of0.94. In the comparison of winners versus controls, notaccounting for the immortal time—now more substan-tial—between the year of a winning performer’s first filmand the year he or she first won produced an artificiallongevity advantage of 1.7 years and a mortality rate ratioof 0.87.
In 1843, William Farr (5) described the statistical ar-tifact created by classifying persons by their status at theend of follow-up and analyzing them as if they had been inthese categories from the outset. He used as examples thegreater longevity of persons who reached higher rankswithin their professions (bishops vs. curates, judges vs.barristers, and generals vs. lieutenants). Despite textbookwarnings (2, 6, 7), analyses overlooking this subtle bias arestill common today.
In some longevity comparisons (1, 4, 8), the conse-quences of an incorrect conclusion are minor. In the eval-uation of the time-extension benefits of therapy (3, 9, 10),the consequences are more serious. Therefore, how do we
Figure. Lexis diagram showing life course for 9 selected performers (all nominated), along with their status at the time of the 8risk sets (1 at each death).
A Lexis diagram (4) represents each performer’s time course as a diagonal line, with advancing age on the vertical axis and advancing calendar time onthe horizontal axis. Winners, by virtue of their having lived long enough to win, were, in hindsight, “immortal” in the years that preceded their win.Circles and squares at the left of the figure indicate ages at which winners won and ages at death of those who died without winning.
Academia and Clinic Do Oscar Winners Live Longer than Less Successful Peers?
362 5 September 2006 Annals of Internal Medicine Volume 145 • Number 5 www.annals.org
detect potential immortal time bias? We suggest that whenreports compare 2 “groups,” such as winners versus nomi-nees, one should carefully examine when and how personsenter a group. Does being in or moving to a group have atime-related requirement? Is the classification based on thestatus at time zero or later? If later, is this accounted for? Isthe term status, which implies potential change, more ap-propriate than the term group, which implies, as in a clin-ical trial, that group membership is fixed from the outset?Is it sufficient to classify a person just once, or do we needto reclassify the “person-moments,” that is, the person atdifferent times? Showing timelines, as in the Figure, mayhelp. Of course, readers and commentators should be dou-bly cautious whenever they encounter statistical results thatseem too extreme to be true.
From McGill University and Montreal General Hospital, Montreal,Quebec, Canada.
Potential Financial Conflicts of Interest: None disclosed.
Corresponding Author: James A. Hanley, PhD, Department of Epide-miology, Biostatistics and Occupational Health, McGill University,
1020 Pine Avenue West, Montreal, Quebec H3A 1A2, Canada; e-mail,[email protected].
Current author addresses are available at www.annals.org.
References1. Redelmeier DA, Singh SM. Survival in Academy Award-winning actors andactresses. Ann Intern Med. 2001;134:955-62. [PMID: 11352696]2. Walker AM. Observation and Inference: An Introduction to the Methods ofEpidemiology. Chestnut Hill, MA: Epidemiology Resources; 1991.3. Suissa S. Effectiveness of inhaled corticosteroids in chronic obstructive pulmo-nary disease: immortal time bias in observational studies. Am J Respir Crit CareMed. 2003;168:49-53. [PMID: 12663327]4. Hanley JA, Carrieri MP, Serraino D. Statistical fallibility and the longevity ofpopes: William Farr meets Wilhelm Lexis. Int J Epidemiol. 2006;35:802-5.[PMID: 16543364]5. Farr W. Vital Statistics: A Memorial Volume of Selections from the Reportsand Writings of William Farr. Metuchen, NJ: Scarecrow Pr; 1975.6. Colton T. Statistics in Medicine. Boston: Little, Brown; 1974:297-8.7. Hill AB. A Short Textbook of Medical Statistics. London: Hodder andStoughton; 1984:278.8. Rothman KJ. Longevity of jazz musicians: flawed analysis [Letter]. Am JPublic Health. 1992;82:761. [PMID: 1566968]9. Gail MH. Does cardiac transplantation prolong life? A reassessment. AnnIntern Med. 1972;76:815-7. [PMID: 4554414]10. Glesby MJ, Hoover DR. Survivor treatment selection bias in observationalstudies: examples from the AIDS literature. Ann Intern Med. 1996;124:999-1005. [PMID: 8624068]
Table. Original Analysis and Reanalyses of the Longevity Difference among Oscar Winners and Less Successful Performers*
Type of Analysis† Status‡ Reduction in Mortality Rates (95% CI), % Survival Advantage (95% CI), y
Winners vs. Nominated Winners vs. Controls Winners vs. Nominated Winners vs. Controls
Original dataOriginal analysis, PH 1 25 (5 to 41) 28 (10 to 42)Original analysis, PH 2 Not reported 20 (0 to 35)Original analysis, KM-LR 1 3.6§ 3.9||
New dataOriginal analysis, PH 1 23 (3 to 39) 26 (8 to 40)Original analysis, PH 2 11 (�12 to 30) 17 (�2 to 33)New analysis, PH 2 18 (�4 to 35) 15 (�5 to 32)New analysis, P-Y 2 18 (�4 to 36) 15 (�6 to 32)Original analysis, KM-LR 1 3.3¶ 3.7**New analysis, P-Y, actuarial 2 1.0 (�0.2 to 2.0) 0.7 (�0.3 to 1.6)
* KM-LR � Kaplan–Meier, log-rank; PH � Cox proportional hazards model; P-Y � performer-years analysis.† The authors only had access to slightly updated data. See Appendix (available at www.annals.org) for discussion of analyses.‡ 1 � those who ultimately won were treated as winners from the outset (static); 2 � those who ultimately won were treated as “not yet a winner” in risk sets before theywon and as winners after they won (dynamic).§ P � 0.013.� P � 0.003.¶ P � 0.024.** P � 0.006.
Academia and ClinicDo Oscar Winners Live Longer than Less Successful Peers?
www.annals.org 5 September 2006 Annals of Internal Medicine Volume 145 • Number 5 363
Current Author Addresses: Ms. Sylvestre and Huszti and Dr. Hanley:Department of Epidemiology, Biostatistics and Occupational Health,McGill University, 1020 Pine Avenue West, Montreal, Quebec H3A1A2, Canada.
APPENDIX
Redelmeier and Singh’s report (1), published in May 2001,first compared 235 winners with 887 performers who were nevernominated (controls). It also compared them with 527 othernominees (nonwinners).
Except for the last few years of awards, the 1649 performerswere identified as winners, nonwinners, or controls “after thefact,” that is, in 2000. However, it is helpful to visualize thisstudy as if it had been carried out in real time, with age- andyear-specific risk sets built up over time. Seen from this vantage,the 3 groups continued to change membership over time. By theend (the year 2000), there were 1356 nominations, involving 762unique performers. Of the 762, 235 won at least once, and theremaining 527 did not. Each year, the study would have identi-fied 20 “same sex, nearest in age” performers who played opposite(opposites) the 20 nominees for that year. By the end, this pro-cess would generate a total of 1355 opposites. (In 1951, there wasno female opposite for Katharine Hepburn). Some opposites hadalready been nominated or had possibly even won for perfor-mances in earlier films. Because performers were classified bytheir highest achievement, they already would have been up-graded before they were chosen as opposites. Other oppositeswere nominated for or won in a later film and would have beenupgraded and have become part of the 762. The 887 uniqueopposites who, by the year 2000 or by the time they had died,had never been nominated were termed controls.
By the time we received the data file from Redelmeier andSingh (in November 2002), it had been updated to include an-other year (2001) of awards and deaths. This increased the num-ber of performers from 1649 to 1670 and the number of deathsfrom 772 to 789. However, we did not have sufficient informa-tion to backdate the information in the received file to what itwas at the time of the report.
In the file with 1670 performers, we identified a male per-former (ID number 1075) who was born in 1953, died in 1994,and was first nominated in 1995. We also identified a femaleperformer (ID number 1430) who was born 1934 and died in2001; her first film was produced in 1952, her first nominationwas in 1960, and her first win was in 1952. We excluded these 2performers, leaving a total of 1668, comprising 238 winners (104deceased), 528 nominees (223 deceased), and 902 controls (461deceased).
When we performed the same analysis as the authors, on theslightly larger data set of 1668 performers, we obtained crudestatistics that were similar to those in the original report. Thenew differences in outcomes among winners and nonwinners andamong winners and controls were just slightly smaller than thoseof the original outcomes. For example (Table), the crude differ-ence of life expectancy among winners and controls was 3.9 yearsin the original report; however, in the updated data report, it is3.7 years. Whereas the reduction in the mortality rate ratio from
the time-independent Cox model was 28% in the original report,it is 26% in the updated data report.
We began our reanalyses with the comparison of winnersversus nonwinners. In the original report, winners’ life expect-ancy was 3.6 years longer (99 deaths in 235 persons; P � 0.013)than that of nonwinners (221 deaths in 527 persons); the mor-tality rate reduction, estimated from a proportional hazardsmodel in which status was static, was 25% (95% CI, 5% to41%). In the updated data set, by the same analyses, we obtainedan additional life expectancy of 3.3 years (P � 0.024) and amortality rate reduction of 23% (CI, 3% to 39%).
We reanalyzed the data on these 766 winners and nomineesin 2 ways. First, we used a time-dependent Cox proportionalhazards model, with age in years as the time axis (that is, risk setsconstructed at each age in years at death) and sex and year ofbirth as covariates. Each performer’s status (already a winner ornot) was updated at each successive risk set; those who had notyet been nominated by that age at death were excluded from thatrisk set. The estimated reduction in mortality rate was 18% (CI,�4% to 35%; P � 0.104). We represented status as the numberof years since winning, with nonwinners assigned zero years, butagain, status was not statistically significant, even when the num-ber of years was represented by just a linear term or by linear andquadratic terms.
Second, following guidance in an article by Efron (11), wetreated the 21 546 postnomination performer-years as 21 546separate observations. Winning status was at the time of theobservation, and death in the performer-year was treated as aBernoulli random variable, with logit link. With sex, age, andcalendar year as covariates, the mortality rate reduction was 18%(CI, �4% to 36%; P � 0.100).
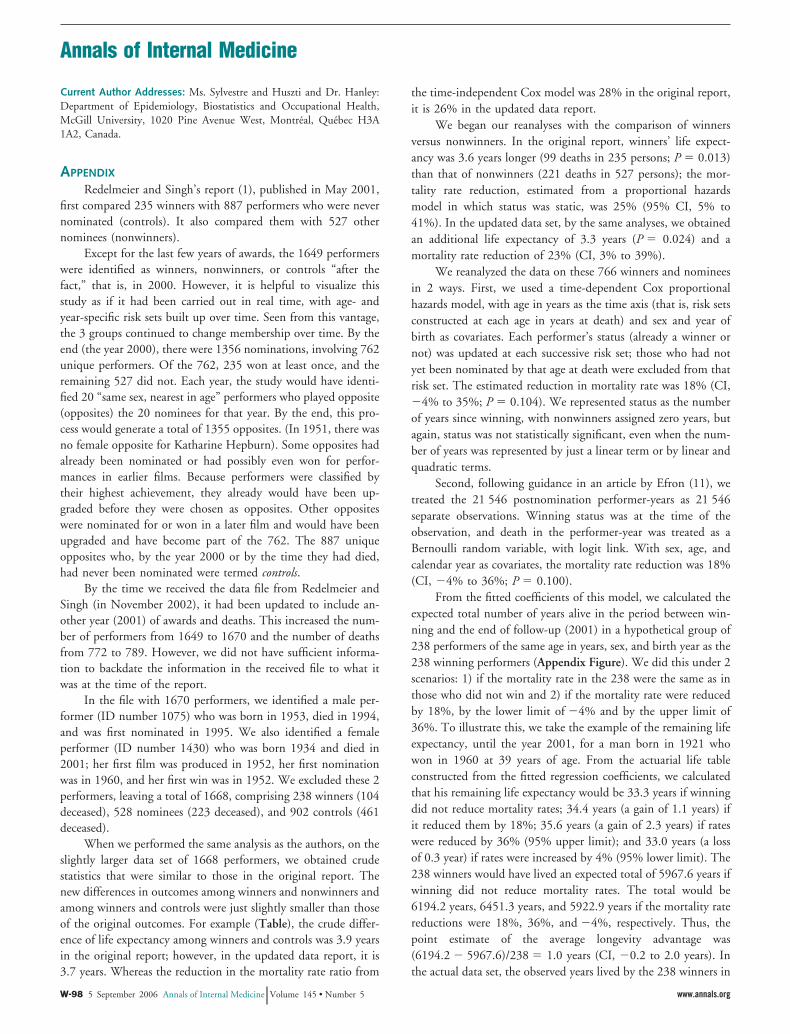
From the fitted coefficients of this model, we calculated theexpected total number of years alive in the period between win-ning and the end of follow-up (2001) in a hypothetical group of238 performers of the same age in years, sex, and birth year as the238 winning performers (Appendix Figure). We did this under 2scenarios: 1) if the mortality rate in the 238 were the same as inthose who did not win and 2) if the mortality rate were reducedby 18%, by the lower limit of �4% and by the upper limit of36%. To illustrate this, we take the example of the remaining lifeexpectancy, until the year 2001, for a man born in 1921 whowon in 1960 at 39 years of age. From the actuarial life tableconstructed from the fitted regression coefficients, we calculatedthat his remaining life expectancy would be 33.3 years if winningdid not reduce mortality rates; 34.4 years (a gain of 1.1 years) ifit reduced them by 18%; 35.6 years (a gain of 2.3 years) if rateswere reduced by 36% (95% upper limit); and 33.0 years (a lossof 0.3 year) if rates were increased by 4% (95% lower limit). The238 winners would have lived an expected total of 5967.6 years ifwinning did not reduce mortality rates. The total would be6194.2 years, 6451.3 years, and 5922.9 years if the mortality ratereductions were 18%, 36%, and �4%, respectively. Thus, thepoint estimate of the average longevity advantage was(6194.2 � 5967.6)/238 � 1.0 years (CI, �0.2 to 2.0 years). Inthe actual data set, the observed years lived by the 238 winners in
Annals of Internal Medicine
W-98 5 September 2006 Annals of Internal Medicine Volume 145 • Number 5 www.annals.org

the years between when they won and the year 2001 was 6223years.
Guided by information provided in an article by Turnbulland colleagues (12), we directly estimated the magnitude of theimmortal time bias. We calculated a set of conditional probabil-ities of a first win from the observed number of years between thefirst nomination and the first win (some won the same year,others much later, and some never). For example, 20.7% of ac-tresses won the year they were first nominated; 2.6% of thosewho did not win immediately won the next year. Then, for eachperformer, regardless of whether he or she won an Oscar, we usedthese conditional probabilities and the number of postnomina-tion years the performer lived to generate a random (hypotheti-cal) age in years at a performer’s first win. In each simulation, amajority of performers in each data set died before they couldwin, and those who did win these computer-generated awards(13) were not aware that they had won. Methods that treatedgroup membership as dynamic recovered the null mortality rateratio. However, across the simulated data sets, not accounting forimmortal time produced an artifactual longevity advantage of 0.8year (reduction in mortality rates, 6%) for those who won therandomly generated awards over those who did not survive longenough to win them.
We repeated these analyses with the winners versus controls.The initial report showed an additional life expectancy of 3.9
years and a mortality rate reduction of 28% (P � 0.003) forwinners. In the updated data, the additional life expectancy was3.7 years and the mortality rate reduction was 26% (P � 0.006).When we corrected for the winners’ immortal time and tookaccount of sex and year of birth, the mortality rate reduction was15% (CI, �5% to 32%; P � 0.129) using a time-dependentCox model and 15% (CI, �6% to 32%; P � 0.161) in theperformer-years analysis. The 15% mortality rate reduction im-plies an average advantage of 0.7 year (CI, �0.3 to 1.6 years).Our simulations with randomly generated prizes suggested thatnot accounting for the immortal time—now more substantial—between the year of a winning performer’s first film and the yearhe or she first won would produce an artificial longevity advan-tage of 1.7 years and a mortality rate reduction of 13%.
There are several references that are relevant to our analysis.Wagoner and colleagues (14) explain why, when particular work-ers’ duration of exposure to vinyl chloride was classified accord-ing to what it was at the end of follow-up rather than dynami-cally, workers who had more than 15 years of exposure to vinylchloride seemed to have lower mortality rates than those withfewer years of exposure. In a book by Breslow and Day (15), theauthors revisit the analysis criticized by Wagoner and colleagues(14) and set out the correct way to make mortality-rate compar-isons, that is, by using time-dependent cumulative exposure clas-sifications.
In another relevant reference, Mantel and Byar (16) showhow to form “Kaplan–Meier-like” life tables in which personscan move from one “exposure” status to another, for example,when patients move from “waiting-for-a-transplant” status to“post-transplant” status. If patients are inappropriately classifiedonly by their final status (received transplant or not), the timethey spend on the list waiting for a transplant is incorrectly cred-ited to the transplant. Those patients who lived long enoughreceived a transplant, but (because these were the earliest patientsto receive transplants and transplantation techniques were still intheir infancy) their post-transplantation survival was no betterthan that of those who were alive at the time of the transplanta-tion but did not undergo the procedure.
Abel and Kruger (17) asked a question about baseball play-ers similar to the one Redelmeier and Singh asked about per-formers. Abel and Kruger focused on players who were inductedinto the Baseball Hall of Fame while they were still alive. Incontrast to Redelmeier and Singh’s study, Abel and Kruger’sstudy “started the clock” at the time a player was inducted andused other players who were alive and who were same age as theinductee for comparison.
In a review article relevant for its discussion of bias, vanWalraven and colleagues (18) gave the immortal time bias aslightly different name because they covered a slightly broaderspectrum of situations. In their review, they surveyed articles thatcontained survival analysis and that may have been subject to thesame immortal time bias considered in our analysis. They defineda “baseline immeasurable” time-dependent variable as one thatcould not be measured at baseline and that indicated what hap-pened to patients during observation. They illustrated what oc-
Appendix Figure. Selected post-win survival of a group of238 persons of the same sex, birth year, and age at win asperformers who won.
Survival calculated actuarially from the coefficients of a logistic model(with age, sex, year, and status) fitted to the performer-years after eachwinner’s and each never-nominated performer’s first film. Status (alreadya winner and nonwinner), age, and year were updated yearly. Curvesobtained by setting the mortality rate reduction to zero (dashed line), thepoint estimate of the reduction parameter (solid line), and the upper andlower 95% limits of this (dotted lines) are shown. Calculation for eachindividual terminated at the year 2001, or age 110 years, whichever camefirst.
www.annals.org 5 September 2006 Annals of Internal Medicine Volume 145 • Number 5 W-99
curs if time-dependent variables are analyzed as fixed variables.They used the following helpful example (18):
Consider a hypothetic study determining prognostica-tors for patients who have a perforation of the sigmoidand undergo emergency hemicolectomy with colos-tomy. Patients who die in the first several months afterthe operation will never undergo closure of their colos-tomy. If this “baseline immeasurable time-dependentfactor” (“Was colostomy closed?”) is analyzed in a sur-vival analysis as a fixed variable, one would associate nocolostomy closure with a worse survival. This associa-tion is erroneous, because death results in the colos-tomy not getting closed, rather than vice versa.
Van Walraven and colleagues found that “52 survival anal-yses were susceptible to time-dependent bias. In 35 studies, thebias affected a variable highlighted in the study abstract and cor-rection of the bias could have qualitatively changed the study’sconclusion in over half of studies” (18). They concluded that “inmedical journals, time-dependent bias is concerningly commonand frequently affects key factors and the study’s conclusion”(18). Of interest, one of the analyses they “cleared” of possibletime-dependent bias was Redelmeier and Singh’s (reference 32 intheir survey).
Zhou and colleagues (19) use yet another name, “survivalbias,” for what is essentially the same bias as the immortal timebias. (Walker [2] and Suissa [3] call it immortal time bias, andGlesby and Hoover [10] refer to it as “survivor treatment selec-tion bias.”)
The abstract of the report by Zhou and colleagues (19)reads:
The authors compared five methods of studying sur-vival bias associated with time-to-treatment initiationin a drug effectiveness study using medical administra-tive databases (1996–2002) from Quebec, Canada.The first two methods illustrated how survival biascould be introduced. Three additional methods wereconsidered to control for this bias. Methods were com-
pared in the context of evaluating statins for secondaryprevention in elderly patients post-acute myocardial in-farction who initiated statins within 90 days after dis-charge and those who did not. Method 1 that classifiedpatients into users and nonusers at discharge resulted inan overestimation of the benefit (38% relative risk re-duction at 1 year). In method 2, following users fromthe time of the first prescription and nonusers from arandomly selected time between 0 and 90 days attenu-ated the effect toward the null (10% relative risk reduc-tion). Method 3 controlled for survival bias by follow-ing patients from the end of the 90-day time window;however, it suffered a major loss of statistical efficiencyand precision. Method 4 matched prescription timedistribution between users and nonusers at cohort en-try. Method 5 used a time-dependent variable for treat-ment initiation. Methods 4 and 5 better controlled forsurvival bias and yielded similar results, suggesting a20% risk reduction of recurrent myocardial infarctionor death events.
11. Efron B. The two-way proportional hazards model. Journal of the RoyalStatistical Society, Series B. 2002;64:899-909.12. Turnbull BW, Brown BW, Hu M. Survivorship analysis of heart-transplantdata. Journal of the American Statistical Association. 1974;69:74-80.13. Leibovici L. Effects of remote, retroactive intercessory prayer on outcomes inpatients with bloodstream infection: randomised controlled trial. BMJ. 2001;323:1450-1. [PMID: 11751349]14. Wagoner JK, Infante PF, Saracci R. Vinyl chloride and mortality? [Letter]Lancet. 1976;2:194-5. [PMID: 73810]15. Breslow NE, Day NE. Statistical Methods in Cancer Research: Volume II:The Design and Analysis of Cohort Studies. New York: Oxford Univ Pr; 1994.16. Mantel N, Byar DP. Evaluation of response-time data involving transientstates—illustration using heart-transplant data. Journal of the American StatisticalAssociation. 1974;69:81-6.17. Abel EL, Kruger ML. The longevity of Baseball Hall of Famers compared toother players. Death Stud. 2005;29:959-63. [PMID: 16265814]18. van Walraven C, Davis D, Forster AJ, Wells GA. Time-dependent bias wascommon in survival analyses published in leading clinical journals. J Clin Epide-miol. 2004;57:672-82. [PMID: 15358395]19. Zhou Z, Rahme E, Abrahamowicz M, Pilote L. Survival bias associated withtime-to-treatment initiation in drug effectiveness evaluation: a comparison ofmethods. Am J Epidemiol. 2005;162:1016-23. [PMID: 16192344]
W-100 5 September 2006 Annals of Internal Medicine Volume 145 • Number 5 www.annals.org

COMMENTS AND RESPONSES
Reanalysis of Survival of Oscar Winners
TO THE EDITOR: In this issue, Sylvestre and colleagues (1) correctlycomment that survival statistics are fallible. The primary analysis inour study (2) was based on the Kaplan–Meier method because lifeexpectancy is the preferred metric in medical decision analysis (3).Our article also provided 40 other secondary analyses to exploredifferent models because no one statistic is ideal. Sylvestre and col-leagues argue that the multivariate-adjusted Cox proportional haz-ards model with a time-varying step function is preferred over ourprimary analysis approach, do not discuss the limitations of suchmodels, and intimate that other models give an unfair advantage.This position disagrees with us and with other reviews involving ourwork (4, 5).
We agree that time-varying functions are valuable for addressinga change in status from winning. One drawback with such modelscan be in assuming the same hazard for all winners following the firstwin; for example, Jodie Foster (who first won at age 25 years) andJudi Dench (who first won at age 62 years) are assigned identicalhazards from age 63 years until death. However, we found thatearlier wins were associated with greater advantages, contrary to thisassumption. Adding fixed covariates that additionally model age (lin-ear or quadratic) is no simple solution because the likelihood ofwinning is no simple function of age. The models also have limitedpower on small data sets, assume no unmeasured heterogeneity, andrarely capture complex trajectories (for example, multiple films,nominations, and wins) (6–9).
We thank many scientists for analyses of our database. We havealso done an update to 29 March 2006 and observed 122 moreindividuals and 144 more deaths since our first publication. Ourprimary unadjusted analysis shows a smaller survival advantage of 3.6years (79.7 years vs. 76.1 years; P � 0.005). Applying model 1 ofSylvestre and colleagues’ Appendix so that winners are treated in atime-varying manner yielded a change in mortality of �8% (95%CI, �14% to 26%; P � 0.455). Modifying model 1 so that bothwinners and nonwinners are treated in a time-varying manneryielded a change in mortality of �15% (CI, �6% to 31%; P �0.140). These estimates overlap earlier results. Apparently, the sur-vival advantage depends on the analytic method chosen.
The statistical debate concerns inbuilt survival advantages thatyield an immortality bias. We provided methods for addressing thisbias, observed multiple findings suggesting this bias was not large inour cohort, and estimated the hidden confounding that would needto be postulated. We found no survival advantage when we com-pared individuals with many nominations and individuals with nonominations, for example, contrary to estimates of a large immortal-ity bias. Moreover, we presumed that individuals not reported deadwere alive, which is a different type of immortality bias that causesalmost all of our analyses and Sylvestre and colleagues’ analyses tounderestimate survival differences.
Donald A. Redelmeier, MDSheldon M. Singh, MDUniversity of TorontoToronto, Ontario M4N 3M5, Canada
Potential Financial Conflicts of Interest: None disclosed.
References1. Sylvestre M, Huszti E, Hanley JA. Do Oscar winners live longer than less successful
peers? A reanalysis of the evidence. Ann Intern Med. 2006;145:361-3.
2. Redelmeier DA, Singh SM. Survival in Academy Award–winning actors and ac-
tresses. Ann Intern Med. 2001;134:955-62. [PMID: 11352696]
3. Sox HC, Blatt MA, Higgins MC, Marton KI. Medical Decision Making. Toronto:
Butterworths; 1988:182-4.
4. Redelmeier DA, Singh SM. Longevity of screenwriters who win an academy award:
longitudinal study. BMJ. 2001;323:1491-6. [PMID: 11751368]
5. Redelmeier DA, Singh SM. Association between mortality and occupation among
movie directors and actors. Am J Med. 2003;115:400-3. [PMID: 14553877]
6. Fisher LD, Lin DY. Time-dependent covariates in the Cox proportional-hazards
regression model. Annu Rev Public Health. 1999;20:145-57. [PMID: 10352854]
7. Therneau TM, Grambsch PM. Modeling Survival Data: Extending the Cox Model.
New York: Springer; 2000:231-2.
8. Kalbfleisch JD, Prentice RL. The Statistical Analysis of Failure Time Data. 2nd ed.
Hoboken, NJ: J Wiley; 2002:196-208.
9. Allison PD. Survival Analysis Using SAS: A Practical Guide. Cary, NC: The SAS
Institute Inc.; 2004:111-84.
EDITORS’ NOTE: The debate between Sylvestre and colleagues (1)and Redelmeier and Singh shows both the value and limitations ofprepublication peer review and underscores the importance of reviewafter publication. The original paper by Redelmeier on the survivalof Oscar winners (2) underwent close in-house scrutiny and externalmethodologic review, which resulted in several new analyses, includ-ing the “time-varying covariate” model we discuss here. Because theeditors felt that the methodologic issues were subtle, we also tookwhat was at that time a somewhat unusual step to facilitate postpub-lication review. As a condition of publication, we required the au-thors to make the data set available to interested researchers. Unfor-tunately, various complications prevented its prompt dissemination,and it has taken almost 5 years for someone to come forward with areanalysis of the data. We are glad to publish Sylvestre and col-leagues’ reanalysis, partly because the article affords a chance toamend a widely publicized result, but more so because the analyticmethods at issue apply to many health care research questions.
The main purpose of this letter is to help the technically lesssophisticated reader to understand the issues under discussion. Thecentral issue is how best to analyze a sudden change in risk due tosome life event (becoming ill, starting a high-risk behavior, or start-ing a treatment). In this case, the event is a salutary one: winning animportant prize. The question is exactly when to “start the clock” inassessing whether the prize changes the winner’s subsequent risk pro-file, and how to do that analytically. Redelmeier and Singh referredto this question in their original paper as the “time-zero” problem.Because Redelmeier and Singh matched winners and nonwinners ontheir age at the time the Oscar was won, their analysis appeared tostart the clock at the right moment. However, their primary analysisdid not maintain that matching; instead, it combined all winnersinto one group and all losers into another group and comparedwinners’ and nonwinners’ survival from birth. With this approach,winning the prize gets credit for how long the winner lived beforewinning the prize. This primary analysis produced a large and highlystatistically significant advantage (a 3.9-year increase in life expect-ancy, equivalent to a 28% annual risk reduction), the outcome high-
Annals of Internal Medicine Letters
392 © 2006 American College of Physicians
lighted in the original paper and abstract and publicized in subse-quent media reports.
As Sylvestre and colleagues make clear, the optimal methods ofanalysis involve starting the clock at the moment of winning theprize. In their 2001 paper, Redelmeier and Singh presented a num-ber of secondary analyses that started the clock at different moments,including a Cox survival analysis in which the risk for subsequentdeath for winners and nonwinners could change at the instant ofwinning an Oscar. With this form of analysis, the putative risk mod-ifier—in this case, winning the prize—would have no effect early ina prizewinner’s life but would have an effect after the win. Winningthe prize is, in statistical terminology, a “time-varying covariate.”The Cox model suggested a 20% mortality risk reduction, with bor-derline statistical significance, and a range of uncertainty that justincluded the possibility of no survival benefit. Speaking for the An-nals Editors, we regret that the original paper did not adequatelyemphasize this more equivocal but probably more correct result.
In the preceding letter, Redelmeier and Singh report the resultsof using the time-varying covariate modeling approach to analyzetheir most recently compiled data set of Oscar winners (updated to2006). This analysis yields still weaker, now statistically nonsignifi-cant evidence that winning an Oscar prolongs life: either an 8%survival advantage (with statistically compatible effects ranging fromas low as 14% shorter survival to as high as 26% longer survival) ora 15% survival advantage (the uncertainty of which is compatiblewith a range of 6% shorter survival to up to 31% greater survival).The 2 estimates differ according to how the analysis handles thenonwinners.
Sylvestre and colleagues point out that although this Cox “time-varying” result is closer to the truth than the result that Redelmeierand Singh reported as the primary analysis in their paper, it may notyet be optimal, for many of the same reasons that Redelmeier andSingh point out in their letter. Sylvestre and colleagues prefer theconceptually simpler approach of measuring life expectancy from themoment of winning the Oscar. This approach, outlined in theirWeb-only appendix, produces a result qualitatively consistent withthe result from the time-varying model that Redelmeier and Singhreport in their letter.
The debate about whether winning an Academy Award confersany survival advantage—and if it does, by how much—will continuein exchanges between interested scientists. To facilitate their partic-ipation in this discussion, we are posting on the Annals Web site thedata set (updated to March 2006) that Redelmeier and Singh haveprovided and that Sylvestre and colleagues used in their analysis. TheEditors invite people who want to contribute to the discussion tocommunicate their ideas as a Rapid Response letter about Sylvestreand colleagues’ article. We hope that other members of the statisticalcommunity will take up the challenge of determining the most ap-propriate way to measure the effect of winning an Oscar and thestatistical uncertainty around the result. Their efforts will inform theanalysis of many similar phenomena in biomedicine.
When the dust settles, we expect that the estimated effect will benonsignificant, and closer to Redelmeier and Singh’s adjusted esti-mates and to the estimate of Sylvestre and colleagues than to theoriginal estimate of 3.9 years (now 3.6 years, using the 2006 updateddata set). Until then, we urge everyone to observe much greatercaution about claiming the existence of an “Oscar effect” on lifespan. Granted, doing so may mean some tempering of joy among
Academy Award winners. They will get their statuette, and the at-tention it brings, but we doubt that winning it will confer many—ifany—more years to enjoy the fruits of their enhanced celebrity.
Steven Goodman, MD, PhDAssociate Editor
Harold C. Sox, MDEditor
Potential Financial Conflicts of Interest: None disclosed.
References1. Sylvestre M, Huszti E, Hanley JA. Do Oscar winners live longer than less successful
peers? A reanalysis of the evidence. Ann Intern Med. 2006;145:361-3.
2. Redelmeier DA, Singh SM. Survival in Academy Award-winning actors and ac-
tresses. Ann Intern Med. 2001;134:955-62. [PMID: 11352696]
Cryptogenic Stroke and Patent Foramen Ovale
TO THE EDITOR: In their comprehensive and informative Update(1), Drs. Holloway and Jozefowicz suggest using warfarin for second-ary prevention of stroke in patients with atrial septal defect. Thecurrent literature has no strong evidence to support this view, andtherefore the current guidelines from the American Academy of Neu-rology state that “the evidence is insufficient to determine whetheraspirin or warfarin is superior in preventing recurrent stroke or deathin patients with patent foramen ovale (PFO) alone” (2). However,the American Academy of Neurology does recommend warfarintherapy in patients with patent foramen ovale and evidence of deepvenous thrombosis (2).
The rationale for aspirin therapy in patients with patent fora-men ovale comes from a French study of 216 patients with a cryp-togenic stroke (3). This trial reported that the incidence of recurrentstroke was only 2.3% after 4 years in patients who had patent fora-men ovale alone and were taking aspirin, a value similar to the 4.2%risk in the control group. Support for the use of aspirin also comesfrom the Patent Foramen Ovale in Cryptogenic Stroke Study, whichdid not demonstrate a statistical difference between the effects ofaspirin and warfarin on the risk for subsequent stroke or deathamong patients with cryptogenic stroke and patent foramen ovale(4). Although studies have favored warfarin over aspirin for second-ary prevention of stroke in patients with patent foramen ovale andatrial septal defect, they included small numbers of patients, hadlimited statistical power, and were unblinded and retrospective (5).On the basis of currently available evidence, the American College ofChest Physicians also recommends aspirin over no therapy or warfa-rin therapy in patients with patent foramen ovale (6).
Ashok K. Malani, MDHussam Ammar, MDHeartland Regional Medical CenterSt. Joseph, MO 64506
Potential Financial Conflicts of Interest: None disclosed.
Letters
www.annals.org 5 September 2006 Annals of Internal Medicine Volume 145 • Number 5 393

Survival in Academy Award–Winning Actors and ActressesDonald A. Redelmeier, MD, and Sheldon M. Singh, BSc
Background: Social status is an important predictor of poorhealth. Most studies of this issue have focused on the lowerechelons of society.
Objective: To determine whether the increase in status fromwinning an academy award is associated with long-term mortalityamong actors and actresses.
Design: Retrospective cohort analysis.
Setting: Academy of Motion Picture Arts and Sciences.
Participants: All actors and actresses ever nominated for anacademy award in a leading or a supporting role were identified(n 5 762). For each, another cast member of the same sex whowas in the same film and was born in the same era was identified(n 5 887).
Measurements: Life expectancy and all-cause mortality rates.
Results: All 1649 performers were analyzed; the median durationof follow-up time from birth was 66 years, and 772 deaths oc-
curred (primarily from ischemic heart disease and malignant dis-ease). Life expectancy was 3.9 years longer for Academy Awardwinners than for other, less recognized performers (79.7 vs. 75.8years; P 5 0.003). This difference was equal to a 28% relativereduction in death rates (95% CI, 10% to 42%). Adjustment forbirth year, sex, and ethnicity yielded similar results, as did adjust-ments for birth country, possible name change, age at release offirst film, and total films in career. Additional wins were associ-ated with a 22% relative reduction in death rates (CI, 5% to35%), whereas additional films and additional nominations werenot associated with a significant reduction in death rates.
Conclusion: The association of high status with increased lon-gevity that prevails in the public also extends to celebrities, con-tributes to a large survival advantage, and is partially explained byfactors related to success.
Ann Intern Med. 2001;134:955-962. www.annals.orgFor author affiliations, current addresses, and contributions, see end of text.
See editorial comment on pp 1001-1003.
Social status is a consistent, powerful, and widespreaddeterminant of death rates. The association between
high status and low mortality has appeared throughoutthe world, has persisted for more than a century, andextends to diverse illnesses (1–4). Uncovering the mech-anisms by which external factors (such as income andlevel of education) influence biological processes (suchas the endocrine and immune systems) represents a ma-jor challenge for health scientists and a core issue forpublic policy. Research is difficult because many deter-minants of social status are closely interrelated, such aseducation with income. Animal models are unrealistic,aside from some primate studies, and randomized trialsare impractical, aside from a few lottery winners.
Movie stars are an interesting group for the study ofsocial status and health outcomes. First, performers canearn an enormous income without a substantial amountof education. Second, celebrity publicity is oftenboosted by more sustained promotion than is the atten-tion given to politicians, singers, athletes, and other lu-minaries. Third, the lifestyles of movie stars can be no-torious for extremes of competition, leisure, and excess.Fourth, they are highly visible public figures whosebirthdays and deaths are regularly reported. Finally, big
breaks to stardom are often haphazard and heavily de-pendent on chance. Indeed, some pundits suggest thatbeing nominated for an Academy Award is due to talentwhereas winning one is due to luck.
We wondered whether the Academy Awards mightshed light on how social status affects all-cause mortal-ity. We chose this event because it generates substantialattention; for example, in 1996, almost as many Amer-icans watched the Academy Awards as voted in the pres-idential election (5, 6). Moreover, the event is televisedto more than 100 countries and has an estimated view-ing audience of more than 1 billion people, making itsbroadcast one of the most widely shared current humanexperiences. Our theory was that winners would gain animportant increase in their status but no increase in theirformal education. The primary hypothesis was that thesurvival of winners would differ from that of less recog-nized performers.
METHODS
Academy of Motion Picture Arts and SciencesMembership in the Academy of Motion Picture
Arts and Sciences is limited by invitation from the
Article
© 2001 American College of Physicians–American Society of Internal Medicine 955

Board of Governors to those with movie distinctions,currently totals about 6000 persons, and has 13branches (for example, an actors’ branch that includesabout 1000 persons). The annual awards selection pro-cess is complex and is described in detail elsewhere(www.oscars.org). In brief, each December the Academycompiles a list of films that are eligible for an award;each cast member in these films is eligible to be nomi-nated for an acting award. In January, the list is sent toall Academy members and those in the actors’ branchare invited to nominate five individuals in each of fouracting categories. In February, the nominations are tab-ulated, the top five nominations in each category areidentified, and all Academy members vote for one per-son in each category. The Academy Award goes to theperson with the most votes.
Selection of PerformersWe identified every person nominated for an Acad-
emy Award for acting. To do so, we obtained a fulllisting of all actors and actresses, along with the film inwhich they performed, from the Academy. The selectioninterval spanned from the inception of the AcademyAwards to the present (72 years). For each performer,we also identified another cast member who performedin the same film as the nominee, was the same sex, andwas born in the same era. This ensured that both werealive, working, prevailing in casting calls, winning goodmovie roles, and eligible for a nomination. In caseswhere several matches were possible, we picked a same-sex cast member by formally checking dates and choos-ing the one whose birth date was closest to that of thenominated performer.
Example of Matching ProcessFor clarity, we provide an arbitrary example of this
matching process to illustrate the underlying method.Kate Winslet was nominated for the leading actressaward in 1997 for her performance as the character RoseDeWitt Bukater in the movie Titanic. Five otherwomen were cast members in that film, including SuzyAmis, who performed as the character Lizzy Calvert.Kate Winslet was born in 1975, and Suzy Amis wasborn in 1961; these two people had a 14-year differencein age. The other four women, Kathy Bates (born in1948), Frances Fisher (born in 1952), Jenette Goldstein
(born in 1960), and Gloria Stuart (born in 1910), allhad an age difference greater than 14 years compared toKate Winslet. Hence, Suzy Amis was selected as thematch for Kate Winslet in this film.
Overall Matching ProcessWe repeated this matching process for all years and
all four categories. No performer was excluded fromanalysis, and no performer was dropped because of miss-ing data. Matches were not possible in some cases; forexample, in 1951, Katharine Hepburn was nominatedin a movie in which no other woman appeared. Other-wise, the matching process was uncomplicated and com-plete. In the matching process, we did not attempt tobalance ethnicity, past experience, or future accomplish-ment of the performers. As a consequence, the personwho performed opposite the nominee could previouslyhave achieved or subsequently achieve greater recogni-tion. Such potential misclassification might cause analy-ses to underestimate the differences attributable to win-ning an Academy Award.
Classification of SuccessMany performers were eligible for inclusion on
more than one occasion; for example, Katharine Hep-burn won four Academy Awards during her career. Wecounted each person only once by categorizing perform-ers according to their highest achievement. The threegroups were termed “winners” (those who were nomi-nated for and won at least one Academy Award), “nom-inees” (those who were nominated but never won anAcademy Award), and “controls” (those who were nevernominated and never won). For example, Jack Nichol-son was classified as a winner because he had three wins,Richard Burton was a nominee because he was nomi-nated seven times but never won, and Lorne Greene wasa control because he was never nominated. Statisticaltests based on counting performances rather than per-formers gave more extreme results and are not shown.
Determination of Death RatesWe collected data on each person’s date of birth and
death from the Internet through two databases: the AllMovie Guide (www.allmovie.com) and the InternetMovie Database (www.imdb.com). Each source coversmore than 100 000 movies, is updated continually, and
Article Survival in Academy Award–Winning Actors and Actresses
956 15 May 2001 Annals of Internal Medicine Volume 134 • Number 10 www.annals.org

undergoes extensive public scrutiny. Data were checkedby consulting written publications, and conflicts wereresolved by accepting information from printed sourcesover that found on the Internet (7–10). No birth dateswere missing. Causes of death were sought by using thesame methods and by inquiry to the National FilmInformation Service. In addition, we checked Internetsources that listed people who have sometimes been mis-takenly rumored dead. People who were not reporteddead were presumed to be alive.
Determination of Personal CharacteristicsAdditional data were retrieved by using methods
similar to those described above, with the followingexceptions. Determination of whether the person wasborn in the United States and whether the person hadchanged his or her name from the given name was madeby using the All Movie Guide. Missing data wereassumed to indicate the United States as the country oforigin and no change in name. Ethnicity was deter-mined by searching Internet sources and by viewing se-lected films. Although performers try to avoid beingtypecast, we classified each performer’s main film genreaccording to that listed first by the All Movie Guide.Similarly, although the ratings given in film reviews aredebatable, the All Movie Guide five-star ratings wereconsidered to indicate high quality.
Setting Time-ZeroResearch on the natural history of any condition
requires identifying people at an early and uniform pointin their course. Unstable definitions of “time-zero”might otherwise lead to distorted prognoses, an errorcalled lead-time bias (11, 12). The baseline analysis inthis study set time-zero as the performer’s day of birth toconform to the accepted measure of longevity (13).Other analyses were conducted to test robustness. In thefirst of these, time-zero was set as the day on which eachperformer’s first film was released. In the second, time-zero was set as the day of each performer’s 65th birth-day; therefore, all performers who died before 65 yearsof age were excluded. In the third analysis, time-zerowas set as each performer’s 50th birthday; all performerswho died before 50 years of age were therefore excluded.
Reverse CausalitySurvival analysis also requires avoiding artifacts re-
lated to survivor treatment-selection bias: That is, per-sons who are destined to live longer have more oppor-tunity to gain special treatments, thereby potentiallycreating an illusory link between special treatments andlonger survival (14–16). One way to mitigate this bias isto use time-dependent covariates in a proportional haz-ards model, although doing so can produce a differentbias in the opposite direction (17, 18). We analyzedsurvival both with and without a time-dependent stepfunction for victory. In addition, we analyzed survivalafter adjusting for total films and total nominations in aperson’s career to see whether winning an AcademyAward was distinct from other exposures that can accu-mulate over time.
Unmeasured ConfoundingWe used three strategies to test whether the survival
associated with winning an Academy Award might bedue to hidden confounding. First, we conducted analy-ses both with and without adjustments for baseline char-acteristics, on the rationale that if partial control basedon available factors yielded only a small difference inestimates, then perfect control based on ideal factorswould be less likely to yield a large difference in esti-mates. Second, we repeated all analyses by comparingwinners with nominees and tested whether the survivaldifference persisted, on the rationale that nominees wereintermediate between winners and controls in talentor other unknown factors. Third, we examined dose–response gradients by assessing survival in performerswith multiple wins.
Statistical AnalysisThe primary analysis compared mortality in Acad-
emy Award winners and controls. Survival was plottedby using the Kaplan–Meier method, life expectancy wasestimated as the area under the curve, and comparisonswere done by using the log-rank test. Regression analy-ses used the Cox proportional hazards model to adjustfor birth year, sex, ethnicity (white or nonwhite), birthcountry (United States or other), name change (yes orno), age at release of first film, and total films in career.Continuous covariates were coded as linear terms (mod-els with quadratic and cubic terms yielded similar results
ArticleSurvival in Academy Award–Winning Actors and Actresses
www.annals.org 15 May 2001 Annals of Internal Medicine Volume 134 • Number 10 957
and are not reported). The proportionality assumptionwas checked by inspection of log–log plots. Tests weredone by using StatView software, version 5.0 (SAS In-stitute, Inc., Cary North Carolina), and SAS software,version 6.12 (SAS Institute, Inc.). All P values were two-tailed, and those less than 0.05 were considered statisti-cally significant. Our data file is available on the Website of the Institute for Clinical Evaluative Sciences(www.ices.on.ca).
Role of Funding SourcesThe funding sources had no role in the design, con-
duct, or reporting of this study.
RESULTS
Overall, 1649 performers were nominated for anAcademy Award or appeared opposite the nominatedperformer. The baseline characteristics of winners, nom-inees, and controls were similar (Table 1). In particular,the three groups did not differ greatly in birth year, sex,ethnicity, or country of birth, aside from a trend thatnominees were born somewhat more recently than win-ners or controls. Fewer controls were listed as having adifferent name at birth, a finding perhaps related tolesser monitoring of this group. The median age at re-lease of first film was 26 years, and almost all performers(98%) had started appearing in films by 49 years of age.
The median age at first nomination was 35 years (iden-tical for winners and nominees). Among winners, themedian age at first award was 39 years, most (80%) hadreceived an award by 49 years of age, and few (15%) hadmultiple wins.
Each performer’s career was assessed as the intervalfrom their first to their most recent film credit (throughthe year 2000). On average, winners were in more totalfilms than were nominees (58.9 vs. 47.4; P , 0.001). Incontrast, nominees and controls had a similar number oftotal films (47.4 vs. 45.5; P . 0.2). Analyses of onlyfilms rated four stars or more revealed a similar pattern.For each group, the average performer was in about 1.5films per year during their career. The most commonfilm genre in each group was “drama,” and this wasmore frequent among winners than controls (82% vs.72%; P 5 0.003). Most winners and nominees receiveda first nomination within two decades of their first film(83% vs. 83%; P . 0.2). Among winners, informationon level of education was available for 119 performers;half (61 of 119) had only a high school education (ex-cluding honorary degrees).
A total of 772 performers had died by 28 March2000 (median follow-up, 66 years from birth). A specificcause of death was listed for 556 performers and was notlisted for 216 performers (Table 2). No major imbal-ances were seen among the three groups in identifiedcauses of death. Ischemic heart disease was the mostcommon cause of death and accounted for 23% ofdeaths overall (177 of 772 deaths). Injuries and poison-ing occurred at all ages and accounted for 6% of the
Table 1. Baseline Characteristics*
Characteristic Winners(n 5 235)
Nominees(n 5 527)
Controls(n 5 887)
4OOOOOOOO%OOOOOOOO3Birth year
Before 1900 14 15 171900–1919 33 18 281920–1939 28 34 301940–1959 19 24 191960–1979 6 8 61980–1999 0 0 0
Male sex 50 51 56White ethnicity 97 96 97Birth in the United States 69 69 74Change in birth name 29 23 9Age at making of first film
,10 y 2 3 210–19 y 15 18 1120–29 y 51 50 4530–39 y 26 21 2940–49 y 5 6 8$50 y 1 2 4
* Data may not add to 100% because of rounding.
Table 2. Causes of Death
Cause of Death Winners Nominees Controls
4OOOOOOOOnOOOOOOOO3Ischemic heart disease 30 44 103Cerebrovascular disease 9 16 19Other cardiovascular disease 2 1 6Malignant disease 30 46 81Chronic lung disease 4 9 13Acute pneumonia 6 11 7Liver failure 0 4 2Kidney failure 0 5 4Primary neurologic disorder 2 6 7Injury or poisoning 5 23 19Other specified cause 3 20 19Unspecified cause* 8 36 172
Total 99 221 452
* Includes partial data (for example, “died of natural causes”).
Article Survival in Academy Award–Winning Actors and Actresses
958 15 May 2001 Annals of Internal Medicine Volume 134 • Number 10 www.annals.org

deaths overall (47 of 772 deaths). Of the 42 deaths frommiscellaneous causes, 15 were due to postoperative com-plications and 8 were due to AIDS. Overall, almost alldeaths (714 of 772) occurred after 50 years of age, andvery few deaths (13 of 772) occurred within a decade ofthe performer’s first film. Twenty performers were olderthan 90 years of age and were still alive at follow-up.
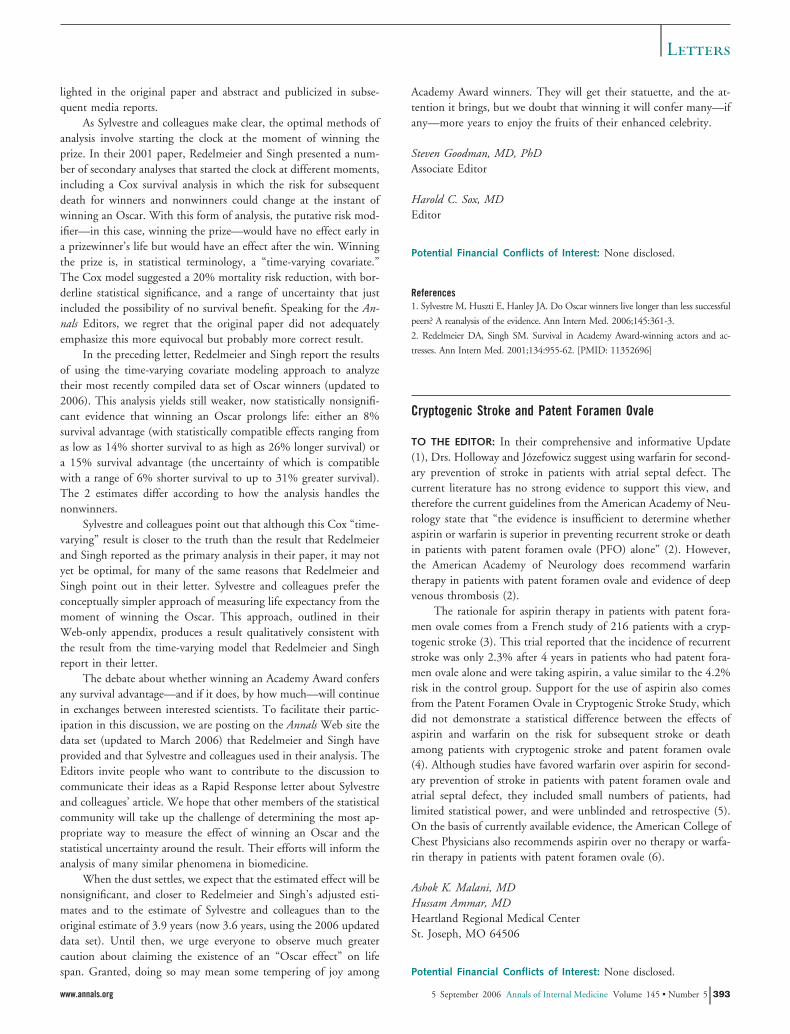
Survival was better among winners than amongcontrols (Figure). The overall difference in life expect-ancy was 3.9 years (79.7 vs. 75.8 years; P 5 0.003). Thedifference was similar for men and women (3.8 vs. 4.1years; P . 0.2) but was greater for performers born in orafter 1910 than for those born before or in 1909 (4.1 vs.1.7 years; P 5 0.015). The difference in life expectancybetween winners and controls was 5.9 years (53.2 vs.47.3 years; P , 0.001) in analyses based on survivalafter release of the first film, 2.5 years (83.0 vs. 80.5years; P 5 0.018) in analyses that excluded performerswho died before 65 years of age, and 2.3 years (79.4 vs.77.1 years; P 5 0.028) in analyses that excluded per-formers who died before 50 years of age.
The generally lower mortality hazard was equal toabout a 28% relative reduction in death rates in winners(95% CI, 10% to 42%). Adjustment for birth year, sex,
and ethnicity yielded similar results (Table 3). Account-ing for birth country, name change, age at release of firstfilm, and total films in career also made no large differ-ence. Excluding performers who died before 50 years ofage and those who won an award after 50 years of ageyielded a relative reduction of 25% (CI, 2% to 42%),which decreased to 18% (CI, 27% to 37%) after ad-justment for birth year, sex, and ethnicity. Analyses us-ing time-dependent covariates, in which winners werecounted as controls until the time of first victory,yielded a relative reduction of 20% (CI, 0% to 35%).Analyses excluding performers with multiple winsyielded a relative reduction of 25% (CI, 5% to 40%).
Additional analyses were done to evaluate the 762performers who received at least one Academy Awardnomination. Life expectancy was better for winners thanfor nominees (79.7 vs. 76.1 years; P 5 0.013). This wasequal to a 25% relative reduction in death rates (CI, 5%to 41%). Adjustment for demographic and professionalfactors yielded similar results, as did calculations basedon time from first nomination rather than time frombirth (relative reduction in death rate, 24% [CI, 3% to40%]). Among winners and nominees, very few deaths
Figure. Survival in Academy Award–winning actors andactresses (solid line) and controls (performers who werenever nominated) (dotted line), plotted by using theKaplan–Meier technique.
Analysis is based on log-rank test comparing 235 winners (99 deaths)with 887 controls (452 deaths). The total numbers of performers avail-able for analysis were 1122 at 0 years, 1056 at 40 years, 762 at 60 years,and 240 at 80 years. P 5 0.003 for winners vs. controls.
Table 3. Analysis of Death Rates
Analysis Relative Reductionin Mortality Rate(95% CI), %*
Winners compared with controlsBasic analysis 28 (10–42)Adjusted for birth year 27 (9–41)Adjusted for sex 27 (10–42)Adjusted for ethnicity 27 (10–42)
Adjusted for all 3 demographic factors 26 (8–40)Adjusted for birth country 27 (10–42)Adjusted for possible name change 27 (8–41)Adjusted for age at first film 26 (7–40)Adjusted for total films in career 27 (9–42)
Adjusted for all 4 professional factors 25 (5–40)Adjusted for all 7 factors 23 (2–38)
Winners compared with nomineesBasic analysis 25 (5–41)Adjusted for birth year 24 (4–40)Adjusted for sex 27 (7–42)Adjusted for ethnicity 25 (5–41)
Adjusted for all 3 demographic factors 26 (6–42)Adjusted for birth country 26 (6–41)Adjusted for possible name change 26 (6–42)Adjusted for age at first film 25 (5–41)Adjusted for total films in career 23 (2–39)
Adjusted for all 4 professional factors 24 (3–40)Adjusted for all 7 factors 22 (0–38)
* Proportional hazards analysis.
ArticleSurvival in Academy Award–Winning Actors and Actresses
www.annals.org 15 May 2001 Annals of Internal Medicine Volume 134 • Number 10 959

occurred within a decade of their first nomination (4%vs. 5%; P . 0.2). Life expectancy was 2.7 years higherfor performers with multiple wins than for those withsingle wins (82.0 vs. 79.3), but the difference was notstatistically significant (P 5 0.093). The award category(leading vs. supporting role) made no significant differ-ence in survival.
Performers with long careers sometimes receivedmore nominations than did those with short careers.The overall association was about 0.02 nomination (CI,0.016 to 0.024 nomination) per year of career. The win-ners accumulated a total of 639 nominations, of which362 were defeats. The nominees accumulated a total of717 nominations. We found no association betweennumber of defeats and reduced death rates, either forwinners (relative reduction in death rate, 5% [CI, 26%to 15%]) or nominees (relative reduction in death rate,2% [CI, 214% to 16%]). Analyses of winners andnominees together showed that each win was associatedwith a 22% relative reduction in death rates (CI, 5% to35%), whereas each nomination otherwise was not as-sociated with a significant reduction in death rates (rel-ative reduction in death rate, 3% [CI, 26% to 11%]).
Other factors were also linked to longevity. Womenlived longer than men (77.9 vs. 75.4 years; P , 0.001).Performers born in more recent decades also had re-duced death rates (relative reduction in death rate, 6%[CI, 2% to 10%]). No other baseline characteristic (Ta-ble 1) was significantly related to survival. Similarly, to-tal films in career—an indirect measure of income—wasunrelated to death rates among winners (relative reduc-tion in death rate, 0.1% [CI, 20.3% to 0.6%]), nomi-nees (relative reduction in death rate, 0.3% [CI, 20.1%to 0.6%]), and controls (relative reduction in death rate,0.0% [CI, 20.2% to 0.2%]). Age at first award wasrelated to longevity, in that later wins led to smallergains; for example, life expectancy beyond 50 years ofage was greater for those who won in their 30s com-pared with those in their 40s (32.7 vs. 26.6; P 5 0.007).
DISCUSSION
We found that winning an Academy Award wasassociated with a large gain in life expectancy for actorsand actresses. The apparent survival advantage amountedto about 4 extra years of life (CI, 1.6 to 6.2 years), couldnot be explained by simple birth demographics, and was
evident even though victory predated death by aboutfour decades. Survival among performers who werenominated but did not win was about the same as thatamong performers with no nominations. Survivalamong performers with many nominations was no bet-ter than among those with single nominations, unlessmore nominations generated more wins. Our observa-tions were not easily attributed to occupation, income,talent, random chance, measurement error, or reversecausality. Instead, the results suggest that success confersa survival advantage.
Several explanations might account for the increasedsurvival of Academy Award–winning actors and ac-tresses. Movie stars are often subjected to a personalscrutiny that far exceeds their dramatic achievements.They often need to preserve their image by continuallyavoiding disgraceful behaviors and maintaining exem-plary conduct. They may be surrounded by managersand others who are invested in the person’s reputationand can enforce high standards of behavior. They havepersonal chefs, trainers, nannies, or other staff that makeit easy to follow the ideals of lifestyle. Furthermore, amovie star may have more control, ability to avoidstress, self-efficacy, resources, admirers, motivation, andaccess to special privileges than others in society. Thefull mechanism of the apparent survival benefit amongsuccessful actors and actresses is not known. Untan-gling the explanations is further complicated becausesome stars also engage in superstitious and deleteriousbehaviors.
Causal inferences should take into account possibleconfounding. Factors might develop before, persist fordecades after, and be unaltered by the other effects ofwinning. These as-yet unidentified factors contribute toboth victory and longevity but not to nomination. Suchfactors are equally important in men and women, aremore intense in recent eras, and are unrelated to totalfilms in a career. They predict who will win an AcademyAward, will not change with repeated nominations, anddo not differ for those in supporting rather than leadingroles. Ambition, resilience, time preference, social sup-port, work stress, environmental pollutants, or child-hood experience (all of which have been suggested toplay a role in survival) do not easily satisfy these condi-tions, but such factors are not impossible. A factor thatwas present in 80% of winners and 20% of controls
Article Survival in Academy Award–Winning Actors and Actresses
960 15 May 2001 Annals of Internal Medicine Volume 134 • Number 10 www.annals.org
would explain our findings if it created a 6.5-year sur-vival difference.
Our study had two main limitations. First, informa-tion on many personal details, such as level of educa-tion, is not available for all performers. More biograph-ical work is needed, especially because such factors assmoking and alcohol intake account for only a modestproportion of the social inequities in population mortal-ity (19). Biographical work needs to include more per-formers than just extraordinary ones, because omittingperformers with three or four Academy Awards stillshowed a 27% difference in survival (CI, 10% to 42%).Second, for some people the sting of defeat is moreintense than the joy of victory (20). However, this asym-metry is unlikely to be the only explanatory factor, giventhat the average lifespan of controls was still muchhigher than that of the general U.S. adult populationduring the interval (21). Indeed, the results are surpris-ing because performers sometimes understate their age,which would cause our data to underestimate their sur-vival.
Winning an Academy Award can increase a per-former’s stature and may add to their longevity. Theabsolute difference in life expectancy is about equal tothe societal consequence of curing all cancers in all peo-ple for all time (22, 23). Moreover, movie stars whohave won multiple Academy Awards have a survival ad-vantage of 6.0 years (CI, 0.7 to 11.3 years) over per-formers with multiple films but no victories. Formaleducation is not the only way to improve health, andstrict poverty is not the only way to worsen health. Themain implication is that higher status may be linked tolower mortality rates even at very impressive levels ofachievement.
From University of Toronto, the Clinical Epidemiology and Health CareResearch Program, Sunnybrook and Women’s College Health SciencesCentre, and the Institute for Clinical Evaluative Sciences, Toronto,Ontario, Canada.
Acknowledgments: The authors thank Susan Campbell for data entry;Robert Tibshirani and Jerry Lawless for statistical insights; and PeterAustin, Ahmed Bayoumi, Chaim Bell, Victor Fuchs, David Juurlink,David Naylor, Miriam Shuchman, Leonard Syme, and John-Paul Szalaifor commenting on drafts of this manuscript.
Grant Support: Dr. Redelmeier was supported by a career scientistaward from the Ontario Ministry of Health, the de Souza Chair inClinical Trauma Research of the University of Toronto, and the Cana-
dian Institute for Health Research. Mr. Singh was supported by the Janeand Howard Jones Bursary at the University of Toronto.
Requests for Single Reprints: Donald A. Redelmeier, MD, Sunny-brook and Women’s College Health Sciences Centre, Room G-151,2075 Bayview Avenue, Toronto, Ontario M4N 3M5, Canada; e-mail,[email protected].
Current Author Addresses: Dr. Redelmeier: Sunnybrook and Women’sCollege Health Sciences Centre, Room G-151, 2075 Bayview Avenue,Toronto, Ontario M4N 3M5, Canada.Mr. Singh: Sunnybrook and Women’s College Health Sciences Centre,Room G-106, 2075 Bayview Avenue, Toronto, Ontario M4N 3M5,Canada.
Author Contributions: Conception and design: D.A. Redelmeier, S.M.Singh.Analysis and interpretation of the data: D.A. Redelmeier, S.M. Singh.Drafting of the article: D.A. Redelmeier, S.M. Singh.Critical revision of the article for important intellectual content: D.A.Redelmeier, S.M. Singh.Final approval of the article: D.A. Redelmeier, S.M. Singh.Provision of study materials or patients: S.M. Singh.Statistical expertise: D.A. Redelmeier.Obtaining of funding: D.A. Redelmeier, S.M. Singh.Administrative, technical, or logistic support: D.A. Redelmeier.Collection and assembly of data: D.A. Redelmeier, S.M. Singh.
References1. Marmot MG, Shipley MJ, Rose G. Inequalities in death—specific explana-tions of a general pattern? Lancet. 1984;1:1003-6. [PMID: 6143919]
2. Smith GD, Carroll D, Rankin S, Rowan D. Socioeconomic differentials inmortality: evidence from Glasgow graveyards. BMJ. 1992;305:1554-7. [PMID:1286385]
3. Evans RG, Barer ML, Marmor TR, eds. Why Are Some People Healthy andOthers Not? The Determinants of Health of Populations. New York: A. DeGruyter; 1994:3-26.
4. Syme SL, Balfour JL. Explaining inequalities in coronary heart disease. Lancet.1997;350:231-2. [PMID: 9242795]
5. Bureau of the Census. Statistical Abstract of the United States 1997. 117thedition. Washington, DC: U.S. Government Printing Office; 1997:287. Publi-cation no. 003-024-08825-8.
6. ABC’s Oscar ratings higher than last year. The Associated Press. 28 March2000.
7. Walker J, ed. Halliwell’s Filmgoer’s and Video Viewer’s Companion. 12th ed.Toronto: Harper Perennial; 1997.
8. Truitt EM. Who Was Who on Screen. 3rd ed. New York: RR Bowker; 1984.
9. Katz E. The Film Encyclopedia. New York: Thomas Crowell; 1979.
10. Fuller G, Lloyd A. The Illustrated Who’s Who of the Cinema. London:Orbis; 1983.
11. Pelikan S, Moskowitz M. Effects of lead time, length bias, and false-negativeassurance on screening for breast cancer. Cancer. 1993;71:1998-2005. [PMID:8443751]
ArticleSurvival in Academy Award–Winning Actors and Actresses
www.annals.org 15 May 2001 Annals of Internal Medicine Volume 134 • Number 10 961
12. Tunnell RD, Millar BW, Smith GB. The effect of lead time bias on severityof illness scoring, mortality prediction and standardised mortality ratio in inten-sive care—a pilot study. Anaesthesia. 1998;53:1045-53. [PMID: 10023272]
13. Taylor R. Measurement of population mortality. In: Kerr C, Taylor R,Heard G. Handbook of Public Health Methods. New York: McGraw-Hill;1998:57-9.
14. Gail MH. Does cardiac transplantation prolong life? A reassessment. AnnIntern Med. 1972;76:815-7. [PMID: 4554414
15. Cox DR, Oakes D. Time dependent covariates. In: Analysis of Survival Data.London: Chapman and Hall; 1984:112-41.
16. Glesby MJ, Hoover DR. Survivor treatment selection bias in observationalstudies: examples from the AIDS literature. Ann Intern Med. 1996;124:999-1005. [PMID: 8624068]
17. Katz MH. Multivariable Analysis: A Practical Guide for Clinicians. Cam-bridge, UK: Cambridge Univ Pr; 1999:173-5.
18. Fisher LD, Lin DY. Time-dependent covariates in the Cox proportional-
hazards regression model. Annu Rev Public Health. 1999;20:145-57. [PMID:10352854]
19. Lantz PM, House JS, Lepkowski JM, Williams DR, Mero RP, Chen J.Socioeconomic factors, health behaviors, and mortality: results from a nationallyrepresentative prospective study of US adults. JAMA. 1998;279:1703-8. [PMID:9624022]
20. Medvec VH, Madey SF, Gilovich T. When less is more: counterfactualthinking and satisfaction among Olympic medalists. J Pers Soc Psychol. 1995;69:603-10. [PMID: 7473022]
21. Bureau of the Census. Statistical Abstract of the United States 1996: TheNational Data Book. 116th ed. Washington, DC: U.S. Government PrintingOffice; 1996:88. Publication no. 003-024-08809-6.
22. Olshansky SJ, Carnes BA, Cassel C. In search of Methuselah: estimating theupper limits to human longevity. Science. 1990;250:634-40. [PMID: 2237414]
23. Detsky AS, Redelmeier DA. Measuring health outcomes—putting gains intoperspective [Editorial]. N Engl J Med. 1998;339:402-4. [PMID: 9691111]
There is plenty of pain that arises from within; this woman with a tumourgrowing in her neck, plain to feel it under experienced fingers, and then the usualweekly procession of pensioners hobbled by arthritis.
But the pain that comes from without—the violation of the flesh, a child isburned by an overturned pot of boiling water, or a knife is thrust. A bullet. Thispiercing of the flesh, the force, ram of a bullet deep into it, steel alloy that breaksbone as if shattering a teacup—she is not a surgeon but in this violent city she haswatched those nuggets delved for and prised out on operating tables, they retain thestreamline shape of velocity itself, there is no element in the human body that canwithstand, even dent, a bullet—those who survive recall the pain differently but onall accounts agree: an assault. The pain is the product of the self: somewhere, amystery medical science cannot explain, the self is responsible. But this—the bullet:the pure assault of pain.
The purpose of the doctor’s life is to defend the body against the violence ofpain. She stands on the other side of the divide from those who cause it. The divideof the ultimate, between life and death.
Nadine GordimerThe House GunNew York: Farrar, Straus, & Giroux; 1998:13
Submited by:Joel E. Gallant, MD, MPHJohns Hopkins UniversityBaltimore, MD 21287-0003
Submissions from readers are welcomed. If the quotation is published, the sender’s name will beacknowledged. Please include a complete citation (along with page number on which the quotation wasfound), as done for any reference.–The Editor
Article Survival in Academy Award–Winning Actors and Actresses
962 15 May 2001 Annals of Internal Medicine Volume 134 • Number 10 www.annals.org