Anna Brown, Gustavo López Mark Hugo...
24
FOR RELEASE JULY 20, 2016 BY Anna Brown, Gustavo López and Mark Hugo Lopez FOR MEDIA OR OTHER INQUIRIES: Mark Hugo Lopez, Director of Hispanic Research Brian Mahl, Communications Coordinator 202.419.4372 www.pewresearch.org RECOMMENDED CITATION: Brown, Anna, Gustavo López and Mark Hugo Lopez. 2016. “Digital Divide Narrows for Latinos as More Spanish Speakers and Immigrants Go Online” Washington, D.C.: Pew Research Center, July. NUMBERS, FACTS AND TRENDS SHAPING THE WORLD
-
Upload
trinhkhanh -
Category
Documents
-
view
221 -
download
0
Transcript of Anna Brown, Gustavo López Mark Hugo...
FOR RELEASE JULY 20, 2016
BY Anna Brown, Gustavo López and Mark Hugo Lopez
FOR MEDIA OR OTHER INQUIRIES:
Mark Hugo Lopez, Director of Hispanic Research
Brian Mahl, Communications Coordinator
202.419.4372
www.pewresearch.org
RECOMMENDED CITATION: Brown, Anna, Gustavo López and Mark Hugo Lopez. 2016. “Digital Divide Narrows for Latinos as More
Spanish Speakers and Immigrants Go Online” Washington, D.C.: Pew Research Center, July.
NUMBERS, FACTS AND TRENDS SHAPING THE WORLD

1
PEW RESEARCH CENTER
www.pewresearch.org
About Pew Research Center
Pew Research Center is a nonpartisan fact tank that informs the public about the issues, attitudes
and trends shaping America and the world. It does not take policy positions. The Center conducts
public opinion polling, demographic research, content analysis and other data-driven social
science research. It studies U.S. politics and policy; journalism and media; internet, science and
technology; religion and public life; Hispanic trends; global attitudes and trends; and U.S. social
and demographic trends. All of the Center’s reports are available at www.pewresearch.org. Pew
Research Center is a subsidiary of The Pew Charitable Trusts, its primary funder.
© Pew Research Center 2016
Terminology
The terms “Latino” and “Hispanic” are used interchangeably in this report.
The terms “whites” and “blacks” are used to refer to single-race, non-Hispanic components of their
populations.
“U.S. born” refers to persons who say they were born in the 50 states or the District of Columbia.
“Foreign born” refers to persons who say they were born outside of the United States. Foreign born
also refers to those born in Puerto Rico. Although individuals born in Puerto Rico are U.S. citizens
by birth, they are included among the foreign born because they are born into a Spanish-dominant
culture and because on many points their attitudes, views and beliefs are much closer to Hispanics
born abroad than to Hispanics born in the 50 states or the District of Columbia. The terms
“foreign born” and “immigrant” are used interchangeably.
Language dominance is a composite measure based on self-described assessments of speaking and
reading abilities. “Spanish-dominant” persons are more proficient in Spanish than in English, i.e.,
they speak and read Spanish “very well” or “pretty well” but rate their ability to speak and read
English lower. “Bilingual” refers to persons who are proficient in both English and Spanish.
“English-dominant” persons are more proficient in English than in Spanish.
In 2015, an “internet user” is someone who says they use the internet or email at least occasionally
and/or says they access the internet on a cellphone, tablet or other mobile handheld device at least
occasionally. Prior to 2012, internet users were defined as those who answered “yes” to “Do you

2
PEW RESEARCH CENTER
www.pewresearch.org
use the internet, at least occasionally?” and/or “Do you send or receive email, at least
occasionally?” See Methodology for details.
A person is considered to have “home internet” or a “home internet subscription” if they are an
internet user and report that they currently subscribe to internet service at home.
A person is considered to have “broadband access” or a “broadband subscription” if they say they
currently subscribe to internet service at home and confirm that they subscribe to a higher-speed
broadband service. Question wording has changed since 2010; see Topline for details.
A person is considered “smartphone dependent” if they do not have broadband internet access at
home but do use a mobile device to access the internet.
3
PEW RESEARCH CENTER
www.pewresearch.org
Table of contents
About Pew Research Center 1
Terminology 1
Digital Divide Narrows for Latinos as More Spanish Speakers and Immigrants Go Online 4
1. Internet use among Hispanics 7
Among Latinos, who goes online? 7
Rise in internet use has slowed among Hispanics, stalled among blacks and whites 8
2. Broadband subscriptions among Latinos little changed since 2010 10
Broadband use among Hispanics in 2015 varies across demographic subgroups 10
Little change in broadband use among Hispanics since 2010 11
3. Hispanics and mobile access to the internet 13
Mobile-device internet access among Latino subgroups 13
Growing share of online adults now access the internet with a mobile device 14
Acknowledgments 16
Methodology 17
Data sources 17
Methodology 17
Appendix A: References 21
Appendix B: Additional table 23
4
PEW RESEARCH CENTER
www.pewresearch.org
Digital Divide Narrows for Latinos as More Spanish Speakers
and Immigrants Go Online
The long-standing digital divide in internet use between Latinos and whites is now at its narrowest
point since 2009 as immigrant Latinos and Spanish-dominant Latinos make big strides in going
online, according to newly released results from Pew Research Center’s 2015 National Survey of
Latinos. Meanwhile, broadband use among Latinos is little changed since 2010.
The story of technological adoption among Latinos has long been a unique one. While Latinos
have lagged other groups in accessing the internet and having broadband at home, they have been
among the most likely to own a smartphone, to live in a household without a landline phone where
only a cellphone is available1 and to access the internet from a mobile device.
1 According to the National Center for Health Statistics, the July-December 2015 National Health Interview Survey estimates that 60.5% of
Hispanic adults live in a household with only cellular telephones. By comparison, 44% of whites, 48.5% of blacks and 48.4% of Asians live in
these households.
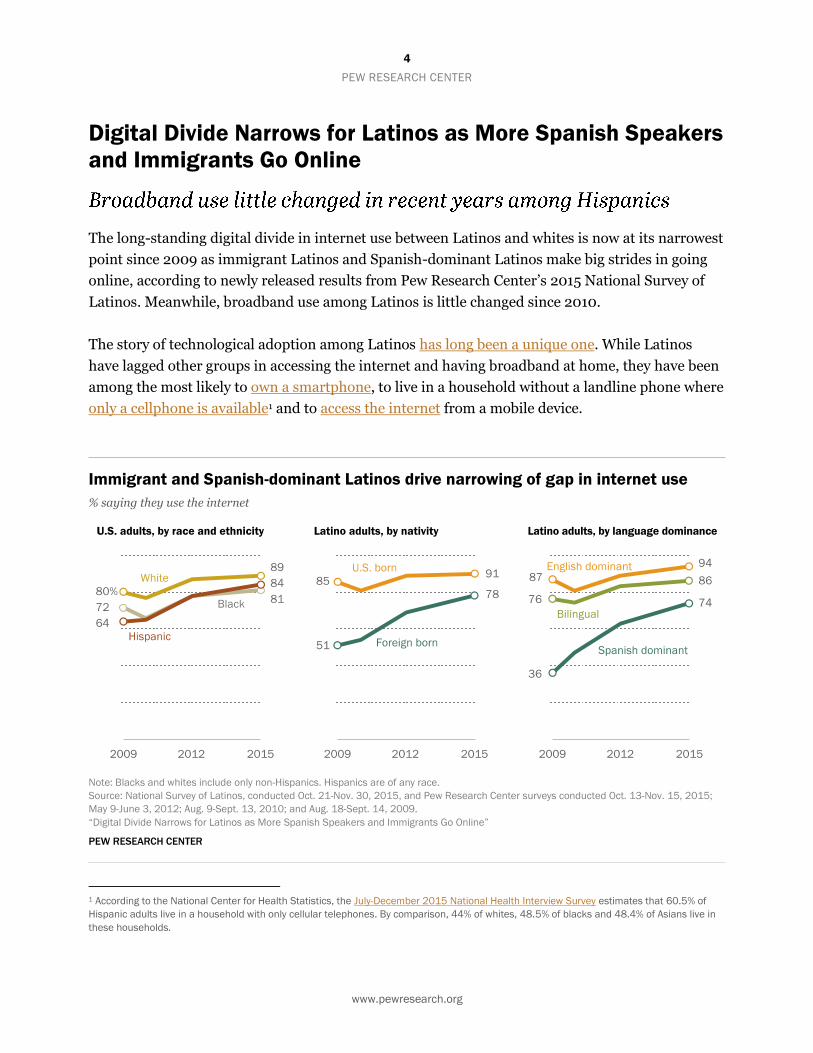
Immigrant and Spanish-dominant Latinos drive narrowing of gap in internet use
% saying they use the internet
Note: Blacks and whites include only non-Hispanics. Hispanics are of any race.
Source: National Survey of Latinos, conducted Oct. 21-Nov. 30, 2015, and Pew Research Center surveys conducted Oct. 13-Nov. 15, 2015;
May 9-June 3, 2012; Aug. 9-Sept. 13, 2010; and Aug. 18-Sept. 14, 2009.
“Digital Divide Narrows for Latinos as More Spanish Speakers and Immigrants Go Online”
PEW RESEARCH CENTER
5
PEW RESEARCH CENTER
www.pewresearch.org
Since 2009, the share of Latino adults who report using the internet increased 20 percentage
points, up from 64% then to 84% in 2015. Over the same period, internet use among whites grew
too, though at a slower rate, moving from 80% to 89%. As a result, the gap in internet use between
Latinos and whites declined from 16 percentage points in 2009 to 5 percentage points in 2015.
Big gains in internet use made by immigrant Hispanics and Spanish-dominant Hispanics, two
closely linked groups,2 have been the main drivers in closing this gap. Both groups have long had
among the lowest internet use rates among Hispanics – and that is still the case today. Even so,
between 2009 and 2015, the share of immigrant Hispanics who use the internet grew from 51% to
78%. And over the same period, the share of Spanish-dominant Hispanics who use the internet
about doubled, from 36% to 74%. As a result, the digital divide among Hispanics has also
diminished.
As internet use has grown more common
among Latinos, the demographic profile of
Latino internet users has also changed and is
now more representative of the Hispanic adult
population. In 2015, immigrant Latinos made
up about half (52%) of all adult Latino internet
users, up from 44% in 2009. And Spanish-
dominant Latinos made up 32% of all Latino
internet users in 2015, up from 20% in 2009.
In both cases, these shares closely match each
group’s share among the adult Latino
population overall. (Immigrant Latinos make
up 49% of the adult Latino population, and
those who are Spanish dominant make up 38%
of Latino adults.) Still, the 16% of Hispanics
who do not access the internet remain largely
foreign born (77%) and Spanish dominant
(58%).
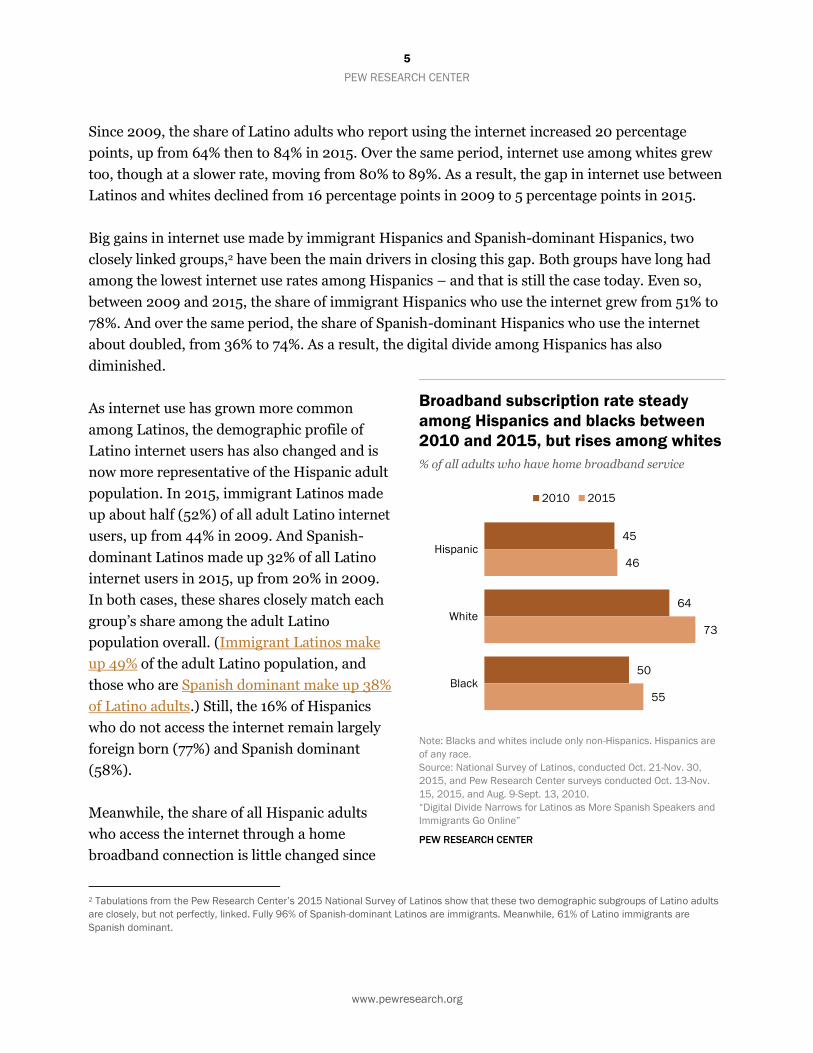
Meanwhile, the share of all Hispanic adults
who access the internet through a home
broadband connection is little changed since
2 Tabulations from the Pew Research Center’s 2015 National Survey of Latinos show that these two demographic subgroups of Latino adults
are closely, but not perfectly, linked. Fully 96% of Spanish-dominant Latinos are immigrants. Meanwhile, 61% of Latino immigrants are
Spanish dominant.
Broadband subscription rate steady
among Hispanics and blacks between
2010 and 2015, but rises among whites
% of all adults who have home broadband service
Note: Blacks and whites include only non-Hispanics. Hispanics are
of any race.
Source: National Survey of Latinos, conducted Oct. 21-Nov. 30,
2015, and Pew Research Center surveys conducted Oct. 13-Nov.
15, 2015, and Aug. 9-Sept. 13, 2010.
“Digital Divide Narrows for Latinos as More Spanish Speakers and
Immigrants Go Online”
PEW RESEARCH CENTER
45
64
50
46
73
55
Hispanic
White
Black
2010 2015

6
PEW RESEARCH CENTER
www.pewresearch.org
2010. Then, 45% said they accessed the internet through a broadband home connection. Today
that share is 46%. Among blacks too there was little change in the share of adults who have
broadband access at home – 50% in 2010 and 55% in 2015. Over the same period, that share
among whites grew from 64% to 73%.
The Latino survey also shows that among Latino adults, 80% access the internet from a mobile
device, similar to the shares among whites (76%) and blacks (77%) in 2015.
More than 55 million Hispanics live in the U.S. today. The nation’s Hispanic population is also one
of the country’s fastest growing groups. It is also among the nation’s youngest – nearly half are
under the age of 18.
These findings on internet use emerge from the 2015 National Survey of Latinos by Pew Research
Center. The survey was conducted in English and Spanish on landline and cellular telephones
among a randomly selected, nationally representative sample of 1,500 Latino adults in all 50 states
and the District of Columbia. The survey was fielded from Oct. 21 to Nov. 30, 2015, and has a
margin of error of plus or minus 3.3 percentage points at the 95% confidence level.
7
PEW RESEARCH CENTER
www.pewresearch.org
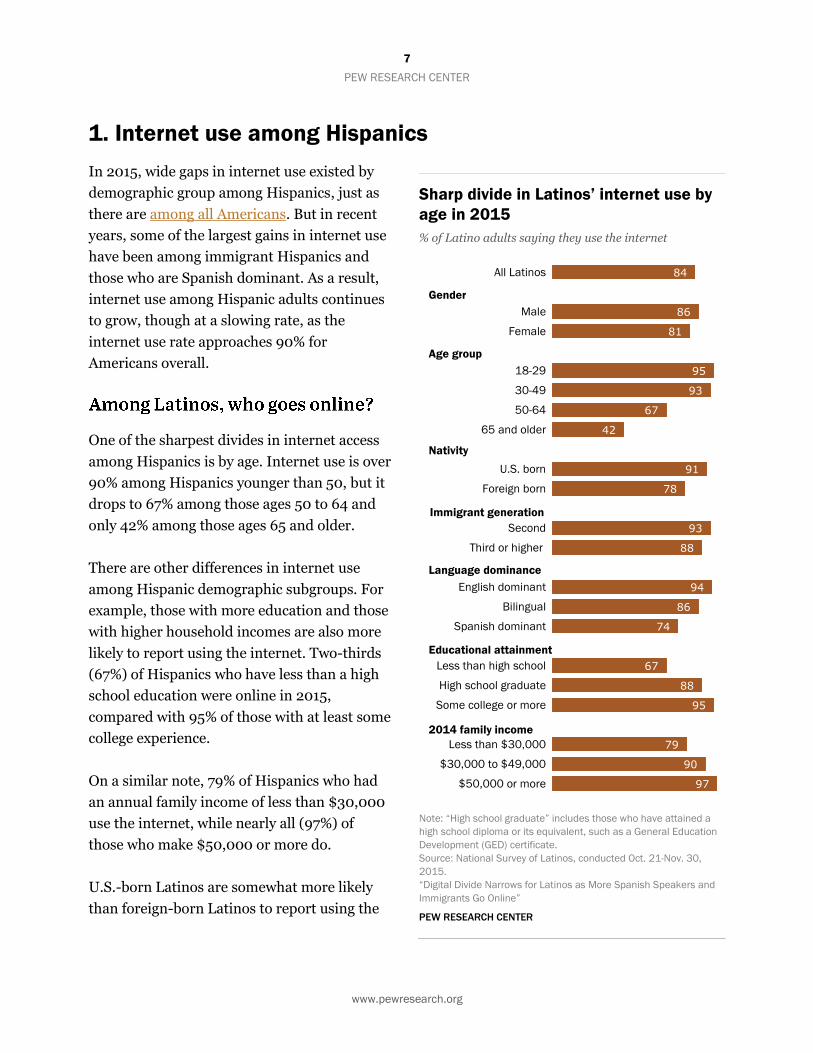
1. Internet use among Hispanics
In 2015, wide gaps in internet use existed by
demographic group among Hispanics, just as
there are among all Americans. But in recent
years, some of the largest gains in internet use
have been among immigrant Hispanics and
those who are Spanish dominant. As a result,
internet use among Hispanic adults continues
to grow, though at a slowing rate, as the
internet use rate approaches 90% for
Americans overall.
One of the sharpest divides in internet access
among Hispanics is by age. Internet use is over
90% among Hispanics younger than 50, but it
drops to 67% among those ages 50 to 64 and
only 42% among those ages 65 and older.
There are other differences in internet use
among Hispanic demographic subgroups. For
example, those with more education and those
with higher household incomes are also more
likely to report using the internet. Two-thirds
(67%) of Hispanics who have less than a high
school education were online in 2015,
compared with 95% of those with at least some
college experience.
On a similar note, 79% of Hispanics who had
an annual family income of less than $30,000
use the internet, while nearly all (97%) of
those who make $50,000 or more do.
U.S.-born Latinos are somewhat more likely
than foreign-born Latinos to report using the
Sharp divide in Latinos’ internet use by
age in 2015
% of Latino adults saying they use the internet
Note: “High school graduate” includes those who have attained a
high school diploma or its equivalent, such as a General Education
Development (GED) certificate.
Source: National Survey of Latinos, conducted Oct. 21-Nov. 30,
2015.
“Digital Divide Narrows for Latinos as More Spanish Speakers and
Immigrants Go Online”
PEW RESEARCH CENTER
84
86
81
95
93
67
42
91
78
93
88
94
86
74
67
88
95
79
90
97
All Latinos
Male
Female
18-29
30-49
50-64
65 and older
U.S. born
Foreign born
Second
Third or higher
English dominant
Bilingual
Spanish dominant
Less than high school
High school graduate
Some college or more
Less than $30,000
$30,000 to $49,000
$50,000 or more
Gender
Nativity
Immigrant generation
Language dominance
Educational attainment
2014 family income
Age group
8
PEW RESEARCH CENTER
www.pewresearch.org
internet (91% vs. 78%), but among U.S.-born Latinos, there is no significant difference between
second- or third-generation or higher Latinos when looking only at the U.S. born.
Those who speak primarily English are more likely to be online (94%), compared with those who
are bilingual (86%) or who speak primarily Spanish (74%).
There is no significant difference between Hispanic men and Hispanic women on the share who
use the internet.
Similar demographic
patterns emerge when
looking at all adults, though
the differences are less
pronounced since a larger
share of older and less-
educated U.S. adults use the
internet.
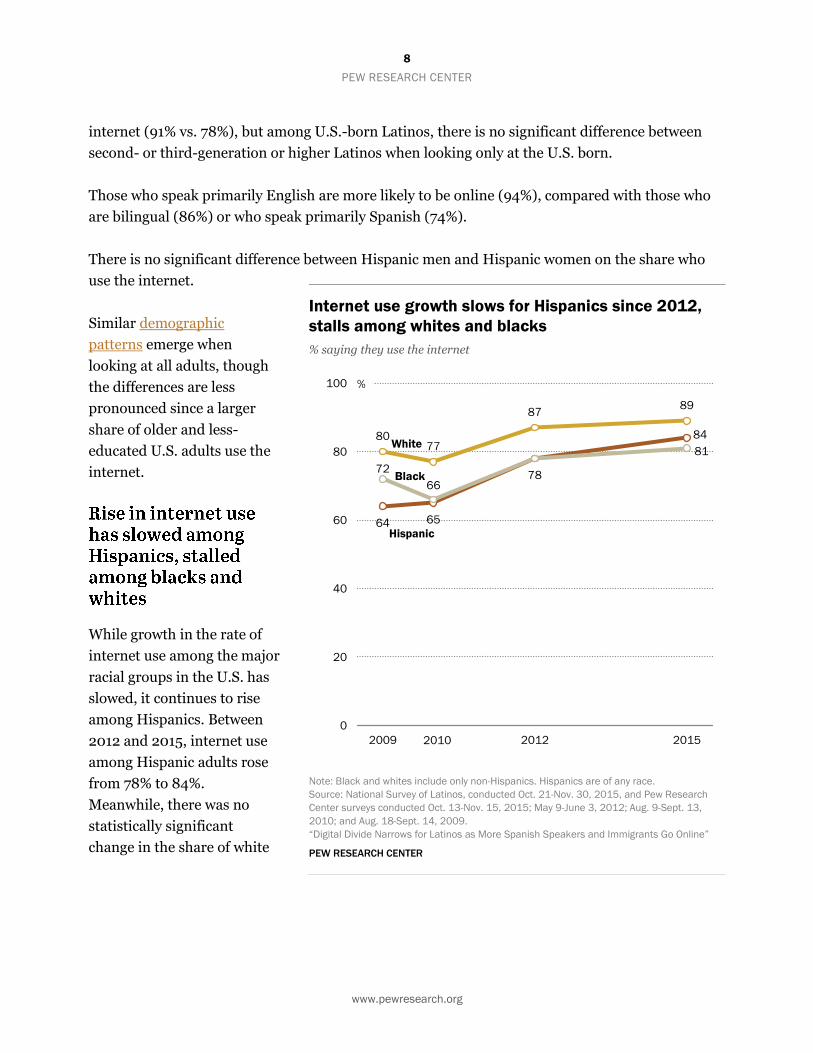
While growth in the rate of
internet use among the major
racial groups in the U.S. has
slowed, it continues to rise
among Hispanics. Between
2012 and 2015, internet use
among Hispanic adults rose
from 78% to 84%.
Meanwhile, there was no
statistically significant
change in the share of white
Internet use growth slows for Hispanics since 2012,
stalls among whites and blacks
% saying they use the internet
Note: Black and whites include only non-Hispanics. Hispanics are of any race.
Source: National Survey of Latinos, conducted Oct. 21-Nov. 30, 2015, and Pew Research
Center surveys conducted Oct. 13-Nov. 15, 2015; May 9-June 3, 2012; Aug. 9-Sept. 13,
2010; and Aug. 18-Sept. 14, 2009.
“Digital Divide Narrows for Latinos as More Spanish Speakers and Immigrants Go Online”
PEW RESEARCH CENTER
64 65
78
84 80 77
87 89
72
66
81
0
20
40
60
80
100
2009 2012 2015
Hispanic
%
White
Black
2010

9
PEW RESEARCH CENTER
www.pewresearch.org
and black adults who report they use the internet.3
Just about all of the change in Hispanics’ internet since 2012 took place among the foreign born.
While internet use among the U.S. born was steady from 2012 to 2015, the share of foreign-born
Hispanics who say they use the internet increased from 69% to 78% over this period.
Similarly, those who are Spanish dominant saw the greatest increase in internet use, rising from
63% in 2012 to 74% in 2015 – an 11-percentage-point increase. By contrast, internet use rose
slightly among English-dominant Hispanics and stayed about the same for bilingual Hispanics.
3 See Methodology section for details on how the Pew Research Center’s measure of internet use has changed over time.
10
PEW RESEARCH CENTER
www.pewresearch.org
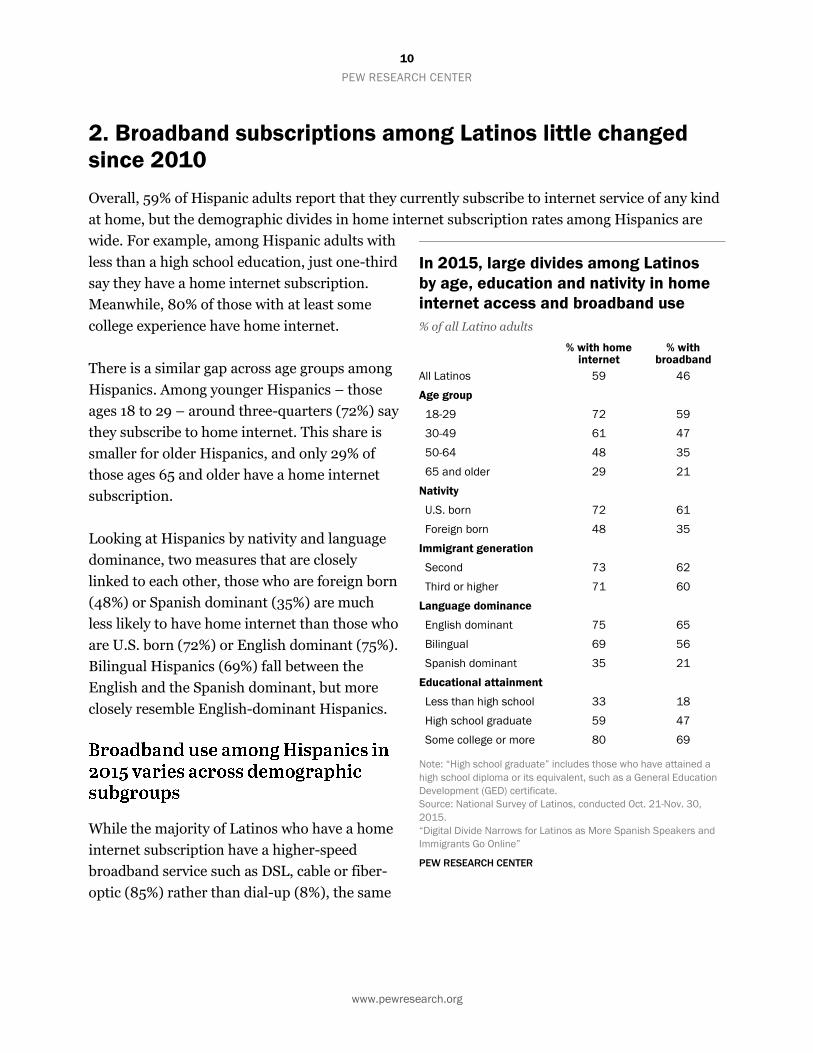
2. Broadband subscriptions among Latinos little changed
since 2010
Overall, 59% of Hispanic adults report that they currently subscribe to internet service of any kind
at home, but the demographic divides in home internet subscription rates among Hispanics are
wide. For example, among Hispanic adults with
less than a high school education, just one-third
say they have a home internet subscription.
Meanwhile, 80% of those with at least some
college experience have home internet.
There is a similar gap across age groups among
Hispanics. Among younger Hispanics – those
ages 18 to 29 – around three-quarters (72%) say
they subscribe to home internet. This share is
smaller for older Hispanics, and only 29% of
those ages 65 and older have a home internet
subscription.
Looking at Hispanics by nativity and language
dominance, two measures that are closely
linked to each other, those who are foreign born
(48%) or Spanish dominant (35%) are much
less likely to have home internet than those who
are U.S. born (72%) or English dominant (75%).
Bilingual Hispanics (69%) fall between the
English and the Spanish dominant, but more
closely resemble English-dominant Hispanics.
While the majority of Latinos who have a home
internet subscription have a higher-speed
broadband service such as DSL, cable or fiber-
optic (85%) rather than dial-up (8%), the same
In 2015, large divides among Latinos
by age, education and nativity in home
internet access and broadband use
% of all Latino adults
% with home
internet % with
broadband
All Latinos 59 46
Age group
18-29 72 59
30-49 61 47
50-64 48 35
65 and older 29 21
Nativity
U.S. born 72 61
Foreign born 48 35
Immigrant generation
Second 73 62
Third or higher 71 60
Language dominance
English dominant 75 65
Bilingual 69 56
Spanish dominant 35 21
Educational attainment
Less than high school 33 18
High school graduate 59 47
Some college or more 80 69
Note: “High school graduate” includes those who have attained a
high school diploma or its equivalent, such as a General Education
Development (GED) certificate.
Source: National Survey of Latinos, conducted Oct. 21-Nov. 30,
2015.
“Digital Divide Narrows for Latinos as More Spanish Speakers and
Immigrants Go Online”
PEW RESEARCH CENTER
11
PEW RESEARCH CENTER
www.pewresearch.org
groups that are the most likely to have a home internet subscription of any kind are also the most
likely to have broadband service among home internet subscribers.4
Among Hispanic adults, those who are young (59% of those ages 18 to 29 and 47% of those ages 30
to 49), U.S. born (61%), English dominant (65%) or the most highly educated (69% of those with
at least some college experience and 47% of high school graduates) are the most likely to subscribe
to a high-speed broadband service rather than dial-up internet service or no home internet service
at all.
For example, while about two-in-ten Hispanic adults with less than a high school education (18%)
report that they have broadband, 47% of high school graduates and 69% of those with at least
some college experience say the same.
The U.S. born are about twice as likely as the
foreign born to say they have a broadband
subscription (61% vs. 35%) and the English
dominant and bilingual are similarly more
likely than the Spanish dominant to say this
(65% of English-dominant Hispanics vs. 56%
of bilingual Hispanics and 21% of the Spanish
dominant).
Some 59% of Hispanics ages 18 to 29 say they
have a broadband subscription, compared
with about half (47%) of those ages 30 to 49,
35% of those ages 50 to 64 and only 21% of
those ages 65 and older.
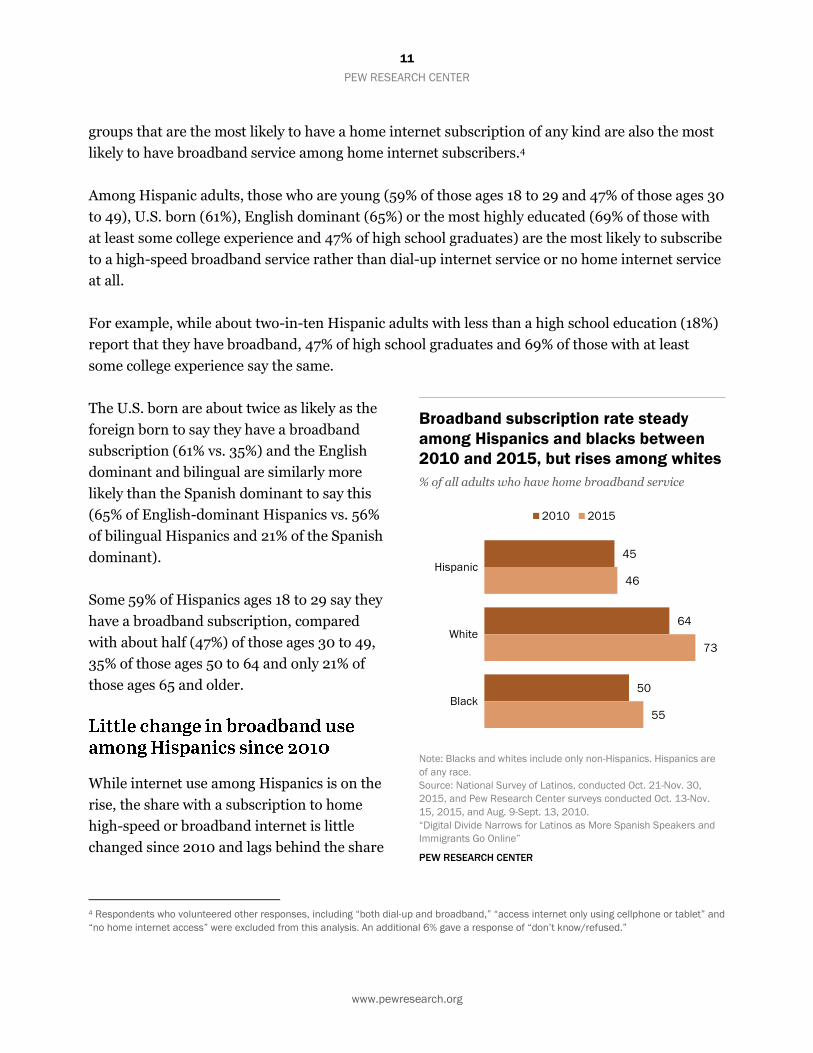
While internet use among Hispanics is on the
rise, the share with a subscription to home
high-speed or broadband internet is little
changed since 2010 and lags behind the share
4 Respondents who volunteered other responses, including “both dial-up and broadband,” “access internet only using cellphone or tablet” and
“no home internet access” were excluded from this analysis. An additional 6% gave a response of “don’t know/refused.”
Broadband subscription rate steady
among Hispanics and blacks between
2010 and 2015, but rises among whites
% of all adults who have home broadband service
Note: Blacks and whites include only non-Hispanics. Hispanics are
of any race.
Source: National Survey of Latinos, conducted Oct. 21-Nov. 30,
2015, and Pew Research Center surveys conducted Oct. 13-Nov.
15, 2015, and Aug. 9-Sept. 13, 2010.
“Digital Divide Narrows for Latinos as More Spanish Speakers and
Immigrants Go Online”
PEW RESEARCH CENTER
45
64
50
46
73
55
Hispanic
White
Black
2010 2015
12
PEW RESEARCH CENTER
www.pewresearch.org
of whites with home broadband service.
Just 46% of Hispanic adults in 2015 say they have home broadband service, virtually unchanged
since 2010 when 45% said the same. A greater share of blacks than Hispanics – 55% versus 46% in
2015 – have home broadband service, yet for blacks too, the share with home broadband is little
changed since 2010, when 50% had the service. Meanwhile, the share of whites with broadband
home service is 73% in 2015, up 9 percentage points since 2010.

13
PEW RESEARCH CENTER
www.pewresearch.org
3. Hispanics and mobile
access to the internet
Mobile devices such as smartphones and
tablets have made accessing the internet easier
in recent years – although those who rely
heavily on these devices for online access can
face challenges accessing certain online
services and information. And among
Hispanic internet users, the new survey shows
a greater share today use these mobile devices
to go online than in 2012.
Overall, 80% of Latino adults say they access
the internet via a mobile device such as a
cellphone or tablet at least occasionally. This
high share, however, belies large differences
among Latino demographic subgroups.
For example, while nearly all 18- to 29-year-
old Latinos (94%) and 30- to 49-year-old
Latinos (89%) use the internet on a mobile
device, 58% of Latinos ages 50 to 64 and less
than half of those ages 65 and older (35%) do
so.
The likelihood of using mobile internet
increases with more education and with a
higher family income. While about six-in-ten
Hispanic adults with less than a high school
education (63%) say they use the internet on a
mobile device, about nine-in-ten with at least
some college experience (91%) say the same. A
Mobile internet use was more popular
among youngest and most-educated
Latinos in 2015
% of Latino adults saying they access the internet on a
cellphone, tablet or other mobile device, at least
occasionally
Note: Those with a high school diploma include persons who have
attained its equivalent, such as a General Educational Development
(GED) certificate.
Source: National Survey of Latinos, conducted Oct. 21-Nov. 30,
2015.
“Digital Divide Narrows for Latinos as More Spanish Speakers and
Immigrants Go Online”
PEW RESEARCH CENTER
80
81
78
94
89
58
35
86
75
89
81
86
83
71
63
83
91
77
84
94
All Latinos
Male
Female
18-29
30-49
50-64
65 and older
U.S. born
Foreign born
Second
Third or higher
English dominant
Bilingual
Spanish dominant
Less than high school
High school graduate
Some college or more
Less than $30,000
$30,000 to $49,000
$50,000 or more
Gender
Nativity
Immigrant generation
Language dominance
Educational attainment
2014 family income
Age group
14
PEW RESEARCH CENTER
www.pewresearch.org
similar pattern exists for family income, ranging from 77% among those with a family income of
less than $30,000 in 2014 up to 94% among those in families earning $50,000 or more.
Smaller differences exist by language dominance and nativity. Fully 86% of English-dominant and
83% of bilingual Hispanic adults use mobile internet, a somewhat higher share than that among
Spanish-dominant Hispanic adults (71%). Also, the U.S. born (86%) are more likely than the
foreign born (75%) to use mobile internet.
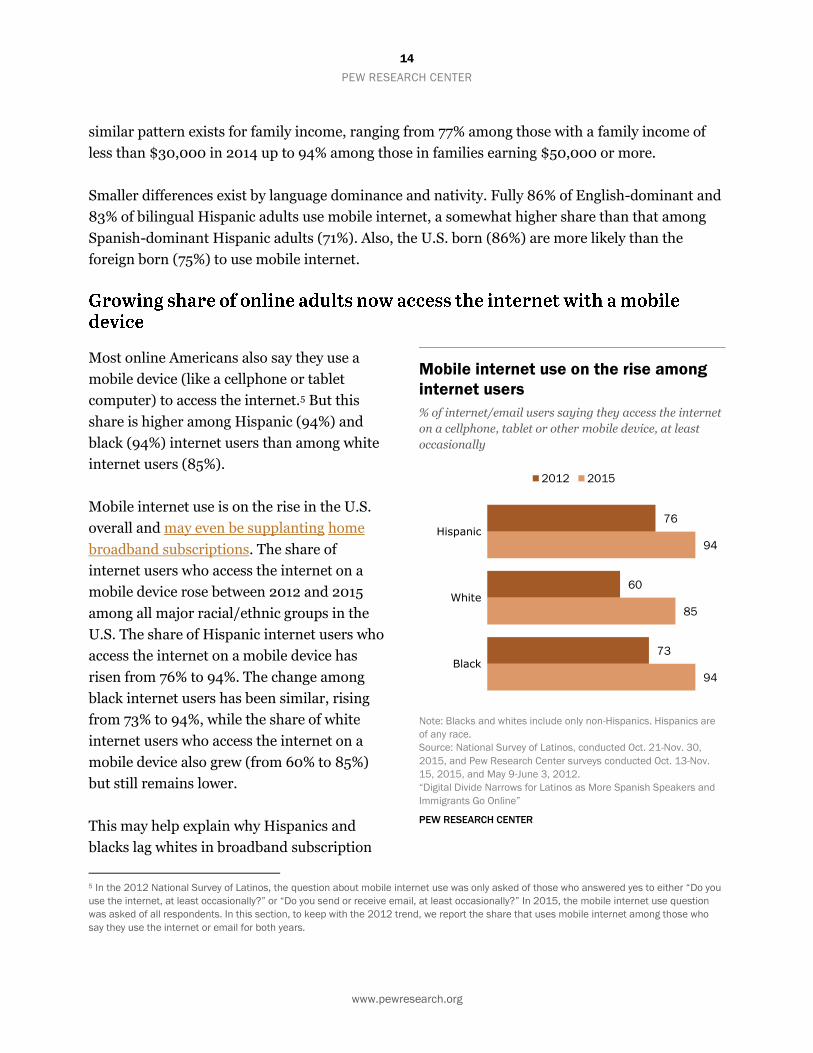
Most online Americans also say they use a
mobile device (like a cellphone or tablet
computer) to access the internet.5 But this
share is higher among Hispanic (94%) and
black (94%) internet users than among white
internet users (85%).
Mobile internet use is on the rise in the U.S.
overall and may even be supplanting home
broadband subscriptions. The share of
internet users who access the internet on a
mobile device rose between 2012 and 2015
among all major racial/ethnic groups in the
U.S. The share of Hispanic internet users who
access the internet on a mobile device has
risen from 76% to 94%. The change among
black internet users has been similar, rising
from 73% to 94%, while the share of white
internet users who access the internet on a
mobile device also grew (from 60% to 85%)
but still remains lower.
This may help explain why Hispanics and
blacks lag whites in broadband subscription
5 In the 2012 National Survey of Latinos, the question about mobile internet use was only asked of those who answered yes to either “Do you
use the internet, at least occasionally?” or “Do you send or receive email, at least occasionally?” In 2015, the mobile internet use question
was asked of all respondents. In this section, to keep with the 2012 trend, we report the share that uses mobile internet among those who
say they use the internet or email for both years.
Mobile internet use on the rise among
internet users
% of internet/email users saying they access the internet
on a cellphone, tablet or other mobile device, at least
occasionally
Note: Blacks and whites include only non-Hispanics. Hispanics are
of any race.
Source: National Survey of Latinos, conducted Oct. 21-Nov. 30,
2015, and Pew Research Center surveys conducted Oct. 13-Nov.
15, 2015, and May 9-June 3, 2012.
“Digital Divide Narrows for Latinos as More Spanish Speakers and
Immigrants Go Online”
PEW RESEARCH CENTER
94
85
94
73
60
76
Black
White
Hispanic
2012 2015

15
PEW RESEARCH CENTER
www.pewresearch.org
rates. Only 10% of white smartphone owners are considered “smartphone dependent,” meaning
that they do not have broadband internet access at home but do use a mobile device to access the
internet. Hispanic and black smartphone owners, however, are twice as likely to be smartphone
dependent – 23% of Hispanics and 19% of blacks fall into this group.6
6 Data on smartphone dependence come from a Pew Research Center survey conducted June 10-July 12, 2015.

16
PEW RESEARCH CENTER
www.pewresearch.org
Acknowledgments
This report was written by Anna Brown, research analyst; Gustavo López, research assistant; and
Mark Hugo Lopez, director of Hispanic research. Claudia Deane, vice president of research, and
Aaron Smith, associate director of research, provided editorial guidance. Andrew Perrin, research
assistant, provided research assistance. Michael Keegan, information graphics designer, assisted
with chart creation. Gustavo López number-checked the report. David Kent copy edited the report.
Find related reports online at pewresearch.org/hispanic.
17
PEW RESEARCH CENTER
www.pewresearch.org
Methodology
Unless otherwise noted, all estimates for Hispanics come from Pew Research Center’s National
Survey of Latinos, while estimates for whites and blacks are derived from other Pew Research
Center surveys.
Questions about technology have been modified over time. Prior to 2015, internet and email use
were asked as two separate questions. Internet use read “Do you use the internet, at least
occasionally?” Email use read “Do you send or receive email, at least occasionally?” and was asked
of those who said “No” or “Don’t know/Refused” to internet use. Those who said they used the
internet, email or both were considered internet users. For 2015, internet users are defined as
someone who said “yes” to either “Do you use the internet or email, at least occasionally?” or “Do
you access the internet on a cellphone, tablet or other mobile handheld device, at least
occasionally?”
Cellphones were included in survey samples beginning in 2008.
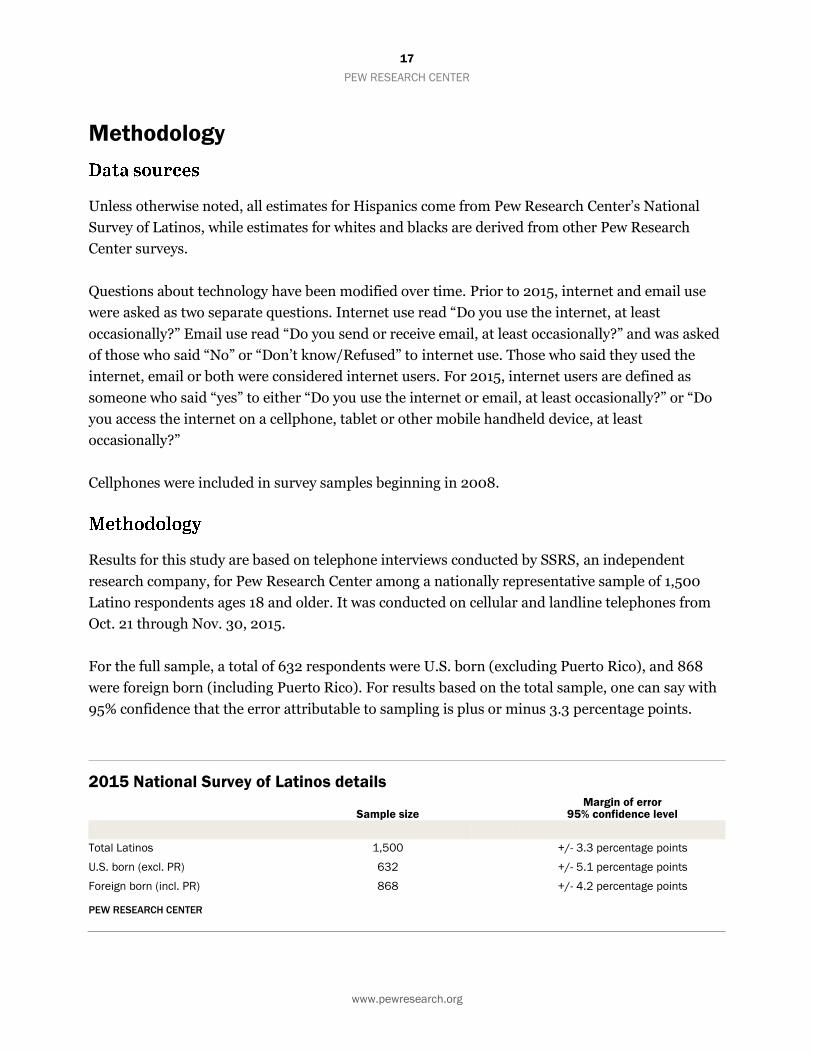
Results for this study are based on telephone interviews conducted by SSRS, an independent
research company, for Pew Research Center among a nationally representative sample of 1,500
Latino respondents ages 18 and older. It was conducted on cellular and landline telephones from
Oct. 21 through Nov. 30, 2015.
For the full sample, a total of 632 respondents were U.S. born (excluding Puerto Rico), and 868
were foreign born (including Puerto Rico). For results based on the total sample, one can say with
95% confidence that the error attributable to sampling is plus or minus 3.3 percentage points.
2015 National Survey of Latinos details
Sample size Margin of error
95% confidence level
Total Latinos 1,500 +/- 3.3 percentage points
U.S. born (excl. PR) 632 +/- 5.1 percentage points
Foreign born (incl. PR) 868 +/- 4.2 percentage points
PEW RESEARCH CENTER

18
PEW RESEARCH CENTER
www.pewresearch.org
For this survey, SSRS used a staff of bilingual English- and Spanish-speaking interviewers who,
when contacting a household, were able to offer respondents the option of completing the survey
in either language. A total of 679 respondents (45%) were surveyed in Spanish, and 821
respondents (55%) were interviewed in English. Any person ages 18 or older who said he or she
was of Latino origin or descent was eligible to complete the survey.
To ensure the highest possible coverage of the eligible population, the study employed a dual-
frame landline/cellular telephone design. The sample consisted of a landline sampling frame
(yielding 449 completed interviews) and a cellphone sampling frame (1,051 interviews).7 Both the
landline and cellphone sampling frames used a stratified sampling design, oversampling areas
with higher densities of Latino residents. Overall the study employed six strata. Landline and
cellphone samples were provided by Marketing Systems Group (MSG).
For the landline sampling frame, the sample was compared with InfoUSA and Experian landline
household databases, and phone numbers associated with households that included persons with
known Latino surnames were subdivided into a surname stratum. The remaining, unmatched and
unlisted landline sample was used to generate a stratum with a high incidence of Latinos, based
upon the share of Latinos in the sample telephone exchange.
It is important to note that the existence of a surname stratum does not mean the survey was
exclusively a surname sample design. The sample is RDD (random-digit dial), with the randomly
selected telephone numbers divided by whether or not they were found to be associated with a
Spanish surname. This was done to ease administration by allowing for more effective assignment
of interviewers and labor hours, as well as to increase the efficiency of the sample.
MSG’s GENESYS sample generation system was used to generate the cellphone sample, which was
divided into high and medium strata, based upon the share of Latinos in the sample telephone
area code.
Samples for the low-incidence landline and low-incidence cell strata were drawn from previously
interviewed respondents in SSRS’s weekly dual-frame Excel omnibus survey. Respondents who
indicated they were Latino on the omnibus survey were eligible to be re-contacted for this survey.
Altogether, a total of 293 previously interviewed respondents were included in this sample.
7 According to calculations by the National Center for Health Statistics National Health Interview Survey (NHIS), from January to June 2015,
59% of Hispanic adults were living in wireless-only households and 15% were in wireless-mostly households (Blumberg and Luke, 2015).
19
PEW RESEARCH CENTER
www.pewresearch.org
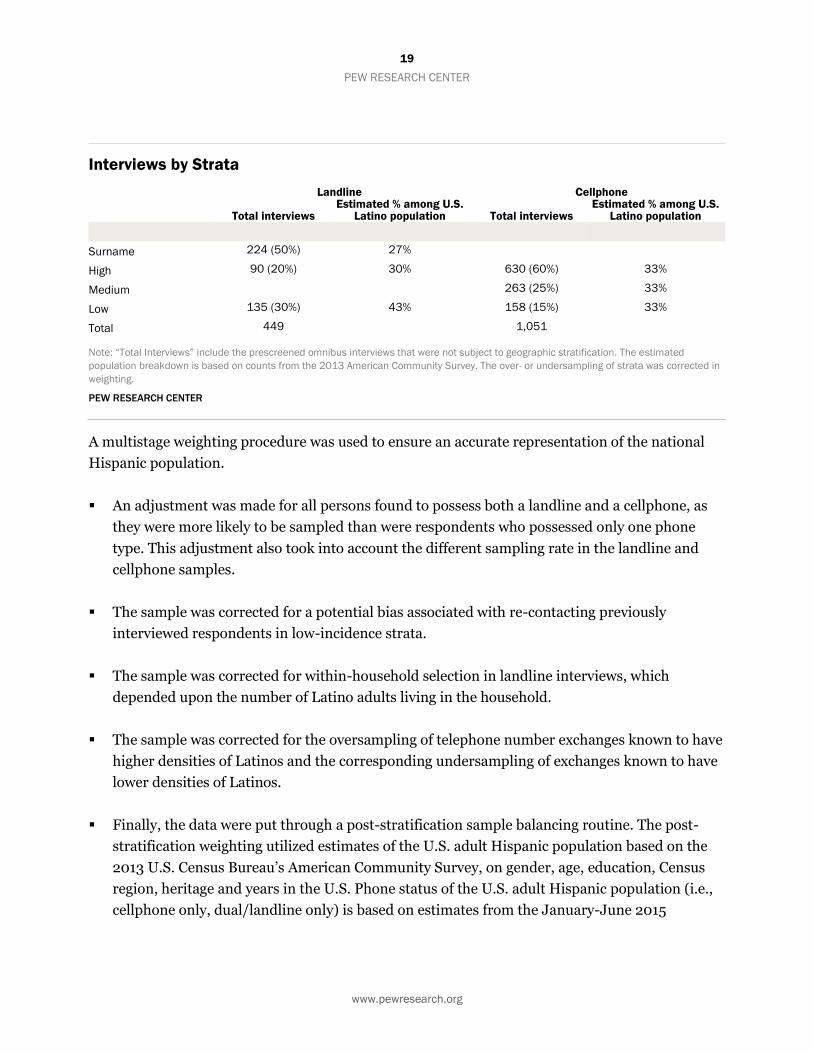
A multistage weighting procedure was used to ensure an accurate representation of the national
Hispanic population.
An adjustment was made for all persons found to possess both a landline and a cellphone, as
they were more likely to be sampled than were respondents who possessed only one phone
type. This adjustment also took into account the different sampling rate in the landline and
cellphone samples.
The sample was corrected for a potential bias associated with re-contacting previously
interviewed respondents in low-incidence strata.
The sample was corrected for within-household selection in landline interviews, which
depended upon the number of Latino adults living in the household.
The sample was corrected for the oversampling of telephone number exchanges known to have
higher densities of Latinos and the corresponding undersampling of exchanges known to have
lower densities of Latinos.
Finally, the data were put through a post-stratification sample balancing routine. The post-
stratification weighting utilized estimates of the U.S. adult Hispanic population based on the
2013 U.S. Census Bureau’s American Community Survey, on gender, age, education, Census
region, heritage and years in the U.S. Phone status of the U.S. adult Hispanic population (i.e.,
cellphone only, dual/landline only) is based on estimates from the January-June 2015
Interviews by Strata
Landline Cellphone
Total interviews Estimated % among U.S.
Latino population Total interviews Estimated % among U.S.
Latino population
Surname 224 (50%) 27%
High 90 (20%) 30% 630 (60%) 33%
Medium 263 (25%) 33%
Low 135 (30%) 43% 158 (15%) 33%
Total 449 1,051
Note: “Total Interviews” include the prescreened omnibus interviews that were not subject to geographic stratification. The estimated
population breakdown is based on counts from the 2013 American Community Survey. The over- or undersampling of strata was corrected in
weighting.
PEW RESEARCH CENTER
20
PEW RESEARCH CENTER
www.pewresearch.org
National Health Interview Survey conducted by the U.S. Centers for Disease Control and
Prevention; the density of the Latino population is from the 2010 census.
Weights are then trimmed to avoid any particular case having too much influence on the
overall estimates.
Pew Research Center undertakes all polling activity, including calls to mobile telephone numbers,
in compliance with the Telephone Consumer Protection Act and other applicable law.

21
PEW RESEARCH CENTER
www.pewresearch.org
Appendix A: References
Blumberg, Stephen J. and Julian V. Luke. 2016. “Wireless Substitution: Early Release of Estimates
From the National Health Interview Survey, July–December 2015.” Atlanta: Centers for
Disease Control and Prevention, May.
http://www.cdc.gov/nchs/data/nhis/earlyrelease/wireless201605.pdf
Fox, Susannah and Gretchen Livingston. 2007. “Latinos Online.” Washington, D.C.: Pew Research
Center, March. http://www.pewhispanic.org/2007/03/14/latinos-online/
Horrigan, John B. and Maeve Duggan. 2015. “Home Broadband 2015.” Washington, D.C.: Pew
Research Center, December. http://www.pewinternet.org/2015/12/21/home-broadband-
2015/
Krogstad, Jens Manuel and Ana Gonzalez-Barrera. 2015. “A majority of English-speaking
Hispanics in the U.S. are bilingual.” Washington, D.C.: Pew Research Center, March.
http://www.pewresearch.org/fact-tank/2015/03/24/a-majority-of-english-speaking-
hispanics-in-the-u-s-are-bilingual/
Krogstad, Jens Manuel and Mark Hugo Lopez. 2015. “Hispanic population reaches record 55
million, but growth has cooled.” Washington, D.C.: Pew Research Center, June.
http://www.pewresearch.org/fact-tank/2015/06/25/u-s-hispanic-population-growth-
surge-cools/
Lopez, Mark Hugo, Ana Gonzalez-Barrera and Eileen Patten. 2013. “Closing the Digital Divide:
Latinos and Technology Adoption.” Washington, D.C.: Pew Research Center, March.
http://www.pewhispanic.org/2013/03/07/closing-the-digital-divide-latinos-and-
technology-adoption/
McHenry, Giulia. 2016. “Evolving Technologies Change the Nature of Internet Use.” Washington,
D.C.: National Telecommunications & Information Administration, April.
https://www.ntia.doc.gov/blog/2016/evolving-technologies-change-nature-internet-use
Patten, Eileen. 2016. “The Nation’s Latino Population Is Defined by Its Youth.” Washington, D.C.:
Pew Research Center, April. http://www.pewhispanic.org/2016/04/20/the-nations-latino-
population-is-defined-by-its-youth/

22
PEW RESEARCH CENTER
www.pewresearch.org
Pew Research Center. “Internet User Demographics.” Washington, D.C.
http://www.pewinternet.org/data-trend/internet-use/latest-stats/
Smith, Aaron. 2015. “Searching for Work in the Digital Era.” Washington, D.C.: Pew Research
Center, November. http://www.pewinternet.org/2015/11/19/searching-for-work-in-the-
digital-era/
Smith, Aaron. 2015. “U.S. Smartphone Use in 2015.” Washington, D.C.: Pew Research Center,
April. http://www.pewinternet.org/2015/04/01/us-smartphone-use-in-2015/
Stepler, Renee and Anna Brown. 2016. “Statistical Portrait of Hispanics in the United States.”
Washington, D.C.: Pew Research Center, April.
http://www.pewhispanic.org/2016/04/19/statistical-portrait-of-hispanics-in-the-united-
states/

23
PEW RESEARCH CENTER
www.pewresearch.org
Appendix B: Additional table
Demographics of Hispanic internet
users
% of Latino internet/email users
2015 2009 Pctg. point
change
Gender
Male 52 52 0
Female 48 48 0
Age group
18-29 33 37 -4
30-49 47 43 +5
50-64 15 15 0
65 and older 5 4 0
Nativity
U.S. born 48 52 -4
Foreign born 52 48 +4
Immigrant generation
Second 29 28 +1
Third or higher 18 22 -4
Language dominance
English dominant 31 34 -3
Bilingual 37 46 -9
Spanish dominant 32 20 +12
Educational attainment
Less than high school 26 22 +4
High school graduate 29 29 0
Some college or more 44 49 -5
Note: “High school graduate” includes those who have attained a
high school diploma or its equivalent, such as a General Education
Development (GED) certificate. Don’t know/refused responses are
not shown. Change is calculated prior to rounding. Figures may not
add to 100% due to rounding.
Source: National Survey of Latinos, conducted Oct. 21-Nov. 30,
2015.
“Digital Divide Narrows for Latinos as More Spanish Speakers and
Immigrants Go Online”
PEW RESEARCH CENTER