Ann Arundel County Public Library - aacpl.net · Anne Arundel County Public Library Mapping Branch...
27
Ann Arundel County Public Library Mapping Branch Library Usage
Transcript of Ann Arundel County Public Library - aacpl.net · Anne Arundel County Public Library Mapping Branch...

Ann Arundel County Public Library
Mapping Branch Library Usage

Anne Arundel County Public Library Mapping Branch Library Usage
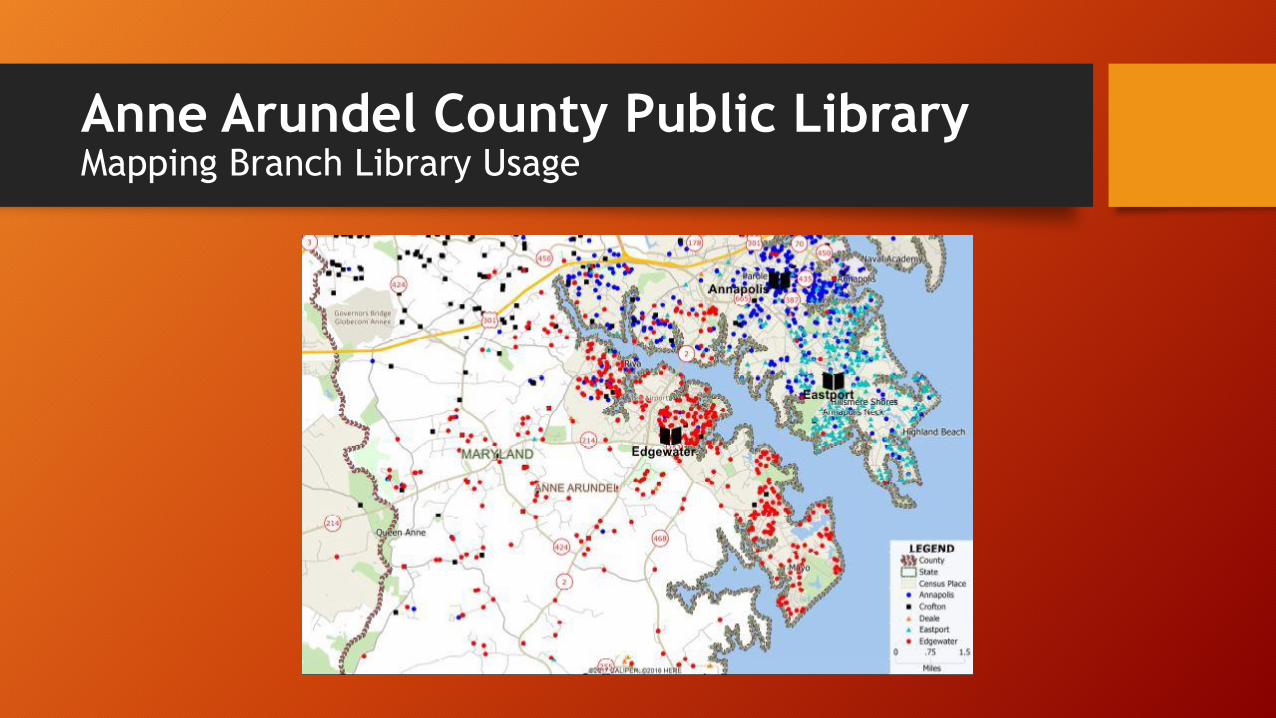
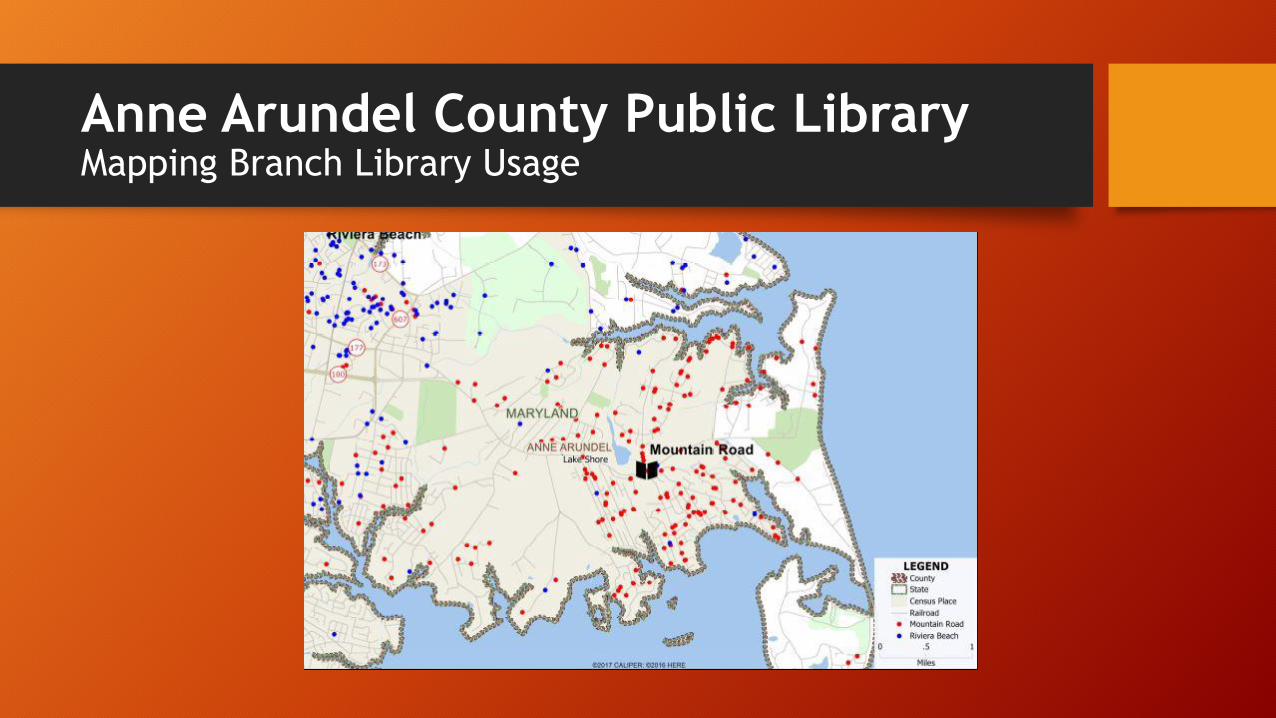
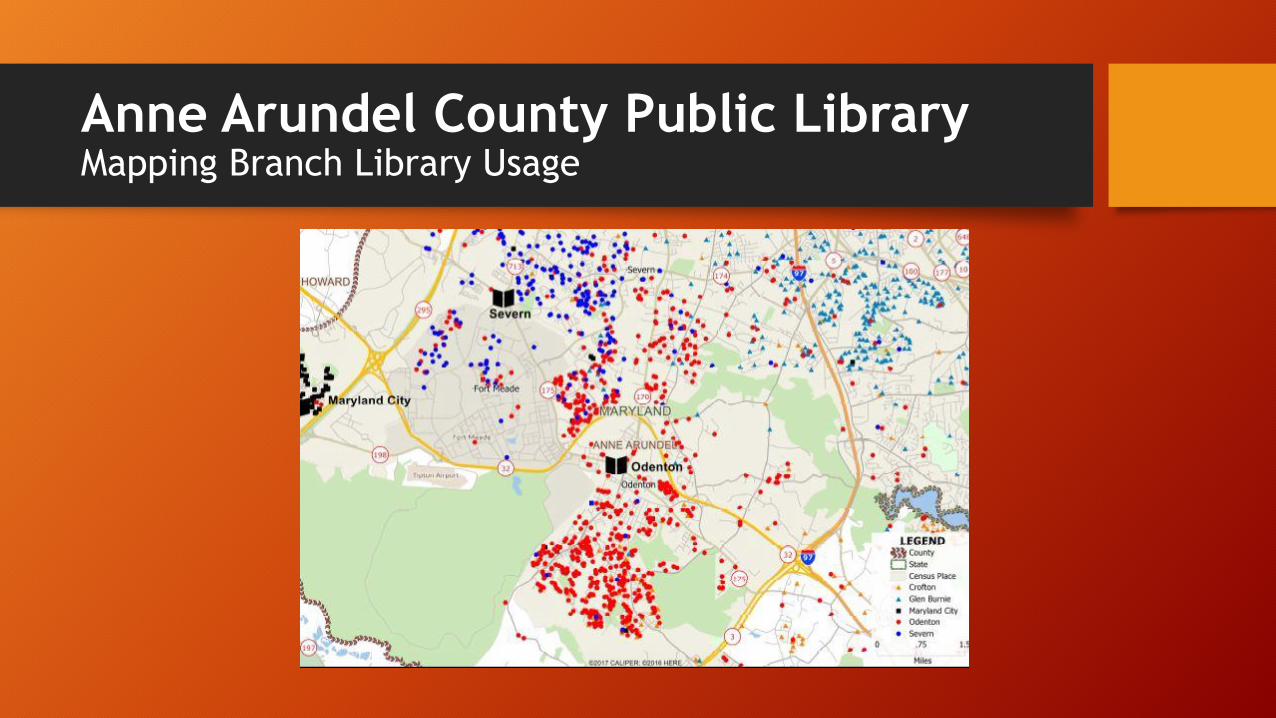
• Mapping is based on a one-month sample of usage for each branch.
• Each dot on the electronic pin maps represents a household (address) with circulation activity during the sample period. A dot might represent a single item checked out or 100 items checked out by multiple family members at the same address. The dots represent WHERE people using a branch are coming from, not how much or how often they use the facility.

Anne Arundel County Public Library Mapping Branch Library Usage
• The maps DO NOT reflect usage other than circulation transactions. For example, they don’t show use of public computers, Wi-Fi, or program attendance.
• They DO offer a reasonably good resprentation of the geographic areas being served by branch facilities and the degree to which individual branches are penetrating their respective service areas.
• The maps also offer helpful information regarding the interaction of branches.

Anne Arundel County Public Library Mapping Branch Library Usage
A typical
usage and
interaction
map.

Anne Arundel County Public Library Mapping Branch Library Usage
Census ”Block Groups” are assigned to libraries based on predominant usage.

Anne Arundel County Public Library Mapping Branch Library Usage
These areas
are then used
to caculate
“primary”
service
populations for
each facility.

Anne Arundel County Public Library Mapping Branch Library Usage

Anne Arundel County Public Library Mapping Branch Library Usage
Some of these service areas are quite small and others are very large.

Anne Arundel County Public Library Mapping Branch Library Usage

Anne Arundel County Public Library Mapping Branch Library Usage
• Demographics are available for each of the service areas.
• Populations from the 2011 - 2015 U.S. Census American Community Survey and 2020 projections can be used to calculate derivative measures such as Square Feet of library building space per capita, per capita output measures such as circulation and library visits, and to gain an understanding of the characteristics of communities served by the various branches.

Anne Arundel County Public Library Mapping Branch Library Usage
“Best fit” drive
times have also
been mapped for
each of the branch
locations.
These maps offer a
separate set of
demographics based
on “effective”
service areas and
often include
overlapping areas
and exclude areas
that are only
marginally served.

Anne Arundel County Public Library Mapping Branch Library Usage
Drive Time areas
attempt to
capture at least
85% of usage of a
branch.
Again, the
demographics
“behind” these
areas can be
used to analyze
the effectiveness
of branches in
reaching their
communities.

Anne Arundel County Public Library Mapping Branch Library Usage

Anne Arundel County Public Library Mapping Branch Library Usage

Anne Arundel County Public Library Mapping Branch Library Usage

Anne Arundel County Public Library Mapping Branch Library Usage

Anne Arundel County Public Library Mapping Branch Library Usage

Anne Arundel County Public Library Mapping Branch Library Usage
Anne Arundel County Public Library Mapping Branch Library Usage

Anne Arundel County Public Library Mapping Branch Library Usage

Anne Arundel County Public Library Mapping Branch Library Usage

Anne Arundel County Public Library Mapping Branch Library Usage
Anne Arundel County Public Library Mapping Branch Library Usage
Anne Arundel County Public Library Mapping Branch Library Usage

Anne Arundel County Public Library Mapping Branch Library Usage

Anne Arundel County Public Library Mapping Branch Library Usage

Anne Arundel County Public Library Mapping Branch Library Usage