Ann Arbor ASA ‘Up and Running’ Series: Anamaria S. Kazanis, Pstat ASKSTATS Consulting Michigan...
69
Ann Arbor ASA ‘Up and Running’ Series: Anamaria S. Kazanis, Pstat ASKSTATS Consulting Michigan State University JMP
-
Upload
gavin-flowers -
Category
Documents
-
view
217 -
download
3
Transcript of Ann Arbor ASA ‘Up and Running’ Series: Anamaria S. Kazanis, Pstat ASKSTATS Consulting Michigan...

Ann Arbor ASA‘Up and Running’ Series:
Anamaria S. Kazanis, Pstat
ASKSTATS Consulting
Michigan State University
JMP

2
Disclosure
•Portions of the presentation were taken verbatim from the following sources:
– JMP 10.0.0 – Help documentation
– Hinrichs, Curt & Boiler. 2010 JMP Essentials: An Illustrated Step-by-Step Guide for New Users. Cary, NC: SAS Institute Inc.
JMP v10

3
Contents
• Introduction • Launching JMP • User Interface • Getting Data into JMP • Examining Data • Manipulating Data • Graphing • Bivariate Statistics • Generalized Linear Modeling• Script JMP v10

4
Contents
• Introduction • Launching JMP • User Interface • Getting Data into JMP • Examining Data • Manipulating Data • Graphing • Bivariate Statistics • Generalized Linear Modeling• Script JMP v10

5
Introduction
• Interact with data tables and reports • Compute values using the Formula Editor • Design experiments • Use scripting features • Open SAS data sets, run stored processes, and
submit SAS code
JMP v10

6
Introduction Terminology
• Data Tables – Enter, View, Edit,
Manipulate – Variable - column – Observation – row
• Platform – Analyze data – Work with Graphs
• Launch windows – Set up and run analysis
• Report windows – Output of analysis
• Graph • Report – Disclosure button • Options – Hotspots: red triangle menus
JMP v10
Introduction Hotspots
• JMP uses the space in windows to show results
• Commands that extend the analysis – right-clicking inside the outline items
• Hotspots look like a downward red triangle
7JMP v10

8
Contents
• Introduction • Launching JMP • User Interface • Getting Data into JMP • Examining Data • Manipulating Data • Graphing • Bivariate Statistics • Generalized Linear Modeling• Script JMP v10

9
Launching JMP
Start JMP 10
JMP v10

10
Contents
• Introduction • Launching JMP • User Interface • Getting Data into JMP • Examining Data • Manipulating Data • Graphing • Bivariate Statistics • Generalized Linear Modeling• Script JMP v10

11
User Interface Home Window
Tip of the Day window
open windows
open recent files
filter recent files
clear recent files filters
Beginner’s Tutorial - basic analysis of data
uncheck - Show tips at startup to not see Tip of the Day window upon launching JMP
JMP v10

12
User Interface JMP Starter Window
JMP v10
• Alternative access to most commands found on the main menu or on toolbars
View JMP Starter
• File Analyze Graph
DOE Tables
Interact with SAS

13
User Interface JMP Starter Window
• Basic – Univariate and Bivariate
analyses • Distributions • Single response(y) and a
single factor (x) – analysis according to
whether variables are continuous or categorical
JMP v10

14
Contents
• Introduction • Launching JMP • User Interface • Getting Data into JMP • Examining Data • Manipulating Data • Graphing • Bivariate Statistics • Generalized Linear Modeling• Script JMP v10

15
Getting Data into JMP New Data Tables
• File New Data Table – Empty data table with no rows – One numeric column, labeled Column 1
JMP v10

16
Getting Data into JMPSample JMP Files
File Open C:\Program Files (x86)\SAS\JMP\10\Samples\Data\Big Class.jmp
JMP v10

17
Getting Data into JMPSample JMP Files
• Sample Data –Big Class.jmp
JMP v10

18
Getting Data into JMPImporting an Excel *.csv file
• File Open Open as: Data, using best guess crab.csv
JMP v10

19
Getting Data into JMPImporting an Excel *.csv file
• Excel – crab.csv
• File Save as– crab.jmp
JMP v10

20
Getting Data into JMP Import Data
Default •Comma-separated (.csv) •.dat files that consist of text •ESRI shapefiles (.shp) •Flow Cytometry versions 2.0 + 3.0(.fcs) •HTML (.htm, .html) •Microsoft Excel 1997–2003 (.xls) •Minitab (.mtw, .mtp, but not .mpj) •Plain text (.txt) •SAS transport (.xpt, .stx) •SAS versions 6–9 on Macintosh
– (.sas7bdat, .ssd, .ssd01, .saseb$data) •SAS versions 6–9 on Windows
– (.sd2, .sd5, .sd7, .sas7bdat) •SPSS files (.sav) •Tab-separated (.tsv)
ODBC drivers
• Database (dBASE) (.dbf, .ndx, .mdx) – supported with a V3+ compliant driver
• Microsoft Access Database (.mdb) – supported with a V3+ compliant driver
• Microsoft Excel 2007 (.xlsm, .xlsx, .xlsb) – supported with a V3+ compliant driver – 64-bit JMP requires a 64-bit driver
JMP v10

21
Contents
• Introduction • Launching JMP • User Interface • Getting Data into JMP • Examining Data • Manipulating Data • Graphing • Bivariate Statistics • Generalized Linear Modeling• Script JMP v10

22
Examining Data Data Table
•Spreadsheet-like grid
•Metadata –Three panels on the left –Information about data
•Structured data –Columns
•variables
–Rows •Observations •Cases
JMP v10

23
Examining Data Data Table Panels
table options script options
column options modeling type :
nominalordinal
continuous
row options
JMP v10
data table nametable variable table scripts

24
Contents
• Introduction • Launching JMP • User Interface • Getting Data into JMP • Examining Data • Manipulating Data • Graphing • Bivariate Statistics • Generalized Linear Modeling• Script JMP v10

25
Manipulating Data
• Data and Modeling Types
• Formatting
• Visual Dimension
• Tables
JMP v10

26
Manipulating Data
• Data and Modeling Types
• Formatting
• Visual Dimension
• Tables
JMP v10

27
Manipulating Data Data and Modeling Types
•Data Types – nature of data
–Numeric – number –Character – category
•Modeling Types
–Nominal – categorical data •discrete, count, attribute •character or numeric
–Ordinal – categorical data •order, hierarchy •categories with sequence or order to be retained in any analysis
–Continuous •ratio, interval scale •numeric
JMP v10

28
Manipulating Data Changing Modeling Type
• Changing types affects the graphs or statistics that can be generated for the column
Click icon by column name
JMP v10
Double-click area above an existing column name

29
Manipulating Data
• Data and Modeling Types
• Formatting
• Visual Dimension
• Tables
JMP v10

30
Manipulating Data Formatting
• Cleaning up data format – Decimal places – Dates – Times – Currency
• Formula editor – New columns from old ones – Add IF statements – Transform data
• Recode – Merge similar responses into a single category
JMP v10

31
Manipulating Data Formatting
• Cleaning up data format – Decimal places – Dates – Times – Currency
• Formula editor – New columns from old ones – Add IF statements – Transform data
• Recode – Merge similar responses into a single category
JMP v10

32
Manipulating Data Formatting – Cleaning up data format
• Double-click area above an existing column name
• Right-click column name select Column Info
JMP v10

33
Manipulating Data Formatting
• Cleaning up data format – Decimal places – Dates – Times – Currency
• Formula editor – New columns from old ones – Add IF statements – Transform data
• Recode – Merge similar responses into a single category
JMP v10

34
Manipulating Data Formatting – Formula Editor
• Create new column – Values calculated or derived from existing columns
• Transform data
• Add conditional statements
JMP v10

35
Manipulating Data Formatting
• Cleaning up data format – Decimal places – Dates – Times – Currency
• Formula editor – New columns from old ones – Add IF statements – Transform data
• Recode – Merge similar responses into a single category
JMP v10

36
Manipulating Data Formatting – Recode
ExampleConsolidate values from AGE in two groups
Click: age Click: Cols Select: Recode Assign New Value: 0, 1 OK
Right click: age 2 Select: Column Info… Select Modeling Type: Ordinal Column Properties: Values Labels
JMP v10
OldValue NewValue NewValueLabel
12, 13, 14 0 < 15yrs of age 15, 16, 17 1 >=15yrs of age
Help Sample DataExamples for teachingBig Class

37
Manipulating Data
• Data and Modeling Types
• Formatting
• Visual Dimension
• Tables
JMP v10

38
Manipulating Data Visual Dimension
• Color or Mark by Column – Colors – Unique Markers – Range – Value
• Access the Rows menu: select the rows hotspot Color or Mark by Column OK
Help Sample Data Examples for teaching Big Class
JMP v10

39
Manipulating Data Visual Dimension
Distinguish points by using unique markers
–Symbols •Standard •Hollow •Solid •Paired •Classic
–Alphanumeric
JMP v10

40
Manipulating Data
• Data and Modeling Types
• Formatting
• Visual Dimension
• Tables
JMP v10

41
Manipulating Data Tables
• Structure data into form that JMP will recognize
– Summary
– Sorting
– Joining
– Dealing with missing data
JMP v10

42
Manipulating Data Tables
• Structure data into form that JMP will recognize
– Summary
– Sorting
– Joining
– Dealing with missing data
JMP v10
43
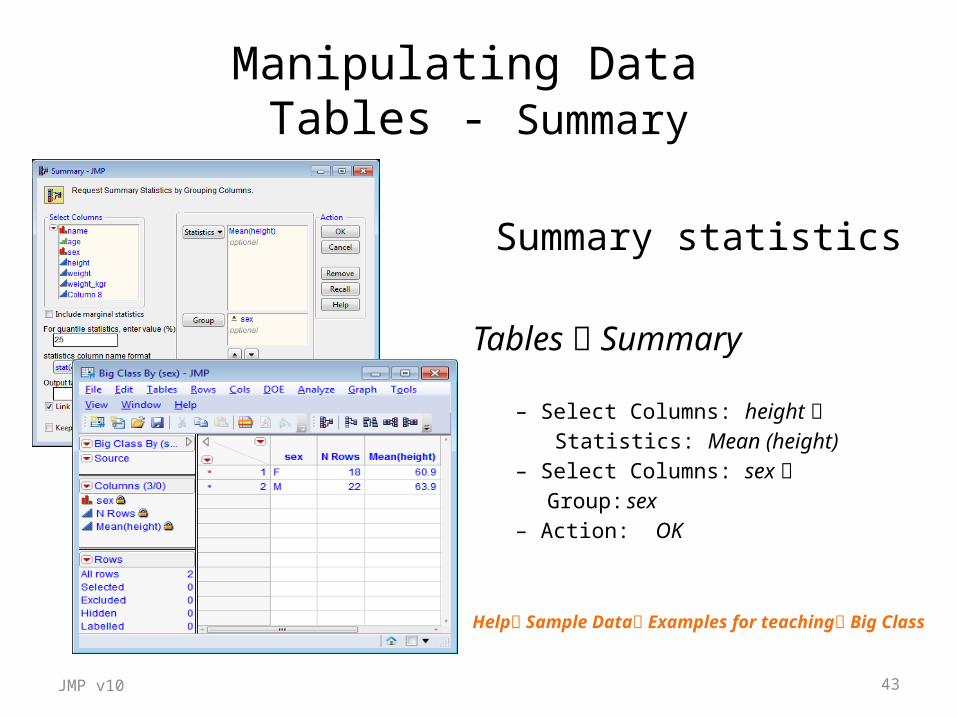
Manipulating Data Tables - Summary
Summary statistics
Tables Summary
– Select Columns: height Statistics: Mean (height) – Select Columns: sex
Group: sex– Action: OK
Help Sample Data Examples for teaching Big Class
JMP v10

44
Manipulating Data Tables
• Structure data into form that JMP will recognize
– Summary
– Sorting
– Joining
– Dealing with missing data
JMP v10

45
Manipulating Data Tables - Joining
• Combine or merge two or more different data tables into one
Trial1 Tables Join
– Join ‘Trial1’ with: Trial2 – Source Columns: Trial1, Trial2
» From each source select : Popcorn, oil amt, batch
Match – Output table name: Popcorn joined
Action: OK
Help Sample Data Open the Sample Data Directory Trial1 Open Trial2 Open JMP v10

46
Manipulating Data Tables
• Structure data into form that JMP will recognize
– Summary
– Sorting
– Joining
– Dealing with missing data
JMP v10

47
Manipulating Data Tables – Missing Data
For this example, delete some data from ‘Big Class’
• Identify quantity of missing data
• Existence of patterns – Non-response – Data importing – Data entry errors
Tables Missing Data PatternSelect Columns: age, sex, height, weight Add Columns Action: OK
Help Sample Data Examples for teaching Big Class
JMP v10

48
Contents
• Introduction • Launching JMP • User Interface • Getting Data into JMP • Examining Data • Manipulating Data • Graphing • Bivariate Statistics • Generalized Linear Modeling• Script JMP v10

49
Graphing
• Graphs of One Column – Distribution – examine data – Normal Quantile Plot – Time Series
• Comparing Two Columns – Fit Y by X
• Graph Builder
JMP v10

50
Graphing
• Graphs of One Column – Distribution – examine data – Normal Quantile Plot – Time Series
• Comparing Two Columns – Fit Y by X
• Graph Builder
JMP v10

51
Graphing One Column - Distribution
• Continuous – Shape – Range – Data density
Analyze Distribution Select Columns: heightY, Columns: heightAction: OK
Help Sample Data Examples for teaching Big Class
JMP v10
heightDisplay Options Horizontal Layout

52
Graphing One Column - Distribution
• Outlier Box Plot – Chart for detecting extreme values – Properties of a continuous distribution
• Quartiles
• Moments
• Outliers
Analyze Distribution
height Outlier Box Plot
Help Sample Data Examples for teaching Big Class
JMP v10

53
Graphing One Column – Normal Quantile Plot
– Chart for visualizing the extend to which a column is normally distributed
• Points would fall upon the line • Point would not fall beyond confidence curves
Analyze Distribution Select Columns: Wt Y, Columns: Wt Action: OK
Wt Normal Quantile Plot
CRAB dataAgresti, 2002, p.127
JMP v10

54
Graphing One Column – Time Series
• Separate platform – Forecasting techniques – Statistical Results
• Graph of numeric variable – Random sample from population
• Independent and identically distributed (i.i.d.)• Check: Time Series
• View and fit – variability over time – potential seasonality of a variable over time
Analyze Modeling Time SeriesSelect Columns: Wt Y, Time Series: Wt Action: OK
CRAB dataAgresti, 2002, p.127
JMP v10

55
Graphing
• Graphs of One Column – Distribution – examine data – Normal Quantile Plot – Time Series
• Comparing Two Columns – Fit Y by X
• Graph Builder
JMP v10

56
Graphing Comparing Two Columns – Fit Y by X
• Relationship of two columns
• Graph are always based on Modeling Type – Continuous – Nominal – Ordinal
• Matrix in Fit Y by X window provides visual preview of graphs
– See icons on margin of matrix
Analyze Fit Y by X Y, Response: Wt X, Factor : W
Bivariate Fit of Wt By W Fit Line Linear Fit Confid Shaded Fit
CRAB dataAgresti, 2002, p.127
JMP v10

57
Graphing
• Graphs of One Column – Distribution – examine data – Normal Quantile Plot – Time Series
• Comparing Two Columns – Fit Y by X
• Graph Builder
JMP v10

58
GraphingGraph Builder
• Visual initial data exploration
• Works in drag-drop manner – Select column – Drag to desired zone
Graph Graph Builder
CRAB dataAgresti, 2002, p.127
JMP v10

59
Contents
• Introduction • Launching JMP • User Interface • Getting Data into JMP • Examining Data • Manipulating Data • Graphing • Bivariate Statistics • Generalized Linear Modeling• Script JMP v10

60
Bivariate Statistics Comparing One Column to Another
JMP v10
Analyze Distribution
Dynamic Link of Graphs and data
CRAB dataAgresti, 2002, p.127
61
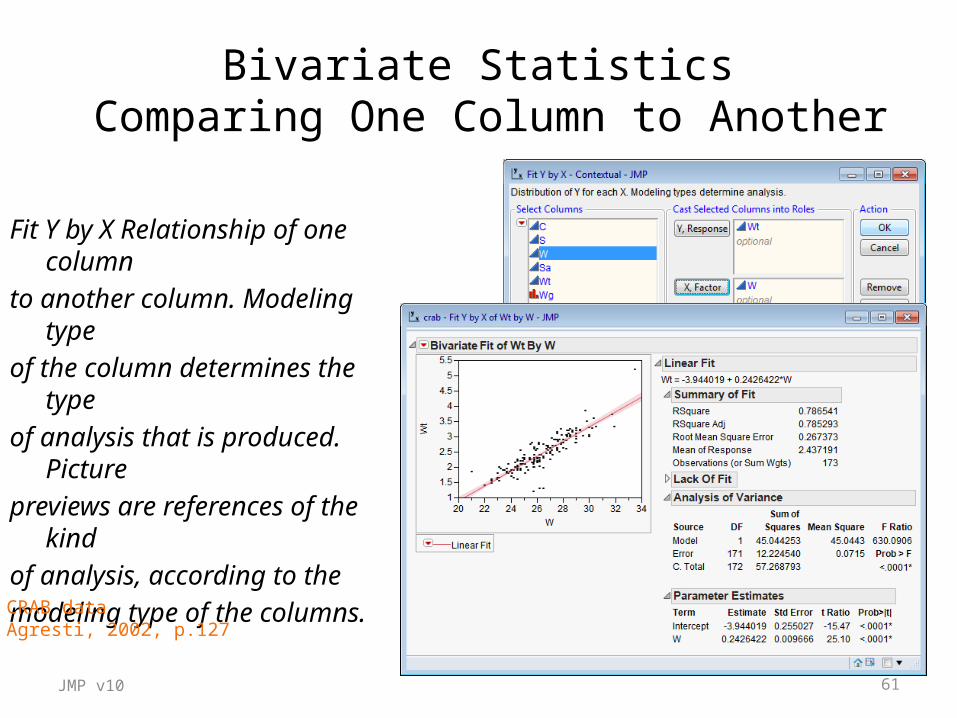
Bivariate Statistics Comparing One Column to Another
JMP v10
Fit Y by X Relationship of one column
to another column. Modeling type of the column determines the typeof analysis that is produced. Picture previews are references of the kind of analysis, according to the modeling type of the columns.
CRAB dataAgresti, 2002, p.127

62
Contents
• Introduction • Launching JMP • User Interface • Getting Data into JMP • Examining Data • Manipulating Data • Graphing • Bivariate Statistics • Generalized Linear Modeling• Script JMP v10

63
Generalized Linear ModelingPoisson Regression
Analyze Fit Model Y Sa - number of satellitesConstruct Model Effects Add: W – carapace widthPersonality: Generalized Linear ModelDistribution: PoissonLink Function: Log
JMP v10
CRAB dataAgresti, 2002, p.127

64
Contents
• Introduction • Launching JMP • User Interface • Getting Data into JMP • Examining Data • Manipulating Data • Graphing • Bivariate Statistics • Generalized Linear Modeling• Script JMP v10

65
Script - JSL
• JSL: JMP Scripting Language
• Open a data table and make changes – add rows and columns – change values – make a formula column – run analyses
JMP v10

66
ScriptFile New Script
Type: current data table () <<get script;
Select text: Edit Run Script View Log
Help Sample Data Examples for teaching Big Class
JMP v10

67
QUESTIONS
JMP v10

68
JMP Usewww.jmp.com/applications
• Analytical Application Development• Data Visualization• Design of Experiments• Exploratory Data Analysis• Modeling and Predictive Analytics• Quality Improvement• Reliability• Six Sigma• StatisticsJMP v10

69
JMP
• Why JMP Pro v10
• Why JMP v10
JMP v10