Anisotropy of magnetic susceptibility in alkali feldspar ... · anisotropy of magnetic...
28
1 Anisotropy of magnetic susceptibility in alkali feldspar and plagioclase Andrea R. Biedermann 1,a , Thomas Pettke 2 , Ross J. Angel 3 , & Ann M. Hirt 1,* 1 Institute of Geophysics, ETH Zurich, Sonneggstrasse 5, 8092 Zurich, Switzerland 2 Institute of Geological Sciences, University of Bern, Baltzerstrasse 1-3, 3012 Bern, Switzerland 3 Department of Geosciences, University of Padova, Via G. Gradenigo 6, 35134 Padova, Italy a Now at: Department of Geology and Mineral Resources Engineering, Norwegian University of Science and Technology, Sem Sælands vei 1, 7491 Trondheim, Norway The final version of this article is available on the GJI website: https://doi.org/10.1093/gji/ggw042
Transcript of Anisotropy of magnetic susceptibility in alkali feldspar ... · anisotropy of magnetic...

1
Anisotropy of magnetic susceptibility in alkali feldspar and plagioclase
Andrea R. Biedermann1,a, Thomas Pettke2, Ross J. Angel3, & Ann M. Hirt1,*
1 Institute of Geophysics, ETH Zurich, Sonneggstrasse 5, 8092 Zurich, Switzerland
2 Institute of Geological Sciences, University of Bern, Baltzerstrasse 1-3, 3012 Bern,
Switzerland
3 Department of Geosciences, University of Padova, Via G. Gradenigo 6, 35134 Padova, Italy
a Now at: Department of Geology and Mineral Resources Engineering, Norwegian University
of Science and Technology, Sem Sælands vei 1, 7491 Trondheim, Norway
The final version of this article is available on the GJI website:
https://doi.org/10.1093/gji/ggw042

2
Summary Feldspars are the most abundant rock-forming minerals in the Earth’s crust, but their
magnetic properties have not been rigorously studied. This work focuses on the intrinsic
magnetic anisotropy of 31 feldspar samples with various chemical compositions. Because
feldspar is often twinned or shows exsolution textures, measurements were performed on
twinned and exsolved samples as well as single crystals. The anisotropy is controlled by the
diamagnetic susceptibility and displays a consistent orientation of principal susceptibility axes;
the most negative or minimum susceptibility is parallel to [010], and the maximum (least
negative) is close to the crystallographic [001] axis. However, the magnetic anisotropy is weak
when compared to other rock-forming minerals, 1.53*10-9 m3/kg at maximum. Therefore, lower
abundance minerals such as augite, hornblende or biotite often dominate the bulk paramagnetic
anisotropy of a rock. Ferromagnetic anisotropy is not significant in most samples. In the few
samples that do show ferromagnetic anisotropy, the principal susceptibility directions of the
ferromagnetic subfabric do not display a systematic orientation with respect to the feldspar
lattice. These results suggest that paleointensity estimates of the geomagnetic field made on
single crystals of feldspar will not be affected by a systematic orientation of the ferromagnetic
inclusions within the feldspar lattice.
Keywords
52. Magnetic fabrics and anisotropy
51. Magnetic and electrical properties
63. Rock and mineral magnetism
56. Paleointensity

3
1. Introduction Feldspars are the most abundant constituent minerals in Earth’s crust. They occur in
igneous rocks covering basic to acidic and alkaline compositions, and as an accessory mineral
in shallow ultrabasic rocks; they are often also important in metamorphic rocks. Feldspar is a
Na-K-Ca-Al tectosilicate, generally poor in iron or other elements with strong magnetic
moments (Deer et al. 2001). While both alkali feldspar and plagioclase have low
susceptibilities, their abundance makes it important to characterise their magnetic properties,
including their intrinsic magnetic anisotropy as well as the anisotropy arising from exsolution
textures or inclusions within the crystals. Plagioclase, much more often than alkali feldspar, can
contain small inclusions of ferromagnetic minerals. These ferromagnetic inclusions have been
used in several early paleomagnetic studies as paleofield recorders (Evans & McElhinny 1966;
Evans & Wayman 1974; Murthy et al. 1971; Strangway et al. 1968; Wu et al. 1974).
Ferromagnetic inclusions within feldspar are preferred paleomagnetic recorders, firstly because
they are protected against alteration by the feldspar host (Cottrell & Tarduno 1999, 2000;
Feinberg et al. 2005; Tarduno et al. 2006). Secondly, whereas magnetite forms large
multidomain grains in pyroxenes or amphiboles, the inclusions in plagioclase are generally in
the single-domain range and thus possess a stable remanence (Hargraves & Young 1969;
Murthy et al. 1971). Finally, microtexture, e.g. intra-oxide exsolution, further strengthens the
magnetic remanence of inclusions in plagioclase (Feinberg et al. 2005).
It has long been recognized that anisotropy can deviate the direction of remanent
magnetisation (Coe 1979; Fuller 1960, 1963; Uyeda et al. 1963). Concerns have therefore been
raised, that the paleointensity recorded by such grains can be affected by their preferred
orientation, which in turn gives rise to magnetic anisotropy (Cottrell & Tarduno 1999; Selkin
et al. 2000; Tarduno et al. 2006). Magnetite rods in plagioclase may form by exsolution of Fe2+
and Fe3+ that had been incorporated into the feldspar structure at high temperature. According

4
to Davis (1981), magnetite exsolves along one or several of four directions of the plagioclase
lattice. Wenk et al. (2011) observed that the long axes of magnetite needles are aligned with the
plagioclase c-axis. Shape-preferred orientation of the magnetite will influence both the
anisotropy of magnetic susceptibility (AMS) and the direction of the remanent magnetisation,
and consequently the recorded paleofield direction in individual feldspar crystals, or in rocks
that contain feldspar with lattice-preferred orientation.
Given the abundance of feldspar and the supposedly high reliability of its ferromagnetic
inclusions as paleomagnetic recorders, it is surprising how little is known about the magnetic
properties of single feldspar crystals. Only one measurement on magnetic anisotropy of an
adularia crystal has been performed to date (Finke 1909). This study showed that the most
negative principal susceptibility of diamagnetic adularia is tilted -13°20’ relative to the
crystallographic [001] axis. The magnitudes of the maximum, intermediate and minimum
susceptibilities were -5.47*10-9 m3/kg, -4.63*10-9 m3/kg, and -4.09*10-9 m3/kg respectively.
Selkin et al. (2014) characterized magnetic anisotropy and its relation to mineral fabric in the
Stillwater Complex. In plagioclase, they observed an oblate magnetic anisotropy with several
orientations; for example minimum susceptibility close to the crystallographic [001] direction
of plagioclase, and the maximum in the (001) plane, or close to the (100) direction. This
anisotropy was interpreted to arise from elongated magnetite inclusions in feldspar. Selkin et
al. (2000) investigated the influence of magnetic anisotropy on paleointensity estimates in an
anorthosite from the Stillwater Complex. They found that anisotropy of remanence can cause
large variations in paleointensity estimates and observed that the minimum principal
susceptibility is normal to the plagioclase foliation and the maximum principal susceptibility
aligns with the poorly defined grouping of plagioclase [001] axes. The observed anisotropy
could arise from (1) the plagioclase itself or (2) inclusions within the plagioclase. Feinberg et
al. (2006) studied the Bushveld layered intrusion and found that the (010) planes of plagioclase

5
are parallel to foliation. The same preferred orientation was observed by Seront et al. (1993) in
a study on the Oklahoma anorthosite. It can be assumed that this is the case in other plagioclase-
bearing rocks that show preferred mineral alignment, as the crystals are often tabular with their
short direction normal to (010) (Deer et al. 1992, 2001).
In the absence of ferromagnetic minerals, magnetic anisotropy of feldspar can arise from
two sources: diamagnetic and paramagnetic anisotropy. Diamagnetism is related to the orbital
moment of the electrons and is a property of all materials. If a magnetic field is applied to a
diamagnetic material, the motion of the electrons is affected such that a secondary magnetic
field is created antiparallel to the applied field. This causes a magnetisation opposite to the
applied field, and therefore, diamagnetic materials are characterised by a negative susceptibility
(O'Handley 2000). The magnitude of the diamagnetic susceptibility is related to the area within
the electrons orbit. Therefore, diamagnetic anisotropy arises if the electron orbit is of different
size when the field is applied in different directions. The most negative susceptibility is
expected normal to the lattice plane in which the electron movement is facilitated (Pauling
1936, 1979a). This effect has been observed in organic molecules, carbonate minerals and
graphite (Banerjee 1939; Krishnan 1934; Krishnan & Ganguli 1939; McClure 1956; Pauling
1936, 1979a, 1979b; Schmidt et al. 2006; Schmidt et al. 2007a; Wallace 1947). Paramagnetism
occurs in ions with unpaired electrons, which causes a net spin moment, e.g., in Fe2+, Fe3+,
Mn2+. In the absence of an external field, the spins have random orientation and no net
magnetisation is observed. In an applied field the spins align statistically, which causes a
magnetisation parallel to the applied field, such that paramagnetic materials have a positive
susceptibility. For an ion located in a crystal lattice, certain electron orbits are energetically
preferred due to the crystal field, i.e. the charge distribution created by neighboring atoms.
Through spin-orbit coupling, the spins may show preferred orientation, which causes the
paramagnetic anisotropy (O'Handley 2000). The paramagnetic response is stronger than the

6
diamagnetic response, which is why diamagnetism is often neglected in materials with high Fe
or Mn concentrations. Chemically pure alkali feldspar and plagioclase are solely diamagnetic.
However, small amounts of Fe or Mn give rise to a dominant paramagnetic susceptibility.
The present study focuses on the AMS of alkali feldspar and plagioclase single crystals,
twins, and crystals showing exsolution. We were particularly interested in (1) determining the
intrinsic magnetic anisotropy due to the feldspar lattice, and (2) examining whether
ferromagnetic inclusions in feldspar have a systematic AMS with respect to the crystallographic
axes. High-field methods were used in order to distinguish the diamagnetic/paramagnetic AMS
associated with the silicate structure from any anisotropy due to ferromagnetic inclusions.
2. Material and methods
2.1 Minerals of the feldspar group The feldspar mineral group consists of two solid solution series. Members of the alkali
feldspar solid solution series span the compositional range between K-feldspars (K[AlSi3O8])
and albite (Na[AlSi3O8]). Plagioclase forms a solid solution series with end-members albite and
anorthite (Ca[Al2Si2O8]). No significant solid solution exists between K- and Ca-feldspars, and
there exists a miscibility gap between K-feldspar and albite that widens with decreasing
temperature. Consequently, intermediate alkali feldspars often consist of an oriented
intergrowth of K-feldspar and typically wormy or lamellar albite-rich feldspar that forms by
exsolution upon slow cooling, and is referred to as perthite. Rarer antiperthite consists of alkali
feldspar exsolutions in albite-rich feldspar. Other cations can be present in limited amounts;
Fe3+ and Ti can replace Al; and Mg, Fe2+, Sr and Mn can replace Ca. Clear yellow K-rich alkali
feldspar from Madagascar can contain up to 10 % K[FeSi3O8] (Deer et al. 1992, 2001).

7
Feldspars with elevated impurity element concentrations commonly form at high temperatures
and may exsolve other minerals such as oxides during slow cooling.
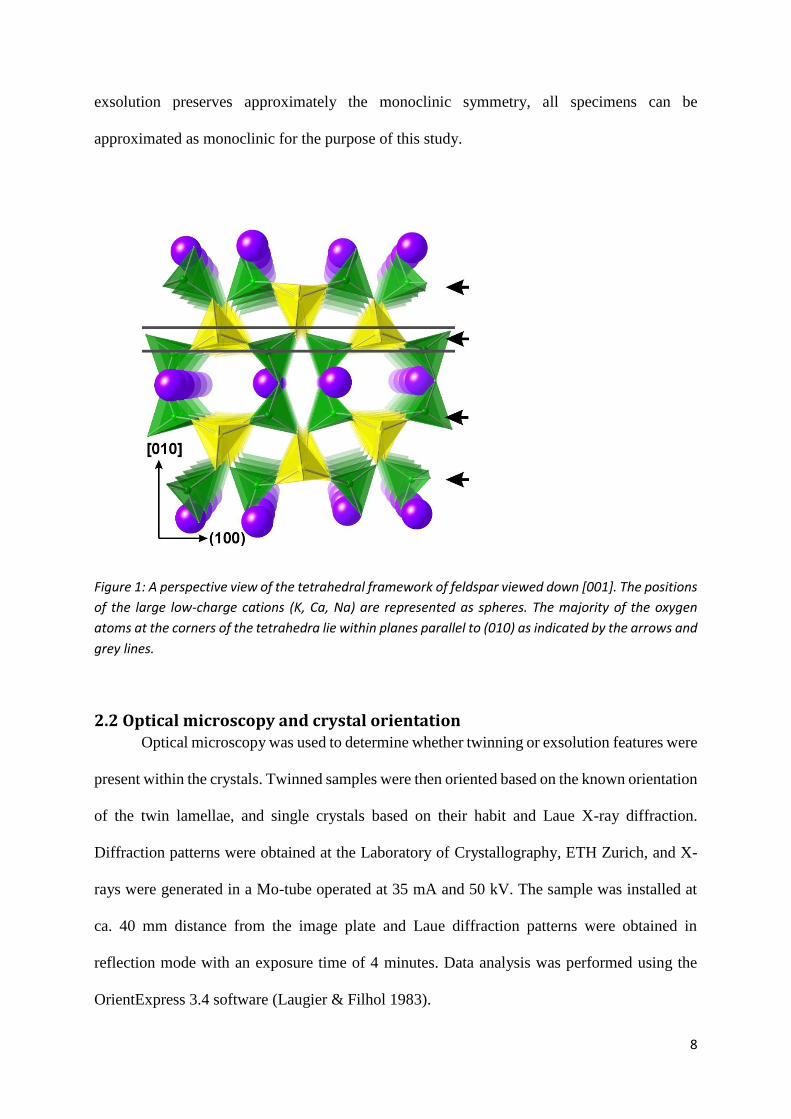
Feldspar is a tectosilicate consisting of a three-dimensional framework of corner-linked
SiO4 and AlO4 tetrahedra. The larger, lower-charge cations Na, Ca and K occupy cavities within
this framework (Fig. 1). The overall topology is the same for all feldspars, but the detailed
structure and crystal symmetry depend on composition, crystallization temperature and cooling
history. Rapidly cooled high-temperature K-feldspar, sanidine, contains disordered Al and Si
in the tetrahedral sites and retains monoclinic symmetry. Intermediate cooling rates can produce
orthoclase, which exhibits monoclinic lattice symmetry, but Al and Si are partially or fully
ordered on a local scale. Slowly cooled plutonic rocks and feldspars crystallized at low
temperature tend to display ordered Al and Si, resulting in triclinic symmetry. This ordered K-
rich feldspar is termed microcline. Albite and members of the plagioclase solid solution series
are always triclinic, independent of Al/Si ordering. This is because Na and Ca are smaller
cations than K, which causes distortions in the framework. These distortions are small, and all
feldspars have identical framework topology and site distribution, so that they are expected to
display similar dia/paramagnetic anisotropy.
Samples investigated in this study cover a range of compositions for alkali and
plagioclase feldspars that represent the variety of structural states and compositions commonly
found in nature. Feldspars are often twinned or multiply twinned in addition to perthitic and
antiperthitic exsolution in alkali feldspars addressed above (Deer et al. 2001). Therefore, the
sample suite included twinned and exsolved specimens as well as single crystals (Table 1).
Twinning in triclinic feldspars, albite and perthite twinning, both result from the breaking of
the monoclinic symmetry. Thus, twinned crystals will appear monoclinic. Given that the
deviations from monoclinic symmetry in triclinic feldspars are small, and that twinning and
8
exsolution preserves approximately the monoclinic symmetry, all specimens can be
approximated as monoclinic for the purpose of this study.
Figure 1: A perspective view of the tetrahedral framework of feldspar viewed down [001]. The positions
of the large low-charge cations (K, Ca, Na) are represented as spheres. The majority of the oxygen
atoms at the corners of the tetrahedra lie within planes parallel to (010) as indicated by the arrows and
grey lines.
2.2 Optical microscopy and crystal orientation Optical microscopy was used to determine whether twinning or exsolution features were
present within the crystals. Twinned samples were then oriented based on the known orientation
of the twin lamellae, and single crystals based on their habit and Laue X-ray diffraction.
Diffraction patterns were obtained at the Laboratory of Crystallography, ETH Zurich, and X-
rays were generated in a Mo-tube operated at 35 mA and 50 kV. The sample was installed at
ca. 40 mm distance from the image plate and Laue diffraction patterns were obtained in
reflection mode with an exposure time of 4 minutes. Data analysis was performed using the
OrientExpress 3.4 software (Laugier & Filhol 1983).

9
2.3 Chemical analysis Elemental compositions of the crystals were determined using laser-ablation inductively
coupled plasma mass spectroscopy (LA-ICP-MS) at the Institute of Geological Sciences,
University of Bern. LA-ICP-MS was preferred over the more precise electron probe
microanalysis because LA-ICP-MS integrates over a larger sample volume during analysis.
Consequently, small-scale exsolution textures that form upon cooling of the crystal are
analytically integrated to return the homogeneous high-temperature compositions of the
feldspar crystals. Several spots were measured on each sample either on a crystal face, a
polished crystal face, or a polished section. A detailed description of the experimental setup and
parameters is given in Pettke et al. (2012). Measurements were performed with a beam diameter
of 90 µm, and SRM610 was used as the external standard material. Data were processed using
SILLS (Guillong et al. 2008). Mineral formulae were then recalculated in order to compute the
orthoclase, albite and anorthite components for each sample.
2.4 Magnetic characterisation and anisotropy of susceptibility Magnetic measurements were performed at the Laboratory for Natural Magnetism, ETH
Zurich. Acquisition of isothermal remanent magnetisation (IRM) was measured on selected
samples in order to characterise the type of ferromagnetic inclusions in the feldspar crystals.
The samples were first magnetised in one direction in a 2 T-field and then progressively
remagnetised in the opposite direction in increasing fields with an ASC-Scientific IM-10-30
pulse magnetiser. After each step, remanent magnetisation was measured using a three-axis 2G
cryogenic magnetometer (Model 755). Hysteresis loops in fields up to 1 T were measured on a
few samples using a Princeton Measurements Corporation MicroMag 3900 Vibrating Sample
Magnetometer (VSM), to further characterise the ferromagnetic inclusions.
Magnetic susceptibility is anisotropic and can be described by a second-order symmetric
tensor. The three eigenvalues of this tensor are the principal susceptibilities, k1 ≥ k2 ≥ k3, and

10
the corresponding eigenvectors describe the directions of the principal susceptibility axes. For
diamagnetic samples, we define k1 as the most negative susceptibility, and k3 as the least
negative susceptibility. Susceptibility can also be represented by a magnitude ellipsoid with
semi-axes k1, k2 and k3, whose shape is defined as
𝑈 = (2𝑘2 − 𝑘1 − 𝑘3)/(𝑘1 − 𝑘3) (1)
(Jelinek 1981). The shape parameter U can take on values between -1 and +1, where -1
corresponds to a rotationally prolate ellipsoid, and +1 to a rotationally oblate ellipsoid. The
degree of anisotropy can be described by
𝑘′ = √[(𝑘1 − 𝑘𝑚𝑒𝑎𝑛)2 + (𝑘2 − 𝑘𝑚𝑒𝑎𝑛)2 + (𝑘3 − 𝑘𝑚𝑒𝑎𝑛)2]/3, (2)
where
𝑘𝑚𝑒𝑎𝑛 =1
3(𝑘1 + 𝑘2 + 𝑘3) (3)
is the mean susceptibility (Jelinek 1984).
Low-field AMS provides information on the full susceptibility tensor from a
superposition of diamagnetic, paramagnetic and ferromagnetic components. The low-field
measurements were made on an AGICO MFK1-FA susceptibility bridge in magnetic fields of
200 A/m or 500 A/m and a frequency of 976 Hz. Directional susceptibilities were measured
using the stacking method outlined in Biedermann et al. (2013).
High-field AMS allows for separation of the magnetic anisotropy carried by the feldspar
lattice from that carried by ferromagnetic inclusions. It was determined on a torque
magnetometer in six fields between 1.0 T and 1.5 T at room temperature and 77 K. The different
field-dependence of the diamagnetic and paramagnetic components as compared to the
ferromagnetic component can be used to isolate each component provided that the
magnetisation of the ferromagnetic inclusions is saturated (Martín-Hernández & Hirt 2001).
This is the case for inclusions of magnetite and maghemite. If hematite is also present, this

11
component can be isolated using the method in Martín-Hernández & Hirt (2004). Schmidt et
al. (2007b) developed a method to isolate the diamagnetic from the paramagnetic component
to the AMS, exploiting the temperature dependencies of the two magnetic fractions.
Figure 2: Thin section photographs of O1, O6, Lab1, Lab2, Lab4 and S2. The images of the labradorites
were taken with crossed polarizers.
12
3. Results
3.1 Twinning and exsolution features About half of the samples display a clear diffraction pattern in combination with the
typical feldspar habit, and are thus crystalline and homogeneous. Some specimens do not show
clear diffraction patterns, even though their habit is characteristic for feldspar; this can be
attributed to fine-scale twinning or exsolution processes. Alkali feldspar specimens O1 - O7 did
not show any diffraction pattern and show perthitic exsolution at various scales under the
microscope (Fig. 2). Carlsbad twins were observed in Orth2 and Kfsp1. In plagioclase Lab2
one consistent set of twin lamellae is observed, suggesting simple polysynthetic twinning.
Labradorites Lab1, Lab3 and Lab4 are aggregates of multiple grains. Sunstone samples S1 and
S2 contain platy inclusions of opaque grains, which show a strong preferred orientation.
3.2 Chemical composition A summary of the average elemental composition of each sample is given in Table A
(online supplementary) and recalculated formulae as well as concentrations of ions with strong
magnetic moment are shown in Table 2. Figure 3 illustrates the broad range of compositions in
the crystal collection, both in the alkali feldspar and plagioclase solid solution series. The
distribution of the samples along the orthoclase (Or) – albite (Ab) and albite – anorthite (An)
axes loosely traces the miscibility regions for feldspars, except for high-Ca end members. Most
specimens are compositionally homogeneous on the 100 µm scale as determined by LA-ICP-
MS. Alkali feldspar samples Am1, Orth2 and Fsp1 reveal increased variability in Na2O and
K2O along with constant Al2O3, indicating the presence of perthitic exsolution. For plagioclase,
sample NMB27181a shows about 15% variation in CaO along with increased variability of
SiO2 and Na2O, suggesting prominent chemical zonation; samples NMB27181b, Lab3 and
Lab4 show this too but less pronounced. Cations other than K, Na or Ca are present mostly in
trace amounts. This also applies to the cations with strong magnetic moments, such as Fe, Mn,
and Ni, except for samples Orth3 (13300 µg/g Fe), A1 (5000 µg/g Fe) and Orth4 (3300 µg/g

13
Fe). Crystal Orth3 contains the largest amount of iron, 0.07 atoms per formula unit, which is
most likely present as Fe3+ replacing Al in the silicate framework. The Fe concentration in the
other specimens varies between 5*10-5 and 0.02 atoms per formula unit. According to Smith &
Brown (1988) hematite or copper plates are common in sunstone; however, neither Fe nor Cu
show higher concentrations relative to other feldspar samples. In fact, none of the elements
recorded in these sunstone samples show concentrations higher than for other feldspar samples
(Table A).
Figure 3: Ternary orthoclase (Or) – albite (Ab) – anorthite (An) diagram showing the chemical
compositions of feldspars analysed. Crystals belonging to the Or – Ab series are termed alkali feldspar
and those on Ab – An are plagioclase. Solid and dashed lines represent the miscibility gaps at 600 °C
and 1000 °C (isotherms from Benisek et al. (2004)).
3.3 Characterisation of ferromagnetic inclusions The ferromagnetic grains can be divided into two groups according to their magnetic
behavior (Fig. 4). In the first group, IRM increases rapidly in low fields, remanent coercivities
are less than 50 mT and the magnetisation approaches saturation by ca. 200 mT, whereas a
weak increase can be observed in higher fields. This behavior, shown by e.g. Orth2, Orth4, S1
14
and S2, suggests that two ferromagnetic phases are present, a low-coercivity phase, such as
magnetite or maghemite, and a high-coercivity phase such as hematite. Hysteresis loops
measured on S1 and S2 are wasp-waisted, thus confirming the presence of both a low- and a
high-coercivity phase (Fig. 5). In the second group, e.g. Am1 or Orth1, the magnetisation
increases more slowly and does not reach saturation in fields up to 2 T. The remanent
coercivities are between 300 and 600 mT (cf. Fig. 4). This suggests that the main ferromagnetic
phase is hematite, although very small amounts of magnetite may also be present.
3.4 Magnetic susceptibility and anisotropy The magnetic susceptibility of the feldspar samples is generally weak and ranges from
-3.8*10-8 m3/kg to +3.7*10-7 m3/kg (Table B, online supplementary). Seventeen specimens have
negative mean susceptibilities, and fourteen have positive ones. Because the mean susceptibility
of many feldspar crystals is close to zero, the effect of a possible incomplete holder subtraction
or magnetic susceptibility of the sample-holding glue can cause errors in the estimation of the
mean susceptibility, particularly for small samples. Samples that appear weakly diamagnetic
when measured on the MFK1-FA susceptibility bridge can have a small positive susceptibility
when measured on a vibrating sample magnetometer, as has been observed for forsterite
(Biedermann et al. 2014a).
Despite the weak mean susceptibility, a significant low-field AMS could be determined
for all but three samples. One crystal, NMB27181b, displayed positive susceptibility in some
directions and negative susceptibility in others, so that the AMS could not be determined. The
directions of the principal axes of the susceptibility ellipsoid for the different crystals show no
systematic relationship with the crystallographic axes (Fig. 6). Low-field anisotropy
parameters are summarized in Table B.

15
Figure 4: Representative IRM acquisition curves for selected feldspar crystals.
Figure 5: Hysteresis loops of sample S1, corrected for a linear diamagnetic contribution. Inset shows
uncorrected hysteresis loop.

16
Figure 6: Equal-area lower hemisphere stereoplots showing principal low-field and dia/paramagnetic
high-field susceptibility directions for alkali feldspar and plagioclase. Black symbols represent single
crystals, grey symbols are twins and open circles represent amazonite. Squares, triangles and circles
represent maximum, intermediated and minimum susceptibility, respectively.

17
Room-temperature high-field anisotropy is significant for all crystals except Ad1 and
O4 (Table C, online supplementary). The ferromagnetic contribution to the anisotropy is only
significant in five alkali feldspars and three plagioclase samples. The sunstones S1 and S2 show
similar principal ferromagnetic directions: Their maximum ferromagnetic susceptibility is
parallel to the elongation direction of the platy opaque inclusions. In the other samples, no
systematic orientation of the principal ferromagnetic susceptibility axes to the feldspar lattice
was observed.
The room-temperature high-field AMS is dominated by a diamagnetic or paramagnetic
component, which amounts to > 60 % of the torque signal. The degree of anisotropy k’ varies
from 2.60*10-11 m3/kg to 1.53*10-9 m3/kg. This range also includes Finkes (1909) result of k’
= 5.68*10-10 m3/kg. The susceptibility becomes less anisotropic at 77 K compared to room
temperature, or anisotropy is not significant at 77 K (Fig. 7).
Figure 7: Torque signal at room temperature and 77 K for Ab1 and Am1. Torque as a function of angle
is shown for three perpendicular planes and 6 applied fields.

18
Principal directions of the dia-/paramagnetic susceptibility at room temperature are
shown in Fig. 6. For samples with positive mean susceptibility, the maximum susceptibility lies
slightly canted to the crystallographic [001]-axis and the minimum close to [010]. This applies
to members of the alkali feldspar and plagioclase series; however, plagioclase shows slightly
more scatter in direction than does alkali feldspar. The orientation of the principal axes can be
explained by crystal symmetry, which requires that one principal susceptibility axis is parallel
to [010] in monoclinic samples, whereas no symmetry constraints are imposed on triclinic
crystals (Neumann 1885; Nye 1957). Some specimens that appeared to have negative
susceptibilities exhibit similar principal directions as samples with positive mean
susceptibilities. Because the torque magnetometer is sensitive to the magnitude of susceptibility
differences within the measurement plane, but not to the direction of magnetisation – parallel
or antiparallel to the applied field; this may suggest that these crystals are also paramagnetic, if
the same mechanism is responsible for the AMS as for the paramagnetic crystals. Amazonite
(Am1-3) has a clear diamagnetic bulk susceptibility where its minimum (least negative)
susceptibility is close to the [001]-axis, whereas the maximum (most negative) susceptibility
can be parallel to (100) or [010] depending on the sample.
4. Discussion Pure feldspar of ideal composition – independent of whether it is alkali feldspar or
plagioclase – is diamagnetic. The susceptibility can become positive, however, (1) when cations
with a strong magnetic moment, such as iron, enter the feldspar structure, and/or (2) in the
presence of ferromagnetic grains or other inclusions with strongly paramagnetic ions.
According to Vernon (1961), a positive linear correlation is expected between iron
concentration and mean susceptibility in ferromagnesian silicates. For feldspar, no such
dependence on the mean susceptibility is observed either with Fe or Mn concentration or with
a combination of the two weighted to their effective moments. Both negative and positive mean
19
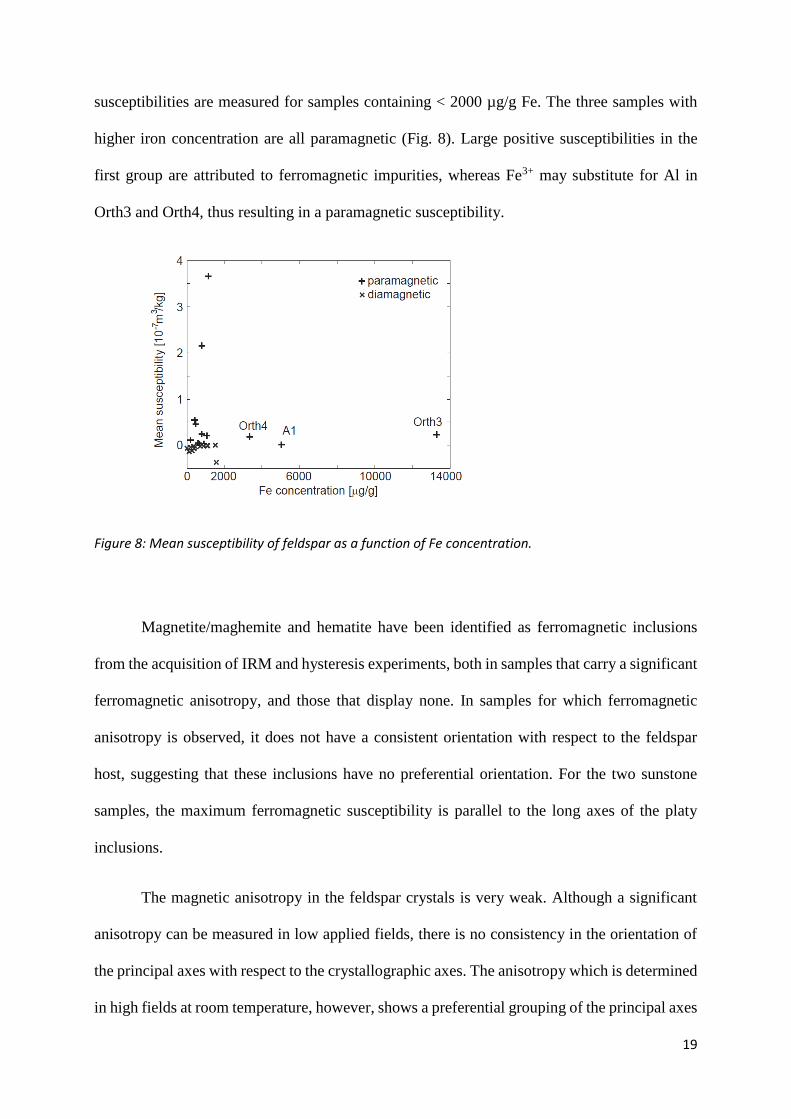
susceptibilities are measured for samples containing < 2000 µg/g Fe. The three samples with
higher iron concentration are all paramagnetic (Fig. 8). Large positive susceptibilities in the
first group are attributed to ferromagnetic impurities, whereas Fe3+ may substitute for Al in
Orth3 and Orth4, thus resulting in a paramagnetic susceptibility.
Figure 8: Mean susceptibility of feldspar as a function of Fe concentration.
Magnetite/maghemite and hematite have been identified as ferromagnetic inclusions
from the acquisition of IRM and hysteresis experiments, both in samples that carry a significant
ferromagnetic anisotropy, and those that display none. In samples for which ferromagnetic
anisotropy is observed, it does not have a consistent orientation with respect to the feldspar
host, suggesting that these inclusions have no preferential orientation. For the two sunstone
samples, the maximum ferromagnetic susceptibility is parallel to the long axes of the platy
inclusions.
The magnetic anisotropy in the feldspar crystals is very weak. Although a significant
anisotropy can be measured in low applied fields, there is no consistency in the orientation of
the principal axes with respect to the crystallographic axes. The anisotropy which is determined
in high fields at room temperature, however, shows a preferential grouping of the principal axes

20
of the susceptibility ellipsoid. It is interesting to note that the high-field AMS measured at 77
K is not significant. Diamagnetic susceptibility is not dependent on temperature, whereas
paramagnetic susceptibility varies inversely with temperature. Cooling the sample to 77 K will
thus enhance the susceptibility of the paramagnetic ions. The fact that anisotropy is not
significant at 77 K, therefore indicates that the observed susceptibility and anisotropy are
superpositions of: (1) an isotropic paramagnetic component, and (2) an anisotropic diamagnetic
component. The paramagnetic component can be attributed to impurities, whereas the
diamagnetic component is directly related to electron orbital contributions within the feldspar
lattice. For the remainder of the text, we will refer to this component of the anisotropy as the
diamagnetic AMS, regardless of whether the bulk susceptibility is positive or negative.
For samples with positive mean susceptibility, the k1 axis lies close to the normal of the
crystallographic (001) plane, and k3 is along [010] (Fig. 5). This agrees with observations by
Selkin et al. (2000), who found the maximum susceptibility of an anorthosite to be close to the
grouping of plagioclase [001] axes, and the minimum susceptibility normal to foliation, i.e.
parallel to [010]. Based on the samples’ bulk susceptibility, they suggested that the anisotropy
arises from a ferromagnetic component due to inclusions in the feldspar. The discrepancy
between the results reported in Selkin et al. (2014) and this study, is that we isolate the dia-
/paramagnetic contribution to the AMS. Recall that diamagnetic anisotropy is related to
differences in the size of the electron orbit when the field is applied in different directions. For
example, the diamagnetic susceptibility in organic compounds or in graphite is largest normal
to the plane in which the carbon rings are located (Krishnan 1934; McClure 1956; Pauling
1936). Similarly, the diamagnetic susceptibility in calcite and other carbonate minerals is largest
parallel to the crystallographic [001]-axis, which is normal to the planes in which the electron
clouds are preferentially located (Pauling 1979a; Schmidt et al. 2007a). In feldspar, the majority
of the bases of SiO4 and AlO4 tetrahedra are aligned quasi-parallel to the (010) planes (cf. Fig.

21
1). In an analogy to graphite or carbonates, the most negative susceptibility is therefore expected
normal to the feldspar (010) planes, which can explain why the paramagnetic feldspars have
their minimum susceptibility close to [010].
The ±[010] and ±[001] crystallographic axes have similar directions for the individuals
in Carlsbad or Albite twins and the principal susceptibility axes lie close to these directions.
Therefore, the diamagnetic AMS is similar for the single crystals and the twinned crystals
Orth2, Kfsp1, Ab1 and Lab2, i.e. the maximum susceptibility is close to ±[001] and the
minimum close to ±[010]. Deviations from this pattern only occur if the sample is not a pure
single crystal or twin, but contains crystals with other orientations (e.g., intergrowths); in this
case the orientations of the principal directions change. This effect is seen for samples Lab1,
Lab3 and Lab4.
Amazonite is the only feldspar that deviates from this general relationship. All three
amazonite samples have mean susceptibilities of -5*10-9 m3/kg, so that they are clearly
diamagnetic and have their least negative susceptibility close to [001], whereas the diamagnetic
adularia in Finkes (1909) study had its most negative susceptibility close to [001]. A possible
explanation is the influence of H-containing defects in amazonite. The blue color of these
specimens is related to Pb2+ and it appears that Pb2+ and OH- defects in the feldspar structure
are coupled (Smith & Brown 1988). It is known that water affects physical properties of
minerals (e.g. Johnson 2006, and references therein). Similarly, H2O or OH in the feldspar
structure might affect magnetic properties by distorting the crystal lattice or changing the crystal
field. For example, Koch-Müller et al. (2003) found that the unit cell of coesite, which has a
framework similar to that of feldspar, changes when OH is incorporated. Interestingly, water
occurs as OH in most feldspars but as H2O in amazonite and microcline (Johnson 2006). The
different size and charge of OH and H2O could affect the distribution of the electrons and thus
the diamagnetic AMS.

22
More work is clearly needed to fully explain the source of the diamagnetic, and possibly
paramagnetic, AMS in feldspar. However, the dependence of principal susceptibility directions
on the crystal structure established in this study can be used to interpret magnetic fabrics in
anorthosites.
Compared to other rock-forming minerals, the mean susceptibility of feldspar is weak,
and the same applies to its degree of anisotropy. The maximum degree of anisotropy of feldspar
is 1.53*10-9 m3/kg. Typical AMS degrees for hornblende, augite or biotite are 9*10-9 m3/kg,
6*10-9 m3/kg and 4*10-8 m3/kg (Biedermann et al. 2014b; Biedermann et al. 2015a; Biedermann
et al. 2015b). Thus, the magnetic anisotropy of feldspar is a factor of 6 with respect to
hornblende, 4 with respect to augite, and 27 with respect to biotite weaker than the AMS of
these mafic minerals that often occur together with feldspar in a rock. Even small amounts of
preferentially aligned biotite (> 4%), augite (> 20%) or hornblende (> 14%) will dominate the
magnetic anisotropy in a feldspar-dominated rock. A typical tonalite for example contains ca.
50±10% plagioclase and 10-20% hornblende; gabbros generally contain 30-60% plagioclase in
addition to pyroxene, olivine and amphibole. Even though plagioclase dominates the modal
composition in these rocks, its AMS is expected to be outweighed by that of the mafic minerals.
5. Conclusion Feldspars possess a weak but significant magnetic anisotropy. Even though most
samples have positive mean susceptibility, their AMS is dominated by a diamagnetic
component related to preferred planes within the electron cloud, corresponding to a common
plane of the bases of the Si- and Al-tetrahedra of the feldspar framework. The paramagnetic
component is isotropic. The maximum susceptibility lies close to the crystallographic [001]-
axis and the minimum susceptibility is parallel to [010]. Feldspars often forms twins or exhibit
exsolution features, and it is shown here that these samples show an AMS pattern similar to

23
that of single crystals. This is not surprising given that the monoclinic symmetry is preserved
by the twin laws. Consequently, AMS of feldspar can be used to infer the magnetic fabric in
anorthosite. In other rocks, the feldspar fabric can play a role if they contain less than e.g. 4 %
of biotite, 14 % of hornblende, or 20 % of augite with preferred orientation.
The ferromagnetic component of the AMS in feldspar only shows a consistent
orientation of principal susceptibility axes in samples S1 and S2 that contain platy opaque
grains. In these samples, the maximum ferromagnetic susceptibility is parallel to the elongation
of the opaque grains, hence imaging their geometry. Most other samples did not show a
significant ferromagnetic anisotropy. Thus, even though careful evaluation of the magnetic
anisotropy is needed for each rock, inclusions in feldspar should not in general be discarded as
paleofield recorders.
Acknowledgements A. Puschnig (Natural History Museum Basel), A. Stucki (Siber+Siber Aathal), P. Brack,
and S.A. Bosshard (ETH Zurich) kindly provided samples for this study. We are grateful to D.
Logvinovich (Laboratory of Crystallography, ETH Zurich) for an introduction to Laue
orientation and assistance during measurements. E.A. Johnson (James Madison University) and
M. Koch-Müller (GFZ Potsdam) are thanked for answering questions regarding OH/H2O in
feldspar. This project was funded by the Swiss National Science Foundation, project
200020_143438
24
References
Banerjee, S., 1939. The magnetic anisotropies of some organic crystals in relation to their structures, Z
Kristallogr, 100, 316-55.
Benisek, A., Kroll, H. & Cemic, L., 2004. New developments in two-feldspar thermometry, Am Mineral,
89, 1496-504.
Biedermann, A.R., Lowrie, W. & Hirt, A.M., 2013. A method for improving the measurement of low-
field magnetic susceptibility anisotropy in weak samples, J App Geophys, 88, 122-30.
Biedermann, A.R., et al., 2014a. Anisotropy of magnetic susceptibility in natural olivine single crystals,
Geochem Geophys Geosys, 15 (7), 3051-65.
Biedermann, A.R., et al., 2014b. Low-temperature magnetic anisotropy in micas and chlorite,
Tectonophysics, 629, 63-74.
Biedermann, A.R., et al., 2015a. Magnetic anisotropy in clinopyroxene and orthopyroxene single
crystals, J Geophys Res - Solid Earth, 120 (3), 1431-51.
Biedermann, A.R., et al., 2015b. Magnetic anisotropy in natural amphibole crystals', Am Mineral, 100,
1940-51.
Coe, R.S., 1979. The effect of shape anisotropy on TRM direction, Geophys J Roy Astr S, 56, 369-83.
Cottrell, R.D. & Tarduno, J.A., 1999. Geomagnetic paleointensity derived from single plagioclase
crystals, Earth Planet Sc Lett, 169, 1-5.
Cottrell, R.D. & Tarduno, J.A., 2000. In search of high-fidelity geomagnetic paleointensities: A
comparison of single plagioclase crystal and whole rock Thellier-Thellier analyses, J Geophys
Res, 105 (B10), 23579-94.
Davis, K.E., 1981. Magnetite rods in plagioclase as the primary carrier of stable NRM in ocean floor
gabbros, Earth Planet Sc Lett, 55, 190-98.
Deer, W.A., Howie, R.A., & Zussman, J., 1992. An Introduction to the Rock-Forming Minerals, 2nd
edn.; UK: Longman Scientific and Technical, 696 pp.
Deer, W.A., Howie, R.A., & Zussman, J., 2001. Framework Silicates: Feldspars, 2nd edn., Rock-
Forming Minerals, 4A; London, UK: The Geological Society, 972 pp.

25
Evans, M.E. & McElhinny, M.W., 1966. The paleomagnetism of the Modipe Gabbro, J Geophys Res,
71 (24), 6053-63.
Evans, M.E. & Wayman, M.L., 1974. An investigation of the role of ultra-fine titanomagnetite
intergrowths in paleomagnetism, Geophys J Roy Astr S, 36, 1-10.
Feinberg, J.M., et al., 2005. Exsolved magnetite inclusions in silicates: Features determining their
remanence behavior, Geology, 33 (6), 513.
Feinberg, J.M., et al., 2006. Preferred orientation and anisotropy of seismic and magnetic properties in
gabbronorites from the Bushveld layered intrusion, Tectonophysics, 420 (3-4), 345-56.
Finke, W, 1909. Magnetische Messungen an Platinmetallen und monoklinen Kristallen, insbesondere
der Eisen-, Kobalt- und Nickelsalze, Ann Phys, 336 (1), 149-68.
Fuller, M.D., 1960. Anisotropy of susceptibility and the natural remanent magnetization of some Welsh
slates, Nature, 186, 790-92.
Fuller, M.D., 1963. Magnetic anisotropy and paleomagnetism', J Geophys Res, 68 (1), 293-309.
Guillong, M., et al., 2008. SILLS: A MATLAB-based program for the reduction of laser ablation ICP-
MS data of homogeneous materials and inclusions, Miner. Assoc. Canada Short Course, 40,
328-33.
Hargraves, R.B. & Young, W.M., 1969. Source of stable remanent magnetism in Lambertville diabase,
Am J Sci, 267, 1161-77.
Jelinek, V., 1981. Characterization of the magnetic fabric of rocks, Tectonophysics, 79, T63-T67.
Jelinek, V., 1984. On a mixed quadratic invariant of the magnetic susceptibility tensor, J Geophys – Z
Geophys, 56 (1), 58-60.
Johnson, E.A., 2006. Water in nominally anhydrous crustal minerals: Speciation, concentration, and
geologic significance, Rev Mineral Geochem, 62, 117-54.
Koch-Müller, M., et al, 2003. OH- in synthetic and natural coesite', Am Mineral, 88, 1436-45.
Krishnan, K.S., 1934. Magnetic anisotropy of graphite, Nature, 133 (3353), 174-75.
Krishnan, K.S. & Ganguli, N., 1939. Temperature variation of the magnetic anisotropy of graphite, Z
Kristallogr, 100, 530-36.

26
Laugier, J. & Filhol, A., 1983. An interactive program for the interpretation and simulation of Laue
patterns, J Appl Crystallogr, 16, 281-83.
Martín-Hernández, F. & Hirt, A.M., 2001. Separation of ferrimagnetic and paramagnetic anisotropies
using a high-field torsion magnetometer, Tectonophysics, 337 (3-4), 209-21.
Martín-Hernández, F. & Hirt, A.M., 2004. A method for the separation of paramagnetic, ferrimagnetic
and haematite magnetic subfabrics using high-field torque magnetometry, Geophys J Int, 157
(1), 117-27.
McClure, J.W., 1956. Diamagnetism of graphite, Phys Rev, 104, 666-71.
Murthy, G.S., Evans, M.E., & Gough, D.I., 1971. Evidence of single-domain magnetite in the
Michikamau anorthosite, Can J Earth Sci, 8, 361-70.
Neumann, F.E., 1885. Vorlesungen über die Theorie der Elastizität der festen Körper und des
Lichtäthers, ed. O.E. Meyer, B.G. Teubner Verlag, Leipzig, Germany
Nye, J.F., 1957. Physical properties of crystals: Their representation by tensors and matrices,
Clarendon Press, Oxford, UK, 322 pp.
O'Handley, R.C., 2000. Modern Magnetic Materials: Principles and Applications, 1st edn., Wiley, New
York.
Pauling, L., 1936. The diamagnetic anisotropy of aromatic molecules', J Chem Phys, 4, 673-77.
Pauling, L., 1979a. Diamagnetic anisotropy of the carbonate ion in calcite, aragonite, strontianite, and
witherite and of other non-cyclic planar atomic groups with resonance structures, Z Kristallogr,
150, 155-61.
Pauling, L., 1979b. Diamagnetic anisotropy of the peptide group, P Natl Acad Sci USA, 76 (5), 2293-
94.
Pettke, T., et al, 2012. Recent developments in element concentration and isotope ratio analysis of
individual fluid inclusions by laser ablation single and multiple collector ICP–MS, Ore Geol
Rev, 44, 10-38.
Schmidt, V., Günther, D., & Hirt, A.M., 2006. Magnetic anisotropy of calcite at room-temperature',
Tectonophysics, 418 (1-2), 63-73.
27
Schmidt, V., et al., 2007a. Magnetic anisotropy of carbonate minerals at room temperature and 77 K,
Am Mineral, 92 (10), 1673-84.
Schmidt, V., et al., 2007b. Separation of diamagnetic and paramagnetic anisotropy by high-field, low-
temperature torque measurements, Geophys J Int, 168 (1), 40-47.
Selkin, P.A., et al., 2000. The effect of remanence anisotropy on paleointensity estimates: a case study
from the Archean Stillwater Complex, Earth Planet Sc Lett, 183, 403-16.
Selkin, P.A., Gee, J.S., & Meurer, W.P., 2014. Magnetic anisotropy as a tracer of crystal accummulation
and transport, Middle Banded Series, Stillwater Complex, Montana, Tectonophysics, 629, 123-
137
Seront, B., Mainprice, D., & Christensen, N.I., 1993. A determination of the three-dimensional seismic
properties of anorthosite: Comparison between values calculated from the petrofabric and direct
laboratory measurements', J Geophys Res, 98 (B2), 2209-21.
Smith, J.V. & Brown, W.L., 1988. Feldspar Minerals: Crystal Structures, Physical, Chemical and
Microtextural Properties,Springer, Berlin, Germany.
Strangway, D.W., Larson, E.E., & Goldstein, M., 1968. A possible cause of high magnetic stability in
volcanic rocks, J Geophys Res, 73 (12), 3787-95.
Tarduno, J.A., Cottrell, R.D., & Smirnov, A.V., 2006. The paleomagnetism of single silicate crystals:
Recording geomagnetic field strength during mixed polarity intervals, superchrons, and inner
core growth, Rev Geophys, 44 (1), RG1002.
Uyeda, S., et al., 1963. Anisotropy of magnetic susceptibility of rocks and minerals, J Geophys Res, 68
(1), 279-91.
Vernon, R.H., 1961. Magnetic susceptibility as a measure of total iron plus manganese in some
ferromagnesian silicate minerals, Am Mineral, 46, 1141-53.
Wallace, P.R., 1947. The band theory of graphite, Phys Rev, 71, 622-34.
Wenk, H.-R., Chen, K., & Smith, R., 2011. Morphology and microstructure of magnetite and ilmenite
inclusions in plagioclase from Adirondack anorthositic gneiss, Am Mineral, 96, 1316-24.
Wu, Y.T., Fuller, M. , & Schmidt, V.A., 1974. Microanalysis of NRM in a granodiorite intrusion, Earth
Planet Sci Lett, 23, 275-85.

28
Tables Table 1: Sample list and localities for the feldspar crystals. Samples are single crystals unless
otherwise specified.
Table 2: Recalculated cations per formula unit for main constituents and important magnetic
ions based on LA-ICP-MS data
Table A: Average elemental composition as defined by LA-ICP-MS
Table B: Mean susceptibility and principal susceptibilities and directions of the low-field
AMS with anisotropy degree, shape and significance. Directions are given when crystals
could be oriented. Declination (D) and inclination (I) are given in a crystallographic
coordinate system, where D = 0, I = 0 corresponds to [100], D = 90, I = 0 corresponds to
[010], and I = 90 corresponds to (001) in monoclinic crystals and a direction normal to the
plane defined by [100] and [010] for triclinic crystals.
Table C: Principal deviatoric susceptibilities and directions, AMS degree, and shape of the (a)
ferromagnetic component when significant, and (b) diamagnetic/paramagnetic component of
the AMS at room temperature and 77 K. Directions are given when crystals could be oriented
and D and I are defined in the same way as for Table B.