
Animated Exploring of Huge Software Systemstcl/gradtheses/lwang/gracethesisfinal.pdfii...
124
Animated Exploring of Huge Software Systems Liqun Wang Thesis submitted to the Faculty of Graduate and Postdoctoral Studies in partial fulfillment of the requirements for the degree of Master of Science System Sciences Program School of Information Technology and Engineering University of Ottawa Ottawa, Ontario, Canada „Liqun Wang, 2002
Transcript of Animated Exploring of Huge Software Systemstcl/gradtheses/lwang/gracethesisfinal.pdfii...

Animated Exploring of Huge Software Systems
Liqun Wang
Thesis
submitted to the Faculty of Graduate and Postdoctoral Studies
in partial fulfillment of the requirements
for the degree of Master of Science
System Sciences Program
School of Information Technology and Engineering
University of Ottawa
Ottawa, Ontario, Canada
„Liqun Wang, 2002

ii
ACKNOWLEDGEMENTS
I would like to acknowledge the help that I have received during my research.
Grateful thanks to:
• Dr. Timothy Lethbridge, my supervisor, for his support, guidance, patience and
intelligent comments.
• The KBRE group for their help, comments, and the valuable discussions with them.
• The students who participated in this study
• My friends for their concerns and encouragement.

iii
ABSTRACT
There are many software visualization tools available today to help software engineers to
explore software systems. However, when a system is huge, some of these tools do not
satisfy the exploration requirements. The big problem is that the techniques the tools use
do not provide an effective display and access mechanism to handle huge information
spaces within the limitations imposed by available screen space.
To alleviate the problem, this thesis describes methods that help users to explore huge
software systems. In particular, we apply dynamic browsing incorporating such details as
an extra result box mechanism, plus pattern based searching to help users to handle large
query results. Then the thesis introduces the algorithms we apply to generate the layouts.
We propose the radial angle model to visualize the internal structures of rooted trees.
Also we apply the spring model to visualize the external structures among rooted trees.
Next, the thesis describes various animation methods we use to smooth the transitions,
track the focus of exploration, clarify unexpected results, and illustrate complex
operations. In addition, we modify traditional camera animation, and propose an
animation timing scheme ‘slow-in fast-out’ to exaggerate the reality. Next, the thesis
describes a series of experiments we conducted to assess the effectiveness of the
browsing, layout algorithm and animation techniques we implemented. Finally the thesis
describes how we use the analysis of the experiment results to guide our future research.

iv
TABLE OF CONTENTS
Chapter One: Introduction.......................................................... 1
1.1 Current Problems of Visualizing Large Software System.................... 1
1.1.1 Background ................................................................................................... 1
1.1.2 Visualizing the Software ................................................................................ 1
1.1.3 Difficulties in Software Visualization ............................................................ 2
1.2 Related Research................................................................................. 2
1.2.1 Browsing Techniques..................................................................................... 2
1.2.2 Layout Algorithms ......................................................................................... 3
1.2.3 Animation Techniques................................................................................... 4
1.3 Motivation and Objectives .................................................................. 4
1.4 Contributions of the Thesis ................................................................. 5
1.5 The Organization of the Thesis............................................................ 6
Chapter Two: Browsing Techniques........................................... 7
2.1 Literature Review................................................................................ 7
2.1.1 Panning and Zooming ................................................................................... 7
2.1.2 Multi-viewer................................................................................................... 8
2.1.3 Focus and Context Browsing......................................................................... 8
2.1.4 Tree-maps Viewer .......................................................................................... 9
2.1.5 3D Browsing ................................................................................................ 10
2.1.6 Dynamic Interactive Browsing..................................................................... 10
2.1.7 Searching and Browsing.............................................................................. 11
2.1.8 Summary...................................................................................................... 12
2.2 Browsing Approach of TkSee Visualizer........................................... 12
2.2.1 Browsing Requirements of TkSee Visualizer ............................................... 12
2.2.2 Browsing Approach of TkSee Visualizer ..................................................... 13
2.3 Features of the Browsing Approach of TkSee Visualizer................... 14
2.3.1 Interactive Exploration ................................................................................ 15

v
2.3.2 Pattern Based Searching.............................................................................. 15
2.3.3 Exploration of Multiple Relationships among Multiple Entity Types.......... 16
2.3.4 Limits on the Number of Expanded Nodes on Screen ................................. 16
2.3.5 Preserving the User’s Mental Map .............................................................. 17
2.3.6 Handling Large Query Results .................................................................... 18
2.3.7 Panning ....................................................................................................... 20
2.4 Summary........................................................................................... 20
Chapter Three: The Layout Algorithm ............................................ 21
3.1 Literature Review of Related work.................................................... 21
3.1.1 Background of Graph Drawing ................................................................... 21
3.1.2 The Spring Model Layout Algorithm ........................................................... 23
3.1.3 The Sugiyama Layout Algorithm................................................................. 24
3.1.4 Radial Layout .............................................................................................. 26
3.1.5 Incremental Layout Algorithms................................................................... 26
3.2 Layout Approach of TkSee Visualizer............................................... 28
3.2.1 Layout Requirements of TkSee System ........................................................ 28
3.2.2 Layout Algorithm of TkSee Visualizer......................................................... 30
3.3 Detailed Discussion of the Layout Algorithms of TkSee Visualizer .. 32
3.3.1 The Radial Angle Model .............................................................................. 32
3.3.2 Modeling Rooted Trees ................................................................................ 41
3.3.3 Modeling by Heuristics ................................................................................ 42
3.3.4 Be Capable to Adjust the Layout Manually ................................................. 44
3.4 Layout Results Given by TkSee Visualizer ....................................... 45
3.5 Summary........................................................................................... 46
Chapter Four: Animation.......................................................... 48
4.1 Functionality of Animation: .............................................................. 48
4.2 Basic Rules of Animation design....................................................... 48
4.2.1 Parameters to Animate ................................................................................ 49
4.2.2 Animation Control ....................................................................................... 49
vi
4.2.3 Animation Path............................................................................................ 50
4.2.4 Animation Timing........................................................................................ 50
4.2.5 Frame Rate .................................................................................................. 50
4.2.6 Psychological Factors .................................................................................. 51
4.2.7 Applying Principles of Cartoon Animation.................................................. 51
4.3 Animation Techniques Used in the Visualization of Software ........... 52
4.3.1 Camera Animation....................................................................................... 52
4.3.2 Layout Animation ........................................................................................ 52
4.3.3 Shrinking/Growing Animation .................................................................... 53
4.3.4 Problems in the Animation Usage ............................................................... 53
4.3.4.2 Other Usage of Animation ........................................................................ 54
4.4 Animation Techniques Implemented in TkSee Visualizer ................. 54
4.4.1 Animation Design ........................................................................................ 55
4.4.2 Layout Animation and Grow/Shrink Animation.......................................... 57
4.4.3 Intelligent Camera Animation ..................................................................... 59
4.4.4 Zero-result Animation ................................................................................. 61
4.4.5 Result-already-exist Animation.................................................................... 63
4.4.6 Updating Animation .................................................................................... 65
4.4.7 Root Updating Animation ............................................................................ 68
4.5 Summary........................................................................................... 69
Chapter Five: The Architecture of TkSee Visualizer............... 70
5.1 TkSee Visualizer ............................................................................... 70
5.2 Process Flow of TkSee Visualizer ..................................................... 71
5.3 User Interface of TkSee Visualizer.................................................... 73
5.3.1 Symbol Indicator.......................................................................................... 74
5.3.2 Start Exploration Toolbox ........................................................................... 74
5.3.3 Explore Toolbox .......................................................................................... 75
5.3.4 Preferences Toolbox .................................................................................... 75
5. 3.5 Animation Setup Toolbox ........................................................................... 76
5.3.6 Color Design ................................................................................................ 77

vii
5.3.7 Other Interface Techniques ......................................................................... 78
Chapter Six: Evaluation Experiments ...................................... 79
6.1 Methodology..................................................................................... 79
6.1.1 Test Users .................................................................................................... 79
6.1.2 Experiment Preparation .............................................................................. 80
6.1.3 Experiment Process ..................................................................................... 81
6.2 Analysis of Experiment Results......................................................... 82
6.2.1 Browsing Techniques................................................................................... 82
6.2.2 Layout Algorithms ....................................................................................... 86
6.2.3 Animation Techniques................................................................................. 90
6.2.4 User Interface .............................................................................................. 94
6.2.5 The Default Value of System Parameters .................................................... 94
6.2.6 General Feedback of the Tool...................................................................... 97
6.3 Summary......................................................................................... 100
Chapter Seven: Conclusion And Future Work ...................... 101
7.1 Review of the Research................................................................... 101
7.2 Conclusions..................................................................................... 102
7.3 Limitations and Future Work .......................................................... 102
References................................................................................. 104
Appendices................................................................................ 110
Appendix A: The Instructions of the Experiment .................................. 110
Appendix B: Test Tasks ........................................................................ 111
Appendix C: Informed Consent Form ................................................... 113
viii
LIST OF FIGURES
Figure 2-1: The extra result box .................................................................................... 14
Figure 2-2: The extra result box and pattern based searching: (1) Extra result box is not
used; (2) The pattern based searching string is “*”; (3) The pattern based searching
string is “get_d*”................................................................................................... 20
Figure 3-1: The key concepts in radial angle model....................................................... 34
Figure 3-2: The angular assignment of child nodes........................................................ 35
Figure 3-3: Preserve the mental map ............................................................................. 36
Figure 3-4: Model unit .................................................................................................. 38
Figure 3-5: When the neighbor gap angle is larger than the child node angle................. 40
Figure 3-6: When the neighbor gap angle is smaller than the child node angle .............. 40
Figure 3-7: Root nodes are placed in the cross points of a grid. ..................................... 42
Figure 3-8: The flow chart of whole modeling process .................................................. 44
Figure 3-9: A layout within a rooted tree....................................................................... 45
Figure 3-10: A layout with multiple rooted trees ........................................................... 46
Figure 4-1: The slow-in fast-out animation timing model .............................................. 56
Figure 4-2: Layout animation (1) Node find_plane_activity is clicked to expand (2) The
child nodes of find_plane_activity are growing from find_plane_activity (3) The
child nodes stop moving as they reach their destinations........................................ 59
Figure 4-4: Intelligent camera animation (1) Node system_typ is clicked to expand (2)
Intelligent camera animation is performed............................................................. 61
Figure 4-5: Zero-result animation (1) User does an exploration on node prio but there is
no query result (2) The node prio grows up ........................................................... 63
Figure 4-6: Result-already-exist animation (1) User does an exploration on node
dcd_absent_str but the result has already existed on the screen (2) The node chopin
is pushed away ...................................................................................................... 65
Figure 5-1: TkSee Visualizer......................................................................................... 71
Figure 5-2: The flowchart of the Tcl/Tk component ...................................................... 72
Figure 5-3: The flow chart of the C++ core program ..................................................... 73
Figure 5-5: The symbol indicator .................................................................................. 74

ix
Figure 5-6: The start exploration toolbox ...................................................................... 74
Figure 5-8: The preference toolbox ............................................................................... 76
Figure 5-9: The animation toolbox ................................................................................ 77

x
LIST OF TABLES
Table 6-1: Default value of system parameters .............................................................. 97
Table 6-2: Users’ comments on the tool ........................................................................ 98
Table 6-3: The summary of the experiment results ...................................................... 100

1
Chapter One: Introduction
1.1 Current Problems of Visualizing Large Software System
1.1.1 Background
In today’s software industry, large software systems are everywhere. Some systems,
particularly legacy software, may contain millions of lines of code. These large systems
are extremely complex, so understanding the design, as well as changing and repairing
the code in such systems are inordinately time consuming and costly. How to effectively
maintain such large systems has been a big problem.
1.1.2 Visualizing the Software
A good picture is worth ten thousand words, so one way to help software engineers to
cope with complexity and to increase programmer productivity is through visualization.
Because humans are inherently visual creatures, visual representations can make the
process of understanding software easier.
Software visualization (SV) is the use of pictures for looking at and understanding
software systems. Depending on the nature of the software understanding problem,
different aspects of software structure or behavior are visualized. For example,
visualizing the structure of classes and relationships among the software entities to help
users to understand the program. Visualizing the data structures of a program in an
intelligent way can help the programmer to solve memory leaks. Algorithm animation is
yet another example of software visualization that has proven to be very useful in
teaching computer algorithms.

2
Besides the advantages of making programs easy to understand, software visualization
also has other merits, such as being graphically appealing and being potentially easier for
people to use than textual views, etc.
1.1.3 Difficulties in Software Visualization
The big difficulty in software visualization (SV) is dealing with the huge graph needed to
fully represent software versus the limited screen space available. Without effective
display and access mechanisms, the information itself is useless. In an SV system,
software entities are presented as nodes while the relations among the nodes are
represented as arcs. When the number of nodes is 1000-2000 or so, browsing the screen
with panning and zooming is enough. When the number of nodes is more than that,
special browsing techniques must be used.
The various structures of software entities and the relations among them are presented to
the user of a visualization tool using general layout algorithms. However, general layout
algorithms may not 100% satisfy the requirements of some SV areas. Such as the entities
in the graph drawing are represented as dots while in SV they are presented as nodes of
some size. Some small changes can cause a big problem.
1.2 Related Research
There are two key classes of techniques we need to examine to better understand
approaches to SV. These are browsing techniques and layout algorithms.
1.2.1 Browsing Techniques
The biggest problem with browsing techniques is dealing with the huge graph versus the
small amount of screen space. A lot of research has been done to cope with the problem.
There are three main ‘static’ browsing techniques:

3
• The multiple-viewer [25][3] offers two viewers. One viewer gives a global view while
the other gives a view of local detail.
• The focus+context viewer [4][5][39] attempts to use distortion to display the whole
graph in one viewer. The area near the focus is shown in detail while the area away from
the focus is shown only in overview.
• 3D browsers [22][23][24] are another general approach to browsing.
When the nodes number less than 3000, those algorithms work well. But when the system
contains millions of nodes, dynamic browsing techniques [20][37] give a better solution.
They dynamically generate small parts of the overall graph as the user is exploring on it.
However, although dynamic browsing techniques can browse huge software systems,
they nevertheless have difficulty handling huge query results (e.g. situations when the
user clicks on an entity to show related entities and hundreds of related entities must be
displayed).
1.2.2 Layout Algorithms
In SV, a few general layout algorithms are used to describe various structures and
relationships in a program. For example, the Sugiyama layout algorithm [2] can be used
to illustrate hierarchical relations among classes; and the spring model [1] can present
non-hierarchical relationships among software entities. These graph drawing approaches
are selected based on the properties of the graph type. They give readable layouts that
obey aesthetic principles.
In this thesis, a new layout algorithm, incremental layout, is created to work with a new
dynamic browsing technique. These new techniques require a lot of analysis with regard

4
to both the browsing technique and the layout algorithm. One problem that must be
considered is how to preserve the user’s mental map during dynamic exploration.
1.2.3 Animation Techniques
When users change the focus of the view while browsing the diagram, camera animation
is activated to smooth the transition. Layout animation is conducted in the incremental
layout to preserve mental map. In the incremental layout, animation is applied after every
exploration. This gives the user an expectation: they are waiting for change after every
click. If there is no change, they might think something is wrong. That is another mental
issue we should also consider.
1.3 Motivation and Objectives
According to the problems in understanding huge software systems, as well as the
achievement of previous research in software visualization, we need to investigate how
software visualization techniques can be specifically adapted to meet the requirements of
program comprehension through visualization. Also, with our approaches we have to
assess how much we can do to improve the performance of software visualization.
The aim of my thesis is to find a good method to help users to explore very large software
systems. We attempt to build a new software visualization tool that employs advanced
methodologies and implements our approaches. The tool will be capable of browsing
huge software systems and handling huge query results. It can explore multiple
relationships among multiple software entities. The layout given by the tool should be
clear and satisfies the aesthetics of graph. Furthermore, the user’s mental map should be
preserved during the exploration.
5
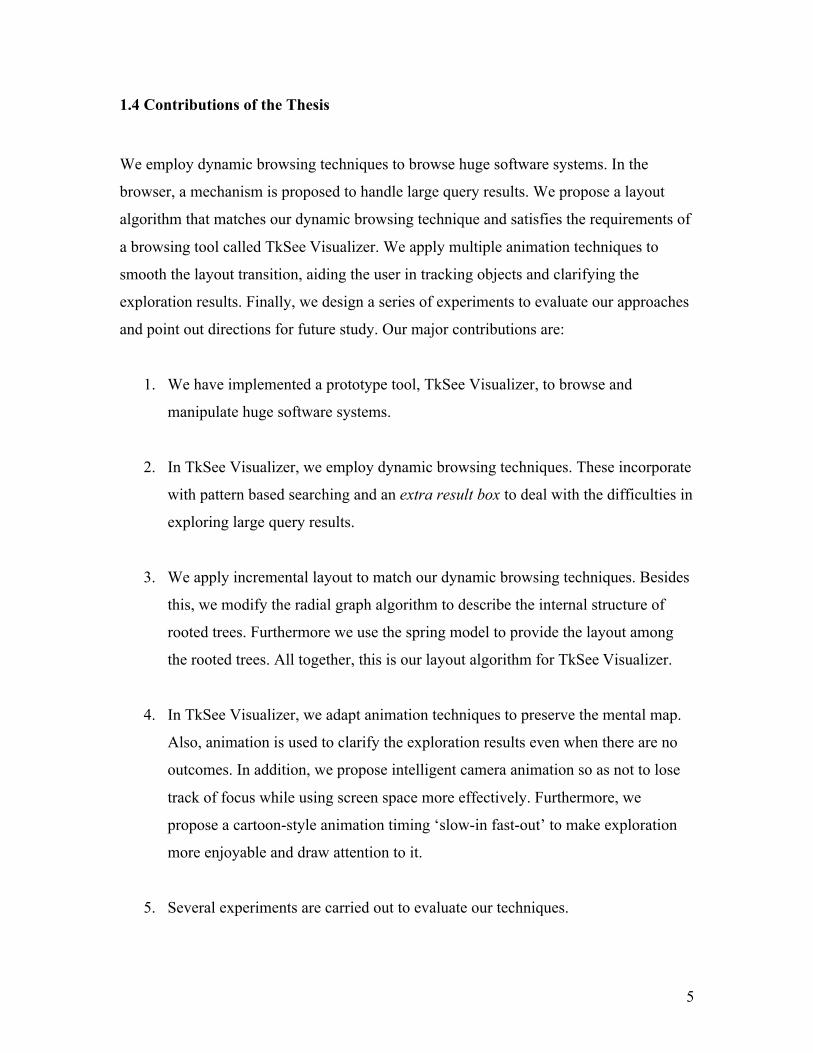
1.4 Contributions of the Thesis
We employ dynamic browsing techniques to browse huge software systems. In the
browser, a mechanism is proposed to handle large query results. We propose a layout
algorithm that matches our dynamic browsing technique and satisfies the requirements of
a browsing tool called TkSee Visualizer. We apply multiple animation techniques to
smooth the layout transition, aiding the user in tracking objects and clarifying the
exploration results. Finally, we design a series of experiments to evaluate our approaches
and point out directions for future study. Our major contributions are:
1. We have implemented a prototype tool, TkSee Visualizer, to browse and
manipulate huge software systems.
2. In TkSee Visualizer, we employ dynamic browsing techniques. These incorporate
with pattern based searching and an extra result box to deal with the difficulties in
exploring large query results.
3. We apply incremental layout to match our dynamic browsing techniques. Besides
this, we modify the radial graph algorithm to describe the internal structure of
rooted trees. Furthermore we use the spring model to provide the layout among
the rooted trees. All together, this is our layout algorithm for TkSee Visualizer.
4. In TkSee Visualizer, we adapt animation techniques to preserve the mental map.
Also, animation is used to clarify the exploration results even when there are no
outcomes. In addition, we propose intelligent camera animation so as not to lose
track of focus while using screen space more effectively. Furthermore, we
propose a cartoon-style animation timing ‘slow-in fast-out’ to make exploration
more enjoyable and draw attention to it.
5. Several experiments are carried out to evaluate our techniques.

6
1.5 The Organization of the Thesis
The rest of the thesis is organized as follows:
Chapter 2 reviews various popular browsing techniques then describes the browsing
technique we used in TkSee Visualizer.
Chapter 3 summarizes layout algorithms used in SV tools. After that it explains our
radial angle layout model.
Chapter 4 introduces diverse animation techniques and animation design rules, then
focuses on the animations we implemented in the TkSee Visualizer
Chapter 5 describes the implementation of the prototype tool TkSee Visualizer
Chapter 6 presents a series of experiment results to assess the effectiveness of our
browsing approach, layout model and animation techniques.
Chapter 7 sums up our research and points out future study directions.
7
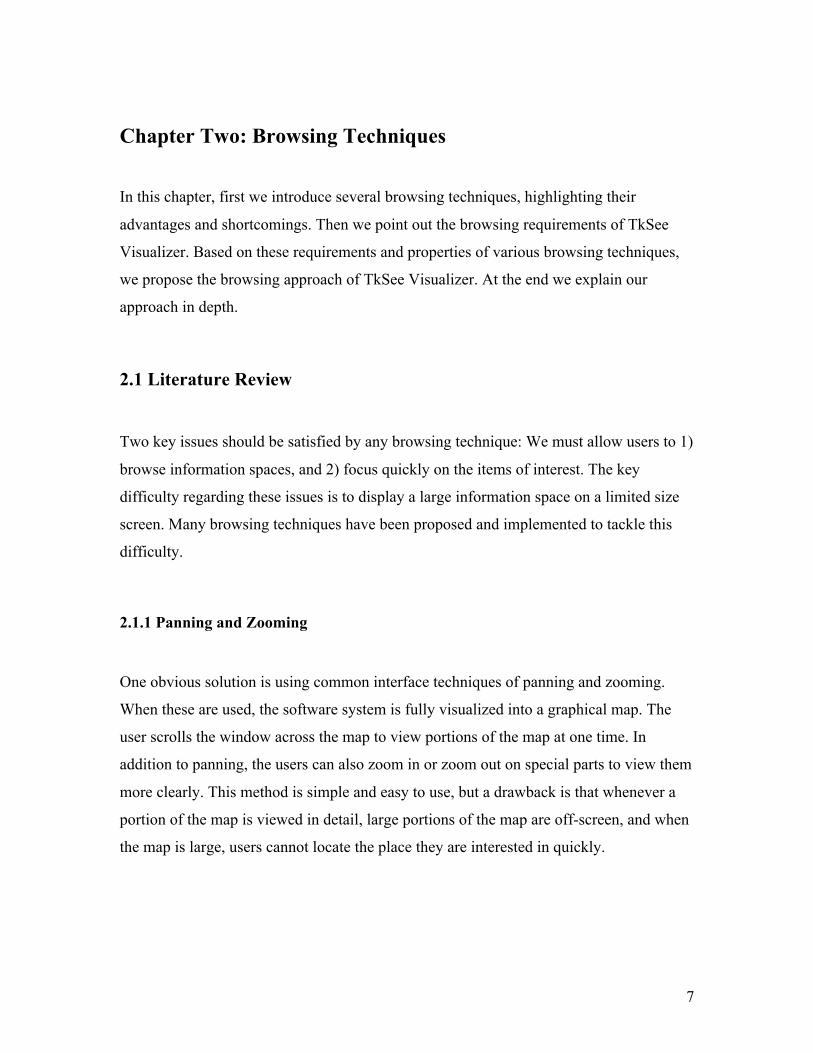
Chapter Two: Browsing Techniques
In this chapter, first we introduce several browsing techniques, highlighting their
advantages and shortcomings. Then we point out the browsing requirements of TkSee
Visualizer. Based on these requirements and properties of various browsing techniques,
we propose the browsing approach of TkSee Visualizer. At the end we explain our
approach in depth.
2.1 Literature Review
Two key issues should be satisfied by any browsing technique: We must allow users to 1)
browse information spaces, and 2) focus quickly on the items of interest. The key
difficulty regarding these issues is to display a large information space on a limited size
screen. Many browsing techniques have been proposed and implemented to tackle this
difficulty.
2.1.1 Panning and Zooming
One obvious solution is using common interface techniques of panning and zooming.
When these are used, the software system is fully visualized into a graphical map. The
user scrolls the window across the map to view portions of the map at one time. In
addition to panning, the users can also zoom in or zoom out on special parts to view them
more clearly. This method is simple and easy to use, but a drawback is that whenever a
portion of the map is viewed in detail, large portions of the map are off-screen, and when
the map is large, users cannot locate the place they are interested in quickly.

8
2.1.2 Multi-viewer
Some browsing techniques present two viewers. One gives the global view of the graph,
while the other gives the detail of the focus point on the global viewer. Bifocal [25] and
Information Mural [1] are the examples of this concept.
Information Mural [3] is a 2D information visualization tool. It uses visual attributes such
as grayscale shading, intensity, color, and pixel size, along with anti-aliased compression
techniques to compress a large information space to fit entirely within a display window.
Besides the global viewer, Information Mural also supplies the second viewer to display
detailed information of the focus area in the global viewer. The graph in the detail viewer
is updated as the focus moves around the global viewer.
Multi-viewer has the advantage of presenting both local detail and overall structure. But
it requires extra screen space and forces users to mentally integrate the two views. On the
local detail viewer, the part adjacent to the enlarged area is not visible at all.
2.1.3 Focus and Context Browsing
Fisheye view [4][5] is a widely used focus and context browsing technique. It presents
both local detail and global context in one view without switching among multiple
viewers. The places near the focus are shown in detail while remote regions are shown in
successively less detail. As the user moves the focus, the graph constantly changes to
keep the area near the focus enlarged.
The fisheye view is implemented in the software visualization tool Shrimp [32] as one of
its browsing techniques.
One drawback of fisheye view is that some typical diagrams will change to very weird
shapes so as to be unrecognizable after the fisheye view transformation. It also requires

9
the diagram of the system to be predefined before viewing. When the system is huge it is
therefore impractical.
Another well-known focus and context browsing technique is Hyperbolic Browser [39]
which attempts to take advantage of the properties of hyperbolic geometry to visualize
large hierarchies. It can display up to 10 times as many nodes as conventional tree
browsers. But the hyperbolic browser is weak in giving the directionality of links and
also the location of a node in the overall space.
2.1.4 Tree-maps Viewer
Johnson and Shneiderman proposed a space filling tree map approach to visualize
hierarchical information structures [28]. In tree-maps, a hierarchy is drawn as a set of
nested boxes in which each node is presented as a rectangular region composed of the
rectangular regions that represent its children. It attempts to organize nodes all over the
screen to increase the usage of screen space.
Treeviz [47] for the Macintosh is an implementation of the tree-maps concept. Each of
the nodes can be colored dependent upon the type of the file, and the lightness can
indicate age etc. The user can click on these rectangles to either get more information or
to perform options such as delete etc.
The main advantage of tree-maps is its ability to visualize large hierarchies. It is claimed
that 1-3000 nodes, each with an area of 100 pixels, can be displayed in the screen of 640
by 480 pixels. While a standard 2-D hierarchy browser can typically display around 100
nodes under that circumstance. The other advantage is its ability to emphasize some
attribute of the data, for example size of files, by the size of the rectangular regions.
However tree-maps tend to obscure the hierarchical structure and result in the user losing
the context while focusing on one part of a hierarchy.

10
2.1.5 3D Browsing
Another attempt to maximize the effective use of the available screen space is three-
dimensional visualization techniques. The best-known examples are The Perspective
Wall [22] and Cone Trees [23].
The Perspective Wall visualizes linear information such as time, on a folded wall with a
center panel for showing detail and two perspective panels for displaying context. Once a
note is selected on a perspective panel, the wall scrolls to bring the panel that has the
focus node to the front. The trade-off between detail and context can be adjusted by
manipulating the degree of folding, the width of the detail panel, and the angle of the
field of view.
Cone Trees embed the tree in a three dimensional space. The embedded tree has joints.
When a level in the hierarchy is expanded, cones are rotated to bring the selected data
items to the front of the display. The expanded new contents are arranged around the
bottom of the inverted cone.
The use of three dimensions provides more space freedom in graph layout than 2D. Also
it gives users a better "feel" for the structure of the information space [40]. But such
displays still suffer from a lack of screen space along with the burden of 3D visualization.
For Cone Trees, trees with more than approximately 1000 nodes are difficult to
manipulate [40].
2.1.6 Dynamic Interactive Browsing
The browsing techniques that require the predefinition of the overall geometrical
representation of the graph before browsing are called static browsing techniques.
Panning and zooming, multi-viewer, tree map, etc, and all the browsing techniques we
have discussed before are static browsing techniques. Contrary to static browsing

11
techniques, dynamic browsing techniques do not predefine the whole graph before users
browse through it. They build the visualization incrementally as the user is exploring the
graph. OFDAV [37] and NicheWorks [20] are implementations of the dynamic browsing
technique.
In dynamic browsing, the graph updates after each valid exploration action. The change
between consecutive updates should be small enough; otherwise the changes will confuse
the user. This problem is called preserving the user’s mental map of the diagram [14].
Most dynamic browsing systems apply both the incremental layout algorithm and
animation to solve this problem.
Another problem is how to save screen space while keeping browsing effective. M. L.
Huang et al [37] proposed a deletion policy with two strategies to solve the problem. One
of the strategies is called FIFO. They push every expand node into a Queue. The “least
recently used” focus node, the first node in the queue, is deleted when the Queue is full.
The other is called Largest K-distance rule. The node that has the largest graph-
theoretical distance from the new focus node is deleted when the Queue is full.
Static dynamic browsing can effectively deal with graphs of moderately large size (with
hundreds or thousands of nodes); they do not handle huge graphs (with millions of
nodes). Comparing with static dynamic browsing, dynamic interactive browsing
techniques are better techniques for browsing huge software systems since the size of the
system does no matter to it. Dynamic browsing is a new approach that still needs a lot of
effort to be perfect. They currently are not able to give clear architectural views of a
software system.
2.1.7 Searching and Browsing
According to S. E. Sim [33], searching is planned activity with a specific goal, whereas
browsing is more of an explorative strategy with no fixed endpoint. Browsing and

12
searching complement each other. The shortcomings of browsing are matched by the
strengths of the search. “An information space can only be fully utilized when both
navigation styles, browsing and searching, are available.”[33] If a visualization tool
combines with searching, it will be a more powerful tool.
2.1.8 Summary
In this section, we described the most popular browsing techniques, panning and
zooming, multi-viewer, focus and context browsing, tree-maps, 3D browsing and
dynamic interactive browsing. So far, dynamic interactive browsing techniques are the
best technique to browse a huge software system. If we combine searching with
browsing, we can offer users a more effective browser.
2.2 Browsing Approach of TkSee Visualizer
Our browsing approach should meet the browsing requirements of as defined for the
TkSee system [7,48].
2.2.1 Browsing Requirements of TkSee Visualizer
(1) The TkSee system deals with legacy systems that have millions of lines of code.
The Visualizer therefore should handle a huge amount of information.
(2) The TkSee system can explore multiple relationships among multiple software
entities. The Visualizer should also provide this feature.
(3) In TkSee, a single query during the course of browsing can result in thousands of
items to display. The Visualizer should handle therefore huge exploration results.
Although these requirements are given by TkSee, they are limitations also found in
other tools.

13
2.2.2 Browsing Approach of TkSee Visualizer
We adopt the dynamic browsing technique as our browsing technique of TkSee
Visualizer to help users to navigate huge software systems. In addition, we propose an
extra result box mechanism combining with pattern based searching to handle large query
results.
2.2.2.1 Handle Huge Information
We do not display the whole software system on the screen at a time. Starting from the
software entities the user defines, we incrementally update the graph as the user clicks a
node to do exploration with selected parameters. Like the OFDAV[37] system, we apply
the incremental layout algorithm and animations to preserve mental map. We will discuss
the incremental layout algorithm in Chapter three and animation in Chapter four. Again
like the OFDAV system, we drop nodes when too many nodes are displayed on the
screen to prevent clutter. We use FIFO as our deletion policy. More detailed discussions
are given in the next section.
2.2.2.2 Explore Multiple Relationships among Multiple Software Entity Types
TkSee offers four exploration relationships. They are “what nodes are defined by node
A”, “which node defines node A”, ” what nodes are referred to by node A” and “which
nodes refer to node A”. Also four software entity types exist in the TkSee. They are
“files”, ”routines”, “data” and “type”. Every exploration activity is specified by particular
exploration relationship and software entity type that are to be displayed. We apply colors
to distinguish different relationships and software entities. More detailed discussions are
given in the next section.
14
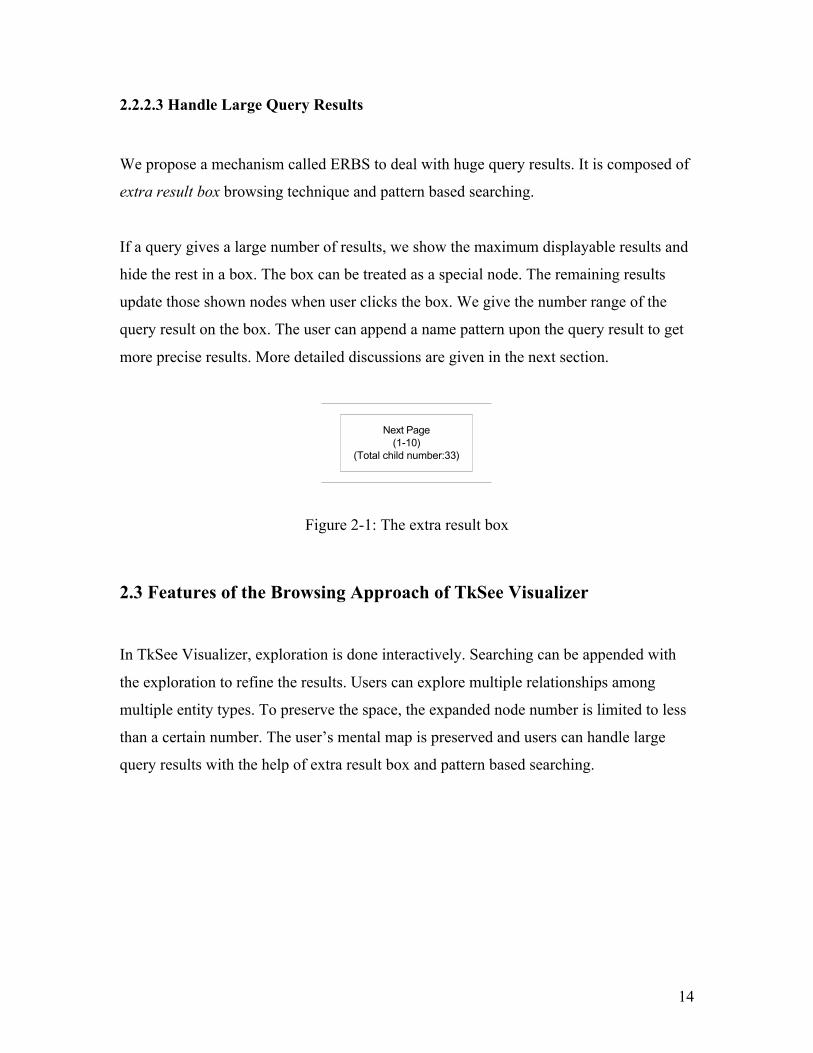
2.2.2.3 Handle Large Query Results
We propose a mechanism called ERBS to deal with huge query results. It is composed of
extra result box browsing technique and pattern based searching.
If a query gives a large number of results, we show the maximum displayable results and
hide the rest in a box. The box can be treated as a special node. The remaining results
update those shown nodes when user clicks the box. We give the number range of the
query result on the box. The user can append a name pattern upon the query result to get
more precise results. More detailed discussions are given in the next section.
Next Page(1-10)
(Total child number:33)
Figure 2-1: The extra result box
2.3 Features of the Browsing Approach of TkSee Visualizer
In TkSee Visualizer, exploration is done interactively. Searching can be appended with
the exploration to refine the results. Users can explore multiple relationships among
multiple entity types. To preserve the space, the expanded node number is limited to less
than a certain number. The user’s mental map is preserved and users can handle large
query results with the help of extra result box and pattern based searching.
15
2.3.1 Interactive Exploration
In TkSee Visualizer, an exploration is activated when the user clicks on a node; the
exploration is specified as a query. The mechanism to create queries is well designed that
users can conduct their explorations easily and effectively.
The Visualizer offers small sets of buttons to help users to create the query (see Fig 5-7).
They are four exploration relation buttons and four result entity type buttons that cover all
the explanation relationships and result entity types defined in TkSee.
The query language used in TkSee is TA [7]. A TA query can be discomposed into the
subject of action, action type and the object of the action. The clicked node is the subject
of the exploration action. Four exploration relationships radio buttons define the action
type. The entity type radio buttons describe the result of the query.
When the user clicks on a node, a query is specified with the clicked node id, the selected
exploration relationship and the selected result entity type.
2.3.2 Pattern Based Searching
In TkSee Visualizer, a pattern based searching function supplied by TkSee can be
appended to the exploration to refine the query results.
In TkSee Visualizer, the first exploration is ready to start after user inputs the name or
name pattern of the first nodes. Visualizer offers an edit bar to define the name of the first
node. It accepts a grep-like regular expression. The Visualizer also offers a set of radio
buttons to help users to define the entity type of the first node. When the user clicks the
”Start Exploration” button beside the edit bar, the search string which contains the name
and the entity type is created and is sent to TkSee as a query. A node or a few nodes that
satisfy the search string will be shown on the screen.
16
Another way to use searching is to refine the query results during the exploration. Once
user gets the exploration results, he or she can append a search string on the results as a
filter to narrow down the results. This helps the user to handle the large exploration
results. We will discuss this in detail in section 2.3.6.
2.3.3 Exploration of Multiple Relationships among Multiple Entity Types
The TkSee Visualizer can explore multiple relationships on a node. The node can be file,
routine, data and type. And results given by multiple dependencies can be added together
on a node.
We use different colors and arrow directions to distinguish diverse exploration
relationships and entity types. According to the meaning of the exploration relationships,
we separate relationships into two groups: define (“defines” and “is defined by”) and
refer (“refers” and “is referred by”). We assign one color to each of the group. And we
use two arrow directions to distinguish “defines” from “is defined by”, and “refers” from
“is referred by”. Therefore six colors have to be chosen to represent four software entity
types and two association relationships. We will discuss the color design in depth in
Chapter five.
2.3.4 Limits on the Number of Expanded Nodes on Screen
The size of the screen is limited. While more and more nodes are expanded, the visibility
of the diagram decreases and the display speed slows down. We have to make a rule to
keep a reasonable number of nodes on the screen so that the user can have enough
information to do the exploration work, while still having a clear view of a significant
part of the system, and in addition having the display update at high speed.

17
We decide to adopt the FIFO deletion policy proposed by [37]. A queue is created to
keep track of all the expanded nodes on the screen. Once a node is clicked to expand it, it
is added to the queue. Once the node is clicked to close it, it is removed from that queue.
When the number of expanded nodes on the screen exceeds the maximum expanded node
number, the length of the queue, we drop the oldest node in the queue.
In the experiment discussed later in this thesis, we show how we have maintained a
reasonable default maximum number of expanded nodes. Before exploration, users can
change the number according to their preference.
2.3.5 Preserving the User’s Mental Map
Compared to static browsing, dynamic browsing may show a lot of changes during the
exploration. Some nodes will disappear while some nodes will appear. Users may have
difficulties tracing the changes. This is called mental map problem. In TkSee Visualizer,
the incremental layout algorithm and animations are applied to help preserve the user’s
mental map. The incremental layout algorithm can give continuous frames which contain
small changes. Layout animation smoothes the layout transitions that help the user to
focus on the most recent node user has interacted with. Camera animation helps the user
not to lose the track on the focus node.
We will give more detailed discussion on the user’s mental map and the incremental
layout algorithm in the Chapter three and animations in the Chapter four.

18
2.3.6 Handling Large Query Results
2.3.6.1 Problems in Browsing Large Exploration Results
Very often, the query returns a large number of query results. If we display all of the
results on screen, they may overlap each other so as to be invisible since the screen space
is very limited. Also, it will take a long time to display all of them on the screen so users
will lose their patience. Actually, the user has no interest in viewing all the results. They
are only interested in a few nodes.
2.3.6.2 Our Solutions to Browse a Large Number of Exploration Results
In TkSee Visualizer, we decide to show only part of the query results if they exceed a
certain number, the maximum displayable child number.
We design a special box called the extra result box. This looks like a special kind of
node. When the query result exceeds the maximum displayable child number, we show
the maximum displayable child number of query results along with the extra result box
pretending that the remaining query results are hiding inside the box. When a user clicks
the box, the current shown query results are replaced with the remaining query results
from the box. The user can browse all the query results by keeping clicking the box.
On the extra result box, we give the range of the query results (e.g. 10-20 of 50, >100).
According to the number, users can know the approximate number of the query results.
This helps user to know where they are when they browse the query results. It also helps
the user to make the decision whether to refine the specification of the query to decrease
the number of exploration results.
The Visualizer also offers an exploration search bar to allow user to do search within the
query results. Normally the search string is set to “*” which accepts all query results as

19
the search results. When the extra result box is shown after the exploration, the user can
specify the search string to filter out the results they are concern with from the complete
set of results.
An experiment we will discuss later is designed to determine the reasonable default
maximum displayable child number on the screen at a time. Also our system allows users
to change the number according to their preference before exploration.
(1)
(2)

20
(3)
Figure 2-2: The extra result box and pattern based searching: (1) Extra result box is notused; (2) The pattern based searching string is “*”; (3) The pattern based searchingstring is “get_d*”.
2.3.7 Panning
Panning is also supported in TkSee Visualizer. Users can drag the background around to
view the whole diagram.
2.4 Summary
After analyzing the diverse browsing techniques, we choose to employ dynamic
interactive browsing techniques in TkSee Visualizer to browse huge software systems.
The tool supports interactive exploration. It can explore multiple relationships on various
software entity types. A FIFO deletion policy is used to limit the expanded node number
on the screen. Panning is also supported by TkSee Visualizer. An incremental layout
algorithm and animations are applied to preserve the mental map. In particular, with the
help of pattern based searching function existing in the TkSee and the extra result box
mechanism we proposed, Visualizer can handle large exploration results.
21
Chapter Three: The Layout Algorithm
In this chapter, first we introduce the layout algorithms that are widely used in software
visualization. Then we list the layout requirements of TkSee. Based on these
requirements, we choose the best layout algorithm for our system and modify it to serve
our system better. At the end of this chapter, we give some layout results created by our
layout algorithm.
3.1 Literature Review of Related work
The layout algorithm is as important an issue in software visualization as the browsing
technique. A lot of layout algorithms for different graph types have been developed
successfully. Among these algorithms, the tree layout [41], spring model [1], Sugiyama
layout [2], radial drawing [44] and incremental layout [37,19] are widely used in software
visualization.
3.1.1 Background of Graph Drawing
The basic graph drawing problem can be described as this: given a set of nodes with a set
of relations (edges), calculate the position of the nodes and the curve to be drawn for each
edge under certain criteria. In order to understand a layout algorithm well, we have to
know some basic graph types and the criteria of the graph drawing.
3.1.1.1 Types of Graph Drawing
Layout algorithms can be categorized with respect to the type of layout they generate.
There are three main approaches to how edges can be drawn:
• Polyline drawing: each edge of the graph is drawn as a polyline chain.

22
• Straight-line drawing: each edge of the graph is drawn as a straight-line segment.
• Orthogonal drawing: each edge of the graph is drawn as polyline chain of alternating
horizontal and vertical segments.
In addition, some other constraints can be placed on the drawing method:
• Grid drawing: vertices, crossings, and edge bends have integer coordinates.
• Planar drawing: no two edges cross.
• Upward (resp. downward) drawing: for acyclic digraphs, each edge is drawn as a curve
monotonically nondecreasing (resp. nonincreasing) in the vertical direction.
In this thesis, we are primarily interested in directed graphs (also called digraphs): each
edge is directed. A directed graph is acyclic if it has no directed cycles. More specifically,
we are interested in rooted trees:
• Rooted Tree: a tree in which one node is designated as the root. [42]
3.1.1.2 Drawing Criteria
There are two aspects to the drawing criteria.
First, the drawing should satisfy the constraints imposed by the definition of properties
and classification of layouts of the applied graph types. Different type of graphs may
require different constraints. For example, the layout of the planar graph should avoid
23
edge-crossings, while a grid layout should position nodes at points with integer
coordinates.
Second, the layouts should be pleasing and readable – satisfying general aesthetic rules.
For example, nodes and edges must be evenly distributed, edges should have similar
lengths, edges should, where possible, be straight lines, isomorphic sub-structures should
be displayed in the same manner, edge-crossings should be kept to a minimum, etc.
According to Purchase’s usability study [44], reducing the crossings is the most
important aesthetic.
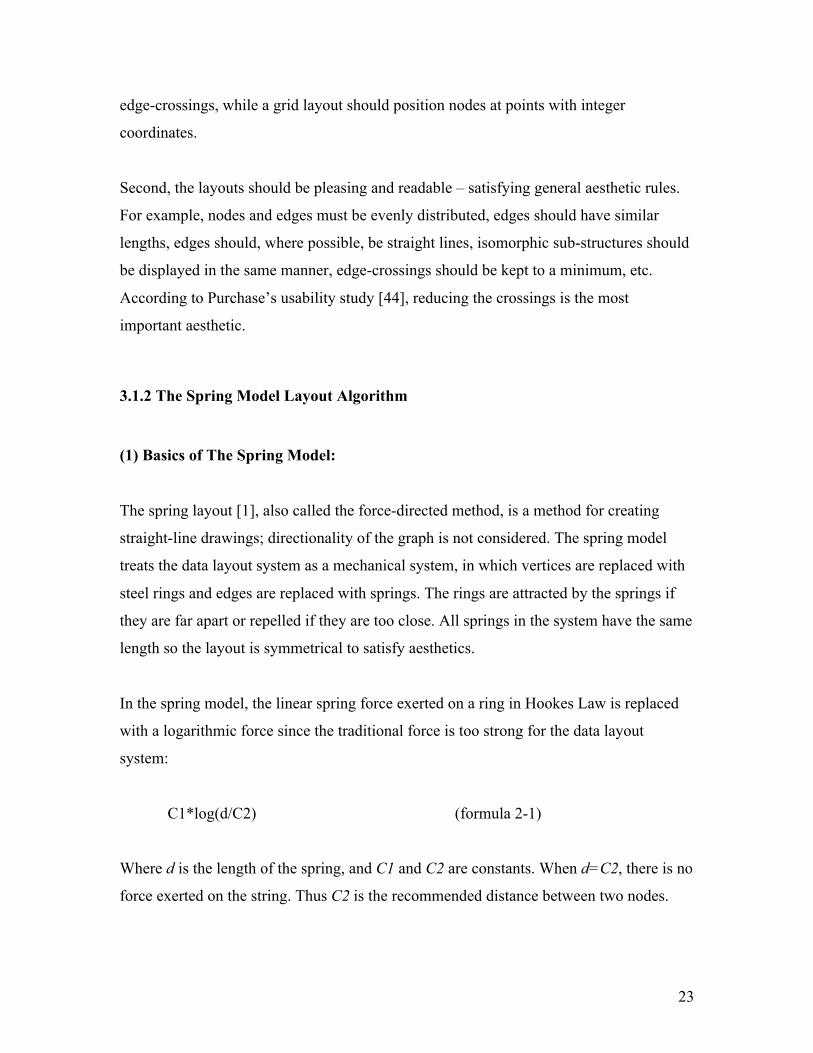
3.1.2 The Spring Model Layout Algorithm
(1) Basics of The Spring Model:
The spring layout [1], also called the force-directed method, is a method for creating
straight-line drawings; directionality of the graph is not considered. The spring model
treats the data layout system as a mechanical system, in which vertices are replaced with
steel rings and edges are replaced with springs. The rings are attracted by the springs if
they are far apart or repelled if they are too close. All springs in the system have the same
length so the layout is symmetrical to satisfy aesthetics.
In the spring model, the linear spring force exerted on a ring in Hookes Law is replaced
with a logarithmic force since the traditional force is too strong for the data layout
system:
C1*log(d/C2) (formula 2-1)
Where d is the length of the spring, and C1 and C2 are constants. When d=C2, there is no
force exerted on the string. Thus C2 is the recommended distance between two nodes.

24
Also an inverse square law force is applied in the spring model. It is exerted on the non-
related vertices to repel then from each other:
C3/sqr(d) (formula 2-2)
Where C3 is a constant and d is the distance between the vertices.
The spring model is heuristic. The algorithm first places the vertices in random locations.
Then it calculates the forces on the vertices and moves them toward their stable positions.
This operation is repeated a few times until the whole system reaches its minimal energy
state or it reaches its maximum calculation time.
(2) Properties of the Spring Model:
The spring model can give a good layout for undirected graphs. The software
visualization tool Shrimp [32] is one of many tools that use this model as one of its layout
algorithms. However, the model can be rather slow. Frick’s study [45] shows that the
workload of the method is O(N3) where N is the number of the nodes in the graph.
Moreover, the spring model is highly unpredictable. The layout of almost identical graphs
might be very different. Furthermore, vertices, in the spring model, are abstract dots
without width and height. When the spring model is used in software visualization, the
dots have to be replaced by area-consuming nodes. The size and other geometry features
of the nodes should be considered to avoid overlapping in the modeling.
3.1.3 The Sugiyama Layout Algorithm
Sugiyama et al. [2] presented a comprehensive approach to drawing hierarchies. The
basic approach is to first assign a layer number to each node according to the relations
among the nodes. Then place nodes of a given layer in a certain order to reduce crossings.
It can be described as the following four steps:

25
Step1 Assign vertices to the layers according to a given set of directed pairwise relations
among elements of a system. Arcs are directed downward and vertices are distributed
uniformly.
If the hierarchy contains long span edges such that some vertices end up in non-
contiguous layers, dummy vertices and edges are added in the skipped layers to conform
to a proper hierarchy.
Step2 Employ the barycentric method (BC) to handle the crossing problem of each two-
layer hierarchy. The basic idea of BC is to assign the x-coordinate of each vertex with the
barycenter (average) of the x-coordinates of its neighbors (in the other layer) so that the
amount of crossing is reduced.
A multiple-layer hierarchy can be also worked out with the scheme. First, one separates
the whole hierarchy into a few consecutive two-layer hierarchies. Then employs BC to
reduce the crossings within each two-layer hierarchy. Then the whole system is done.
Step3 Employ the priority layout method (PR) to assign horizontal positions of vertices
to reduce the number of bends. A priority number, the connectivity of a vertex to its
neighbors, is assigned to each vertex. The vertex with high priority determines its
position first. The highest priority number is given to a dummy vertex; its x-coordinate
will use the same x-coordinate as its parents. The normal vertices are positioned with
their barycenters. The adjustment should preserve the ordering established in the crossing
reduction step. If two vertices have the same barycenter, the algorithm moves the one out
of the way that has the lower priority.
Step 4: display the layout on the terminal.
Unfortunately, the Sugiyama algorithm tends to have very poor stability. A small logical
change in the graph results in a large change in relative positions of nodes in the drawing.

26
3.1.4 Radial Layout
A tree is a connected acyclic graph. Within the tree layout category, a variety of
algorithms have been invented. These include tree [41], H-tree [43], radial drawing [44],
cone tree [23] and tree-maps [28], etc. A classical tree layout will position children nodes
“below” their common ancestor.
Radial drawing is a variation of a layered drawing where the root of the tree is placed at
the origin and layers are concentric circles centered at the origin. A subtree is then laid
out over a sector of the circle. Each node is allocated a sub-sector within the sector
assigned to its parent. The size of the sector is proportional to the angular width of that
node’s subtree. When all the nodes are the same size, the angular width of a node’s
subtree is simply proportional to the number of leaf nodes among its descendants. The
algorithm ensures that two adjacent sectors do not overlap.
The radial layout is predictable. However, it gives a less clear view for indicating where
the root of the tree is and thus it is not a good method to visualize a hierarchy.
3.1.5 Incremental Layout Algorithms
In the dynamic browsing system, the system displays only a small portion of the full
graph; this portion is called a logical frames. Exploration means to move the logical
frame along some trajectory to display other parts of the graph. In other words, nodes are
added to the diagram or discarded from the screen during the exploration. Compared to
static visualizing of a graph, some specific considerations have to be taken to reposition
the changed graph. A particular class of layout algorithms, the incremental layout
algorithms, has therefore been developed to deal with the requirements.

27
3.1.5.1 The Criteria of the Incremental Algorithm
S. C. North [19] summarized three criteria for incremental updating of graphs. They are
as follows, listed by the order of the importance:
(1) Consistency: adherence to layout style rules of the graph. For example, a tree
should always look like a tree during any period of exploration.
(2) Stability: make the fewest changes as possible between successive diagrams to
preserve the mental map.
(3) Readability: the diagrams should satisfy the usual readability criteria for drawing
of graphs. They should be pleasing and easy to read.
3.1.5.2 The Mental Map
Much research has been done to characterize stability between layouts. Misue et al did a
lot of work on how people perceive and remember the structure of diagrams. In his paper
[14], he discussed what he called the mental map and gave precise rules to reserve it:
(1) Orthogonal ordering: the direction of each pair of nodes should be preserved after
a layout adjustment
(2) Proximity: nodes that are close together before the adjustment should remain
close together after the adjustment.
(3) Topology: graphical objects inside a region should stay inside that region after a
layout adjustment.
3.1.5.3 Previous Work
Some incremental layout algorithms have been implemented successfully in SV systems.
For different graph types, the trajectory to generate new logical frames might be
different. Here are examples:

28
(1) DynaDAG [19]:
DynaDAG is a heuristic algorithm for incremental layout of hierarchies that satisfies
proximity and topological stability. It attempts to split a layout adjustment into a few
logical steps that incorporate proximity and topological stability. For example, when
inserting a node, DynaDAG first moves the node downward along the same X
coordinate to the next layer. Then adjusts its Y coordinate to left or to right by the
barycenter value.
(2) OFDAV: online force-directed animated visualization [37]
OFDAV is a system for assisting web document navigation. It modified the force-
directed graph drawing algorithm to minimize the overlaps among the neighborhoods
and puts the focus nodes in a straight line to indicate the direction of the exploration.
In addition, OFDAV produces a continuous sequence of layouts that satisfy the usual
readability drawing criteria. It uses these sequences as “in betweening” animation
frames to smooth the transition between key frames in order to preserve the mental
map.
3.2 Layout Approach of TkSee Visualizer
In this section, first we summarize the requirements of TkSee Visualizer. Based on these
requirements, we choose a general layout algorithm as the basic layout algorithm of
TkSee Visualizer. If it is necessary, we modify it a little to make it work better for our
system. This is explained below.
3.2.1 Layout Requirements of TkSee System
We summarize the layout requirements for TkSee Visualizer in six points:
29
(1) Be capable of exploring four relationships:
The TkSee system can explore four relationships among software entities. They are
“what nodes are defined by node A”, “which node defines node A”, ” what nodes are
referred to by node A” and “which nodes refer to node A”. In TkSee Visualizer, these
four relationships should be explorable from any node.
(2) Be capable of visualizing parent-child relationship:
When a node is clicked to explore with the predefined query, the graph is updated. The
clicked node is the parent node of the result nodes. The results are child nodes of the
clicked node. The layout should present the relationship between the clicked node and the
result nodes clearly. The ideal layout is that child nodes surround the parent node.
(3) Be capable of preserving the user's mental map:
Since we use dynamic browsing, the diagram changes because of the exploration. The
change should be as minimal as possible to preserve the user's mental map.
(4) Be capable of visualizing rooted tree - rooted tree relationships:
Besides the categorization of parent nodes and child nodes, nodes can also be categorized
into root nodes and non-root nodes. Root nodes are those that do not have a displayed
parent node (although there may be relationships in the database) while non-root nodes
have parent nodes currently displayed on the screen. The term rooted tree refers to a root
node and its associated descendents. There is no displayed relation among rooted trees.
The system should be capable of displaying both parent-child relationships and rooted
tree - rooted tree relationships.
(5) Be capable of giving non-overlapped layout as much as possible
A node is drawn in rectangle with the entity’s name. The size of the rectangle depends on
the length of the name of the node. The layout should avoid non-overlapping the nodes as
much as possible.

30
(6) Be capable of adjusting the layout manually:
Another requirement is that when the layout algorithm cannot give a perfect layout for
some reasons, the user can move nodes to get a clear view manually.
3.2.2 Layout Algorithm of TkSee Visualizer
After studying the properties of various layout algorithms and the requirements of TkSee
Visualizer, we propose below the layout algorithm for TkSee Visualizer. The layout
algorithm is a mixture of the incremental layout algorithm, the radial algorithm and the
spring model algorithm. Besides, we add some constraints on the algorithm so it can
handle nodes with sizes and satisfy the requirements of dynamic browsing.
3.2.2.1 A Mixture of Multiple Layout Algorithms
Since TkSee Visualizer applies dynamic browsing, the incremental layout algorithm is a
must. We choose to use the radial algorithm to visualize the layout within a rooted tree
because the radial algorithm is predictable, gives a clear layout with respect to parent-
child relationships, and uses the limited screen space effectively. Also in TkSee, we are
dealing with much data that will not be hierarchical. However, the radial drawing
algorithm is not good at visualizing the rooted tree - rooted tree relationship. We choose
to use the spring model to visualize the rooted tree - rooted tree relationship because the
spring model is good at visualizing undirected graphs.
3.2.2.2 Abstract Dots are Replaced by Nodes
The vertices mentioned in the radial algorithm and spring model are dots. In TkSee
Visualizer, they are nodes with width and height. This raises the problem of large nodes
covering other nodes or arcs.

31
In radial drawing, child nodes are placed in concentric circles surrounding their parent
nodes. In TkSee Visualizer, any node, including a child node, is placed horizontally since
this enables users to most easily read the text in it. The nodes that are placed above or
below the parent node therefore occupy a larger angle than those that are placed at the left
or right side of the parent node. Hence the angular assignment rule for child nodes in the
radial drawing algorithm must be modified.
The definition of the distance between two related nodes should also be modified. It
should consider the width and height of the node and the slope of the arc between the two
related nodes. For example, when child nodes are placed on the left side or right side of
their parent node, longer segments of the line between the parent and child centers fall
within the child and parent body than those child nodes are placed under or above the
parent nodes. This solution can be also used while dealing with the distance between two
rooted trees. Every rooted tree can be treated as a “big” node that includes all the
offspring of the rooted tree. The distance between two rooted trees should consider the
size of the rooted tree and the slope of the arc between the two rooted trees.
3.2.2.3 Basic Idea of the Radial Angle Model
In order to satisfy the requirements of TkSee Visualizer, we modified the radial layout
algorithm and called it the radial angle model. The following is the basic idea of the
radial angle model:
(1) The definition of distance should consider the facts of node size and the slope of
the arc.
(2) The concept of the layer is discarded. The length between a parent node and its
unexpanded child node is fixed and so is the length between a parent node and an
expanded child node. The later one is longer than the former one.

32
(3) When a node is clicked, the slope of the link between the node and its parent node
will not be changed. This setup maintains orthogonal ordering stability during the
exploration.
(4) The angle between neighboring child nodes should be the same to avoid
overlapping.
(5) The modeling unit is composed of an expanded node, the parent nodes of the
expanded node and child nodes of the expanded node.
(6) The radial angle model uses heuristics
3.3 Detailed Discussion of the Layout Algorithms of TkSee Visualizer
In this section, we explain in detail the modeling within a rooted tree and the modeling
among rooted trees. At the end, we give a process diagram 3-8 to outline the whole
modeling process.
3.3.1 The Radial Angle Model
In this section, we explain the radial angle model in depth. We start by introducing key
concepts of the model. Then we explain each aspect of the model.
3.3.1.1 Key Concepts of the Radial Angle Model
Before explaining the radial angle model in detail, we give the definitions of some
concepts we will use.
Clicked node: the focus node
Expanded node and unexpanded node: An expanded node is the kind of node that was
clicked to open. It has child nodes. An unexpanded node is the kind of node that has

33
never been clicked or was clicked to close. It does not have child nodes. On Fig 3-1,
_node_0 and _node_4 are expanded nodes. The other nodes are unexpanded nodes
Parent node and child node: The clicked node is the parent node of the result nodes. The
results are child nodes of the clicked node. On Fig 3-1, _node_4 is the parent node of
_node_8, _node_6 and _node_7; _node_8, _node_6 and _node_7 are child nodes of
_node_4.
Child node angle: We define the child node angle as the maximum angle among the lines
that are drawn from each of the child node's edges to the center of the parent node of the
child node. On Fig 3-1, A4 is the child node angle of _node_2
If a child node is an expanded node, the child node angle is the maximum angle among
all the lines pointing from each edge of every child node to the center of the parent node
of the expanded node. On Fig 3-1, A5 is the child node angle of the expanded node
_node_4.
Child left angle and child right angle: We define the child left angle as the angle between
the slope of the child node and the left line of the child node angle. Similarly, the child
right angle refers to the angle between the slope of the child node and the right line of the
child node angle. On Fig 3-1, A1 is the child left angle of _node_4 and A2 is the child
right angle of _node_4.
Distance of two nodes: we define the distance between two nodes as the segment of the
slope line that falls outside the two nodes. On Fig 3-1, D1 is the distance between
_node_0 and _node_5.
Neighbor gap angle: The neighbor gap angle is that from the left line of the right
neighbor node’s child node angle to the right line of the left neighbor node’s child node
angle. On Fig 3-1, A3 is the neighbor gap angle of _node_2.

34
Figure 3-1: The key concepts in radial angle model
3.3.1.2 Length between Two Nodes
In the radial drawing algorithm, there exist layers. They are concentric circles that refer to
the exploration depth from the root. In Visualizer, the nodes have sizes. More space is
needed. Layers have to be discarded from the radial angle layout. We use fixed link
length between parents and its child nodes to replace the layer.
We assign a fixed length between parent nodes and their unexpanded child nodes. We
name it as L1 (see Fig 3-1). We assign a longer fixed length between parent node and
their expanded child nodes. We name it as L2 (see Fig 3-1). This setup matches common
sense. We also use L2 as the spring length among rooted trees. It is the distance constant
C2 used in the logarithmic spring force formula (Formula 2-1).

35
The user can modify L1 according to their preferences during explorations.
3.3.1.3 The Angular Assignment of Child Nodes
In the radial drawing algorithm, the angular sector occupied by each node is proportional
to its number of children. However, since nodes have size, this rule does not work any
more in the radial angle model.
We generate a new rule to push child nodes away. For an expanded node, the angle
among its child node should be equal. If the angles are equal, the expanded node is in the
stable state. The parent node of the expanded node is a special child node. As we will
discuss later, it joins the modeling and follows the same angular assignment rule.
Figure 3-2: The angular assignment of child nodes
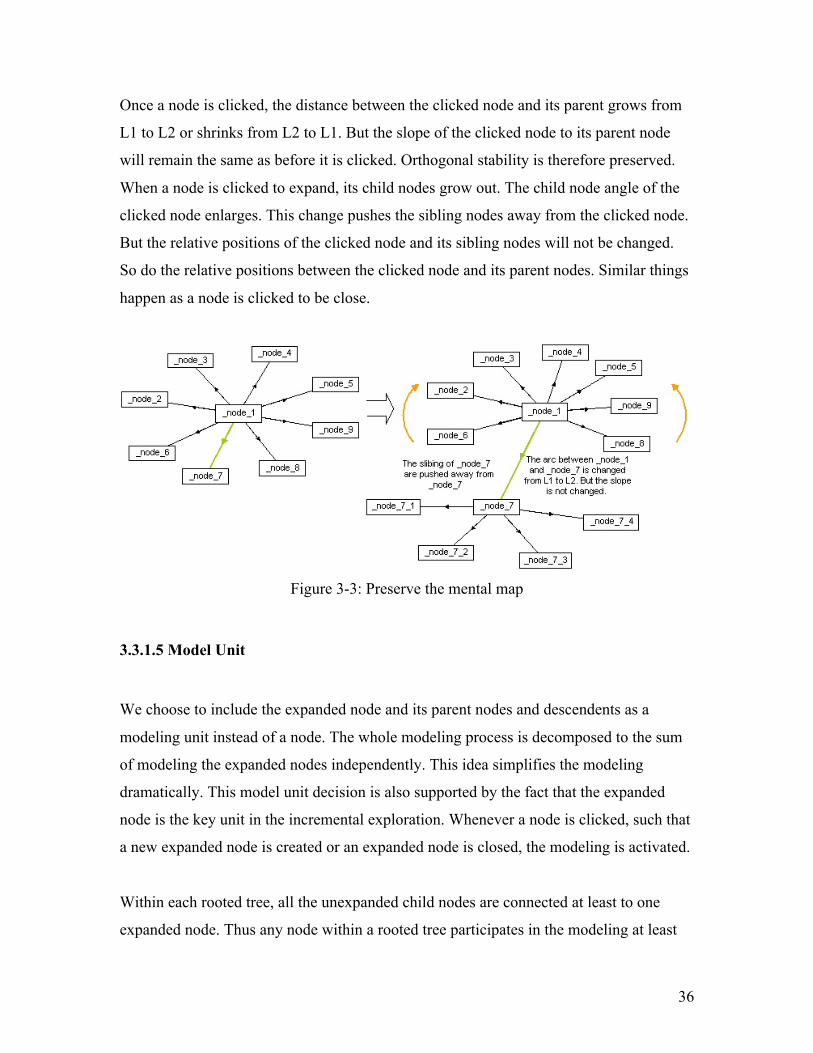
3.3.1.4 Preserve the User’s Mental Map
In the radial angle model, the user's mental map is preserved by keeping orthogonal
ordering between the clicked node and its parent during the exploration.
36
Once a node is clicked, the distance between the clicked node and its parent grows from
L1 to L2 or shrinks from L2 to L1. But the slope of the clicked node to its parent node
will remain the same as before it is clicked. Orthogonal stability is therefore preserved.
When a node is clicked to expand, its child nodes grow out. The child node angle of the
clicked node enlarges. This change pushes the sibling nodes away from the clicked node.
But the relative positions of the clicked node and its sibling nodes will not be changed.
So do the relative positions between the clicked node and its parent nodes. Similar things
happen as a node is clicked to be close.
Figure 3-3: Preserve the mental map
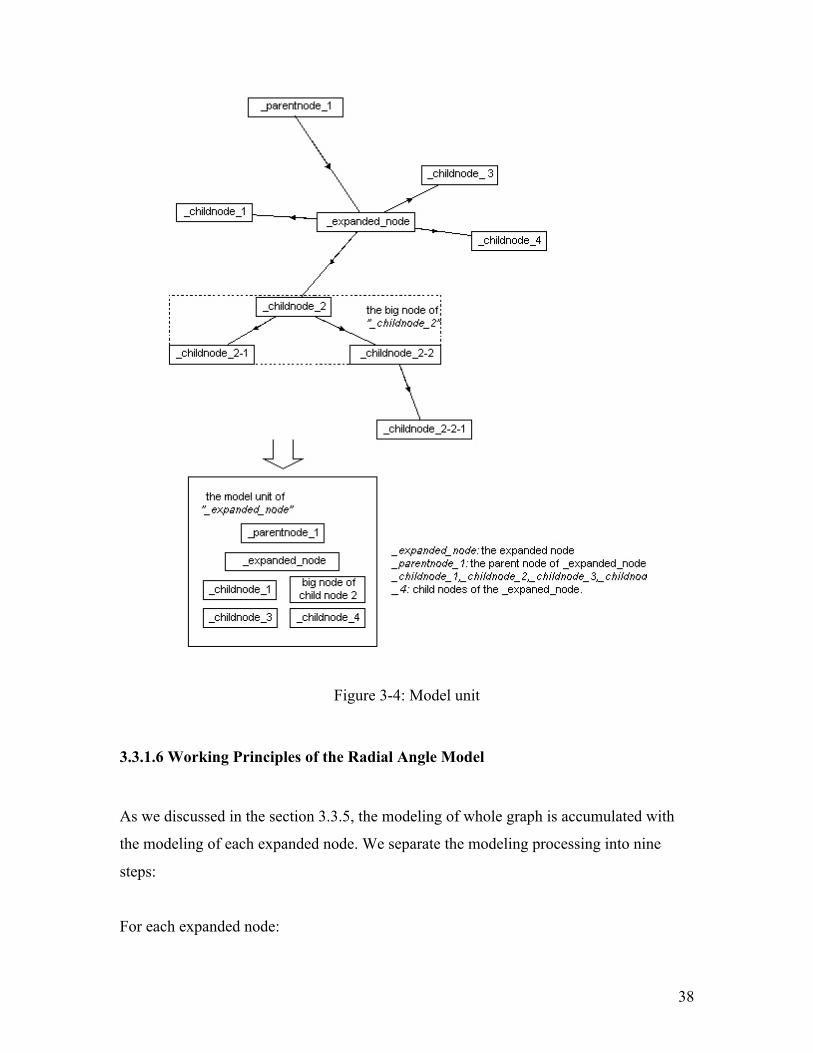
3.3.1.5 Model Unit
We choose to include the expanded node and its parent nodes and descendents as a
modeling unit instead of a node. The whole modeling process is decomposed to the sum
of modeling the expanded nodes independently. This idea simplifies the modeling
dramatically. This model unit decision is also supported by the fact that the expanded
node is the key unit in the incremental exploration. Whenever a node is clicked, such that
a new expanded node is created or an expanded node is closed, the modeling is activated.
Within each rooted tree, all the unexpanded child nodes are connected at least to one
expanded node. Thus any node within a rooted tree participates in the modeling at least

37
once. Although each expanded node is modeled independently, since we also bring its
parent nodes and child nodes into the model unit, the change within one modeling unit
will affect the other expanded nodes eventually to give a reasonable layout finally.
When we create a modeling unit, if a child node of the expanded node is an expanded
node, we accept the child node as one “big node”. The “big node” includes the expanded
child node and all its descents. In order not to complicate the problem unnecessarily, we
stop tracing any expanded child nodes of the “big node”.
In order to keep orthogonal stability, the slope of parent nodes to the expanded node will
not be modified in the modeling. The function of parent nodes in the model unit is more
like references. We changed the position of the child nodes to achieve the stable state of
the model unit. The stable state of the model unit is the state when the parent nodes are in
these positions.
38
Figure 3-4: Model unit
3.3.1.6 Working Principles of the Radial Angle Model
As we discussed in the section 3.3.5, the modeling of whole graph is accumulated with
the modeling of each expanded node. We separate the modeling processing into nine
steps:
For each expanded node:

39
Step 1: Create the modeling unit
Before modeling, we create the modeling unit for an expanded node. The modeling unit
includes the expanded node, the parent nodes of the expanded node and the child nodes
of the expanded node obtained from all the involved exploration relations.
Within the modeling unit:
Step 2: Calculate the slope of each child node to the expanded node and the slope of each
parent node to the expanded node.
Step 3: Calculate the child node angle, the child left angle and child right angle of each
child node and parent node. As we said, an expanded child node is treated as one "big
node".
For each child node of the expanded node:
Step 4: According to the slope of a child node, one finds this child node's left neighbor
node and the right neighbor node.
Step 5: Compute the neighbor gap angle, the left sum angle and the right sum angle of a
child node.
Step 6: If the neighbor gap angle is larger than the child node angle, we move the node
between its left neighbor node and right neighbor node until it has equal angle with its
left neighbor node and its right neighbor node.

40
Figure 3-5: When the neighbor gap angle is larger than the child node angle
Step 7: If the neighbor gap angle is smaller than the child node angle, we move the child
to the point that splits the neighbor gap angle with the ratio of the child left angle and
child right angle.
Figure 3-6: When the neighbor gap angle is smaller than the child node angle

41
Step 8: Along the new slope of the child node, we move the child node to the place where
the distance between the child node and the expanded node is L1 (if the child node is an
unexpanded node) or L2 (if the child node is an expanded node). (See diagram 3-5, 3-6)
Step 9: Update the coordinate values of the nodes that join the modeling.
3.3.2 Modeling Rooted Trees
The modeling among rooted trees is different from the modeling among nodes within a
rooted tree. They are modeled using the spring model.
3.3.2.1 The Spring Model
We use the formula C1*log(d/C2) that we have discussed in 3.1.2, to calculate the spring
force between “connected” rooted trees. We set C1 to 1 and C2 to L2. We use another
formula we discussed in 3.1.2, C3/sqr(d), to calculate the force between “non-
connecting” rooted trees. We set C3 with 0.2*sqr(L2).
3.3.2.2 Initializing the Positions of Rooted trees
Since there is no relation among rooted trees, we have to set up virtual relations among
those roots to use the spring model. Once we get first nodes from the edit bar, we locate
those nodes on the cross points of a grid to assign them reasonable initial coordinate
values. We assume each root only has relations with its virtually connected root nodes.
For example, on Fig 3-4, “node5” has relations only with its connected neighbors
“node2”, “node4”, “node6” and “node8”. “_node_5” has no relation with its non-
connected neighbors “_node_1”, “_node_3”, “_node_7” and “_node_9”.

42
Figure 3-7: Root nodes are placed in the cross points of a grid.
We use the same length springs among the roots. As we discussed before, the length of
the spring is L2.
3.3.2.3 Adjusting the Root Positions with the Spring Model
For each rooted tree, we first calculate the distances between the rooted tree and all its
“connected” rooted trees. Again the distance we mention here is the distance segment that
is outside the bodies of two rooted trees. Based on these distances, we calculate the
spring force exerted on the rooted tree with formula 2-1.Then we calculate the distances
between the rooted tree and all its “non-connected” rooted trees. Basing on these
distances, we calculate the inverse square law force exerted on the rooted tree with
formula 2-2. After that we add the spring force and the inverse square law force together.
Then we move the rooted tree to its stable position where the forces it received are near
zero.
3.3.3 Modeling by Heuristics
In the radial drawing algorithm, the modeling is done by recursion. But in TkSee
Visualizer, nodes have size. It is too complicated to compute the layout using recursion.

43
We do the whole layout modeling in heuristics. Using heuristics allows us to deal with
difficult situations without exhaustive and intractable calculations. However perfect
results are not guaranteed.
We put all the operations in a huge loop. We also set up a maximum number of iterations
as the stop condition of the loop. Within the loop, we first use spring model to model the
layout among the rooted trees. We update the coordinate value of each rooted tree after
the modeling. If the rooted tree is an expanded rooted tree, we move the root node and its
descendants together so the layout within the rooted tree is kept after the rooted tree
modeling. Then we model every expanded node under every rooted tree with the radial
angle model. We update the coordinate value of each node after each expanded node
modeling. We repeat the operation until every node is in its stable position or we reach
the maximum number of iterations.
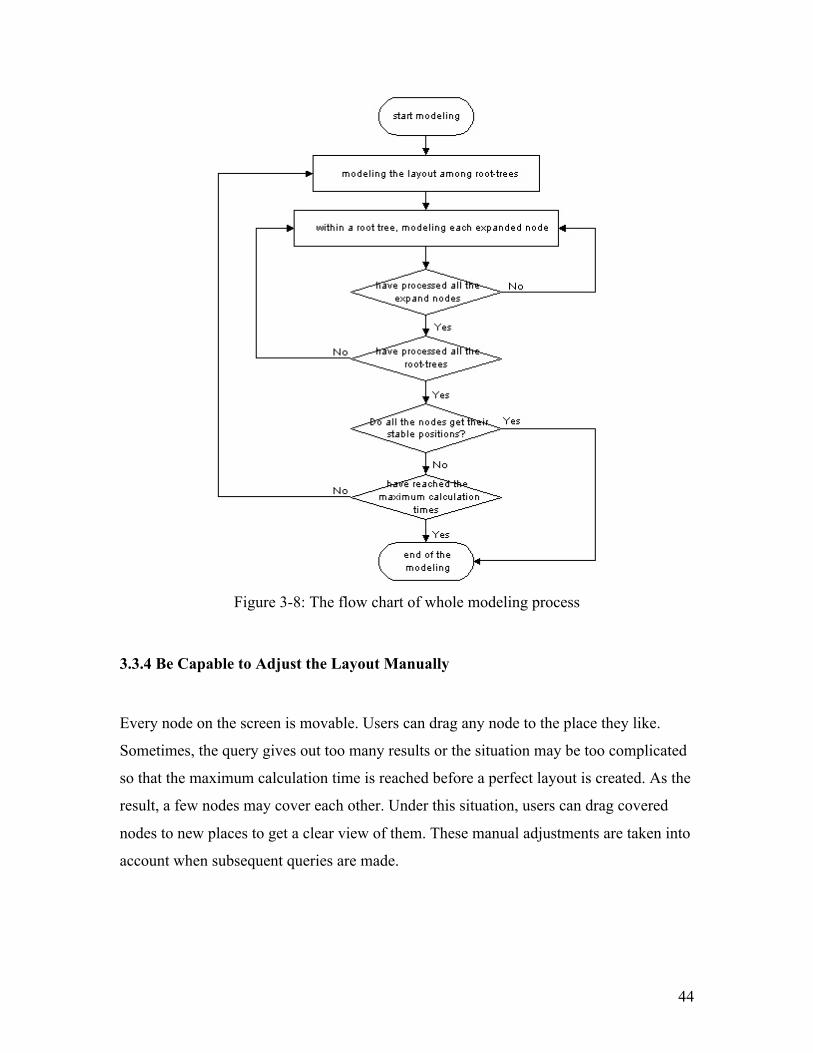
44
Figure 3-8: The flow chart of whole modeling process
3.3.4 Be Capable to Adjust the Layout Manually
Every node on the screen is movable. Users can drag any node to the place they like.
Sometimes, the query gives out too many results or the situation may be too complicated
so that the maximum calculation time is reached before a perfect layout is created. As the
result, a few nodes may cover each other. Under this situation, users can drag covered
nodes to new places to get a clear view of them. These manual adjustments are taken into
account when subsequent queries are made.

45
3.4 Layout Results Given by TkSee Visualizer
Figure 3-9: A layout within a rooted tree

46
Figure 3-10: A layout with multiple rooted trees
Figure 3-9 shows a layout of a rooted tree by TkSee Visualizer. From this figure, we can
see parent-child relationships are visualized clearly. Parents are surrounded by their
children. Four relationships are explored on the nodes on the diagram. Color red stands
for “define” while color blue stands for “refer”. The directions of the arcs refer the
directions of the relationships. Furthermore, there is no overlapping among the nodes.
Figure 3-10 shows a layout of multiple rooted trees. Three disjointed rooted trees are seen
in the diagram. The neighborhood is visualized properly by the spring model.
3.5 Summary
In this chapter, we address all the aspects of the layout algorithm of TkSee Visualizer.
After introducing various famous layout algorithms used in SV and studying the

47
requirements of TkSee Visualizer, we proposed the radial angle model to visualize
dependencies among nodes within a rooted tree. The radial angle model follows the rules
of incremental layout algorithms to preserve the user's mental map. We also use the
spring model to model the layout among rooted trees. In addition, we use modeling units
to accelerate the calculations. The resulting layout satisfies the requirements of TkSee
Visualizer.

48
Chapter Four: Animation
In this chapter, first we introduce the functionality of animation. Then we explain the key
aspects and basic rules of animation design. After that, we summarize the animation
techniques applied in the area of software visualization. Finally, we describe our
animation approaches performed in TkSee Visualizer.
4.1 Functionality of Animation:
According to Gary and Wagner, “Animation is the presentation of a series of images to
give the impression of motion. When the individual images, called frames, change
quickly enough, the human visual system integrates them into continuous motion.” [9].
Animation has been applied in user interface [17,26], data visualization [16,22,23],
algorithm animation [30] and software visualization [6,32] areas. It is used to emphasize
change, or to interpret a complex idea or relationship. Also it can help the user in tracking
objects. In addition, it is used to smooth the transitions as the user changes focus.
Furthermore, it brings a lot of fun to the users, making them more attracted to the
software.
4.2 Basic Rules of Animation design
Animation design includes three basic decision aspects: which parameters to animate,
how to control the variation of parameters through software, and how to assemble a series
of sequences into a complete animation. [8] Besides considering these basic aspects,
applying principles of cartoon animation in the animation design can make the animation
more alive and enjoyable.

49
4.2.1 Parameters to Animate
According to the type of parameters, we can choose to animate the data, visualization
techniques or the view.
In general, any set of data can be animated if their values can be reduced to single scalar
or vector values. Instead of being displayed as a static image, parameters relating to the
creation of the visualization itself can be animated to give more information about the
visualization. When the visualization is built in 3-D geometry, animating the view must
be considered. Animating the view refers to all motions of the observer and, motions of
the visualization objects within the field of view. [8]
4.2.2 Animation Control
Key frame animation control is the most wildly used animation control. This idea
originated from traditional hand-drawn animation. In traditional hand-drawn animation,
the animator produces key frames that are drawings used to control visual aspects of the
animation, such as object positions, lighting, and color. [12] Normally key frames are
spaced up to several seconds apart. The assistants of the animator produce in-betweens
(or tweens) that are drawings with the key frames to smooth the motion. [11]
Key frame computer animation control uses a similar approach. In computer animation,
key frames are states of visualization produced by setting a set of parameters on the
objects in time. Besides being used to control visual aspects of the animation, for
scientific animation, key frames are also used to control arbitrarily selected parameters of
the visualization. The in-betweens are interpolated by the computer automatically.

50
4.2.3 Animation Path
Animation path refers to the path that the animated parameters move between the two key
frames. Straight line is the straightforward choice. However using slight curves can
reinforce the reality of the movement of the objects. [24]
4.2.4 Animation Timing
Animation Timing is also called the interpolation method. It refers to the method that gets
the in-between points between two key frames. The good philosophy about animation
timing, especially in engineering domains, is to remain true to the data and meanwhile
make the motion as smooth as possible.
Linear interpolation and splines for interpolating are the most commonly used
interpolation methods. Linear interpolation is simple and works well in many cases, such
as Shrimp [32]. For more complex motions, especially in multiple dimensions, spline
curves do a better job, such as visualizations of the Gnutella network system [16].
4.2.5 Frame Rate
Frame rate is the rate at which images are presented. It is a key factor in animation. The
low threshold of frame rate is between 20 and 25 frames per second. Below this
threshold, many people will perceive flicker [9].
The higher the frame rate, the smoother the animation will appear. But a high frame rate
requires more work to produce the animation. One must resolve this tradeoff to choose
the right frame rate.

51
4.2.6 Psychological Factors
Some psychological factors should be considered during the design. Animation should be
just the right length, neither too short nor too long. If it is too short, the meaning of the
animation may not be explained clearly and it may confuse the user. If it is too long,
users will lose patience waiting for it. Another issue is avoiding "information overload".
If too many parameters are varied in animation at once, it becomes difficult to interpret
the results visually. Therefore, one should provide simple animations to present the point.
[10]
4.2.7 Applying Principles of Cartoon Animation
In the cartoon industry, animators have developed sets of principles and techniques that
strengthen the illusion of reality. Some of the rules, such as solidity, exaggeration, and
reinforcement [24], can be applied in computer animation. So far most computer
animations are performed straightforwardly. Few use cartoon-style techniques that make
the system more alive and enjoyable.
Bay-Wei Chang et al implemented some cartoon principles in their user interface tool
Self [17]. In Self, menus transform smoothly from a button to an open menu. Objects
enter the screen by traveling from off-screen or growing from a point. Before objects
move, they take a small, quick contrary movement. Objects move with slow in and slow
out. They do not come to a sudden standstill, but vibrate at end of the motion to get to
their destination; Self achieved a great success by performing these rules.
Ka-Ping Yee et al prompted slow-in slow-out animation timing approach in their
Gnutella network [16]. They start the animation slowly, accelerate it smoothly, and then
decelerate it at the end. It is implemented by a segment of the arctangent function.

52
4.3 Animation Techniques Used in the Visualization of Software
The most widely used animation technique in software visualization is camera animation.
In some dynamic exploring systems, layout animation, sometimes combining with
grow/shrink animation, is used to smooth the layout transition. However, a few problems
exist in the usage of animation in the visualization of software.
4.3.1 Camera Animation
In 3-D geometry, camera animation moves the new focus to go to the front. For example,
in Cone Tree [23], when a node is selected, the Cone Tree rotates so that the node and its
ancestors up to the top are brought to the front. In Perspective Wall [22], when user
selects a note on a sidewall, the wall moves. The sidewall with the selected note is moved
to the center of the view.
In 2D, camera animation pushes the new focus node to the center of the window,
ensuring users never lose track on the last focus node, such as In SHRIMP [32].
4.3.2 Layout Animation
In a dynamic exploring system, when new nodes appear on the screen or nodes drop from
the screen, the layout algorithm is performed to adjust the position of other nodes in the
screen to give a new balance layout. Layout animation is used to smooth the position
adjustments, such as in tuk-tuk [6].

53
4.3.3 Shrinking/Growing Animation
The principles of cartoon animation are applied in some systems. A node will not appear
or vanish suddenly from the screen. When nodes are added to the screen, the added nodes
are animated to grow up from a point to their full size. When nodes are deleted from the
screen, the deleted nodes are animated to shrink from their full size to nothing.
4.3.4 Problems in the Animation Usage
Camera animation has a drawback under some circumstances (explained later). Besides
the layout animation and camera animation, animation can also be used in some other
ways, such as clarify information.
4.3.4.1 The Disadvantage of Camera Animation
In a 2D dynamic exploring system, if the new focus node is a leaf node and was near an
edge of the window before it is clicked, the camera animation will push it all the way to
the center of the window. Such a big movement will cause ineffective usage of the screen
space. Some part of the screen is empty while some nodes that the user may be also
interested in are pushed outside of the window unnecessary.
Some systems add a function that user can choose to turn on or turn off the camera
animation. But this cannot really solve the problem. In some dynamic exploring systems,
layout animation is also implemented. Layout animation responds to every click
operation of the user. The user will not lose track of the objects if camera animation is
turned off. However when the clicked node is near the edges of the window, the
exploration results may be invisible within the screen. The user has to drag the diagram to
have a complete view of the new focus node and its descendants. This is definitely not
what the user wants. We need more intelligent camera animation.
54
Such camera animation has the following requirements:
(1) The camera animation can turn on or turn off automatically. It turns on when the
exploration results are invisible after the layout modeling. It turns off when the
exploration results are visible after the layout modeling.
(2) If camera animation is activated, the optimum stop position should be the place
where it makes as many nodes as possible to be visible within the window.
We propose a new approach of camera animation and call it intelligent camera animation.
This gets rid of the disadvantage of camera animation and satisfies the requirements we
listed above. We will discuss it in detail in section 4.4.3.
4.3.4.2 Other Usage of Animation
Despite aiding the user not to lose track of action, and smoothing transitions, animation
should also be used to elucidate the exploration information. We will explain how we
achieved this in the next section.
4.4 Animation Techniques Implemented in TkSee Visualizer
We implemented layout animation and intelligent camera animation in the Visualizer.
Besides this, we designed updating animation to illustrate the work of extra result box.
Also we designed zero-result animation and result-already-exist animation to clarify
some special query results. Furthermore, we proposed a new cartoon style animation
timing, slow-in fast-out, to exaggerate the changes caused by each click.

55
4.4.1 Animation Design
In this section, we first describe our setup for each aspect in the animation design. Then
we explain the slow-in fast-out animation timing in detail.
4.4.1.1 General Setup
We chose the position of the nodes as the parameter to animate. We used key frame
animation control to manipulate animation. The two key frames are the state of nodes
before the modeling and the state of the nodes after the modeling. In layout animation,
intelligent animation, zero-result animation and result-already-exist animation, we use the
straight line as the animation path. While in updating animation, we used curves as the
animation path. We proposed a slow-in fast-out animation timing to interpolate the
animation path to get the frames between the two key frames. We will discuss it in the
next section. We chose to display 25 frames a second so the system will not have too
much load while the picture will not flick.
4.4.1.2 Slow-in Fast-out Animation Timing
Instead of using the traditional cartoon slow-in slow-out animation timing model, we
propose a new model and call it slow-in fast-out. We want to give a strong impression to
the user by exaggerating the reality.
At the beginning, we move the nodes slowly. Then move them quicker and quicker. The
length of the moving step therefore gets longer and longer. This model is implemented by
the function of the sum of arithmetic progression [15]. We can view it from Figure 5-1.
An arithmetic progression (AP) is a sequence of terms in which any term minus its
previous one gives a constant. This constant is called the common difference.

56
Let a be the first term, d be the common difference of an AP and n be the index of the
moving step, the nth term of the AP is:
Tn = a + (n - 1)d
We contribute Sn as the length of the nth moving step. The sum of the first n terms is:
Sn = _ n [2a + (n - 1)d]
The difference of any adjacent moving steps is:
Sn – Sn-1 = Tn = a + (n - 1)d (n>=1)
The difference grows by d when n goes up by 1.
In the TkSee Visualizer, we assign a = 0 and d = 2. It works perfectly.
Slow-in Fast-out Animation Timing
0%
10%
20%
30%
40%
50%
60%
70%
80%
90%
100%
1 6 11 16 21
moving steps
anim
atio
n p
rog
ress
Figure 4-1: The slow-in fast-out animation timing model

57
4.4.2 Layout Animation and Grow/Shrink Animation
In TkSee Visualizer, Layout Animation and grow/shrink animation combine together.
When a node is clicked to expand, its child nodes are added around the clicked node.
When a node is clicked to close, its child nodes are dropped from the screen. Under any
case, the layout algorithm is activated to give a new layout. Layout animation is therefore
performed.
When a node is clicked to expand, its new child nodes, given by the current exploration
relationship, are created as a point and covered by the clicked node. Then they move to
their destinations given by the modeling while the sizes of child nodes grow up to their
normal sizes. This metaphor is to push the new added child nodes as they grow from the
clicked node.
Since the child nodes grow up from their parent node, when the parent node is clicked to
close, it is better to drop the child nodes back to the parent node. When the animation
starts, the child nodes move toward the parent node while their sizes shrink. Then the
shrunk child nodes disappear under the clicked node. They are deleted when the layout
animation ends. The animation makes it appear that the dropped child nodes are absorbed
by the parent node.

58
(1)
(2)

59
(3)
Figure 4-2: Layout animation (1) Node find_plane_activity is clicked to expand (2) Thechild nodes of find_plane_activity are growing from find_plane_activity (3) Thechild nodes stop moving as they reach their destinations
4.4.3 Intelligent Camera Animation
Camera animation is also implemented in the TkSee Visualizer. However it is modified.
We call it intelligent camera animation. In our approach, it is activated only when the
clicked node and its child nodes are outside of the window. When it is activated, instead
of pushing the new focus node to the center of the window, we push the nodes toward a
place where all the hiding nodes are seen totally.

60
(1)

61
(2)
Figure 4-4: Intelligent camera animation (1) Node system_typ is clicked to expand (2)Intelligent camera animation is performed
4.4.4 Zero-result Animation
Other than smoothing the transition and tracing the exploration, animation can also be
used to illustrate special results when the layout animation is not applicable. This setup is
more understandable and enjoyable than text.
When the user clicks on a node to do an exploration, if there is no result given from the
query, zero-result animation is conducted to advise the user of the situation.
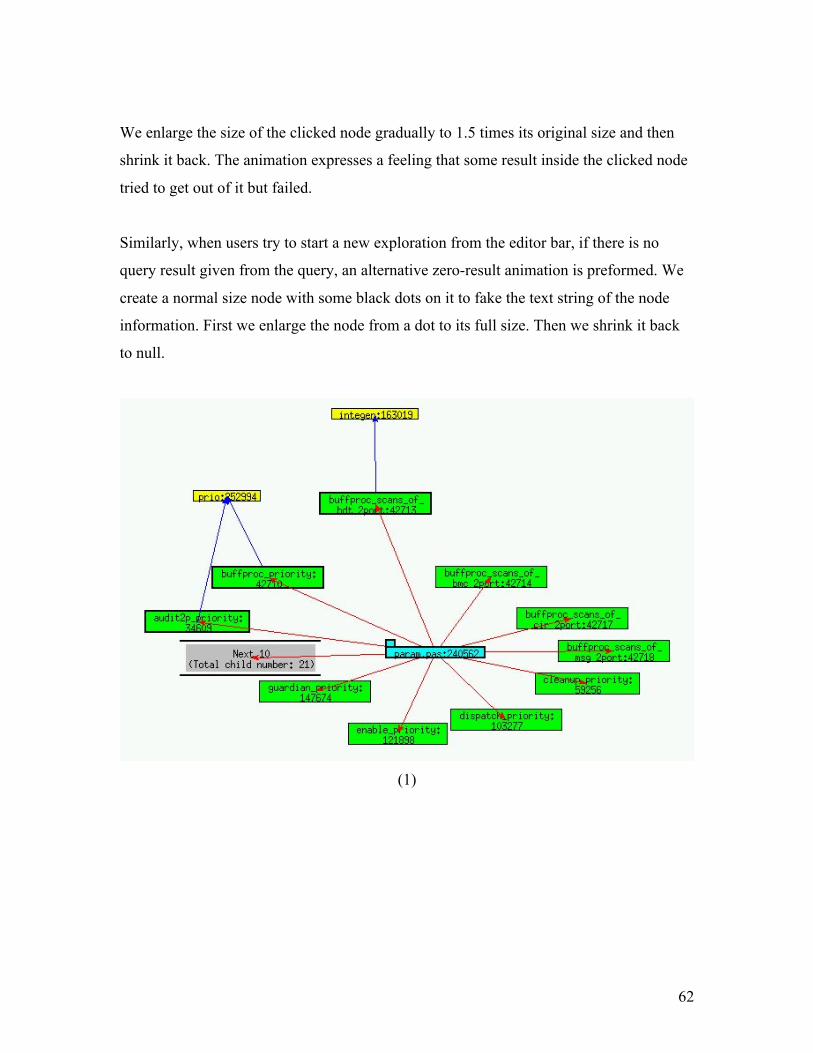
62
We enlarge the size of the clicked node gradually to 1.5 times its original size and then
shrink it back. The animation expresses a feeling that some result inside the clicked node
tried to get out of it but failed.
Similarly, when users try to start a new exploration from the editor bar, if there is no
query result given from the query, an alternative zero-result animation is preformed. We
create a normal size node with some black dots on it to fake the text string of the node
information. First we enlarge the node from a dot to its full size. Then we shrink it back
to null.
(1)

63
(2)
Figure 4-5: Zero-result animation (1) User does an exploration on node prio but there isno query result (2) The node prio grows up
4.4.5 Result-already-exist Animation
Under some situation, the query results may have already existed on the screen before
users conduct a query. For example, in Fig 4-6, user does an exploration on node A with
“what nodes defined by node A”. Node B is defined by node A. Then user does
exploration on node B with “which node defines B”. Node A defines B. But at the
moment, node A already exists on the screen and connects with node B in that
relationship. When this happens, we perform the result-already-exist animation.
First we push the query results that already exist on the screen away from the clicked
node along the link between the clicked node and the existing query results. Then we
drag them back to where they are. The animation tells the user the pushed-dragged nodes
are the query results and that they have already existed on the screen.

64
(1)

65
(2)
Figure 4-6: Result-already-exist animation (1) User does an exploration on nodedcd_absent_str but the result has already existed on the screen (2) The node chopinis pushed away
4.4.6 Updating Animation
We animate the updating process of extra result box and call it updating animation.
4.4.6.1 Animation Path
Since we pretend that besides the results shown on the screen the remaining query results
are hidden in the box, it is more understandable if we move the displaying nodes into the

66
box and move the new nodes come out from the other side of the box to their expected
places.
Furthermore, in TkSee Visualizer, child nodes surround their parents. It would be more
natural if we move the nodes around the parent node into or out of the extra result box on
an ellipse track rather than in a straight line.
4.4.6.2 Clearing Sub-Process and Displaying Sub-Process
In order not to confuse the user with too much information at a time, we update the query
results after we clear the current child nodes. We name these two sub-processes as
clearing process and displaying process.
Each sub-process has two key frames. The start position of the node in the clearing
process is the node’s coordination position when user clicks the box. Its final position is
the current position of the special box. For the displaying sub-process, the start position
of the new node is the position of the special box and its final position is the current
position of the replaced node.
4.4.6.3 Working Steps of Updating Animation
Clearing sub-process and displaying sub-process use the same methodology.
For each child node, first we calculate the slopes of the child node at its start position and
end position of the sub-process and note them as start_ slope and end_ slope. Then we
interpolate the difference of start_ slope and end_ slope with slow-in and fast-out
animation timing. Once we get each interpolation point, we adjust the position by the
layout algorithm. By knowing these positions of all the child nodes of the sub-process,
we can produce the animation of the sub-process.

67
(1)
(2)
(3)
(4)

68
(5)
Figure 4-7: updating animation (1) User clicks on the extra result box (2)(3) The clearing
sub-process (4)(5) The displaying sub-process
4.4.7 Root Updating Animation
As we discussed in section 4.6, when the number of the root query results is more than a
certain number, a special box, called extra root box, is created. Only certain numbers of
roots are displayed on the screen while the remaining roots are hidden inside the box. The
current query results are updated by the new query results from the extra root box if user
clicks the box. A special animation is designed to illustrate the root refreshing procedure.
We call it root updating animation.
Since there is no association among rooted trees, when the user clicks on the extra root
box to view the rest of the query result, the old root results move to the box in straight-
lines. They move from the box to their destinations in straight lines.
Like the updating animation, in order not to confuse the users with information overload,
we fulfill the root updating animation in two steps: do the clearing sub-process first and
then do displaying sub-process.

69
4.5 Summary
To summarize, animation is a very useful technique in the visualization of software. It not
only can be used to smooth transitions and aid the user not to lose the track of objects, but
also can be used to illuminate information. In TkSee Visualizer, we implemented several
animation techniques. In particular, we proposed the intelligent camera animation to
overcome the drawback of camera animation in ineffective use of space. Furthermore, we
proposed a new animation timing model slow-in fast-out.

70
Chapter Five: The Architecture of TkSee Visualizer
In this chapter, we address the implementation of TkSee Visualizer. First we overview
the work principle of the tool. Then we summarize the process flow of the program.
Finally, we introduce the interface of the tool.
5.1 TkSee Visualizer
We want to design a software visualization tool to help users to understand huge software
systems, such as legacy systems. TkSee Visualizer is the result. In this tool, we will
implement the techniques we have discussed earlier in this thesis: dynamic browsing, our
incremental layout algorithm and various animations. We will then use the tool to
evaluate the effectives of those techniques.
The database TkSee Visualizer connects with contains millions of software entities and
the dependencies among them. These data are parsed from legacy systems of Mitel (
www.mitel.com ) using reverse engineering techniques. TkSee, a source browser,
supplies the interface through which the Visualizer can communicate with the database.
Fig 5-1 illustrates the relation of TkSee’s database and TkSee Visualizer. This connection
TkSee is dynamic: Once TkSee Visualizer gets the query parameters from the interface, it
performs the query on the TkSee database and computes the results. Then, it models the
layout with the layout algorithm and then visualizes the layout on the screen.

71
Figure 5-1: TkSee Visualizer
5.2 Process Flow of TkSee Visualizer
TkSee Visualizer can be separated into two parts: user interface and core processor. The
interface of TkSee Visualizer is coded in Tcl/Tk. In this part, it gets commands from the
users, send the commands to the core processor and displays/updates the graph as
returned by the core processor (See Figure 5-2). The core processor is written in C++. It
is in charge of communicating with the database, modeling the layout and managing the
data of the query results (See Figure 5-3).

72
Figure 5-2: The flowchart of the Tcl/Tk component

73
Figure 5-3: The flow chart of the C++ core program
5.3 User Interface of TkSee Visualizer
TkSee Visualizer supplies five toolboxes to help users to control the exploring process.

74
5.3.1 Symbol Indicator
TkSee can explore four software relationships among four software entities. TkSee
Visualizer uses various colors and different arrow directions to identify them. The
symbol indicator toolbox illustrates the meaning of each color and arrow direction.
Figure 5-5: The symbol indicator
5.3.2 Start Exploration Toolbox
The exploration toolbox can help users start new exploration. After users give the pattern
for the node names and choose the type of the nodes they want to start with, users can left
click the Start Exploration button to display the first nodes of the exploration on the
screen
Figure 5-6: The start exploration toolbox

75
5.3.3 Explore Toolbox
With the help of the exploration toolbox, users can create the exploration query. Once
users find the node they are interested in, users choose the relationship type they want to
explore through the “Exploration Relations” radio button; they define the entity type of
the exploration results through “Result Entity Type” radio button, and they input a pattern
for the names of exploration results in the “Result Node Name” editor bar. Then they left
click on the node they are interested. TkSee Visualizer will visualize the query results
based on their choices.
Figure 5-7: The explore toolbox
5.3.4 Preferences Toolbox
Some system parameters can be changed during explorations based on the user’s
preferences. They are listed in the Preference toolbox:
Link length: the length between two nodes

76
Child num: the maximum number of displayed children of parent nodes
Expanded num: the maximum number of expanded nodes on the screen at one moment
Root num: the maximum displayed number of rooted trees on the screen at one moment
Figure 5-8: The preference toolbox
5. 3.5 Animation Setup Toolbox
In the animation setup toolbox, users can choose the animation timing type, camera
animation type and turn on/off Zero-Result animation and Result-All-Exist animation.
Timing: Animation timing. There are three choices. Type 1: objects move at a constant
speed; type 2: objects move faster and faster to their destinations; type3: similar to type2
but at a higher speed.
Camera: Camera animation. There are two choices. Type 1: after each click, the focus
node moves to the center of the screen; type 2: the focus node moves only when the focus
node and its new child nodes are outside of the screen after clicking. It moves toward to
the center of the screen but stops moving when the expanded node and its child nodes can
be seen within the window.
Zero: Zero-result animation. It used to clarify that no result is given from an exploration.
(Y-turn on; N-turn off)
Exist: Result-All-Exist animation. It is used to clarify that the results of an exploration
have already existed on the screen. (Y-turn on; N-turn off)

77
Figure 5-9: The animation toolbox
5.3.6 Color Design
Six colors have to be chosen to represent four software entity types and two association
relationships. According to Ben Shneiderman’s opinion [34], it is always good to use
black letters on a white background and reserve color for special highlighting. Therefore
we choose white as the background color of the tool and all texts are written in black.
Heterogeneous object nodes and relation aces may cover each other on the screen from
time to time. Colors must be picked up carefully so that blurring and vibrations will not
happen when colors meet colors. [49] did a lot of experiments on the color combination.
We use those experiment results as references for the color design in the tool.
[49] ‘s experiment shows color red, blue and black can be seen clearly under white
background. Therefore we pick color red and blue to present the two association aces.
Besides, we draw a black rectangle surrounding every node on the screen. This setup
makes users always have clear views on the nodes and aces.
Within each node, the node is filled with a color to identify the node’s object type and
above it the object name is written in black. Colors have to be chosen carefully to
represent different object types on which the black text and red or blue aces can be seen
clearly. [49]’s study shows when color green, yellow and cyan are used as background of
the node, black, red and blue line can be viewed clearly on each of them. Therefore
green, yellow and cyan are picked to represent software entities. Besides these three

78
colors, color pink is picked to represent the left software entity that is tested to satisfy the
clearness.
5.3.7 Other Interface Techniques
Panning and dragging are also supported in TkSee Visualizer. Users can drag the
background around to view the whole diagram. Also users can drag any node to have a
clear view on it.

79
Chapter Six: Evaluation Experiments
We designed a series of experiments to access the performance of the techniques
implemented in the Visualizer. In this chapter, we first describe each aspect of the
experiment. Then we analyze the results of the experiment. Finally, we summarize the
conclusions.
6.1 Methodology
We performed the evaluation using human evaluators. We followed general principles of
usability testing, including writing instructions for the users, designing the test tasks and
questionnaire, and then conduct the study. Our study received ethics approval from the
University of Ottawa’s Research Ethics Board.
6.1.1 Test Users
In order to attain enough reliability in our results, according to [46] five test users is must.
A good test user candidate should be a potential user of the tool. We believe that anyone
whose work involves any step of the life cycle of software development is a good test
user candidate. We organized two groups of users, experts and novices, to evaluate the
tool. The distinction of groups is based on the knowledge level of software visualization.
Six participants were chosen to attend the testing. All of them are from the computer
science department, University of Ottawa. Some of them are master students, some are
Ph.D students, and some of them are research associates in the school. All of them have
solid knowledge and working experience in software development and maintenance.
Among the six participants, one was doing related research in the software visualization
field. He had never used TkSee Visualizer before. One had 3-4 years experience with
TkSee, but he had used TkSee Visualizer and some other software visualization tools

80
before. We considered these two test users as experts. The other four have a little
knowledge or no knowledge about software visualization. We treated them as novices.
6.1.2 Experiment Preparation
Before the test, we designed a set of instructions for the experiment, a series of test tasks,
and a questionnaire. The instructions and test tasks assist the users to understand the tool
in a short time. The questionnaire enables the users to supply us with their opinions about
the tool.
6.1.2.1 Instructions
In the instructions (See appendix A), we gave users an overview of the tool. First we
explained the concept of the software visualization and described the main techniques
implemented in the tool. Then we highlighted the purpose of the experiment. At the end
of the instructions, we introduced the user interface of the tool. Then we gave a brief
tutorial on the tool so users would know how to start exploration and how to explore.
6.1.2.2 Test Task
We helped users to understand the system by fulfilling the tasks (See appendix B). Three
tasks were designed. They cover most of the features of the tool.
The first task contains four small tasks. Each one highlights a few important features of
the research. The first small task assesses the effect of extra result box and pattern based
searching. The next small task evaluates the deletion policy, zero-result animation and
result-already-exist animation. The following small task asks users to explore a file in
multiple steps to observe the difference between standard camera animation and
intelligent camera animation. The last small task enables the user to feel the advantage of

81
software visualization. While exploring the tasks, users can judge the dynamic browsing
technique and layout algorithm.
The second task asks users to do some exploring of their own with various preferences
set and make their decision on the animation timing type, camera animation type, zero-
result animation, and result-already-exist animation.
The third task asks users to change the parameter values on the TkSee Visualizer and do
experiments to decide the default values of system parameters, such as the link length
between two nodes, etc.
6.1.2.3 Questionnaire
We designed 20 questions for the questionnaire (See section 6.2) that cover all the
important techniques implemented in the tool. All questions have been confronted in the
tasks, so users should not have difficulty to answer them.
We gave five choices for each question, so users would express their feelings more
precisely. We avoided using specific concepts of software visualization in the questions
and choices, so novices would not be confused by the questions even they lacked
knowledge. Also we avoided using “intelligent”, ”advanced”, etc words in the choices to
expose the researcher’s desire, so the user’s decision would not be affected by choice
itself.
6.1.3 Experiment Process
Each time, the test was done by one person. So it is easy for us to capture the test user’s
reaction to the tool.

82
Before we started the test, we asked test users to read and sign a consent form (Appendix
C). Then we asked them to read the instructions to get the overview of the tool and the
experiment. After test users finished the material, we presented a demonstration about
using the tool to explore a software system. During the demo, we highlighted the key
issues of the tool. After that, we emphasized the purpose of the test to the users again to
alleviate any anxiety they may have. We told them the test did not test their ability to use
the tool; instead it assessed the performance of the tool. Also, the evaluation was more
feature-oriented than usability-oriented.
Then we started the test. During the test, I encouraged them to speak their thoughts out
loud and feel free to ask me questions. Each test lasted one hour.
After the test, I asked the participants to complete the questionnaire.
6.2 Analysis of Experiment Results
In this section, we categorize the questions in the questionnaire by features. For each
question, first we gather the test users’ choices together. Then we give our conclusion
based on these data. At the end, we summarize our conclusions by features.
6.2.1 Browsing Techniques
In this section, we focus on the evaluation of the browsing techniques employed in the
TkSee Visualizer.
6.2.1.1 Dynamic Browsing
Question: Do you think the dynamic browsing technique implemented in the Visualizer
can help you explore huge software systems?

83
Choices Novice
(4 users)
Experts
(2 users)
All Users
(6 users)
Not useful at all
A little useful
Moderately useful
Very useful ÷÷÷÷ ÷÷ ÷÷÷÷÷÷
Exactly what I want
Conclusion:
All users thought the dynamic browsing technique implemented in the Visualizer are very
useful and can help them to explore huge software systems.
6.2.1.2 Extra Result Box
Question 1: Do you think the extra result box is needed?
Choices Novices
(4 users)
Experts
(2 users)
All Users
(6 users)
No need at all
A little needed
Moderately needed ÷ ÷ ÷÷
Very needed ÷÷ ÷ ÷÷÷
Exactly needed ÷ ÷
Conclusion:
One third of the participants thought the extra result box is moderately needed. They do
not mind having the feature or not in the software. The rest of the users thought the extra

84
result box is very needed or extremely needed. Therefore the extra result box is liked by
most people. Users accepted the idea of the extra result box. Novices liked the idea more
than the experts.
Question 2: Are you confused by the way the extra result box works?
Choices Novices
(4 users)
Experts
(2 users)
All Users
(6 users)
Not confused at all ÷÷÷ ÷ ÷÷÷÷
A little confused ÷ ÷ ÷÷
Moderately confused
Very confused
Always confused
Conclusion:
Most users were not confused by the way the result box works. The idea of the extra
result box is straightforward. Both experts and novices understand it.
6.2.1.3 Extra Result Box and Pattern based searching
Question: Do you think the extra result box plus pattern based searching can help you
handle the huge exploring results?

85
Choices Novice
(4 users)
Experts
(2 users)
All Users
(6 users)
Not useful at all
A little useful
Moderately useful ÷ ÷÷ ÷÷÷
Very useful ÷÷÷ ÷÷÷
Exactly what I want
Conclusion:
Half of the users thought the extra result box plus pattern based searching is moderately
useful to handle the exploration of huge numbers of results, while the other half thought
the mechanism is very useful. From the answers, we know that users thought the extra
result box and pattern based searching are a good idea, but improvements are needed.
Some usability problems might affect the evaluation of the feature. Two users
complained that the name pattern should be reset after each exploration.
6.2.1.4 Deletion Policy
Question: Do you think the deletion policy is needed?
Choices Novices
(4 users)
Experts
(2 users)
All Users
(6 users)
No need at all
A little needed
Moderately needed ÷÷ ÷÷
Very needed ÷ ÷ ÷÷
Exactly what I want ÷ ÷ ÷÷

86
Conclusion:
One third of the users did not mind having the deletion policy or not. Two thirds of the
participants preferred to have the feature in the tool. Since more people like it, the
deletion policy should be implemented in the tool.
Experts like the feature more than the novices. Some novices were confused when they
first saw some expanded nodes shrinking automatically. It appears they would like the
policy when they get used of it.
6.2.1.5 Summary
All test users thought dynamic browsing can help them to explore huge software systems.
Both experts and novices accept the idea of the extra result box. The extra result box and
pattern based searching together can help them to deal with huge query results. But the
feature needs to be fine tuned. The deletion policy is very much needed.
6.2.2 Layout Algorithms
In this section, we focus on the evaluation of each aspect of the layout algorithm
employed in the TkSee Visualizer.
6.2.2.1 Preserving User’s Mental Map
Question: When you click on a node to do exploration, are you confused about the
changes in the graph?

87
Choices Novices
(4 users)
Expert
(2 users)
All Users
(6 users)
Not confused at all ÷÷ ÷÷ ÷÷÷÷
A little confused ÷ ÷
Moderately confused ÷ ÷
Very confused
Always confused
Conclusion:
Four users said they were not confused at all about the changes in the graph when they
clicked on a node to do exploration. One user felt a little confused by the changes, and
one user felt moderately confused. In general, most of the users reported they were
satisfied by the stability of the layout as continuous updates take place.
6.2.2.2 The Capability of Giving Non-Overlapped Layout
Question: Can the layout algorithm effectively provide non-overlapped layout?
Choices Novices
(4 users)
Experts
(2 users)
All Users
(6 users)
Not at all ÷ ÷
A little
Sometimes ÷ ÷
Almost ÷ ÷÷ ÷÷÷
Always ÷ ÷
Conclusion:

88
Six users gave four different opinions on this question. There are two extreme answers.
One user regarded that the layout algorithm implemented in the system cannot effectively
provide non-overlapped layout at all. And one user regarded that the layout algorithm can
always provide non-overlapped layout. Among the rest of the answers, three users
thought the system could almost give non-overlapped layout while one user thought the
system could give non-overlapped layout sometimes.
We neglected those two extreme answers to simplify the decision making process. Since
most users of the remaining users chose the choice “almost”, we believed that users
appreciated the capability of giving non-overlapped layout of our radial angle model. But
improvements are definitely needed.
6.2.2.3 The Clearness of Illustrating Relationships
Question1: Do you think the TkSee Visualizer can give clear layout of the dependencies
among the nodes?
Choices Novices
(4 users)
Experts
(2 users)
All Users
(6 users)
Not clear at all
A little clear ÷ ÷
Moderately clear ÷ ÷
Very clear ÷ ÷÷ ÷÷÷
Extremely clear ÷ ÷
Conclusion:
All experts thought the tool could give clear layout illustrating relationships among
nodes. Four novices shared four different opinions from a little clear, moderately clear,

89
very clear to extremely clear. In general, more people thought the clearness of the layout
is acceptable.
Some users suggested that the arrows on the links should be moved outside of the node
since they affected the clearness of the layout.
Question2: Do you think the TkSee Visualizer can give clear layout of the relationship
among the rooted trees?
Choices Novices
(4 users)
Experts
(2 users)
All Users
(6 users)
Not clear at all
A little clear
Moderately clear ÷÷÷ ÷÷÷
Very clear ÷ ÷÷ ÷÷÷
Extremely clear
Conclusion:
One third of the users thought the layout of the relationship among the rooted tree are
moderately clear. While one third of the users thought the layout is very clear. Experts
liked the layout more than novices. To sum up, users are satisfied with the clearness of
the layout of rooted trees.
One possible reason that users thought the layout was not clear is when there are multiple
rooted trees on the screen and each one has a few expanded nodes, the modeling got very
complicated. The modeling will be stopped before it gets the ideal layout because it
reaches the maximum calculation time.

90
6.2.2.4 Summary
Users are satisfied with the stability of the layout given by the radial angle model. They
are also satisfied with its capability of giving non-overlap layout. The clearness of layout
to illustrate the relationships among nodes is accepted. A few improvements are needed
to give clear layout among rooted trees.
6.2.3 Animation Techniques
In this section, we concentrated on the evaluation of the animation techniques employed
in the TkSee Visualizer. The question will be mainly focused on the performance of the
slow-in fast-out animation timing, intelligent camera animation, zero-result animation,
result-already-exist animation, and extra result updating animation.
6.2.3.1 Animation Timing
Question: Among the two animation timings, which one do you like?
Choices Novices
(4 users)
Experts
(2 users)
All Users
(6 users)
Animation Timing Type1
(Constant speed)
÷÷ ÷÷
Animation Timing Type 2
(Increasing speed)
÷÷ ÷÷ ÷÷÷÷
Conclusion:
From the answer, we can see that four users liked slow-in and fast-out animation
timing while the other two users preferred constant speed animation timing. In

91
general, more people liked slow-in and fast-out animation timing. Those who liked
this animation timing thought the faster the better.
6.2.3.2 Intelligent Camera Animation
Question: Among the two camera animations, which one do you like?
Choices Novices
(4 users)
Experts
(2 users)
All Users
(6 users)
Camera Animation Type 1 (Always
move to center)
÷ ÷ ÷÷
Camera Animation Type 2 (Move
towards center, but only when
results would be off the screen)
÷÷÷ ÷ ÷÷÷÷
Conclusion:
Two test users liked always-move-to-center (regular) camera animation because it
highlights the focus after every click. While four test users liked intelligent camera
animation more because it keeps the last focus node on the screen while keeping more
nodes on the screen.
More people like intelligent camera animation than regular camera animation. But
regular camera animation can be kept in the tool as an option.
6.2.3.3 Zero-Result Animation
Question: What do you think of the zero-result animation?

92
Choices Novices
(4 users)
Experts
(2 users)
All Users
(6 users)
Not needed at all
A little needed
Moderately needed
Very needed ÷÷ ÷ ÷÷÷
Exactly what I wanted ÷÷ ÷ ÷÷÷
Conclusion:
Three participates thought the zero-result animation is very needed while three others
thought the animation is exactly what they wanted. All test users chose to have zero-
result animation than not have it. Experts shared the similar opinions with the novices.
6.2.3.4 Result-Already-Exist Animation
Question: What do you think of the result-already-exist animation?
Choices Novices
(4 users)
Experts
(2 users)
All Users
(6 users)
Not needed at all
A little needed
Moderately needed
Very needed ÷ ÷÷ ÷÷÷
Exactly what I wanted ÷÷÷ ÷÷÷
Conclusion:

93
Just like the attitude to zero-result animation, three test users thought the result-already-
exist animation is very needed while three others thought the animation is exactly what
they wanted. All test users chose to have the feature than not to have it.
6.2.3.5 Extra Result Updating Animation
Question: What do you think of the extra result updating animation?
Choices Novices
(4 users)
Experts
(2 users)
All Users
(6 users)
Not needed at all
A little needed ÷ ÷
Moderately needed ÷ ÷ ÷÷
Very needed ÷÷ ÷ ÷÷÷
Exactly what I wanted
Conclusion:
Half of the test users thought the extra result updating animation is very needed. Within
the rest of the test users, two thought it is moderately needed. One thought it is a little
needed. In general, the animation is needed to illustrate the functionality of the extra
result box. But it clearly should be improved. Some test users complained that the
animation is too slow. They suggested increasing the speed of the animation and
simplifying the track of the animation.
6.2.3.6 Summary
Slow-in fast-out animation timing is more welcomed than constant speed animation
timing. 67% of the test users like intelligent camera animation while 33% users prefer

94
camera animation. All the users choose to have zero-result animation and result-already-
exist animation. Extra result updating animation is needed but needs improvements.
6.2.4 User Interface
Question: How clear are the symbols and descriptions on the software relationships and
software entity types that used in the TkSee Visualizer?
Choices Novices
(4 users)
Experts
(2 users)
All Users
(6 users)
Not clear at all
A little clear
Moderately clear ÷÷ ÷ ÷÷÷
Very clear ÷÷ ÷ ÷÷÷
Extremely clear
Conclusion:
Half of participates thought that the symbols and descriptions of the software
relationships and software entity types are moderately clear. Half of participants thought
that the symbols and descriptions are very clear. The feature is approved by users, but
there are a lot of places that need to improve. We will discuss it more in section 6.2.6.
6.2.5 The Default Value of System Parameters
In this section, we first list out all participants’ decision regarding each system parameter.
Then we print out the default value of the system parameters according to the users’
answers. The final default value is the average value of all users’ answers.
Question 1: What should be the most comfortable link length among nodes?

95
Test Users Link Length
Novice 1 80
Novice 2 100
Novice 3 150 and more
Novice 4 150
Expert 1 No idea
Expert 2 80
Conclusion:
Five users gave their preferences:
Link length = (80+100+150+150+80)/5 = 120
Question 2: What should be the maximum displayable child number?
Test Users Displayable Child Number
Novice 1 10
Novice 2 10
Novice 3 10
Novice 4 5
Expert 1 5-8
Expert 2 15 or 16
Conclusion:
All users gave their preferences:
Maximum displayable child number = (10+10+10+5+(5+8)/2+(15+16)/2)/6 = 10
Question3: What should be the maximum number of the expanded nodes on the screen at
one moment?

96
Test Users Expanded Node Number
Novice 1 = Displayable child number
Novice 2 No idea
Novice 3 = Displayable child number
Novice 4 5-10
Expert 1 6
Expert 2 15
Conclusion:
Five users gave their preferences:
Expanded node number = (10+10+(5+10)/2+6+15)/5 = 10
Question: What should be the maximum displayable rooted tree numbers on the screen?
Test Users Displayable rooted tree number
Novice 1 = Expanded node number
Novice 2 3
Novice 3 1
Novice 4 5
Expert 1 Everything should be there
Expert 2 10
Conclusion:
Five users gave their preferences:
Displayable rooted tree number = (10+3+1+5+10)/5 = 6
Summary:

97
The default of system parameters given by the test users is listed in the table:
System Parameters Default Values
Link length 120
Displayable child number 10
Expanded node number 10
Displayable rooted tree
number
6
Table 6-1: Default value of system parameters
We will assign these results in the tool as the default system parameters. Meanwhile these
values can still be changed through the preferences box.
6.2.6 General Feedback of the Tool
In the questionnaire, we gave users a chance to point out the weak points of the tool. We
categorized these responses and wrote them into table 6-2.
Question: What features and improvements do you think the TKSEE Visualizer should
have but the current system does not have?
ProblemLocations
Comments Test Users

98
Locations(1) Using bubbles to give some moreexplanations
Novice3
(2) The extra result box as one of the interfacestuff should be explained in the symbolindicator tool box
Expert2
(3) Using list box + choice (or pop up menu)instead of radio box to save space
Expert2, Novice2
(4) Avoid using passive expressions Novice3
Tool Box(Descriptions)
(5) “Be referred by” -> “is referred by”“Be defined by” -> “is defined by”
Expert2
Tool box(Operation)
Should reset the exploration pattern after eachexploration
Novice1, Expert1
(1) Move arrows on the links outside of thenode since it affects the clearness of thelayout.
Novice3The nodes on thescreen(Description)
(2) Modify the outlook of extra result box;such as record board.
Expert2
(1) Select the object first then click to do theexploration
Novice3
(2) Be capable to “add” new results on thenode without removing the past results
Novice4
The nodes on thescreen(Operation)
(3) Can discard rooted trees that user is notinterested in
Expert2, Novice3
Browsing Using zooming technique Novice3Layoutalgorithm
Give layout with less overlap Novice3
Animation Improve zero-result animation Novice4(1) Show busy cursor when users are waitingfor the results;
Expert1
(2) Give the total child number even when theextra result box is not applicable
Expert1
Feedback
(3) Add a state bar to point out the informationexpressed by the no result animation andresult-already-exist animation, etc using text
Expert2, Novice3
Table 6-2: Users’ comments on the tool
Conclusion:

99
All opinions given by the users are very constructive. We will consider them in the future
work.
Question: If the features and improvements you mentioned in the last question were
added to TKSEE Visualizer, would it make it a good software exploration tool?
Choices Novices
(4 users)
Experts
(2 users)
All Users
(6 users)
Yes ÷÷÷ ÷÷ ÷÷÷÷÷
No
I do not know ÷ ÷
Question: In general, do you think the techniques provided by TkSee Visualizer would
result in more helpful tool than one lacking such techniques?
Choices Novices
(4 users)
Experts
(2 users)
All Users
(6 users)
Very much ÷÷÷ ÷ ÷÷÷÷
Better ÷ ÷ ÷÷
Same
Worse
Worst
Conclusion:
All the test users thought the TkSee Visualizer is a very helpful tool for them to explore a
huge software system. If we accepted their opinions to improve the tool, most of them
thought Visualizer would become a better tool.
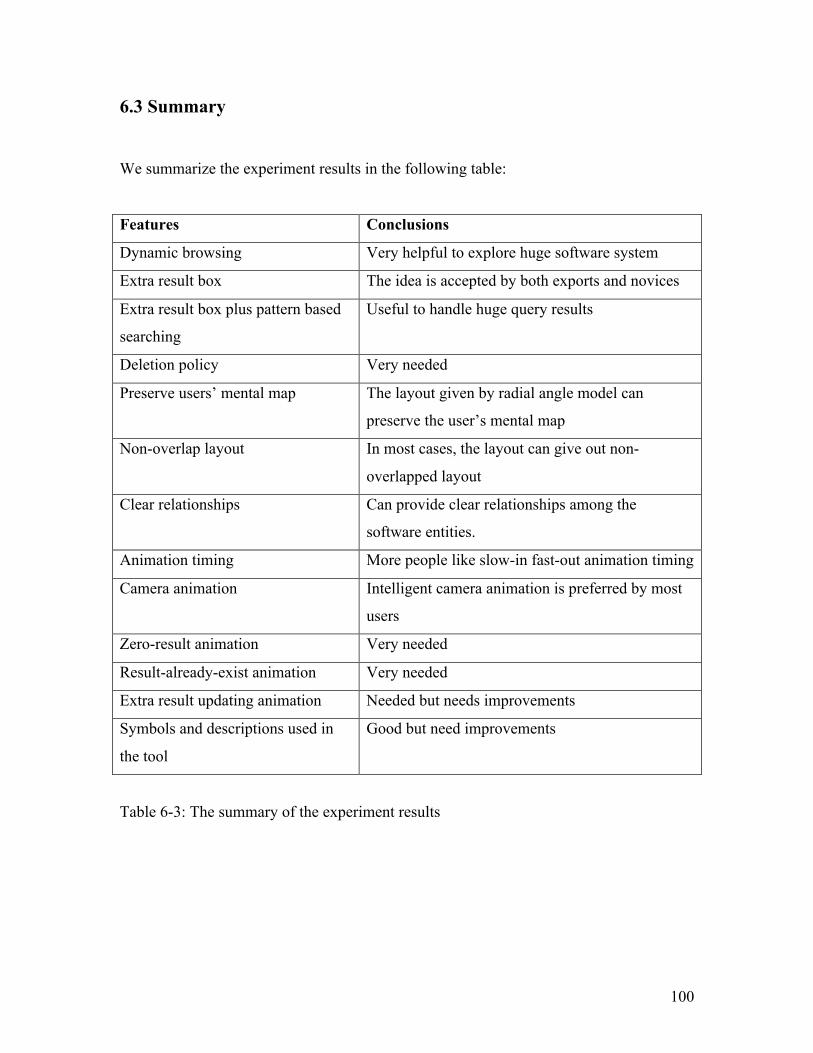
100
6.3 Summary
We summarize the experiment results in the following table:
Features Conclusions
Dynamic browsing Very helpful to explore huge software system
Extra result box The idea is accepted by both exports and novices
Extra result box plus pattern based
searching
Useful to handle huge query results
Deletion policy Very needed
Preserve users’ mental map The layout given by radial angle model can
preserve the user’s mental map
Non-overlap layout In most cases, the layout can give out non-
overlapped layout
Clear relationships Can provide clear relationships among the
software entities.
Animation timing More people like slow-in fast-out animation timing
Camera animation Intelligent camera animation is preferred by most
users
Zero-result animation Very needed
Result-already-exist animation Very needed
Extra result updating animation Needed but needs improvements
Symbols and descriptions used in
the tool
Good but need improvements
Table 6-3: The summary of the experiment results

101
Chapter Seven: Conclusion And Future Work
7.1 Review of the Research
This thesis has presented our experience of using the dynamic browsing technique, an
incremental layout algorithm and several types of animation to visualize huge software
systems. Our methods are straightforward and are shown to be effective to handle huge
software systems.
First, we offered the extra result box mechanism plus a name pattern to handle huge
results.
Then, we proposed a new interactive layout algorithm, the radial angle model to fit the
dynamic browsing technique. It can preserve the user’s mental map and also present clear
relationships among nodes and rooted trees.
Next, we implemented multiple animation techniques in the Visualizer. Despite the
camera animation used in the traditional information visualization, the layout animation
applied in the software visualization, we used animations to clarify the special
exploration results, such as no outcome. We also designed new animation timing, slow-in
and fast-out to exaggerate the changes. Moreover, we improved the camera animation to
track the exploration while keeping more nodes within the screen.
Finally, we performed a series of experiments to analyze the effectiveness of the
techniques implemented in the tool. The experiment showed that TkSee Visualizer was a
very useful tool for software visualization.
102
7.2 Conclusions
Through the study, we learned that dynamic browsing is a powerful technique to
visualize huge software systems. Extra result box plus pattern based searching can
effectively handle the huge exploration results. Our deletion policy is also welcomed by
users.
The incremental layout provided by the radial angle model preserves the user’s mental
map. It can give clear layout of relationships among nodes and rooted trees. Also, in
general, it can provide a non-overlapped graph.
In addition, animation is shown to be important. People like fast animation, therefore
slow-in fast-out is more preferred by users. Intelligent camera animation is preferred by
lots of people, but general camera animation is also a few people’s favorite. Those
animations that are used to clarify the results are all the users’ choices.
7.3 Limitations and Future Work
Because of the lack of time and funding, in the evaluation test, we only chose six test
users who all come from the University of Ottawa. This gave us 70% confidence within
15% of the true mean. Also the backgrounds of the test users are too similar. In order to
obtain higher confidence on the validity of the results, we should perform a larger
evaluation test with heterogeneous groups, such as choosing more than 15-20 test users
who are the potential users of the tool with different backgrounds.
During the tests when a lot of nodes are displayed on the screen, the overlap degree
among nodes goes up. One reason is that the modeling stops before it gets the ideal
layout since it exceeds the maximum calculation time. The other reason is that the
repelling among sibling nodes is not strong enough. A more fast and effective layout
algorithm is needed.

103
Another weakness of our methods is that the user may have a less clear global view of the
whole system. This weakness is caused by the dynamic browsing technique as a whole.
Some additional methods may improve the situation: Instead of starting exploration from
a set of nodes picked using a pattern, we can also try to start exploration from some
diagram of the structure of the system.
The deletion policy needs to improve as well. Some test users thought that it would be
more reasonable if the threshold of the deletion policy depended on both the expanded
nodes number and the total nodes number on the screen.
The experiment demonstrated that the techniques implemented in the TkSee Visualizer
are very helpful to explore huge system, but they are a little weak for real work. Some
more powerful exploration abilities are needed, such as zooming; giving all the relations
between two selected nodes, etc.
From the comments gathered from the experiment, the user interface of the tool has many
problems (See table 6-2). These affect the performance of the tool. A thorough usability
evaluation is needed to collect more information to guide further improvements.
Further studies should focus on the following areas: modify the layout algorithm so the
overlap degree will decrease when a lot of nodes are shown on the screen; find a method
to help user to have a better global view of the system; develop some more powerful
exploration abilities to help users to explore software effectively; improve the deletion
policy so it works more reasonably; and do a usability examination on the tool to guide
the improvements of the user interface of the tool.

104
References
[1] P. Eades, "A Heuristic for Graph Drawing", Congressus Numerantium 41,pp. 149-
160, 1984
[2] K. Sugiyama, S. Tagawa and M. Toda, "Methods for Visual Understanding of
Hierarchical Systems", IEEE Trans. Sys., Man, and Cybernetics, SMC 11(2), pp. 109-
125, 1981.
[3] Dean F. Jerding and John T. Stasko , GVU Center, College of Computing, Georgia
Institute of Technology, “The Information Mural”, on-line posting viewed Aug 30,2002
at <http://www.cc.gatech.edu/gvu/softviz/infoviz/information_mural.html>
[4] George W. Furnas, "Generalized Fisheye Views", Proceedings of CHI, 1986 (Boston,
MA, April 13-17, 1986)
[5] Manojit Sarkar and Marc H. Brown, "Graphical fisheye Views of Graphs",
Proceedings of CHI. 1992 (Monterey, CA, May 3-7, 1992)
[6] Mao Lin Huang and Peter Eades, "A Fully Animated Interactive System for
Clustering and Navigating Huge Graphs ", In the Proc. of 6th International Symposium on
Graph Drawing (GD’98), at Montreal, Canada, August 13-15, 1998.
[7] Timothy C. Lethbridge and Nicolas Anquetil, "Architecture of a Source Code
Exploration Tool: A Software Engineering Case Study", University of Ottawa, computer
Science Technical Report TR-97-07
[8] Edited by Richard S. Gallagher, "Computer Visualization: Graphics Techniques for
Scientific and Engineering Analysis", Boca Raton: CRC Press, c1995

105
[9] V. Gary and Charles A. Wagner, "Effects of Update and refresh Rates on Flight
Simulation visual Displays Kellogg", NASA Technical Memo 00415, Dryden Flight
Research Facility, Ames Research Center.
[10] James F. Blinn, "The Mechanical Universe: An Integrated View of a Large Scale
Animation Project", SIGGRAPH’87 course Notes, 1987.
[11] Eli L. Levitan, Handbook of Animation Techniques, Van Nostrand Reinhold
Company, New York, 1979
[12] Gregory MacNicol, Desktop Computer Animation, Focal Press, Boston, 1992.
[13]. Edward Pincus and Steven Ascher, The Filmmaker’s Handbook, NAL Penguin,
New York, 1984
[14] K. Misue, P. Eades, W. Lai, K. Misue, and K. Sugiyama, "Layout adjustment and
the mental map", Journal of Visual language and computing, 6:183-210,1995.
[15] Edited by Milton Abramowintz and Irene A. Stegun, "Handbook of Mathematical
Functions with Formulas, Graphs, and Mathematical tables", 1964
[16] K. Yee, D. Fisher, R. Dhamija and M. Hearst, "Animated Exploration of Graphs
with Radial Layout", Proceedings of InfoVis 2001
[17] B. W. Chang and D. Ungar, “Animation: From Cartoons to the User Interface”,
Proceedings of UIST’ 93, Atlanta, GA, 1993
[18] P. Eades, and M. L. Huang, “Navigating Clustered Graphs using Force-Directed
Methods,” Journal of Graph Algorithms and Applications, vol. 4, no.3, pp. 157-181, 2000

106
[19] S. C. North, “Incremental Layout in DynaDAG”, Proceedings of Graph
Drawing’95, 1996.
[20] G. J. Wills, “NicheWorks – interactive visualization of very large graphs,”
Proceedings of Graph Drawing ’97, 1997
[21] Blain A. Price, Ian S. Small, and Ronald M. Baecher. “A Taxonomy of Software
Visualization”, Proceedings of the 25th Hawaii International Conference on System
Sciences, Jan. 1992
[22] J. D. Mackinlay, G. G. Robertson and S. K. Card, “The Perspective Wall: Detail and
context smoothly integrated”, Proceedings of CHI’91, 1991.
[23] G. G. Robertson, J. D. Mackinlay, and S. K. Card, “Cone Trees: Animated 3D
visualizations of hierarchical information,” Proceedings of CHI’91, 1991.
[24] T. Munzner, “H3: Laying out large Directed Graphs in 3D Hyperbolic Space”,
Proceedings of Information Visualization’97, 1997.
[25] R. Spence, and M. Apperley, “Data base navigation: An office environment for the
professional”, Behaviour and Information Technology 1 (1), 43-54, 1982
[26] R, Baecher, I. Small, and R. Mander, “Bringing icons to life”, CHI ’91 conference,
1991 Proceedings, 1-6
[27] Marc H. Brown, “Zeus: A System for Algorithm Animation and Multi-View
Editing”, In Proceedings of IEEE Workshop on Visual Languages, New York: IEEE
Computer Society Press.

107
[28] B. Johnson and B. Shneiderman, “Tree-maps: A Space-Filling Approach to the
Visualization of Hierarchical Information Structures”, Proceedings of IEEE
Visualization'91, IEEE, Piscataway, NJ (1991), 284-291.
[29] F. Thomas and O. Johnston, Disney Animation: the Illusion of Life, Abbeville Press,
New York, 1981
[30] M. H. Brown, “Perspective on Algorithm Animation”, CHI’88 Conference
Proceedings, 1988, 33-38
[31] R. A. Duisberg, “Animation Using Temporal Constraints: An Overview of the
Animus System", Human-Computer Interaction, 3(3), 1987-1988, 275-307
[32] M-A. Storey, "ShriMP Views: An Interactive Environment for Exploring Multiple
Hierarchical Views of a Java Program", 9th International Workshop on Program
Comprehension, Toronto, Canada, 2001
[33] S. E. Sim, C. L. Clarke, R. C. Holt and A. M. Cox, “Browsing and Searching
software Architectures”, In Proceedings of International Conference on Software
Maintenance, Oxford, England, 1999
[34] B. Shneiderman, Designing the User Interface: Strategies for Effective Human-
computer Interaction, Reading, Mass: Addison-Wesley, 1998
[35] T. J. Ball and S. G. Eick, “Software Visualization in the Large”, Computer, 29(4):
33-43, Apr. 1996
[36] G. D. Battista, P. Eades, R. Tamassia, and I. Tollis, "Algorithms for drawing graphs:
an annotated bibliography", Computational Geometry: Theory and Applications, 4:235--
282, 1994.

108
[37] M. L. Huang, P. Eades and J. Wang, “Online Animated Graph Drawing using a
Modified Spring Algorithm”, Proceedings of 21st Australasian Computer Science Conf.,
1998
[38] E. Noik, "A Space of Presentation Emphasis Techniques for Visualizing Graphs",
Proceedings of Graphic Interface (GI'94), Banff, AL, May 1994, pp. 225-234.
[39] L. Lamping, R. Rao, and P. Pirolli, "A Focus+Context Technique Based on
Hyperbolic Geometry for Visualizing Large hierarchies", Proceedings of the ACM
SIGCHI Conference on Human Factors in Computing Systems, 1995.
[40] A. Cockburn and B. McKenzie, “An Evaluation of Cone Trees”, In People and
Computers XV. Proceedings of the 2000 British Computer Society Conference on
Human-Computer Interaction, Univ. of Sunderland, 4-8 September, 2000.
[41] E.M. Reingold and J.S. Tilford, ”Tidier Drawing of Trees”, IEEE Transactions on
software Engineering, Vol. SE-7, No.2, pp. 223-228, 1981
[42] Reinhard Diestel, Graph theory, New York: Springer, c2000
[43] G. Di Battista, P. Eades, R. Tamassia and I. G. Tollis, “Graph Drawing: Algorithms
for the Visualization of Graphs”, Upper Saddle River, N. J: Prentice Hall, 1999.
[44] H.C. Purchase, “Which Aesthetic has the Greatest Effect on Human
Understanding?”, Proceedings of the Symposium on Graph Drawing GD’97, Springer-
Verlag, pp. 248-261, 1998
[45] A. Frick, A. Ludwig and H. Mehldau, “A Fast Adaptive Layout Algorithm for
Undirected Graphs”, Proceedings of the Symposium on Graph Drawing GD’93,
Springer-Verlag, pp 389-403, 1994

109
[46] Jakob Nielsen, Usability Engineering, Boston: AP Professional, c1993
[47] Human-Computer Interaction Lab, University of Maryland, “TreeViz™ for
Macintosh”, on-line posting viewed Aug 30,2002 at
<http://www.cs.umd.edu/hcil/pubs/treeviz.shtml>
[48] KBRE Lab, University of Ottawa, “Introduction to TkSee 2.0”, on-line posting
viewed Aug 30, 2002 at <http://www.site.uottawa.ca/~tcl/kbre/options/intro.html>
[49] Judith R. Brown, Visualization: Using Computer Graphics to Explore Data and
Present Information, New York: J. Wiley, c1995

110
Appendices
Appendix A: The Instructions of the Experiment
Introduction
TkSee Visualizer is a software visualization tool. It uses graphs to visualize various
relationships among different software entities to help users to understand the software
system better. In particular, it tries to help users to understand huge software systems,
such as legacy systems.
In this tool, we employ three techniques we hope are useful: dynamic browsing
technique, incremental layout algorithm and animations. Corresponding tasks have been
designed in this experiment to evaluate these three aspects.
Dynamic browsing technique is a browsing technique to browse huge software systems.
Instead of visualizing the whole system on the screen at one time, it starts from one part
of the system and visualizes the other parts along the track of the exploration.
Incremental layout algorithm is a special layout algorithm designed for dynamic
browsing. It aims to give a clear view on the software entities and their dependencies
meanwhile preserving the user’s mental map between every graph update. Multiple
animation techniques are also implemented in the tool to smooth the transitions, keep
track of the exploration and clarify the query results.
Purpose
The purpose of this experiment, therefore, is to examine how well this tool is designed
and how much the future users will be benefit from it. The result of this experiment will
be used to fine-tune the tool and to gather general scientific information for future
research.

111
Appendix B: Test Tasks
1. Use TkSee Visualizer to explore:
(1) What software entities are defined by file “alarmcalc.pas”? If “get_dam_fault_totals”
is defined by “alarmcalc.pas”, does data “logical_device” is referred by it? Please
perform the task under the following each condition:
a. Without the ‘extra result’ box and searching
b. With the ‘extra result’ box but without searching
c. With the ‘extra result’ box and searching
(2) Please explore file “maintlog.pas” by the following steps and observe how the
deletion policy works?
a. How many routines does file “maintlog.pas” define?
b. For each of these routines, what does it define?
c. Which routine defines a type called “ANONYMOUS”? What software entities else
does the routine define? Explore “refer” relation on these software entities.
d. Is there any routine that is referred by one of those software entities but also
defined by the file “maintlog.pas”?
(3) Complete the following tasks twice each time choose different types of camera
animation:
a. What is defined by file “maintlog.pas”? Do routine “maint-logging-end”, routine
“maint_logging_terminate” and data “mlog_pid” are defined by “maintlog.pas”?
b. What is defined by routine “maint-logging-end”? What is defined by routine
“maint_logging_terminate”? What is referred by data “mlog_pid”?
c. Within the software entities defined by “maint-logging-end”, there is data called
“id”. What software entities are referred by data “id”?
d. If routine “bind_name” is referred by “id”, where is it defined?

112
e. For the file that defines routine “bind_name”, what else it defines?
(4) Type “node_link_table_type” is defined in which file? If we modify
“node_link_table_type”, what software entities it will this affect? Where are those
routines defined? Where are those data defined?
2. Do some exploring of your own with various preferences set, observing the
amimation until you feel you can answer the following:
(1) Which animation timing do you like most?
(2) Which camera animation do you like most?
(3) Do you think the zero-result animation is helpful?
(4) Do you think the result-all-exist animation is helpful?
3. Change the parameter values on the TkSee Visualizer and experiment until you feel
you can answer the following:
(1) What should be the most comfortable link length among nodes?
(2) What should be the maximum displayable child number?
(3) What should be the maximum number of the expanded nodes on the screen at one
moment?
(4) What should be the maximum displayable rooted tree numbers on the screen?

113
Appendix C: Informed Consent Form
Evaluating Animated Software ExplorationInformed Consent Form
I, (Name of research subject) ________________________________________, am
interested in collaborating in the research experiment conducted by Liqun (Grace) Wang,
Masters student in Systems Science, University of Ottawa. The project is under the
supervision of Dr. Timothy C. Lethbridge, SITE, Faculty of Engineering, and is part of
the requirements for the researcher’s Masters thesis. The purpose of the research is to
evaluate the effectiveness of browsing, layout algorithm and various animation
techniques used to explore visualizations of software.
My participation will consist essentially of the following: I will be asked to use a
software exploration program for a period of about 20 minutes. I will first be shown how
to use the program. Then I will be asked to explore information about some source code
using the program; my objective will be to find answers to a specific set of questions.
And at the end I will be asked some questions regarding my experience.
I understand that the collected data will be used only for evaluation and analysis of the
software exploration program, and the analysis results will be published as part of the
researchers Master’s thesis, and other research papers.
I understand that this activity may cause me slight frustration if the program is difficult to
use. I have been assured by the researcher that every effort will be made to minimize
these occurrences by stopping the task if it becomes too difficult.
I understand that it is the program and not me that is being evaluated, and that when I
have difficulties, it is the fault of the program, not me.

114
I understand that participation is strictly voluntary. I am free to withdraw from the
experiment at any time, before or during the session, and to refuse to answer questions
without prejudice.
I understand that since this project is indirectly funded by Mitel, and the KBRE research
group has an on-going research relationship with the SX2000 group at Mitel, Mitel
management has permitted the researchers to have employees participate in this study,
but that management is not concerned whether I participate or not, and that management
will not see the data gathered from individual employees.
I understand that my anonymity will be assured since my name will not be associated
with the data.
Any information requests or complaints about the ethical conduct of the project may be
addressed to the University’s Health Science and Science Research Ethics Board, or by
calling the Protocol Officer for Ethics in Research Lise Frigault, 562-5800 ext. 1787.
There are two copies of the consent form, one of which I may keep.
If I have any questions, I may contact the researcher or Dr. Lethbridge at 562-5800 ext.
6685 (email [email protected]).
Research Subject’s signature: _______________________________
Date: ___________________________
Researcher's signature: ____________________________________
Date: ___________________________
I wish to receive a summary of the findings of this research that will be available within
one month: Yes ___ No ___