Angola in Transition: The Cabinda Factor - Center for Strategic

Angola Country Report

Clllllpifmi,J/I oj'lli,: /irt!fI!,::u!lt).~'i("(d /JIilP IIlftl-\ J~!I' if I,' ",,/J(' Negi[JII
11 INTRODUCTION
Angola lies on the western coast of Africa and includes a small enclave on the coast, Cabinda, approximately 40 kilometres north of the main territory. The total area of the country is 1,246,700 km2
• The Democratic Republic of Congo to the north, Zambia to the east and Namibia to the south surround it. Additionally, Cabinda borders the Republic of Congo to the north. The country was visited for the present project during the week of 10-15 June 2002.
12 BACKGROUND
2.1 PHYSIOGRAPHY AND CLlMAl1£
The topography is primarily moderate with a low coastal plain extending inland between 50 to 200 km. This is fol!owed by a variably mountainous ridge running roughly parallel to the coast from north to sOLlth. This chain contains the highest elevation in Angola, in Huambo Province at Moco, with an elevation of 2,620 m. East of this ridge the remainder of the country consists of a plateau with gentle topography and elevations between 1000 to 2000111. The majority of the country receives good rainfall of > 1000 mm, concentrated between September and May. The coastal region and the south-east receive considerably less rainfall, generally < 600 mm. The extreme south-west of Namibe Province is a true desert with little to no rainfall.
2.2 W/I TER RESOURCES
Angola is endowed with substantial surface water resources, with all the major rivers (apart from the Zaire and Chiluango of' Cabinda) originating within the country, The majority of rivers rise in the mountainous coastal ridge, with those flowing into the Atlantic being relatively short and those flowing east and north forming longer systems (Cuban go and Cuando). Groundwater is utilised for several urban centres on the coast and in the arid southern provinces and is a major source for rural supply. Additionally, small groundwater based systems have recently been developed to assist in the water supply shortfall in growing peri-urban areas. The overall potential of both surface and ground water is largely untapped, primarily due to long-term instability jn the country.
2.3 OVERALL INSTITUTIONAL FRAMEWORK OF WATER SECTOR
The coulltry's first water law is expected to be passed soon and redefines the institutional structure for the water sector. The present organisation is divided between several ministries making effective co-ordination and management difficult. Until recently ground water was considered to be a mineral resource (controlled by the Ministry of Geology and Mines) However, within the present setup, it is in the process of being transferred (controlled) to the Ministry of' Energy and Water. Additionally, some provinces have autonomous water companies (at Provincial Directorate for Energy and Water), set up in 1987, which have direct responsibility in water supply at the regional level, but suffer considerably from Jack of trained personnel and sufficient financial support. Their relationship to DNA is not yet clearly defilled.
In general, DNA is mandated with provision of rural and urban water supply, which is divided into three departments: Hydraulic, Development and \Vater Resources Management. In a broad sense, DNA's main activity is the operation and maintenance of existing water supply
\ ,iJ{ 1.1.;;il'i --'.1'<.'1 ni' (:",,:-di;;:l!io:l! -Hi,.) \'\01110
by: (;!'(!JilhiW{/ :'1' ('(11; >i!lrrl!1lS Itu,- i'd' (I'i.ri {ut lliul ,'-.,'f( S C'f)lIlultill,:: (j'[I'j ru/
2
('(Hllri/winiJ IJlhli in'tinlgtllio,(;inil 11/(11-' IIII(lS .I"l' fi,,· ,\A/J{' Nt'.:;illl/
,\III.',I)!<I (:Ollutr,\' Hl'POI'1
systems. Although UNICEF has provided some drilling equipment to DNA's groundwater ullit (NAS), the majority of ground water development is carried out by HYDROMINA, a division of the National Geological Institute (lNAGEO) and other private companies. HYDROMINA was created as a state owned groundwater development company after independence following an existing colonial institution of the same name. It has been involved in ground water assessment as well as development, although it is now mostly involved in drilling operations. Presently, the hydrogeology division of JNAGEO carries out most groundwater assessments and siting programs, In terms of the organisational structure, the speci11c segment of INAGEO involved in groundwater development is the Department of Applied Geology, which has three divisions: HydrogeoJogy, Engineering Geology and Environmental Geology. The arrangement to be adopted soon will transfer Hidromina to the Ministry of Energy and Water. Thus, all activities related to groundwater exploration and exploitation will be within the same umbrella, for both surface and groundwater.
No practical legal structures related to groundwater development exist, although provisions for this have been made under the 1992 mining law, Based on these provisions, draft regulations have been submitted by the I-JydrogeoJogy Division whereby permission will have to be obtained for any ground water developments and compulsory submission of pertinent hydrogeologic data Oil completion of the project. This regulation will have to be revised in view of the recent shifts in responsibility, particularly the fact that ground water in general for drinking is 110 longer considered a mineral resource, apart from thermal springs and mineral waters.
2.4 ROLE OF GROUNDWATER IN WATER SECTOR
Although the majority of urban centres are supplied from surface watcr sources, the provincial capitals of Malange, Bengucia, Lubango and Namibe, as we11 as the urban centres of Tobwa and Lobito (with surfacc water), rely on groundwater. 111 generaJ, groundwater use is concentrated in the southern and coastal portions of the country where conditions are more arid and surl~1ce water less available, Additionally, groundwater is being increasingly deveJoped for local systems to augment urban supply in the rapidly growing peri-urban areas, particularly Luanda, An estimated 1 million people in Luanda are not covered by the existing network, but are supplied through private tanker trucks, which fill from the Bengo River and sell the largely untreated water. The level of water service in urban areas is estimated to be 60{;(; (down from 85% in 1980).
Rural areas with developed water supply systems rely on boreholes, wells (with and without handpumps), spring catchments and occasionally surface sources. In areas where existing water supply systems are no longer working or have not been developed, sllIface water is most often relied on. Present rural coverage is estimated to be 20% (up from 10% in 1981). UNICEF, in co-operation with the National Directorate For Water (DNA), has been primarily responsible for funding and logistical support for rural water supply development since 1978. Various NGOs are also active in rural water supply as part of localised projects.
Another major use of groundwater is for livestock in the southern provinces. Water supply for livestock watering is co-ordinated by the Ministry of Agriculture, It is estimated that cattle number of the order of 3 million in these areas, Water is supplied through bore holes and wells equipped with either manual or powered submersible pumps. In a 1973 survey there were 943 borcholcs and 319 wells for such systems. The present number is not available, but based on recent figures available from Cunene Province, where 125 out of 607 systems are functioning, the currelll number of operable systems is likely less than the 1973 figure, Additionally, individual farmers and ranchers also commonly construct boreholes and wells in these areas
.\ \(;1 \\ :1;(':' ')('('i,)r I.'OilrdiJl:llj,lll \ 'nil. j_('~dllll(l
hy: (;;'ol(/l,iwu/i'1' ('O!/_,u!/{liil,\ JJce flee (/'IY) /.1(1 allil ,\'1</,- COII.\/fltillg 1}'lyi r[d 3

('oIlJIJiI!!!iu!/ illhl' hydr/),:!{'o/I/gic({/ l!Jilp m/m
fiJl'/h.' .\'-\1)(' i<i'gillll
i\!tgo!n (:(llln!r," /{epor!
privately. Due to the favourable conditions for livestock rearing in the south, demand for further groundwarer development will probably be considerable.
Only limited research has been conducted concerning groundwater and no national resource estimates have been completed. However, based on the presently identified potential and the limited level of existing development, it is safe to assume that only a very small portion of the national ground water resources arc being uscd.
In terms of surface water, the level of availability is expected to become stressed «1,700 m3/hab/yr) from its present surplus level by the year 2025 (SADC-EU, 1990).
13 GEOLOGICAL AND HYDROGEOLOGICAL FRAMEWORK
3.1 GEOLOGY AND HYDROGEOLOGY
Angola can broadly be divided into three main hydrogeologic regions: an eastern, highland and coastal belt. Data density for much of the country is quite low, however, resulting in considerable uncertainty in terms of hydro geologic conditions especially the eastern areas.
The eastern region covers approximately two thirds of the country and extends from the eastern border to the mountainolls coastal ridge. It is underlain by Tertiary to Recent continental deposits of the Kalahari Beds with smaller areas of Carboniferous and Jurassic age Karoo Supergroup units mostly in the northwest. A small section of Precambrian units is also present in the far eastern border. Topography is moderate and rainfall is considerably higher in the northern regions than toward the south. This results in a generally increasing depth to water table from north to south, with some areas in the south having completely dry Kalahari Beds. Yields arc commonly low to moderate (l - >5 lIs) and success probability decreases considerably from the wetter north to the drier sOllth. The bulk of development in this zone is in the south-eastern section.
The highland region is underlain predominately by Precambrian granites as well as uitrabasic rocks, with lesser sedimentary units in the northwest. Rainfall is highest in this region, aside from the extreme south, primarily due to the higher elevations present in this region. Yields are generally low, mostly <5 lIs, but, locally yields can be high (up to 50 lIs).
The coastal belt is underlain primarily by sedimentary deposits, ranging from Carboniferous 10 Recent ages, In general the most consistently productive aquifers are present in this zone, although water of high mineralisation is more common, generally associated with salt bearing formations.
3.2 NATURAL GIWUNDWATEII QUALITY
Groundv.,'ater quality is mostly acceptable although chemical analysis is not conducted regularly, especially in rural areas. As mentioned above, some of the coastal sedimentary formations have a high degree of mineralisation due to lithologic characteristics. Although not presently monitored or evaluated, there has been a reported decline in water quality in the coastal portion of Namibc Province, most likely related to salt water intrusion. Other urban and rural water supply schemes using groLlndwater in the coastal belt have no reported saltwater intrusion presently.
',\j)i \\:"'_'1' '-j('('(H]' (:I,,:rdii\;t\iilli \ 'Ilil, J ,\'~,()[ho /10,',' i'iiJlilid'Hiu'r COI"I1!/fU!i1 flee J'<'(, (J'lr) l.lI! lint! ,\RI,· COilliillillg (I'lri I.rd
4
1'0111/ :/,ni"ii ilj {lie' in'(/(lIgf'''/U,!,'inl/Ji.'llp mhl'
jilt lit" ',:1.! I{' /(('!:i'I/,'
.\lIgo!:i (:nl!lI[I'Y !{('jlort
14 DATA ACQUISITION
4.1 INSI1TUTIONAL FRAMEWORK FOR DAIA COLLECTION
The institutions and persoJlnel contacted as part of this project are summarised in Table l.
Table 1. Institutions and Personnel Contacted in Lesotho
COMPONENT General GW Infonnation
Monitoring Data (G\V)
I-Ivdrogeolo2.ical Mapping General SW Information
Monitoring Data (SW)
General GW Information Monitoring Data and investment (GW) Monitoring Data (rainfall)
Mapping: topographic, infrastructure, boundaries
Monitoring Data (Water Supply) Luanda only General Geological Information updating of Maps Including GW information ,
GW: groundwater S\V: surface water
INSTITUTION PERSONNEL DNA Mr. Pedro Silva \Vater Supply Department Mr. Quaresma
Ms. Eisa Ramos
DNA Mr. Paulo Emflio Water Resources Department DNA Mr. Palllo Emnio Hydrology Division Mrs. Luzill ConceiGao UNICEF Mr. Maciel Freitas
Meteorological Services Mr. (Director Inamet) INAMET Land Surveys and Physical Mr. Jose Manuel Planning (IOCA) Instituto de Geodesia e Cartografia de Angola) EPAL Ms. Lom'des Tito
Institute Geologico de Dr. Cassange Angola Dr Elmar Paniev (IGEO
Consultant)
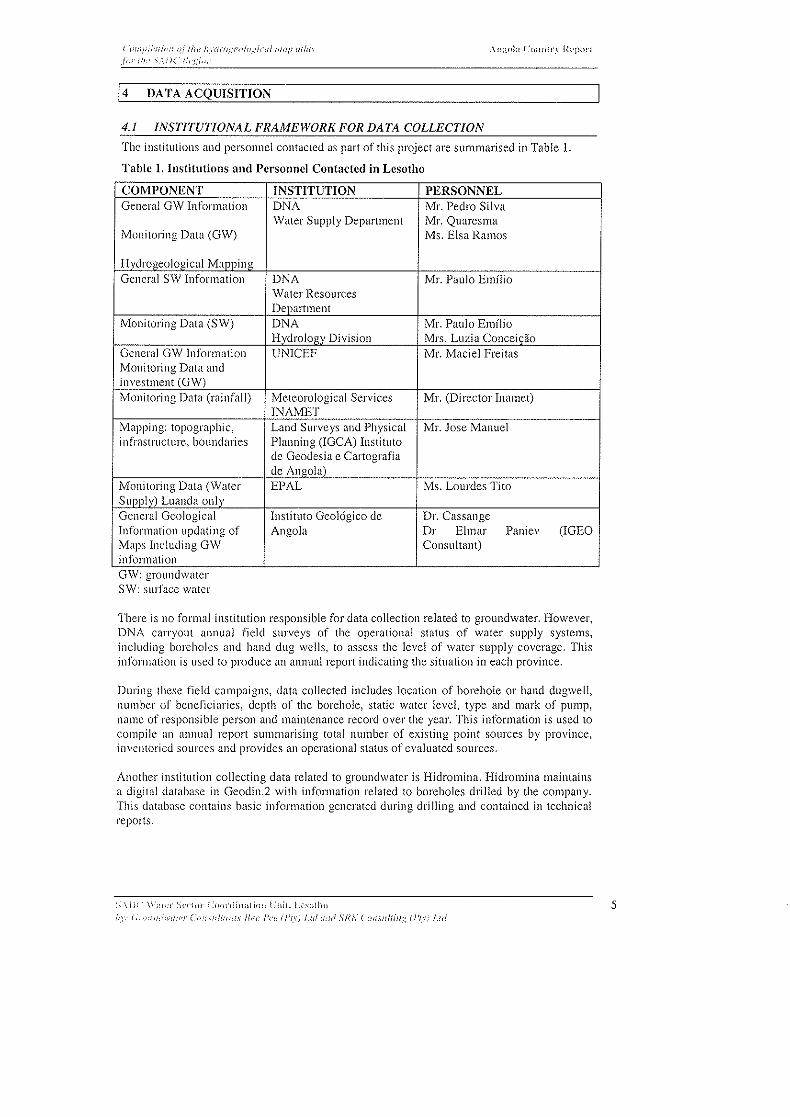
There is no formal institution responsible for data collection related to groundwater. However, DNA carryollt annual field surveys of the operational status of water supply systems, including boreholes and hand dug wells, to assess the level of water supply coverage. This information is Llsed to produce an annual report indicating the situation in each province.
During these field campaigns, data collected includes location of borehole or hand dugwell, number of beneficiaries, depth of the borehoie, static water level, type and mark of pump, name of responsible person and maintenance record over the year. This information is used to compile all allnual report summarising total number of existing point sources by province, inventoried sources and provides an operational status of evaluated SOllrces.
Another institution collecting data related to groundwater is Hidromina. Hidromina maintains a digital database in Geodin.2 with information related to boreholes drilled by the company. This database contains basic information generated during drilling and contained in technical reports.
'; \);1 \\ Hi!.':' :;\,dOI ('<)(jnlill;;!iOli \ ·il)!. I ,,'C:IJ[)\O
I.',': {L't !ill, ;;'I/i('!' Cmil'i,llillti,\ /!,'e PI'!! (/'/.\') 1,111 umi .\/(,\' C'(.'Ii.lllliillg (J'lyi l.rd 5

('n.'lii'! Ulill!! of flu; /n'lim,:,'f'lIfogil'(I/ l!I(lflllflrll
for Ill·· \.,tIN· ;':1');;011
There has been no surface water hydrometric monitoring since the 1970's. In 2002 DNA resumed the production of an annual bulletin using data from 1970 and is planning to start recovering the destroyed hydrometric monitoring network.
Is GROUNDW ATER INFORM A TION SYSTEMS
5.1 HARDWARE AND SOFTWARE
5.1.1 National Directorate for Water
Since 1996 DNA have carried out an annual inventory of water supply sources and produces annual reports abollt operational status of these water points. Information collected in the field is kept in paper form in the DNA archive for future use (Table 2). As mentioned above, the hydrogeologic data collected during these inventories is only borehole location, depth and water level. The bulk of information is only related to operational status of boreholes.
Table 2. Summary of DNA Information Systems
Database / In use No. of records Format Useable' Comments Source DAS - yes 3618 paper no They don't havc any data
Annual basc. Well records arc
invelltory compiled in table as
report summary information.
1 !.:aslly lIseable for Ihe regIOnal hydrogeologlC map
5.1.2 H1DROll1INA
Data from over 3,000 boreholes is presently maintained in paper files at the HYDROMINA office in Lubango. These data have also been entered into Geodin.2 database package (Table 3).
The majority of boreho!c records are from HYDROMINA activities, with very little information from other groundwater development projects. As mentioned previously, the lack of data access from other agencies and organisations involved in groundwater development is expected to be addressed in tbe new regulations and reinforced through planned departments like the one at DNA for Licensing and Monitoring.
Table 3. Summary of DNA Information Systems
Database / In use No. of records Format Useable' Comments Source INAGEO - yes > 2500 Digital yes Information about
Hidromina (Geodin2.0)/ maintenance is not
paper available
1 l:aslly useable for the regIOnal hydrogeologlC map
6

("IIII! ;Iml"''' n/lhe !!ydru}:co/I!gloif lII'tj! ark,", Ji,,' 1ft·, ',,\I)f ' f({-'/'.ioll
5.2 DA III SA VED
5.2.1 DNA
Currently DNA only stores general information related to operational status of borehole and other water sources in paper format. Their reports contain very limited hydro geological data and therefore are of minimal lIse in terms of a regional map. The depth to groundwater data, dyanamic water level (estimate of specific yield) and location of boreholes would be the main data of interest for the regional map. As discussed in Section 5.2.2, unlike the Hydromina database, the data covers almost all of the country. DNA maintains a surface water database in Hydata software with information generated from various gauging stations up to the 70's after which monitoring ceased.
DNA Darabase
DNA maintains a database related to surface water with information generated up to the early 70·s.
Hidromil7a Database
J-lidromina maintains the only ground water database in the country. However, since this company is located in the SOllthern part of the country no visit was possible due to difficult cOIllmunication. Flidromina reports to INAGEO in Luanda and INAGEO was therefore visited and a broad idea of its database operational status was obtained. In general, Hidromina is well equipped with software and trained geologists and engineers are operating on site.
Hidromina is running a hydro geological database 011 Geodin.2 software (the same as that being implemented by the Geological Survey in Botswana), with data generated on its own operation campaigns. No Data from other private companies is not transferred to this database. The data covers mostly the south-western arid to semi-arid part of the country with scarce surface water resources.
Monitoring Database
DNA carried OLlt monitoring annually regarding the operational situation of existing water points sources, boreiloies, hand dug wells, public stand post in urban watcr supply schemes sanitary facilitics. This information is used for the annual report and is used in the strategic planning of activities at DNA.
I-lidromina uses Geodin.2 software on personal computers and DNA produces its reports in Word.
5.2.2 DNA
Grolll1(/lvater information
DNA collect annual information related to point sources for water supply. The information is collected using a questionnaire or protocol with fields indicated in the table below.
,< \j;(" \', :lll'l" ~';i:('iill" ('iJ;ll'dil);lliOli \ 'Ilif, 1.\'\0111<1
'Iili",,::/U r ("/J!J\i /1<I1i1" ifer: !',;e (/'l.r) ! id I.'JI(I SNX ('"Oli,llIliillg" }'/I',1 I,,, 7
i 'rllll!/iiwill.'J lii the i:ydro,::"n/ogin;! IJ/all mIlL' '/;'11' //1,' ';.\j i( Ni:gil!lI
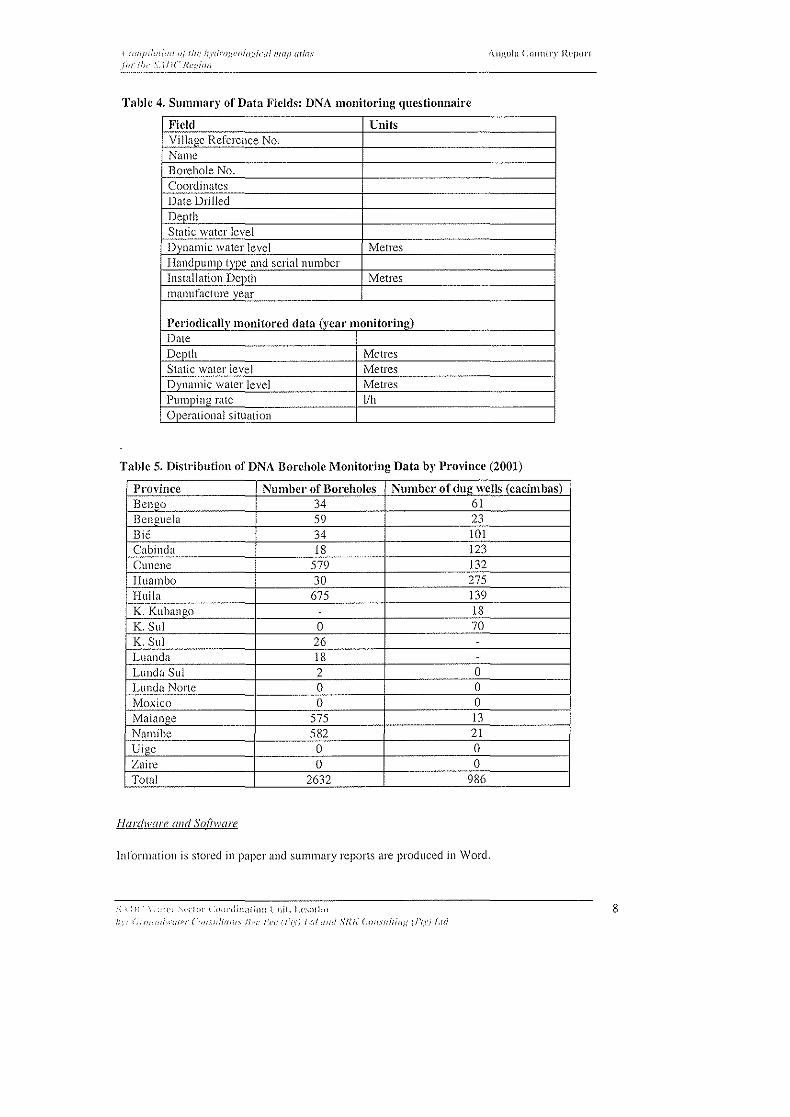
Table 4. Summary of Data Fields: DNA monitoring questionnaire
Field Units Village Reference No. Name Borehole No. Coordinates Date Drilled Depth Static water level Dynamic water level Metres I-Iandpump type and serial number Installation Depth Metres manufacture .year
Periodically monitored data (year monitorin~) Date Depth Metres Static water level Metres Dynamic water level Metres Pumping rate IIh Operational situation
Table 5. Distribution of DNA Borehole Monitoring Data by Province (2001)
Province Number of Boreholes Number of due wells (cacimbas) Beneo 34 61 Beneuela 59 23 Bie 34 101 Cabinda 18 123 Cunene 579 132 Huambo 30 275 I-Iuila 675 139 K. Kubango - 18 K.Sul 0 70 K. Sui 26 -Luanda 18 Lunda Sui 2 0 Lunda None 0 0 Moxico 0 0 Malanoe 575 13 Namibe 582 21 Uige 0 0 Zaire 0 0 Total 2632 986
[-J([rdware ([lid Sofiware
Information is stored in paper and summary reports are produced in Word,
>: \, iil \\ :,,IT ~,t'('IIlI' {:OllrdjJl:li,nil lliil. 1,('~,()III'1
in ("nu "h'uf,.-r ('uusuiflllil.\' fin: Fe,: (!'ryj l.r,! 111/(1 SIO; (.'ui/,llIfiifl,!: (J'/y) 1,ld
8

( u;;I! If,n;'",! dj r/i,: hydru:'c(:iu.::i<'lli ii/,{/' Ill/If,'
Ju,' !/ .. " \, \/j(' !(/'",::i'ill
5.2.3 Other data bases
Hidromina stores information from its field campaigns in digital format lIsing the Geodin.2 software. More than 3 000 records exist in this database foHowing the format proposed by the UN. The fields in the database area summarized in the tables below.
Table 6. Summary of Data Fields: I-lidromina database
I Field -... ~-~ ... --,-~-.
Units I Village Reference No.
Name .--,-... ~"-,, .. ,,--Borcholc No.
-~.,-.. -.. ~ ,~-.-,-- --Coon.linates ~ ... -.-".~-.. -.. ,--,.,. -Date Drilled Depth Dvnamic \Vater Level Metres Yield (not indicate weather is blow yield or well yield) Chemical data Litholoj1ical information 9cophysicai data (~lot_menti(~l1led) No monitored data _. _._ .. -
Table 7. Distribution of lIidromina Borehoie Data by Province
Province Number of' Boreholes Cunene 1020 I-Iuila 1055 Namibc 471 Total 2546
The table shows the concentration of information in the south-eastern part of the country.
Hardware a/ld Sotiware
Information is stored under Geodin.2 software in personal computer
5.3 QUALITY OF DATA
5.3.1 DNA
Quality of data is variable depending upon the level of staff involved in surveys. There arc some reported problems with data collected by staff llsed in inventory activities. However, for the objectives of the survey it is considered acceptable. Periodically DNA sends its own senior staff for field supervision and compares the information generated in the provinces as a form of quality control. Specific training of persollnel for the future data collection for the database is proposed.
,c, \ i)< \\ :(1','1" ',,'C!(1i' {,'ool'd ))::Iioll I n:l, j,\'\o!l)()
'I "Ii rJ.;U!i"· ("0 !I \ Il/NI!! " fil'!' I'I"!',' {'If; /,id <flirt ,\/:t.i-" COO'\i!ltifi,i; 11'1\') /,Id
9

('''III('ill.'l;'OII "I fhl' liyd(<!gco/lI,!,'icaill
I !
!
I , ,
I
I
(',wlj:iiUliilli "'(flu: liydrug('i'/I!,c:ica/lII(ljJ 111/(1,\
fin f!Jt' ,"·"(Ue NF::!""
7.2 DERIVATIVE MAPS
'\ll}!,O!H {:olltl(rv ](t'POI"!
Two derivative maps are presented on the main map showing rainfall (mean annual) and data coverage. From these maps it is clear that a huge extrapolation of information, based on geological similarities, had to be carried out to produce a national map since data are only available in the south¥western part of the country, which covers < 25% of the territory. Both maps are at 1: 20 000 000.
7.3 CLASSIFICATION AND LEGEND OF MAPS
The Map and its legend reflects the bad situation regarding availability of data to produce a National Map. However the legend does include the following items with respective descriptive text:
I. Exploitable yield (in existing boreholes). 2. Aquifer lithologies. 3. Groundwater ilydrochemical characteristics (limited to the southwest part of the country). 4. Surface water features (location of rivers and lakes)
The ground water development pattern is shown as filled polygons in light colours with symbols (points and lines) and hatch patterns signifying different aspects. The details are tabulated in Table 9.
Table 9 I-Ivdl'ogcoiogical Mal} Legend Summary .,._ ... , . ~"," .. . . . . -.-.~.~-LEGEND DETAILS OF LEGEND --_.- .. --... -.--~.-... -.-... -- .
Aquifers a) porous generally llnconsolidated formations Aquifer extent defined by geology. b) fissured and/or jointed rock
c) with limited potentia! or not significant grollndwatcr occurrence
I
lithology indicated by hatch paltern within hydrogeologic units; colour gives general potential and hydraulic characteristics of each unit
Surface WHler I
• Rivers
· Lakes • Swamp areas
• Areas with hiah risk of inundation Borehoie Yield Yield range indicated by size of symbol: large circle >5, small "Exploitable yield" (not specifically sized circle 1 <Q<5 I/s, small sized Circle with fill Q< Ills defined on map) BOl'eholc Details Underneath the circle the depth of borehole is indicated Indicated for selected boreholes C:lptured Spring Other Symbols • Areas with deep aquifers more productive containing
mineralized water, dashed line indicating boundary
• Areas with high productivity in deep aquifers containing mineralized water, dashes
· Fault; thick black solid
• Bedrock topo,graphy, solid black contour line Topographic symbols Topographic symbols include:
• International boundaries;
• Topographic contours (1000 m interval)
• Main lawns, villages
· Main roads, track, minor track
L_ .. __ . · Railway
• Powerline --""~---
:~ '\ ;< i( . \ , :d ('i' S('("i ill' ( . ()(;rdi ll:)! io 11 \ 'Hi I, 1.('_\0111 <) 11 ('f.' 1'.If_,/I,fll:HI!i,/, (·"if,lid/fllii'. Ji,"c 1','1' (f'tyi IJd /lillI SiN,' ('olilul!i/lg [j'n'; {,Id

"r;,pilwiuiI (}j Ilu! fly,lrll,!:('lIlngica/lilllp Ill/a." fiii fill' \-\j)(' i(egio;J
7.4 EXISTING GEOLOGICAL MAPS
Geological maps of the country are produced by the National Geological Institute (lNAGEO). All the lllaps are available in printed form. The national lllap dates from 1982 and has never beell updated. There are other maps at different scales that cover only small parts of the coulltry. A summary of the geologic mapping is presented in Table 10.
Table 10 Summary of Available Geologic Maps
Map Scale Number of mans National Geologic Map I: 1000000 1 Produced in 1982 Geological maps I: 250000 12 sheets produced before
independence + 4 sheets in 1997; 2002 (in process) 1 sheet and another scheduled for next year. Only a small pat of the country is covered
Geologic maps 1: 100000 Before independence 29 sheets, there are other 7 non published sheets.
Other Maps produced by INAGEO Methalonogenic 1: lOOOOOO 1 Cosmogeodinymic 1: 2000000 1 Geol1lorphologic 1: 2000000 1 Mineral Resources 1: 1000000 1
.. There are 110 digital formats for these maps available of any sort. However it was mentioned that the printing editor (agent) may have some digital form in Portugal (Laborat6rio Nacional de lnvestiga~ao Cientffica Troplcal de Lisboa for 1: 1.000.000 map).
7.5 EXISTING TOPOGRAPIlIC MAPPING
The Institute of Geodesy and Cadastre of Angola (IOCA) maintains and sells national and local topographic maps. The national map is at 1: 1,000,000. All maps are outdated and there are 110 digital formats available. However, it is possible that a Russian company which prints the maps maintains these maps in digital format. It should be mentioned however, that maps at larger scale only cover the western part of the country. A summary of topographic maps is gi veil below.
Table 11 Summary of Available Topographic 1\1aps
MaD Scale Number of JUans National Map 1: 1000000 1 Topographic MaD 1: 500000 22 sheets Tonogranhic maps 1: 250000 120 sheets. Topographic maDS 1: 100000 472 sheets Topographic maps 1: 50000 Few available ¥ they cover a
small part of the country
18 DATA AVAILABLE FOR A SA DC HYDROGEOLOGICAL MAP
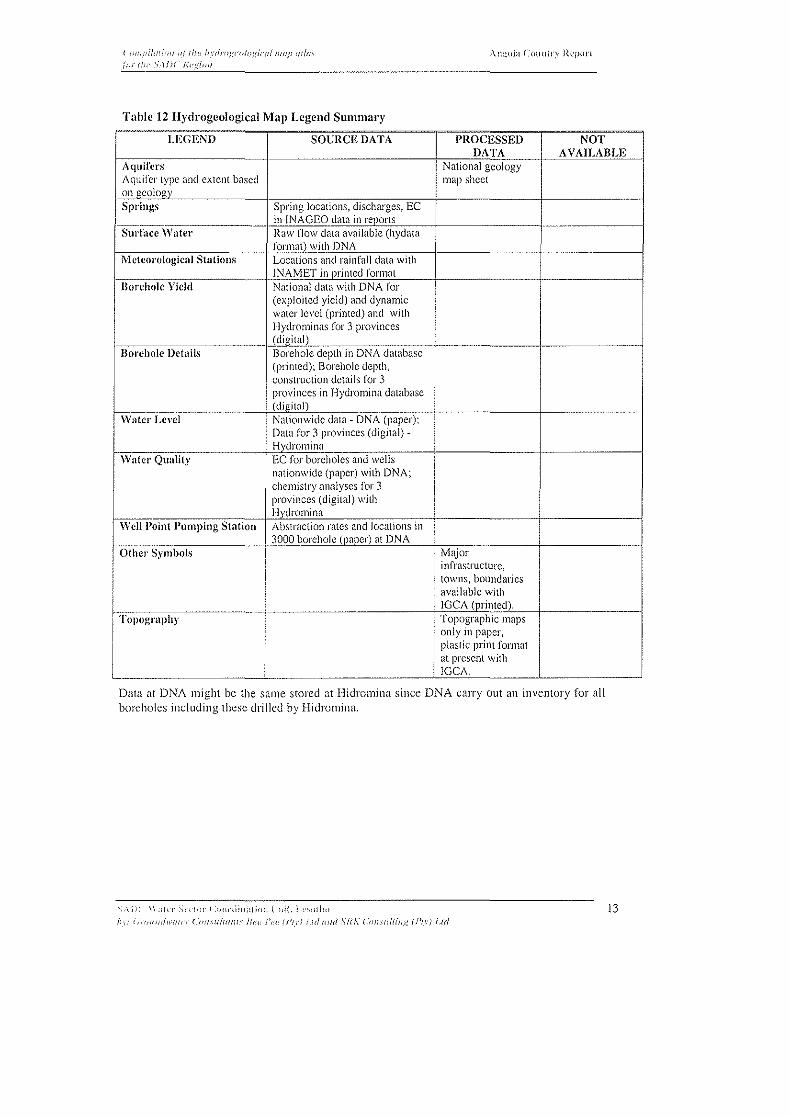
Based on the existing data sets and mapping, Table 12 summarises the data available for specific legend items that may be desirable to portray on a regional hydro geologic map.
S \!;; \\:1\"1 :),"'!<l1' (:<)t".niln:l(lnlll·lIil.l."\(I!IIt)
hr_- t. ,)II!II/;'·(.'II': (·OfII! .. /liiJlf.'.' ne,.' f'e,: j'!'fyj I.id un'! .";/;/, COIISllilillg IF!.,'.' l,Id
12
i
("llI.'pi/I!!!"!I ,,(,Ilie liydrogl'lIiI ~:inil iIIap lidli"
for Ij,,· -".1/)(' N.1'.c:iilll
Tuble 12 HydrogeologicaI Map Legend Summary
LEGEND SOURCE DATA PROCESSED NOT DATA AVAILAIlLE
Aquifers National geology Aquifer Lype and exlent based map sheet on geology Springs Spring locations, discharges, EC
I -~.
in INAGEO data in reports --_._" Surt',lcc Water R,IW flow data available (hydata
format) wiLh DNA .. ~.---IVlctcoro!ogical Stations Locations and rainfall data with
INAMET in printed format Borchole Yield National data with DNA for
(exploited yield) and dynamic watcr level (printed) and with Hydrominas for 3 provinces ( d igit.~IL. . ..
Boreholc Details Borebole depth in DNA database (printed); Borehole depth, construction details for 3 provinces in Hydromina database
1-;:,- ..... -.-~ .. (digiwl) I W.Her Level Nationwide data - DNA (paper);
Data for 3 provinces (digital)-Hydromina
Watel' Quality BC for borcholes and wells nationwide (paper) with DNA; chemistry £lllalyses for 3 provinces (digital) with Hydromina
Well Point Pumping Station Abstraction rates and locations in 3000 borchole (paper) at DNA
I Other Srmbols Major , infrastl'lIctllrc, ,
I towns, boundaries I available with I I . __ .. - IGCA (printc.~).
I Topography Topographic maps only in paper,
l plastic print format at present with IGCA . _._--. ..
Data at DNA might be the same stored at Hidromina since DNA carry out an inventory for all boreholes including these drilled by I-lidromina.
"·,!.'O \\ :I\C{' ~';'TI;il- (:o(l,-dilJ;)lio!\ (';dl. 1 ( ,oth,)
h f: I i'NiUII!Jn/ll-r (-1)/1\1:11:.'111_1 )I,,'c 1'1'1' (i'IY) {.!If iIIU! SI(I,- COIi_IuliiJ/): (1'(\'1 i,ld
".",._-
13

(-'liI!pi/;;lioll ,d lire fi'.,/rIJ.'.!.N!logil'.t! IIIIIp 111/,1'
/,Il ,/;" \_\1)(' i<i·.':i,JlI
19 COMMITMENTS AND CONCERNS
9.1 COMMITMENTS ON CONTRIBUTION 1'0 THE REGIONAL MAPPING PROJECT
9.1.1 INAGEO
Manpower in the Division of Hydrogeology at INAGEO is very limited, but some assistance in accessing and compiling data could be provided,
S{nff from the GIS section at INAGEO lleed training before embarking to any specific project. They have the basic equipment and software but little knowledge in operation.
9.1.2 National Directorate for Water Affairs
DNA has only 1 hydrogeologist but expressed interest in participating in the project. \Vith recently approved restructuring of the water sector, Hidromina will soon come undcr the responsibility of DNA and therefore DNA's capacity will increase to deal with this project as part of transference of trained staff currently at Hidromina.
9.2 CONCERNS
Member staff at various departments expressed their interest in having a good national map first before embarking on a regional map. However, they agreed that this might be carried out simultaneously with a national map forming part of preliminary work.
:.-; \!i~ '-\ <\11'1" '-.,-('; ill" (:I)l)l'(li)):<I ion I' ),iL l_\'.~()lllO
h': I;"!{~!ld"'-<'fli'i' ('f) IY!lililil£,\ Nu: l'cl: (!'Iyj I.id !flld .\'/</, (:ulls/drill}; iJ'/,' i I.rd 14