Anglais Presentation AGA 14-05-2013 - Lassonde
33
ANNUAL GENERAL MEETING OF LASSONDE INDUSTRIES INC. Financial Results for Fiscal 2012 and First Quarter 2013 MAY 14, 2013
Transcript of Anglais Presentation AGA 14-05-2013 - Lassonde

ANNUAL GENERAL MEETING OF LASSONDE INDUSTRIES INC.
Financial Results for Fiscal 2012 and First Quarter 2013
MAY 14, 2013

DISCLAIMER
This Presentation is not, and under no circumstances is to be construed as, a prospectus, an offering memorandum, an advertisement or a public offering of securities. This Presentation has not been approved or disapproved by any securities regulatory authority nor has any authority or commission passed upon the accuracy or adequacy of this Presentation. Any representation to the contrary is unlawful.
This Presentation has been prepared by Lassonde Industries Inc. for the sole purpose of enabling interested parties to evaluate the Transaction and does not purport to be all-inclusive or to contain all of the information that a recipient might desire in order to assess the Transaction. While the information contained in this Presentation is believed to be accurate, Lassonde Industries Inc. expressly disclaims any and all liability for any losses, claims or damages of whatsoever kind based upon the information contained in, or omissions from, this Presentation or any written or oral communication transmitted to any interested party in the course of its evaluation. The information contained in this Presentation is not meant to form the basis of any investment decision. The recipient is to rely on its independent analysis. In addition, none of the statements contained in this Presentation are intended to be, nor shall be deemed to be, representations or warranties of Lassonde Industries Inc. and its affiliates. Where the information is from third-party sources, the information is from sources believed to be reliable, but Lassonde Industries Inc. has not independently verified any of such information contained herein.
When considering the prior performance information contained herein, readers should bear in mind that past performance is not necessarily indicative of future results, and there can be no assurance that Lassonde Industries Inc. will achieve comparable results. Certain of the information contained herein represents or is based upon forward-looking statements or information. Lassonde Industries Inc. believes that such statements and information are based upon reasonable estimates and assumptions. However, forward-looking statements are inherently uncertain, and certain factors may cause events or results to differ from those projected. Therefore, undue reliance should not be placed on such forward-looking statements and information.
Neither this Presentation nor its delivery to any party shall constitute an offer to sell or the solicitation of any offer to buy securities or assets of Lassonde Industries Inc. or any of its affiliates, nor shall this Presentation be construed to indicate that there has been no change in the affairs of Lassonde Industries Inc. since the date hereof.
2

HIGHLIGHTS–FISCAL 2012Earnings
3
In millions of $
(except EPS) % Δ % Δ2012 2011 2010 12 vs 11 11 vs 10
Sales 1,022.2 760.3 536.2 34.5% 41.8%
Operating profit 85.5 60.3 50.2 41.7% 20.3%
Operating profit / Sales 8.4% 7.9% 9.4%
Profit 45.0 34.6 32.0 30.2% 8.1%
Profit attributableto shareholders 43.9 34.5 32.0 27.5% 7.8%
EBITDA 115.9 83.4 66.7 38.9% 25.2%
Earnings per share (EPS) 6.29 5.12 4.86 22.9% 5.3%
Years endedDecember 31,
HIGHLIGHTS–FISCAL 2012Earnings (cont’d)
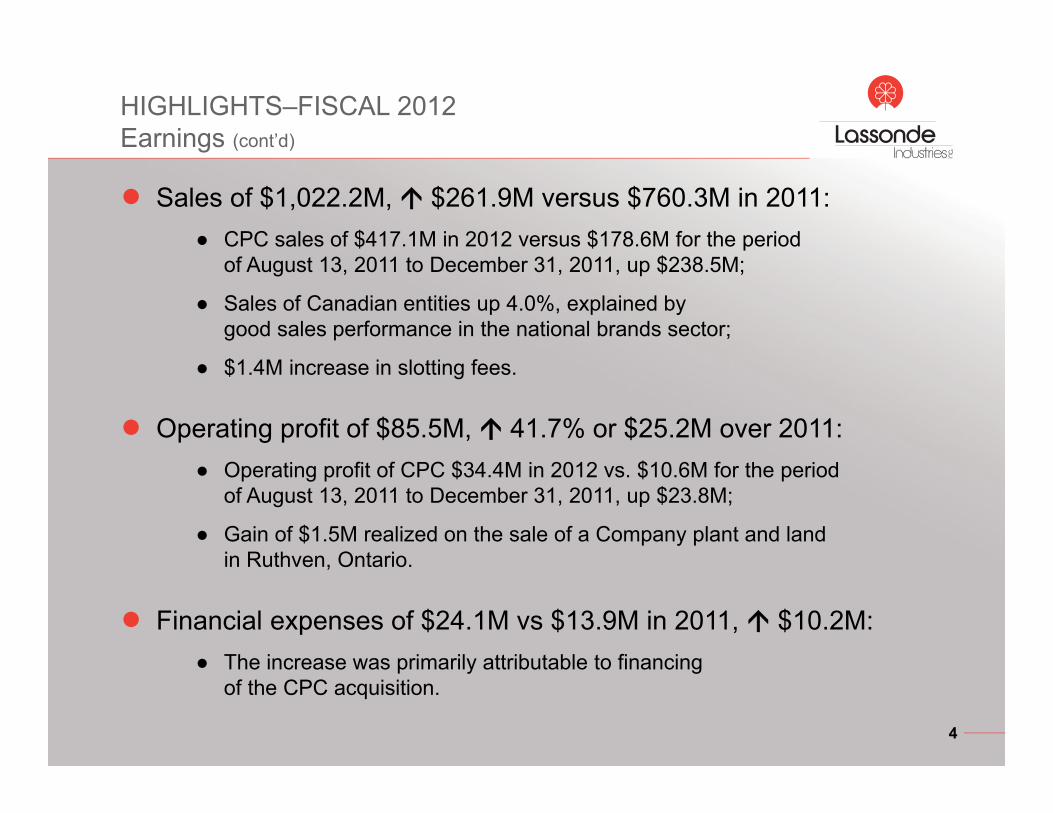
● Sales of $1,022.2M, $261.9M versus $760.3M in 2011:● CPC sales of $417.1M in 2012 versus $178.6M for the period
of August 13, 2011 to December 31, 2011, up $238.5M;
● Sales of Canadian entities up 4.0%, explained by good sales performance in the national brands sector;
● $1.4M increase in slotting fees.
● Operating profit of $85.5M, 41.7% or $25.2M over 2011:● Operating profit of CPC $34.4M in 2012 vs. $10.6M for the period
of August 13, 2011 to December 31, 2011, up $23.8M;
● Gain of $1.5M realized on the sale of a Company plant and land in Ruthven, Ontario.
● Financial expenses of $24.1M vs $13.9M in 2011, $10.2M:● The increase was primarily attributable to financing
of the CPC acquisition.
4
HIGHLIGHTS–FISCAL 2012Earnings (cont'd)
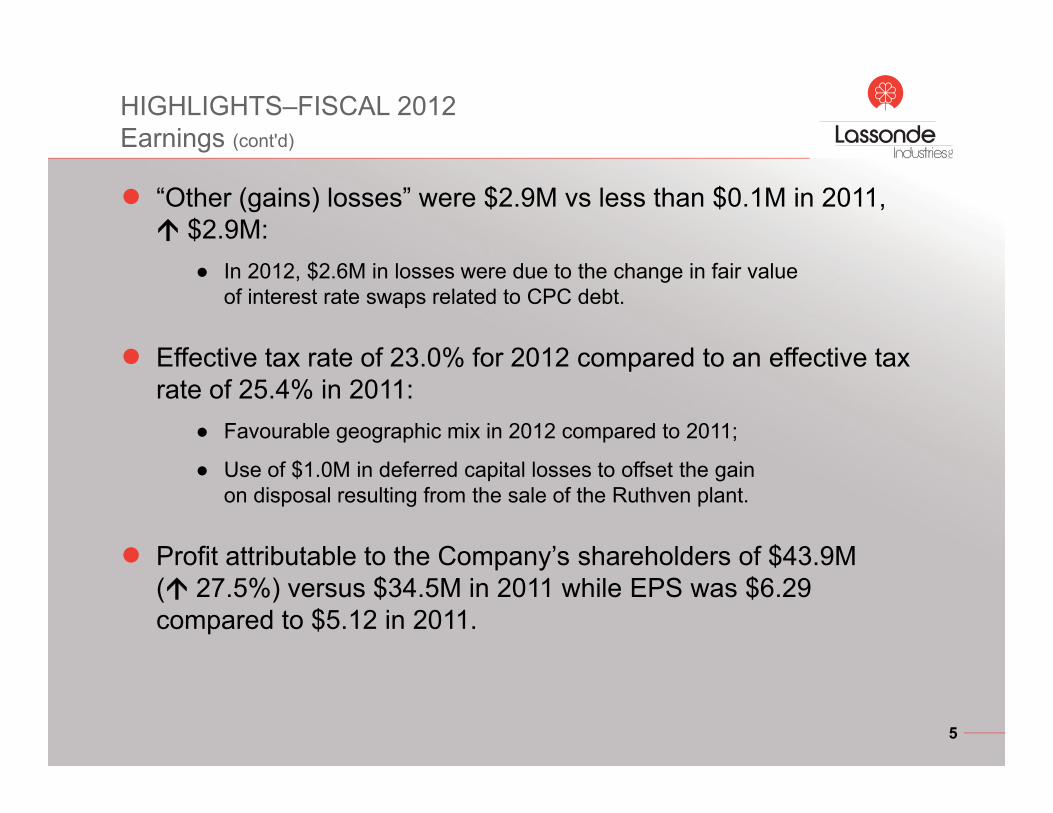
● “Other (gains) losses” were $2.9M vs less than $0.1M in 2011, $2.9M:● In 2012, $2.6M in losses were due to the change in fair value
of interest rate swaps related to CPC debt.
● Effective tax rate of 23.0% for 2012 compared to an effective tax rate of 25.4% in 2011:
● Favourable geographic mix in 2012 compared to 2011;
● Use of $1.0M in deferred capital losses to offset the gain on disposal resulting from the sale of the Ruthven plant.
● Profit attributable to the Company’s shareholders of $43.9M ( 27.5%) versus $34.5M in 2011 while EPS was $6.29 compared to $5.12 in 2011.
5
HIGHLIGHTS–FISCAL 2012 Statements of Financial Position
6
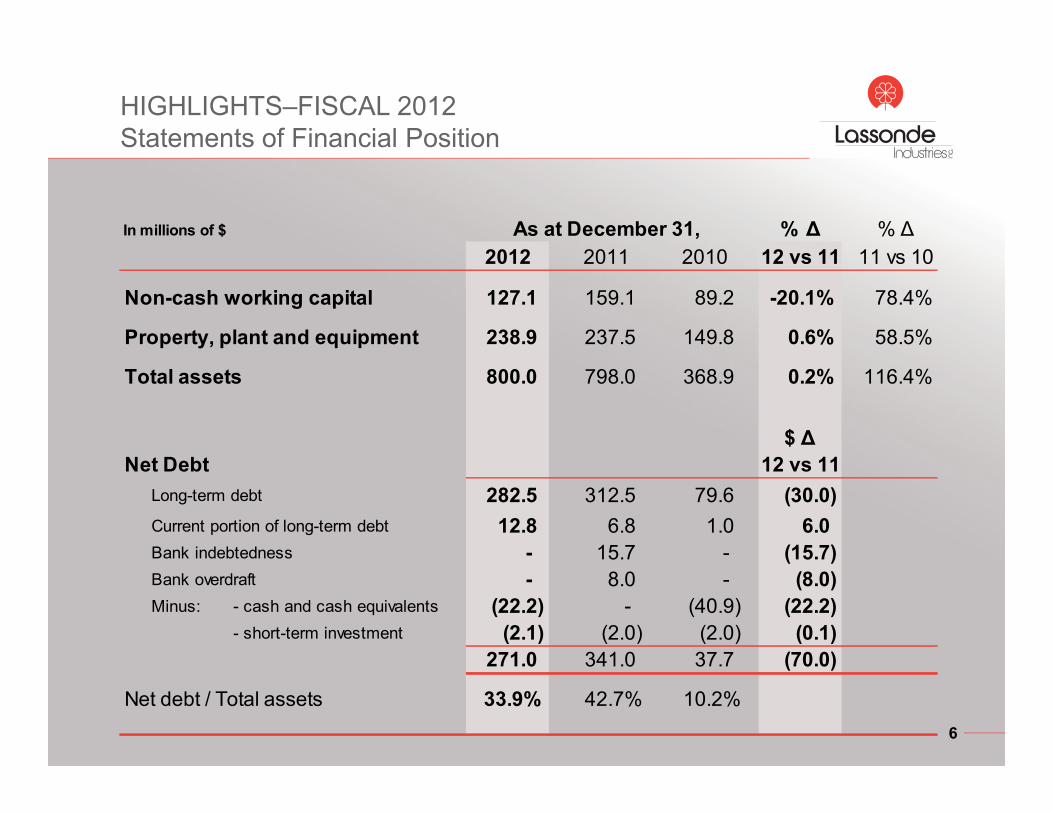
In millions of $ % Δ % Δ2012 2011 2010 12 vs 11 11 vs 10
Non-cash working capital 127.1 159.1 89.2 -20.1% 78.4%
Property, plant and equipment 238.9 237.5 149.8 0.6% 58.5%
Total assets 800.0 798.0 368.9 0.2% 116.4%
$ ΔNet Debt 12 vs 11
Long-term debt 282.5 312.5 79.6 (30.0)Current portion of long-term debt 12.8 6.8 1.0 6.0Bank indebtedness - 15.7 - (15.7)Bank overdraft - 8.0 - (8.0)Minus: - cash and cash equivalents (22.2) - (40.9) (22.2)
- short-term investment (2.1) (2.0) (2.0) (0.1)271.0 341.0 37.7 (70.0)
Net debt / Total assets 33.9% 42.7% 10.2%
As at December 31,

HIGHLIGHTS–FISCAL 2012Free Cash Flow Analysis
7
In millions of $Variance
2012 2011 2012-2011Free cash flows
Profit 45.0 34.6 10.4Ajustments Amortization and Depreciation 31.6 23.1 8.5
Pension plans and other 2.2 (4.3) 6.5Change in non-cash working capital 22.7 (7.6) 30.3
Cash flows from operating activities 101.5 45.8 55.7Dividends paid (8.6) (8.1) (0.5)Acquisition of PP&E and intangibles (24.8) (19.5) (5.3)Business acquisition - (392.9) 392.9
Free cash flows 68.1 (374.7) 442.8
Used (Financed) as follows:Decrease (Increase) in net debt * 68.1 (292.9) 361.0Non-controlling interest - (15.9) 15.9Other long-term participating instruments - (35.8) 35.8Issuance of shares - (30.2) 30.2Repurchase of shares - 0.1 (0.1)
68.1 (374.7) 442.8
* Before currency translation effect
Years endedDecember 31,

HIGHLIGHTS–FIRST QUARTER 2013Earnings
8
March 30, March 31, % Δ $ Δ2013 2012
(restated)*13 vs 12 13 vs 12
Sales 240.6 233.4 3.1% 7.2
Operating profit 13.8 13.3 4.3% 0.5Operating profit / Sales 5.7% 5.7%
Profit attributableto shareholders 5.9 5.7 3.0% 0.2
EBITDA 21.6 21.1 2.4% 0.5
Earnings per share (EPS) 0.84 0.81 3.7%
March 30, Dec. 31, $ Δ2013 2012 13 vs 12
Net debtLong-term debt (incl. current portion of LTD) 298.2 295.2 3.0Bank indebtedness and bank overdraft - - -Minus: - cash and cash equivalents (2.2) (22.2) 20.0
- short-term investment (2.1) (2.1) -293.9 270.9 23.0
First Quarters ended
As at
In millions of $(except EPS)
* Figures restated following the adoption, on January 1, 2013, of the amended version of IAS 19.
HIGHLIGHTS–FIRST QUARTER 2013Earnings (cont’d)
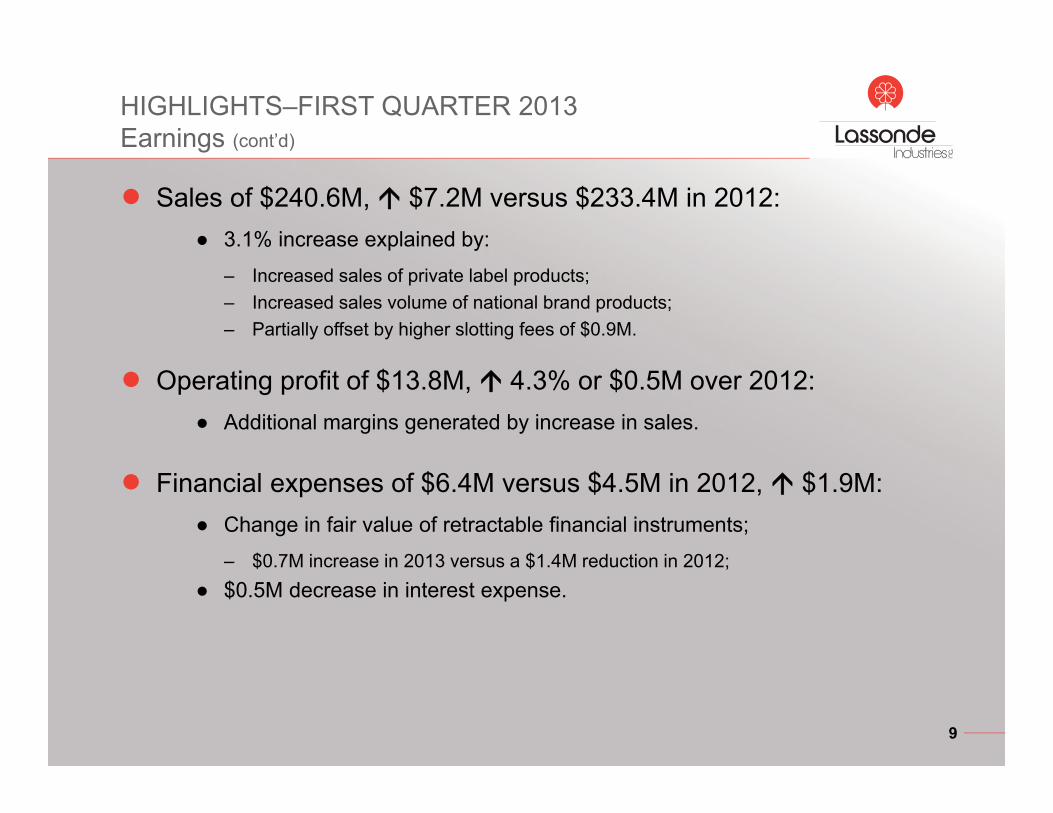
● Sales of $240.6M, $7.2M versus $233.4M in 2012:● 3.1% increase explained by:
– Increased sales of private label products;– Increased sales volume of national brand products;– Partially offset by higher slotting fees of $0.9M.
● Operating profit of $13.8M, 4.3% or $0.5M over 2012:● Additional margins generated by increase in sales.
● Financial expenses of $6.4M versus $4.5M in 2012, $1.9M:● Change in fair value of retractable financial instruments;
– $0.7M increase in 2013 versus a $1.4M reduction in 2012;● $0.5M decrease in interest expense.
9
HIGHLIGHTS–FIRST QUARTER 2013Earnings (cont’d)
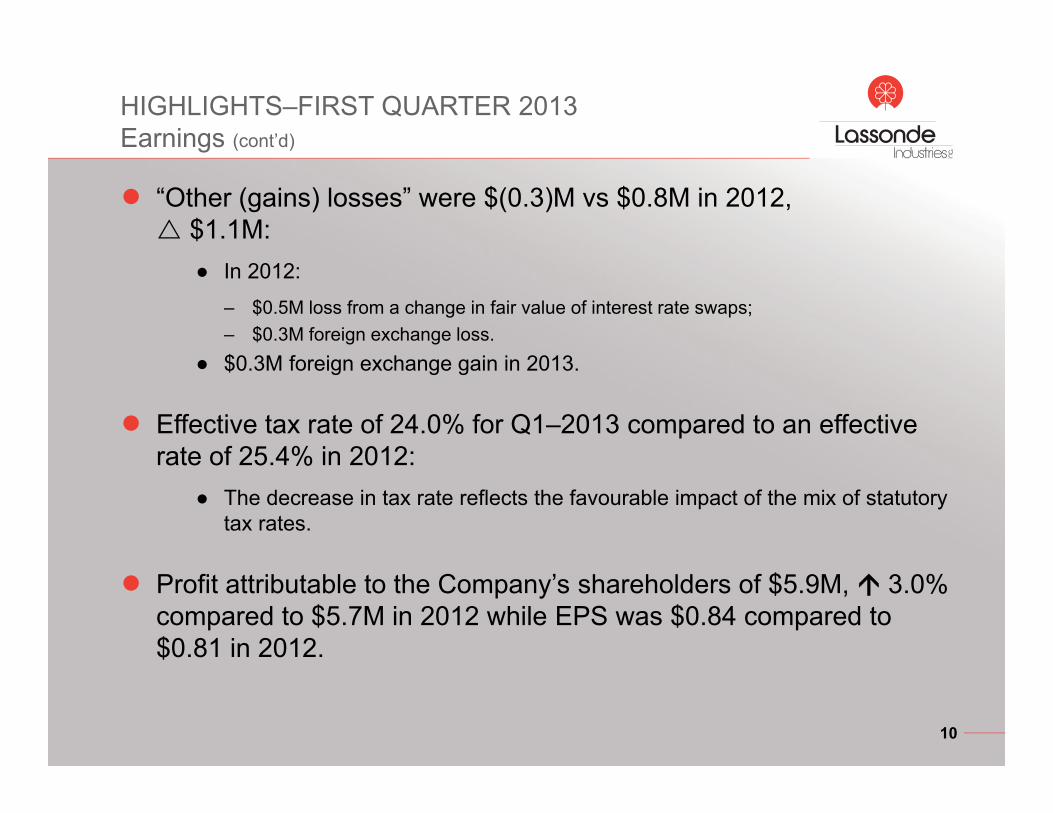
● “Other (gains) losses” were $(0.3)M vs $0.8M in 2012, $1.1M:● In 2012:
– $0.5M loss from a change in fair value of interest rate swaps;– $0.3M foreign exchange loss.
● $0.3M foreign exchange gain in 2013.
● Effective tax rate of 24.0% for Q1–2013 compared to an effective rate of 25.4% in 2012:
● The decrease in tax rate reflects the favourable impact of the mix of statutory tax rates.
● Profit attributable to the Company’s shareholders of $5.9M, 3.0% compared to $5.7M in 2012 while EPS was $0.84 compared to $0.81 in 2012.
10

DIVIDENDS AND OUTLOOK–FISCAL 2013
● Dividends:● Quarterly dividend of $0.39 per share (payable on June 14 for Q1);
● A 25.8% increase over 2012;
● On an annualized basis, represents approximately 25% of 2012 profit attributable to shareholders.
● Outlook:● Barring any significant external factors, the Company remains optimistic
about its ability in 2013 to slightly increase its consolidated sales over 2012 levels;
● Marketing costs will increase due to intense competitive activity;
● The volatility of raw material prices remains an important factor for fiscal 2013:– Stabilization of apple concentrate prices;– Upward trend in orange concentrate prices.
11

LASSONDE INDUSTRIES INC.
Maintaining Growth in Competitive Markets
12
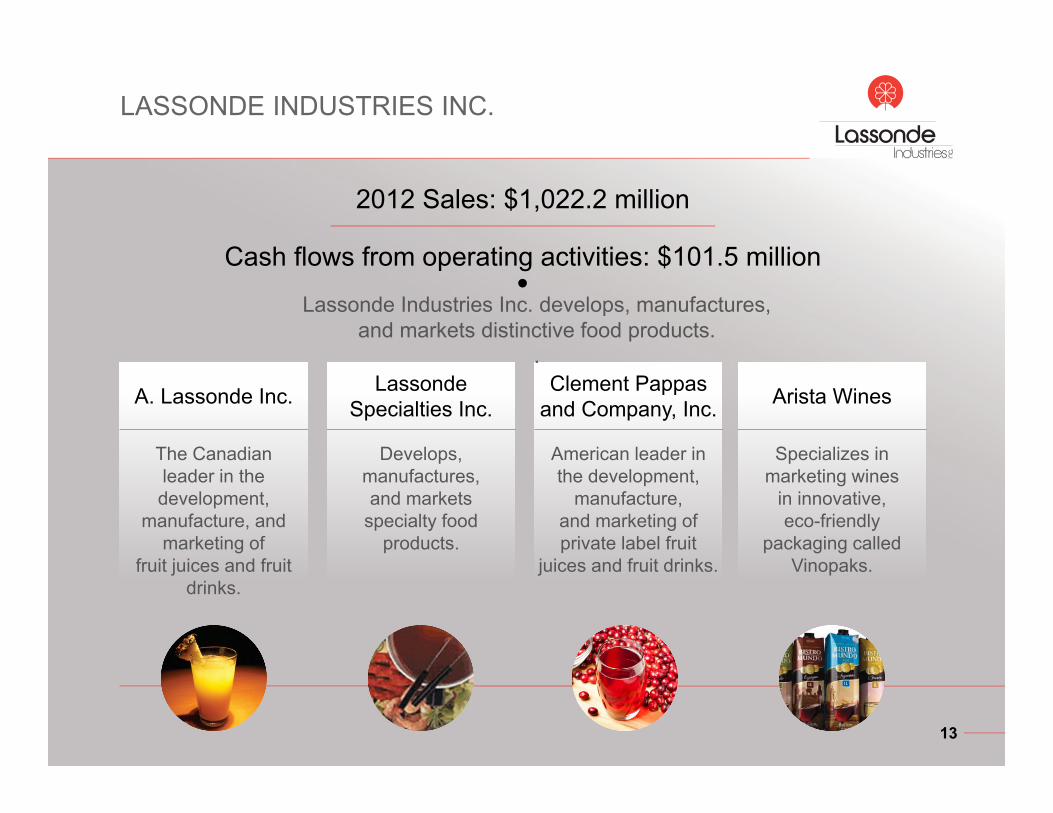
A. Lassonde Inc.
The Canadian leader in the development,
manufacture, and marketing of
fruit juices and fruit drinks.
LASSONDE INDUSTRIES INC.
13
Lassonde Specialties Inc.
Develops, manufactures, and markets
specialty food products.
Clement Pappas and Company, Inc.
American leader in the development,
manufacture, and marketing of private label fruit
juices and fruit drinks.
Arista Wines
Specializes in marketing wines
in innovative, eco-friendly
packaging called Vinopaks.
Lassonde Industries Inc. develops, manufactures, and markets distinctive food products.
.
2012 Sales: $1,022.2 million
Cash flows from operating activities: $101.5 million
62
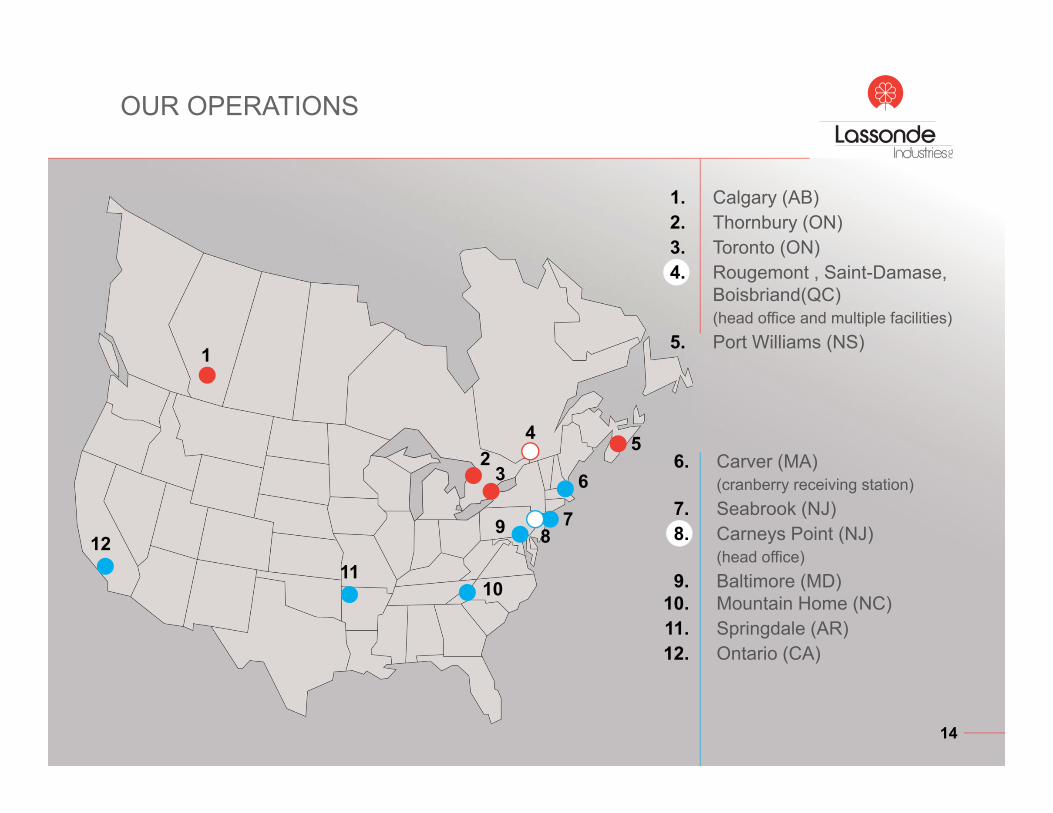
1. Calgary (AB)2. Thornbury (ON)3. Toronto (ON)4. Rougemont , Saint-Damase,
Boisbriand(QC)(head office and multiple facilities)
5. Port Williams (NS)
OUR OPERATIONS
14
6. Carver (MA) (cranberry receiving station)
7. Seabrook (NJ) 8. Carneys Point (NJ)
(head office)9. Baltimore (MD)
10. Mountain Home (NC)11. Springdale (AR)12. Ontario (CA)
1211
9 87
53
4
1
10

COMPETITIVE ENVIRONMENT Fruit juices and drinks
15
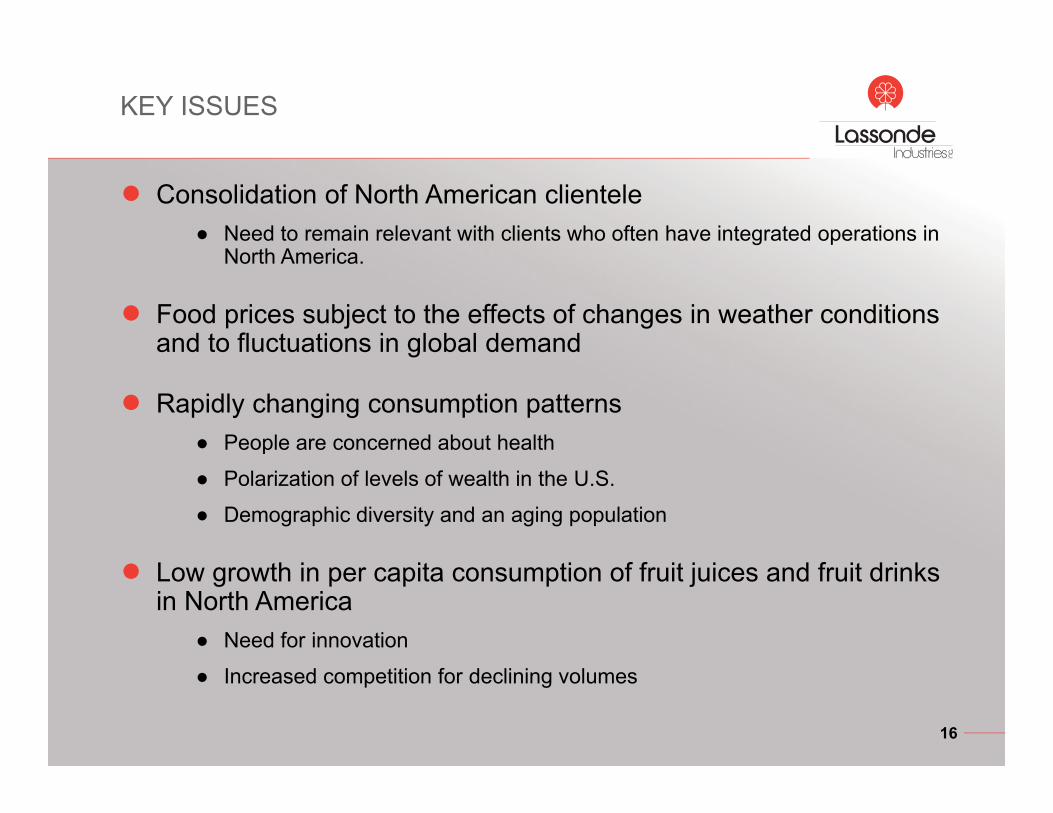
KEY ISSUES
● Consolidation of North American clientele● Need to remain relevant with clients who often have integrated operations in
North America.
● Food prices subject to the effects of changes in weather conditions and to fluctuations in global demand
● Rapidly changing consumption patterns● People are concerned about health
● Polarization of levels of wealth in the U.S.
● Demographic diversity and an aging population
● Low growth in per capita consumption of fruit juices and fruit drinks in North America
● Need for innovation
● Increased competition for declining volumes
16
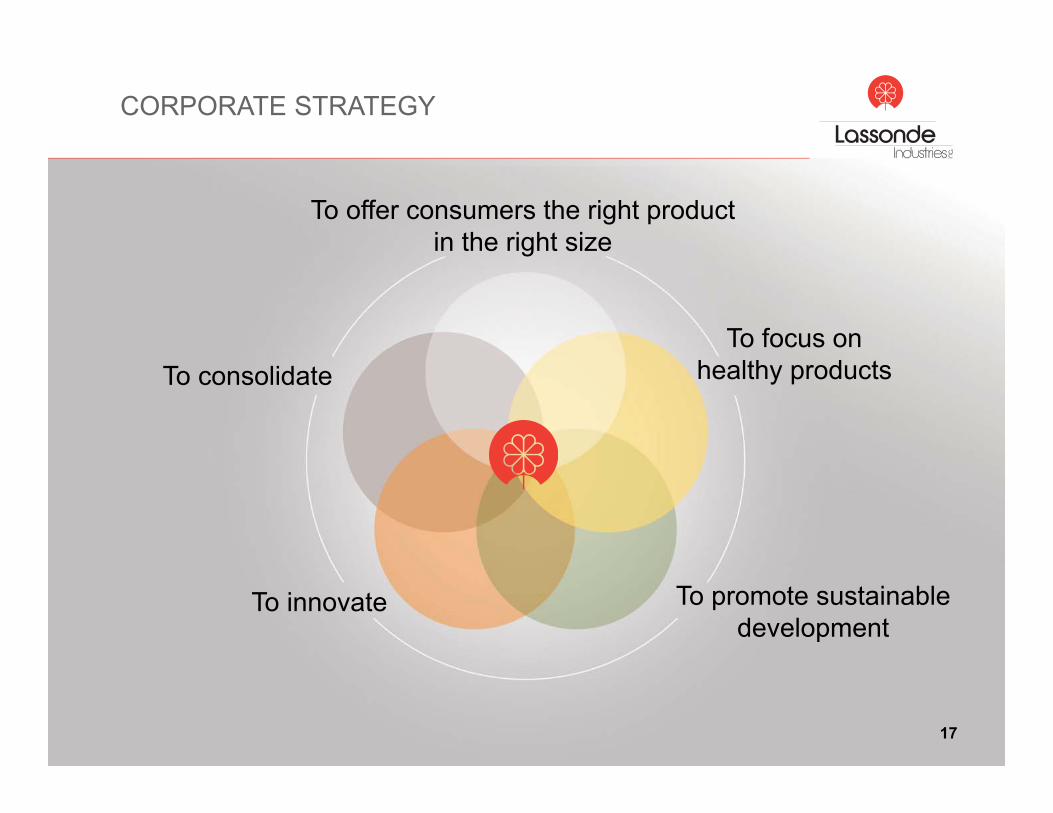
CORPORATE STRATEGY
17
To consolidate
To offer consumers the right product in the right size
To focus on healthy products
To promote sustainable development
To innovate
CORPORATE STRATEGY Innovate and focus on healthy products
● To respond to consumers looking for a greater variety of products better adapted to their needs
● Our speed of execution must enable us to bring these new products to market before our competitors
● Innovation can take many forms including:● Offering new types of fruit juices;
● Offering new types of packaging;
● Adding new products.
● In 2012, new products generated approx. $20M in sales in Canada excluding listing fees
18

CORPORATE STRATEGY Innovate
19
From this…
… to these!

CORPORATE STRATEGY Innovate
20
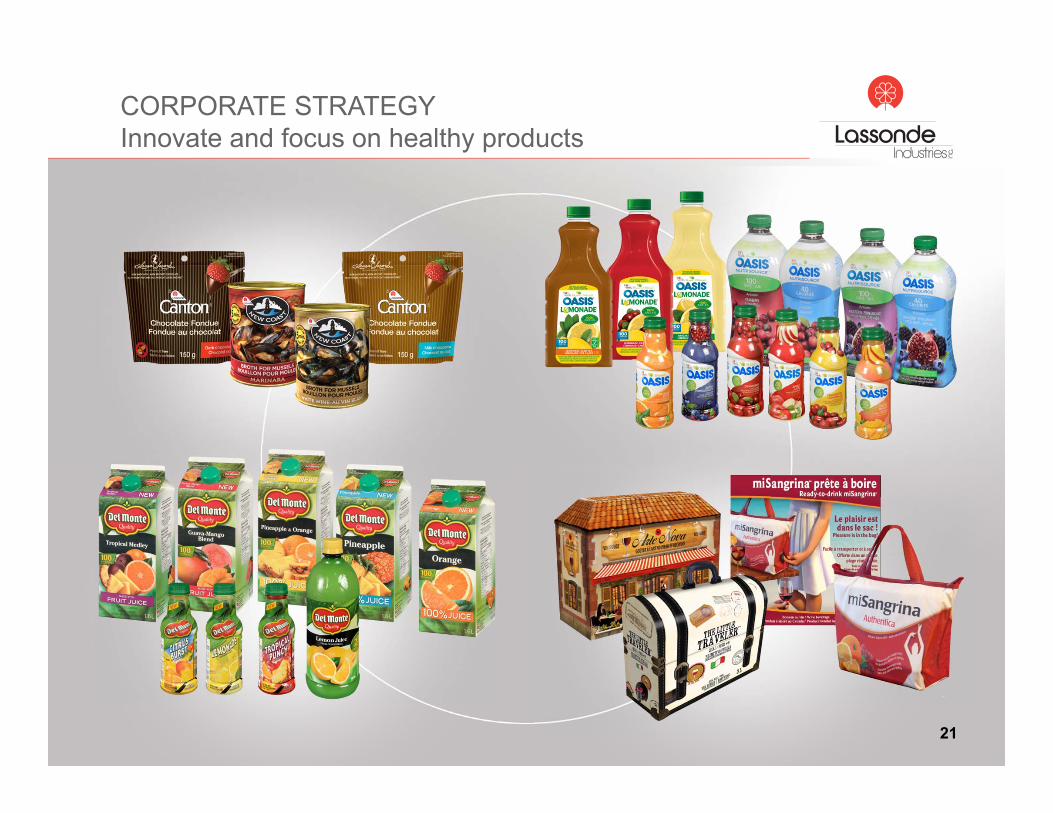
CORPORATE STRATEGY Innovate and focus on healthy products
21
CORPORATE STRATEGYThe right product in the right size
● To respond to increased segmentation of our markets which is in part explained by an increase in disparities in disposable household income:
● Strong increase in demand in dollar stores vs warehouse clubs;
● Increased demand for certified organic products;
● Stabilisation in demand for mass-produced products.
● Good flexibility of execution and a competitive cost structure enable the Company to offer a better-targeted range of products:
● Formats for dollar stores;
● Good offering of organic products;
● Flexibility in the type of packaging for ease of use in a variety of situations;
● To have a larger share of the 756 litres of liquid that the consumer drinks annually.
22

CORPORATE STRATEGYThe right product in the right size
23
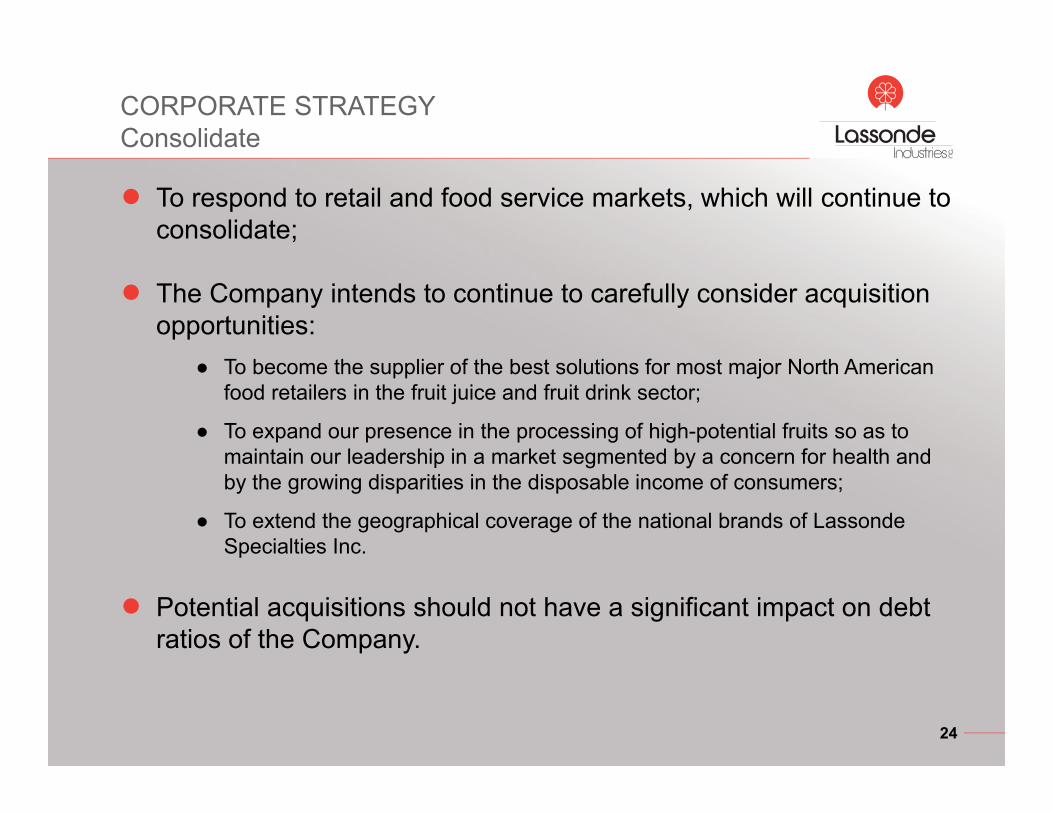
CORPORATE STRATEGYConsolidate
● To respond to retail and food service markets, which will continue to consolidate;
● The Company intends to continue to carefully consider acquisition opportunities:
● To become the supplier of the best solutions for most major North American food retailers in the fruit juice and fruit drink sector;
● To expand our presence in the processing of high-potential fruits so as to maintain our leadership in a market segmented by a concern for health and by the growing disparities in the disposable income of consumers;
● To extend the geographical coverage of the national brands of Lassonde Specialties Inc.
● Potential acquisitions should not have a significant impact on debt ratios of the Company.
24

CORPORATE STRATEGYSustainable development
Lassonde Industries Inc. is committed to being a leader in sustainable development by demonstrating to all our stakeholders that our products respect the environment and society and that they promote the health and well-being of consumers.
● Three priority areas of intervention:● Water
● Packaging
● Health
● Other initiatives:● Reduce our carbon footprint;
● Reduce waste sent to landfills;
● Develop a policy for responsible procurement;
● Promote development projects focused on community assistance in our supply networks (e.g., Mali).
25
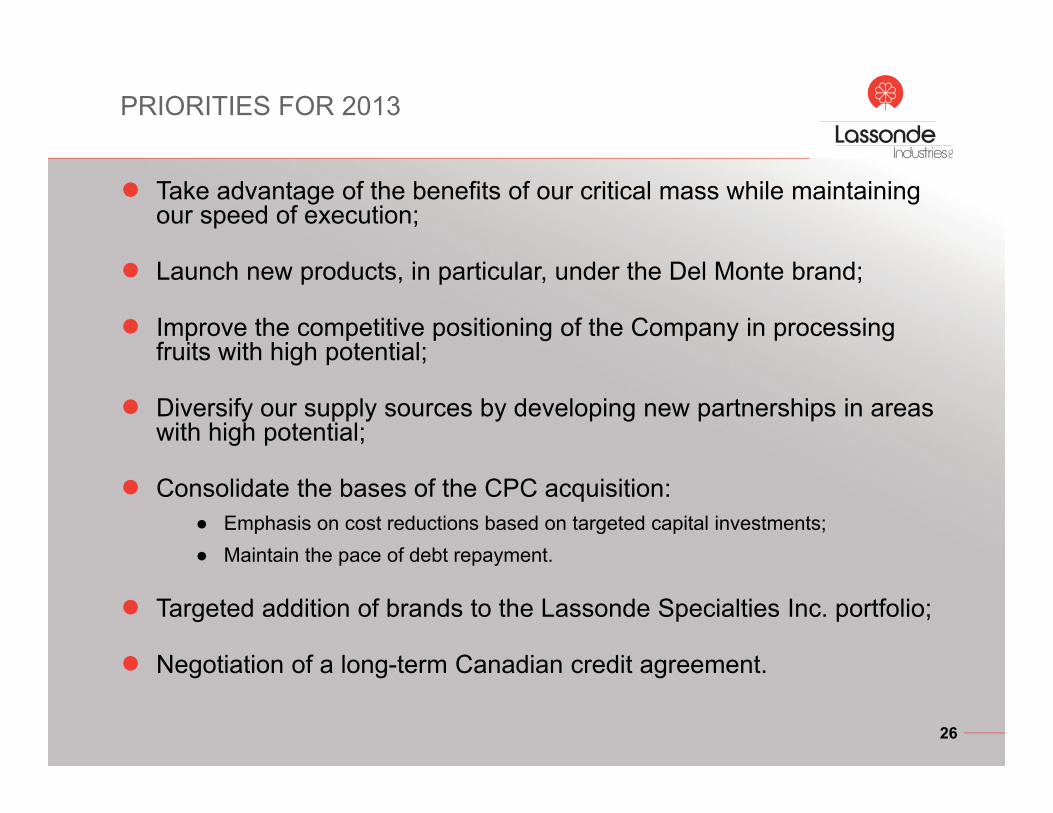
PRIORITIES FOR 2013
● Take advantage of the benefits of our critical mass while maintaining our speed of execution;
● Launch new products, in particular, under the Del Monte brand;
● Improve the competitive positioning of the Company in processing fruits with high potential;
● Diversify our supply sources by developing new partnerships in areas with high potential;
● Consolidate the bases of the CPC acquisition:● Emphasis on cost reductions based on targeted capital investments;● Maintain the pace of debt repayment.
● Targeted addition of brands to the Lassonde Specialties Inc. portfolio;
● Negotiation of a long-term Canadian credit agreement.
26

27
Lassonde promotes an active lifestyle by supporting sports to help maintain good health.
2012 EVENTS

FINANCIAL PERFORMANCE
28
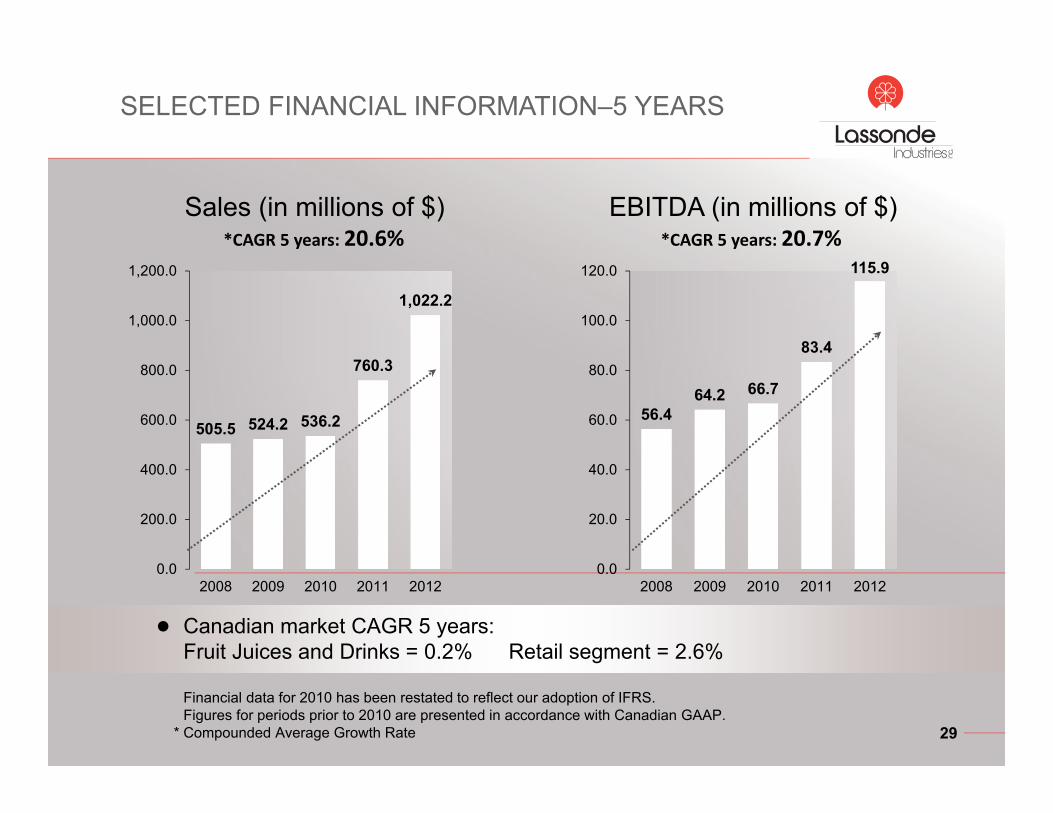
SELECTED FINANCIAL INFORMATION–5 YEARS
Sales (in millions of $) EBITDA (in millions of $)
29
*CAGR 5 years: 20.6% *CAGR 5 years: 20.7%
● Canadian market CAGR 5 years:Fruit Juices and Drinks = 0.2% Retail segment = 2.6%
Financial data for 2010 has been restated to reflect our adoption of IFRS. Figures for periods prior to 2010 are presented in accordance with Canadian GAAP.
* Compounded Average Growth Rate
505.5 524.2 536.2
760.3
1,022.2
0.0
200.0
400.0
600.0
800.0
1,000.0
1,200.0
2008 2009 2010 2011 2012
56.464.2 66.7
83.4
115.9
0.0
20.0
40.0
60.0
80.0
100.0
120.0
2008 2009 2010 2011 2012

42.247.4 50.2
60.3
85.5
0.0
10.0
20.0
30.0
40.0
50.0
60.0
70.0
80.0
90.0
100.0
2008 2009 2010 2011 2012
SELECTED FINANCIAL INFORMATION–5 YEARS (cont'd)
EBIT (in millions of $)
30
*CAGR 5 years: 19.7%
Financial data for 2010 has been restated to reflect our adoption of IFRS. Figures for periods prior to 2010 are presented in accordance with Canadian GAAP.
* Compounded Average Growth Rate
4.39 4.62 4.865.12
6.29
0.00
1.00
2.00
3.00
4.00
5.00
6.00
7.00
2008 2009 2010 2011 2012
EPS (in $)*CAGR 5 years: 13.0%

OUR FUTURE
To provide a dependable
service that meets our clients’
expectations
To take advantage of our acquisition in terms of both
product lines and economies
of scale
To be close to consumers and
clients
Do as well in the future
as we have done in the past
CONTINUE TO INNOVATE
AND PROMOTE HEALTH
31

QUESTIONS
32

ANNUAL GENERAL MEETING OF LASSONDE INDUSTRIES INC.
Financial Results for Fiscal 2012 and First Quarter 2013
MAY 14, 2013