Angelo Zino, Keith Snyder, David Holt 5G Paving the Way ...€¦ · Emerging vehicle-to-everything...
38
www.cfraresearch.com 5G Paving the Way for Change Smart Connectivity – Beyond the Everyday Device Angelo Zino, Keith Snyder, David Holt August 21, 2018
Transcript of Angelo Zino, Keith Snyder, David Holt 5G Paving the Way ...€¦ · Emerging vehicle-to-everything...

www.cfraresearch.com
5G Paving the Way for Change Smart Connectivity – Beyond the Everyday Device
Angelo Zino, Keith Snyder, David Holt
August 21, 2018

Preparing for 5G – What Is It and What Lies Ahead?
Network Infrastructure – Growth and Challenges Ahead
Smart Applications – Mobile Devices and Connected Homes
Smart Applications – Connected Cars and Smart Cities
2
Agenda

Preparing for 5G – What Is It and What Lies Ahead?
3
Angelo Zino

What is 5G? Next generation of wireless networks
Will provide higher speeds, greater capacity, and lower latency
A network able to support billions of connected devices and things
Distributes intelligence throughout the network – the underlying infrastructure for AI (artificial intelligence)
4
Photo Credit: www.teligistics.com via www.CreativeCommons.org
Source: International Telecommunication Union (ITU)
Capability 5G 4GPeak Download Speed 20 Gbit/s 1 Gbit/sLatency 1 ms 30-50 msConnected Devices (per 0.38 sq. miles) 1 million 2,000

Enhanced Mobile Broadband – Faster speed (e.g., UHD, VR, AR)
Massive Internet of Things – Efficient, low-cost communications with deep coverage (e.g., smart homes/buildings and fleet tracking)
Mission-Critical Control – Ultra-low latency and high reliability (e.g., autonomous vehicles, healthcare, drones)
5 Photo Credit: www.rcrwireless.com via www.CreativeCommons.org
5G Enhances Use Cases

Wireless Carriers – Planning for 5G 5G hardware standards officially complete
Key to 5G – Millimeter wave spectrum and more antennas
Consumers will shift to wireless plans offering more data
6 Source: CFRA, Company press releases (AT&T, Sprint T-Mobile and Verizon)
Wireless Carrier 5G Plan Initial 5G Regions Anounced Comments
AT&T
*Commercial access in 12 cities by year-end (hotspot access only) *Phones in 2019
*Dallas, Waco, Atlanta, Charlotte, Raleigh and Oklahoma City
*5G Evolution (>140 markets) - 5G foundation *Selected to build first nationwide public safety broadband network
Sprint *5G commercially available 1H 2019*Los Angeles, Washington D.C., Atlanta, Chicago, Dallas and Houston
*Greatest availability of spectrum among the Big 4 *To utilize 800 MHz, 1.9 GHz, 2.5 GHz spectrum
T-Mobile *30+ cities 5G-ready by year-end *NYC, Los Angeles, Dallas and Las Vegas*Pending Sprint deal to support 5G investments *Primarily 600/700 MHZ and millimeter wave
Verizon
*Fixed 5G in 4 markets this year, intended to replace cable *Mobile in 2019 *Sacramento, Los Angeles and Houston
*Most exposure to high-bandwidth *We estimate > 1/3 share of millimeter wave spectrum
Note: FCC approved spectrum auction for high-bandwidth assets for November 2018 and second-half 2019

U.S. Mobile Subscribers (Millions)
7
Source: CFRA, IDC
2017 2018E 2019E 2020E 2021E 2022E0
100
200
300
400
500
600
2G/3G/4G Mobile Subscribers 5G Mobile Subscribers

U.S. 5G Subscribers (Millions)
8
Source: CFRA, IDC
2017 2018E 2019E 2020E 2021E 2022E0
20
40
60
80
100
5G Mobile Subscribers 5G Internet of Things (Non-Mobile) Connections

Network Infrastructure – Growth and Challenges Ahead
9
Keith Snyder

Device and Data Growth
10
Key Facts: Mobile will represent 20% of total IP
(Internet) traffic by 2021
Number of mobile connected devices per capita will reach 1.5 by 2021
Mobile device connection speeds will triple by 2021
Average smartphone will generate 6.8 gigabytes of traffic per month in 2021, double the level in 2016
In 2021, mobile data traffic will exceed half a zettabyte per year
Source: Cisco Systems

Basic Network Architecture
11
Data Aggregator
Network Core
Mobile devices communicate with antennas on cell tower/small cells.
Data from multiple cell sites is sent to an aggregation tool, which acts as the gateway into the operator’s network.
Data then moves into the operator’s network core, which provides the connection to Internet and other applications/services.
Round trip travel time: 30 to 50 milliseconds (for a 4G network)

High Frequency Transmission Issues
12
Fiber Link
Small Cell

Small Cells
Cell Type Cell Radius
(km)
Users Location
Femtocell 0.010 to 0.1 1 to 30 Indoor
Pico Cell 0.1 to 0.2 30 to 100 Indoor/ Outdoor
Micro Cell 0.2 to 2.0 100 to 2000 Indoor/ Outdoor
Macro Cell 8 to 30 >2000 Outdoor
13
Benefits:
Low cost
Easy to deploy
Increases network density
Lower delay
Drawbacks:
Data backhaul
Increased network complexity
Regulatory hurdles
Source: QORVO

Small Cell Growth
14
Source: creativecommons.com
Source: IDC

Data Backhaul Methods Fiber Optic Cable
15
Pros:
High data capacity
Low operating costs
Long life-span
Cons:
Extremely expensive
Slow deployment
Unable to reach rural areas
Source: creativecommons.com

Data Backhaul Methods Microwave Transmitter
16
Pros: Low upfront cost
Rapid deployment
Good for remote locations
Cons: Ties up spectrum
Limited data capacity
Require uninterrupted line-of-sight to function
Source: creativecommons.com

Edge Computing
17
MEC Server
Applications & Services
Network Core
Applications & Services
Devices connect to small cells.
Data is transported to main cell tower.
Mobile Edge Computing (MEC) servers at base of tower process data and deliver certain apps and services.
Data that can’t be processed by MEC server sent to network core.
Round-trip travel time: 1 millisecond

Smart Applications – Mobile Devices and Connected Homes
18
Angelo Zino

5G Will Impact Mobile First Will help improve replacement cycles, but modestly
5G-enabled devices from Samsung and Huawei in 2019 (#1 and #3 market-share companies).
iPhones available starting 2020, according to CFRA projections
By 2022, over 1/3 of global smartphones sold will be 5G-enabled
Average 5G device price could cost as much as $100-$200 more, with wireless bills increasing as much as 25%-30%
Will help spur greater capabilities:
Ultra High Definition (UHD)
Augmented Reality (AR) / Virtual Reality (VR)
19

Smartphone Shipments (Millions)
20 Source: CFRA and IDC

Augmented Reality a “Reality” with 5G
21
Photo Credit: www.maxpixel.net
Photo Credit: www.Qualcomm.com via www.CreativeCommons.org

The Smart Home Devices capable of communicating with each other
Why Connect? Convenience, cost savings, and energy efficiencies
Drivers? Greater access to high-speed Internet and smart assistants
Biggest Inhibitor? Privacy concerns.
22 Photo Credit: www.pixabay.com via www.CreativeCommons.org

Smart Home Addressable Market Global shipments to approach 1 billion devices by 2022 Smart speakers, security, and lighting the biggest growth areas
23
0
100
200
300
400
500
600
700
800
900
1,000
2017 2018 2019 2020 2021 2022
Global Smart Home Device Shipments, 2017 - 2022 (Millions)
Home monitoring/security Lighting Smart speaker Thermostat Video entertainment Other
Source: CFRA, IDC
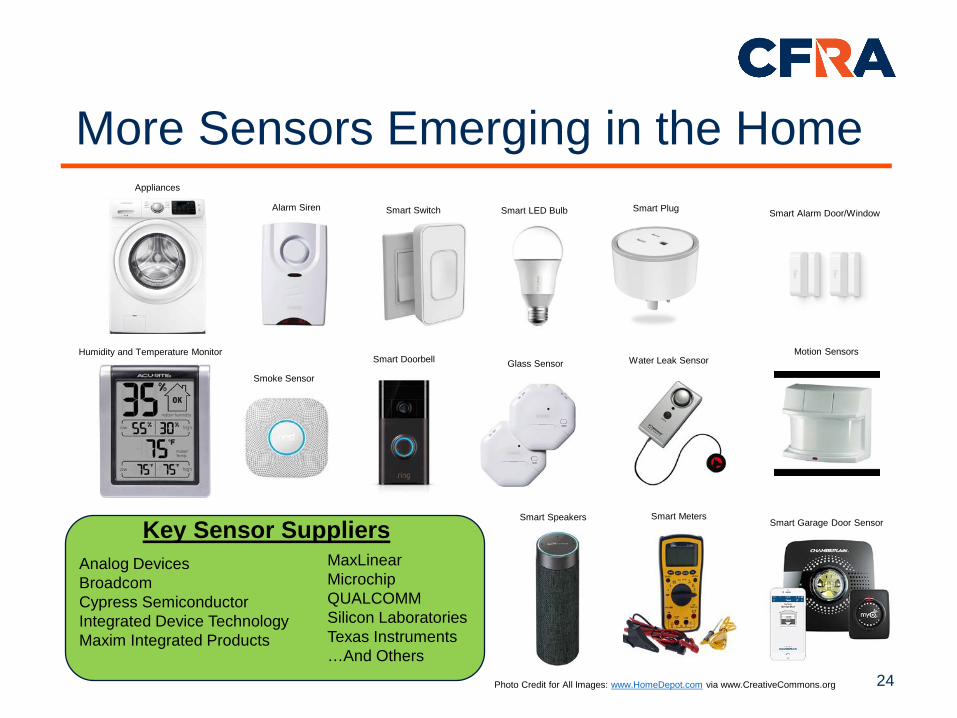
More Sensors Emerging in the Home
24
Alarm Siren
Appliances
Smart Switch Smart LED Bulb Smart Plug Smart Alarm Door/Window
Motion Sensors Water Leak Sensor Glass Sensor Smart Doorbell
Smoke Sensor
Humidity and Temperature Monitor
Smart Garage Door Sensor Smart Meters Smart Speakers
Analog Devices Broadcom Cypress Semiconductor Integrated Device Technology Maxim Integrated Products
MaxLinear Microchip QUALCOMM Silicon Laboratories Texas Instruments …And Others
Key Sensor Suppliers
Photo Credit for All Images: www.HomeDepot.com via www.CreativeCommons.org

Smart Applications – Connected Cars and Smart Cities
25
David Holt

Connected and Autonomous Cars Definition – Cars connecting with other cars, devices and cities
Why Connect? Traffic decongestion, accident prevention and pollution reduction
5G Catalysts – Quicker way to harvest data for safe and efficient driving experiences
Biggest Impediments – Data privacy and regulatory hurdles
Other Suppliers
Driving Systems Velodyne Robosense Valeo LeddarTech
Integrated Circuits Xilinx
Lattice Cypress Semiconductor
Teradyne
Others Flex
Amphenol National Instruments Trimble Navigation
Source: Company Logo Credit - www.creativecommons.org and Car Photo Credit - www.pixabay.com via www.CreativeCommons.org 26

Caution Construction ahead. Need to find a different route. Relayed to car behind it.
Source: CFRA and Car Image Credit - www.pixabay.com via www.creativecommons.org
Scenario 1 Scenario 2
Traffic Light Connected car can
automatically recognize and proceed accordingly.
Real-World Hypothetical Scenarios
27

Source: Yole Development, TE Connectivity
Total Addressable Market (TAM) – Over $130 billion currently
Connectivity is a linchpin for autonomous vehicles, solidifying the importance of 5G
ADAS – Advanced driver-assistance system
By 2045, more than 70% of all new vehicles sold expected to exhibit ADAS capabilities
28
Assisted Driving Addressable Market

Closer Look at Content Composition
29
Source: TE Connectivity, Yole Development, Car Image Credit - www.pixabay.com via www.creativecommons.org
Long-Range RadarASP/Unit - ~$140
Backup CameraASP/Unit - ~$30
GPS, Bluetooth, Wi-Fi AntennasASP/Unit - ~$5.50
LIDAR ASP/Unit - ~$350
Forward CameraASP/Unit - ~$40
Ultrasonic ASP/Unit - ~$6
In-Cabin/Driver Cam ASP/Unit - ~$30
Surround/Event CameraASP/Unit - ~$30
Short-Range RadarASP/Unit - ~$140

Content per Vehicle (CPV) Analysis
30
Source: Arrow Electronics, TE Connectivity, Yole Development
Sensors Quantity ASP/Unit ($) Quantity ASP/Unit ($) Quantity ASP/Unit ($) Quantity ASP/Unit ($) Quantity ASP/Unit ($)
Antennas 20 $5 20 $5 20 $5 20 $5 20 $5
Cameras (Front) 1 $40 3 $30 3 $27 3 $24 3 $20
Cameras (Rear) 1 $30 0 $0 0 $7,162 0 $0 0 $0
Cameras (In-Cabin Driver) 0 $0 0 $0 1 $20 1 $30 1 $25
Cameras (Surround) 0 $0 4 $25 4 $20 4 $15 4 $12
Radar Short Range 0 $0 0 $0 4 $43 4 $35 4 $31
Radar Long Range 1 $140 1 $135 1 $105 1 $70 1 $63
LIDAR 0 $0 0 $212 1 $1,500 2 $350 4 $200
Temperature Sensor 0 $0 0 $106 0 $0 1 $290 1 $190
Ultrasonic Sensor 6 $15 8 $15 8 $14 8 $13 8 $11
Other 0 $0 0 $0 0 $0 1 $350 1 $300
Total 29 $400 36 $545 42 $2,170 44 $1,916 1 $1,798
Level 4 Level 5Level 1 Level 2 Level 3
5G and new high-frequency bands require new “smart” technology
Emerging vehicle-to-everything (V2X) communication, real-time software updates crucial
In aggregate, there are 30-40 sensors (~$400 in content) in a car’s physical layer
Typical Level-3 ADAS equipped car will have another ~$2,170 in sensors
Doesn’t account for more advanced approaches (graphics processing units/GPUs)

Over 50% of world’s population now resides in urban areas
Rise in energy consumption, traffic congestion, and crime following increases
5G wireless networks will help enable smart-city solutions
End-result could be reduction in energy usage and improved public safety
0
2,000,000
4,000,000
6,000,000
8,000,000
10,000,000
12,000,000
1950 1975 2000 2025 2050
Total Population Urban Population
~68% Urban Population (United Nations Forecast)
Gap expected to close as urbanization outpaces total
rise in population headcount
~30% Urban Population ~54% Urban Population
Gap w idened, as total population outpaced
urbanization
Source: Department of Economic and Social Affairs of United Nations
Smart Cities – Intelligent Urban Development
31

Smart Cities – Total Addressable Market
32
Low
er G
row
th
Mature Embryonic
Hig
her
Gro
wth
Natural progression following proliferation of
smartphone phone connectivity
$622 billion total market size and growing
Smart city spend in 2018 = $80 billion
Domestic spend = $26 billion
21% CAGR from 2017-2021
EMEA spend = $20 billion
18% CAGR from 2017-2021
Asia-Pacific region = $34 billion
17% CAGR from 2017-2021
Source: IDC

Public Transit Telematics Public transportation that
communicates with destination targets
Data Aggregation Lays the Foundation
Parking Capacity Smart meters that effectively monitor parking availability
V2X Connectivity Cars able to communicate with other cars and
structures to get from point A to B
Energy Management Consumption of each building is
tracked to rationalize where possible
Building Management Motion sensors and meters to have
greater insight into how buildings function
Traffic Monitoring Real-time ability to manage traffic congestion
Smart Street Lights Smart street lighting to optimize
power consumption
Source: Diagram Credit - Shutterstock 33
Law Enforcement and Safety Camera/sensor/meter surveillance for
quicker response to crime or fires

Combination of 5G and smart infrastructure creates economic benefits for municipalities of all sizes
Smart city pilots currently active – over 1,000
Implementation of sensors, meters and cameras help lend insight to how cities operate in real-time
Creates jobs and entire new industries
Focus areas for case study below – energy, public safety and transportation
Saratoga, CA Beaumont, TX Metro Chicago, IL TotalBenefits 29.9K Pop. 118K Pop. 90K Pop. Combined
Jobs Created 300 1,000 90000 500M
GDP Growth $50M $180M $14B $500B
Total Network Investment $20M $100M $8B $275B
Smart Grid +Transportation $10M $70M $5B NM
Smart City Case Study #1
Source: Accenture
34
Source: www.pixabay.com via www.creativecommons.org

Smart City Case Study #2
Source: Siemens and Smart Grid Image Credit - www.pixabay.com via www.creativecommons.org
Total Energy Benefits $1.9B
Smart Lighting Benefit $135M
Return on Invest. 4X
Payback Per. 7 Yrs.
Energy Savings 20 GWh
City One Aberdeen
City Two Brussels
City Three East London
City Four Alba Iulia
City Five Kartal
35

Questions & Answers
36

Client Services: +1 212.981.1062 [email protected]
Disclosures S&P GLOBAL™ is used under license. The owner of this trademark is S&P Global Inc. or its affiliate, which are not affiliated with CFRA Research or the author of this content. The content of this Presentation and the opinions expressed herein are those of CFRA based upon publicly-available information that CFRA believes to be reliable but are subject to change without notice. This Presentation has not been submitted to, nor received approval from, the United States Securities and Exchange Commission or any other regulatory body. While CFRA exercised due care in compiling this Presentation, CFRA AND ALL RELATED ENTITIES SPECIFICALLY DISCLAIM ALL WARRANTIES, EXPRESS OR IMPLIED, to the fullest extent permitted by law, regarding the accuracy, completeness, or usefulness of the information contained herein and assumes no liability with respect to the consequences of relying on this information for investment or other purposes. No content herein (including ratings, credit-related analyses and data, valuations, model, software or other application or output therefrom) or any part thereof may be modified, reverse engineered, reproduced or distributed in any form by any means, or stored in a database or retrieval system, without the prior written permission of CFRA. This Presentation shall not be used for any unlawful or unauthorized purposes. CFRA and its third-party providers, as well as its and their directors, officers, shareholders, employees or agents, do not guarantee the accuracy, completeness, timeliness or availability of this Presentation. CFRA's primary financial data provider is S&P Global Market Intelligence. THIS DOCUMENT CONTAINS COPYRIGHTED AND TRADE SECRET MATERIAL DISTRIBUTED UNDER LICENSE FROM S&P GLOBAL MARKET INTELLIGENCE. FOR RECIPIENT'S INTERNAL USE ONLY. Certain information in this presentation is provided by S&P Global, Inc. and/or its affiliates and subsidiaries (collectively “S&P Global”). Such information is subject to the following disclaimers and notices: “Copyright © 2018, S&P Global Market Intelligence (and its affiliates as applicable). All rights reserved. Nothing contained herein is investment advice and a reference to a particular investment or security, a credit rating or any observation concerning a security or investment provided by S&P Global is not a recommendation to buy, sell or hold such investment or security or make any other investment decisions. This may contain information obtained from third parties, including ratings from credit ratings agencies. Reproduction and distribution of S&P Global’s information and third party content in any form is prohibited except with the prior written permission of S&P Global or the related third party, as applicable. Neither S&P Global nor its third party providers guarantee the accuracy, completeness, timeliness or availability of any information, including ratings, and are not responsible for any errors or omissions (negligent or otherwise), regardless of the cause, or for the results obtained from the use of such information or content. S&P GLOBAL AND ITS THIRD PARTY CONTENT PROVIDERS GIVE NO EXPRESS OR IMPLIED WARRANTIES, INCLUDING, BUT NOT LIMITED TO, ANY WARRANTIES OF MERCHANTABILITY OR FITNESS FOR A PARTICULAR PURPOSE OR USE AND ALL S&P INFORMATION IS PROVIDED ON AN AS-IS BASIS. S&P GLOBAL AND ITS THIRD PARTY CONTENT PROVIDERS SHALL NOT BE LIABLE FOR ANY DIRECT, INDIRECT, INCIDENTAL, EXEMPLARY, COMPENSATORY, PUNITIVE, SPECIAL OR CONSEQUENTIAL DAMAGES, COSTS, EXPENSES, LEGAL FEES, OR LOSSES (INCLUDING LOST INCOME OR PROFITS AND OPPORTUNITY COSTS OR LOSSES CAUSED BY NEGLIGENCE) IN CONNECTION WITH ANY USE OF THEIR INFORMATION OR CONTENT, INCLUDING RATINGS. Credit ratings are statements of opinions and are not statements of fact or recommendations to purchase, hold or sell securities. They do not address the suitability of securities or the suitability of securities for investment purposes, and should not be relied on as investment advice.” CFRA, CFRA Accounting Lens, CFRA Legal Edge, CFRA Score, and all other CFRA product names are the trademarks, registered trademarks, or service marks of CFRA or its affiliates in the United States and other jurisdictions. CFRA Score may be protected by U.S. Patent No. 7,974,894 and/or other patents. Copyright © 2018 CFRA. All rights reserved. This Presentation is published and originally distributed by Accounting Research & Analytics, LLC d/b/a CFRA (“CFRA US”), with the following exceptions: In the UK/EU/EEA, it is published and originally distributed by CFRA UK Limited (company number 08456139 registered in England & Wales with its registered office address at PO Box 698, Titchfield House, 69-85 Tabernacle Street, London, EC2A 4RR, United Kingdom, which is regulated by the Financial Conduct Authority (No. 775151), and in Malaysia by CFRA MY Sdn Bhd (formerly known as Standard & Poor’s Malaysia Sdn Bhd) Company No. 683377-A and regulated by Securities Commission Malaysia, No. CMSL/A0181/2007 (“CFRA Malaysia”). CFRA Malaysia is a wholly-owned subsidiary of CFRA US. These parties and their subsidiaries maintain no responsibility for CFRA reports or materials redistributed by third parties such as brokers or financial advisors.
37

Disclosures, continued. Past performance is not necessarily indicative of future results. This Presentation may contain forward-looking statements or forecasts; such forecasts are not a reliable indicator of future performance. This Presentation is not intended to, and does not, constitute an offer or solicitation to buy and sell securities or engage in any investment activity. This Presentation is for informational purposes only. Recommendations in this Presentation are not made with respect to any particular investor or type of investor. Securities, financial instruments or strategies mentioned herein may not be suitable for all investors and this material is not intended for any specific investor and does not take into account any investor's particular investment objectives, financial situations or needs. Before acting on any recommendation in this material, you should consider whether it is suitable for your particular circumstances and, if necessary, seek professional advice. Additional information on a subject company may be available upon request. The Global Industry Classification Standard (GICS®) was developed by and/or is the exclusive property of MSCI, Inc. and S&P Global Market Intelligence. GICS is a service mark of MSCI and S&P Global Market Intelligence and has been licensed for use by CFRA. Any portions of the fund information contained in this Presentation supplied by Lipper, A Thomson Reuters Company, are subject to the following: “Copyright 2018 © Thomson Reuters. All rights reserved. Lipper shall not be liable for any errors or delays in the content, or for any actions taken in reliance thereon.” Copyright © 2018 CFRA. All rights reserved. CFRA and STARS are registered trademarks of CFRA.
38