Aneesh T P et al. IRJP 2011, 2 (12), 179-182 INTERNATIONAL
4
Aneesh T P et al. IRJP 2011, 2 (12), 179-182 INTERNATIONAL RESEARCH JOURNAL OF PHARMACY, 2(12), 2011 INTERNATIONAL RESEARCH JOURNAL OF PHARMACY ISSN 2230 – 8407 Available online www.irjponline.com Research Article METHOD DEVELOPMENT AND VALIDATION FOR THE ESTIMATION OF FLUPIRTINE MALEATE IN BULK AND PHARMACEUTICAL DOSAGE FORMS USING UV-VIS SPECTROPHOTOMETRY Amal D, Aneesh T P* Amrita School of Pharmacy, Amrita Vishwavidyapeetham University, AIMS Health Science Campus, Kochi, Kerala, India Article Received on: 18/10/11 Revised on: 09/11/11 Approved for publication: 17/12/11 *Email: [email protected] ABSTRACT The present study describes a simple, accurate, precise and cost effective UV-VIS Spectrophotometric method for the estimation of Flupirtine an analgesic drug in bulk and pharmaceutical dosage form. The solvent used is methanol and the λ max or the absorption maxima of the drug was found to be 250nm. A linear response was observed in the range of 5-50μg/ml with regression coefficient of 0.997 and linear equation of y = 0.045x+ 0.004. The method was then validated for different parameters as per ICH guidelines. This method can be used for the determination of Flupirtine in quality control of formulation without interference of the excipient KEYWORDS: Flupirtine maleate, ICH, UV-VIS Spectroscopy. INTRODUCTION Flupirtine maleate is a non opioid centrally – acting, structurally dissimilar from other analgesics. It is pyridine derivative with the chemical name of ethyl 2amino 6(4-flurobenzylamino) 3- pyridylcarbamate maleate Fig (1). Flupirtine is a unique centrally- acting, non opioid analgesic with muscle relaxant and neuro protective properties 1 . The analgesic effect of flupirtine is dose related. It appears to work by suppressing pain perception transmission to the brain and spinal cord through stimulation of descending monoaminergic pathways. It is a prototype of a class of agents known as selective neuronal potassium channel opener (SNEPCO).Activates G- protein- coupled inwards acting K+ channels of the nerve cell. Due to the selective opening of the voltage-independent k+ channel resting potential of the nerve cell stabilizes, so the activation of the nerve cell membrane reduced. Flupirtine also indirectly acts as N-methyl-D-aspartate (NMDA) – antagonist 2 . Flupirtine is indicated for the treatment of acute and chronic pain, for painful increased muscle tone of the posture and motor muscle, primary head ace, tumor pain dysmenorrheal and pain after traumatologic/ orthopedic operations and injuries. No UV-VIS spectrophotometric method was proposed for the estimation of flupirtine in bulk and pharmaceutical dosage forms. The aim of the work is to develop and validate an analytical method using UV-VIS spetrophotometry for the estimation of flupirtine maleate in bulk and pharmaceutical dosage forms. FIGURE 1. Structure of flupirtine maleate MATERIALS AND METHODS Flupirtine maleate was obtained as a gift sample. The solvent used was methanol. The instrument used was a double beam UV-VIS spectrophotometer (uv-1800, shimadzu). METHOD DEVELOPMENT Solubility Test: solubility test for the drug flupirtine maleate was performed by various solvents. The solvents include Water, methanol, DMSO, methanol, ethanol and chloroform. However methanol was chosen as a solvent for developing the method. Determination of λmax Preparation of stock solution: Standard stock solution of flupirtine maleate prepared by dissolving 10mg of flupirtine maleate in methanol to produce a concentration of 1000μg/ml. 1ml of this stock solution was taken then diluted up to 10ml by using methanol to produce a concentration of 100μg/ml which is the standard stock solution. From the above stock solution, 2ml was pipette out into a 10ml volumetric flask and the volume was made up to the mark with methanol to prepare a concentration of 20μg/ml. Then the sample was scanned in UV-VIS Spectrophotometer in the range 400-200nm using methanol as a blank and the wave length corresponding to maximum absorbance (λmax) was found to be 250nm (Fig 2). FIGURE 2. λmax of flupirtine maleate Preparation of calibration curve: 0.5ml, 1ml, 2ml, 3ml, 4ml, 5ml of 100ug/ml solution was diluted to 10ml using methanol to produce 5µg/ml, 10μg/ml, 20μg/ml, 30μg/ml, 40μg/ml, 50μg/ml solutions respectively. Then the construction of calibration curve was done by taking the above prepared solutions of different concentration ranging from 5-50μg/ml. Calibration curve was plotted by taking concentration on x-axis and absorbance on y-axis. The curve showed linearity in the concentration range of 5-50μg/ml, the correlation coefficient was found to be 0.997 (Fig 3).
Transcript of Aneesh T P et al. IRJP 2011, 2 (12), 179-182 INTERNATIONAL
Aneesh T P et al. IRJP 2011, 2 (12), 179-182
INTERNATIONAL RESEARCH JOURNAL OF PHARMACY, 2(12), 2011
INTERNATIONAL RESEARCH JOURNAL OF PHARMACY ISSN 2230 – 8407 Available online www.irjponline.com Research Article
METHOD DEVELOPMENT AND VALIDATION FOR THE ESTIMATION OF FLUPIRTINE MALEATE
IN BULK AND PHARMACEUTICAL DOSAGE FORMS USING UV-VIS SPECTROPHOTOMETRY Amal D, Aneesh T P*
Amrita School of Pharmacy, Amrita Vishwavidyapeetham University, AIMS Health Science Campus, Kochi, Kerala, India
Article Received on: 18/10/11 Revised on: 09/11/11 Approved for publication: 17/12/11
*Email: [email protected] ABSTRACT The present study describes a simple, accurate, precise and cost effective UV-VIS Spectrophotometric method for the estimation of Flupirtine an analgesic drug in bulk and pharmaceutical dosage form. The solvent used is methanol and the λ max or the absorption maxima of the drug was found to be 250nm. A linear response was observed in the range of 5-50μg/ml with regression coefficient of 0.997 and linear equation of y = 0.045x+ 0.004. The method was then validated for different parameters as per ICH guidelines. This method can be used for the determination of Flupirtine in quality control of formulation without interference of the excipient KEYWORDS: Flupirtine maleate, ICH, UV-VIS Spectroscopy. INTRODUCTION Flupirtine maleate is a non opioid centrally – acting, structurally dissimilar from other analgesics. It is pyridine derivative with the chemical name of ethyl 2amino 6(4-flurobenzylamino) 3-pyridylcarbamate maleate Fig (1). Flupirtine is a unique centrally- acting, non opioid analgesic with muscle relaxant and neuro protective properties1. The analgesic effect of flupirtine is dose related. It appears to work by suppressing pain perception transmission to the brain and spinal cord through stimulation of descending monoaminergic pathways. It is a prototype of a class of agents known as selective neuronal potassium channel opener (SNEPCO).Activates G- protein- coupled inwards acting K+ channels of the nerve cell. Due to the selective opening of the voltage-independent k+ channel resting potential of the nerve cell stabilizes, so the activation of the nerve cell membrane reduced. Flupirtine also indirectly acts as N-methyl-D-aspartate (NMDA) – antagonist2. Flupirtine is indicated for the treatment of acute and chronic pain, for painful increased muscle tone of the posture and motor muscle, primary head ace, tumor pain dysmenorrheal and pain after traumatologic/ orthopedic operations and injuries. No UV-VIS spectrophotometric method was proposed for the estimation of flupirtine in bulk and pharmaceutical dosage forms. The aim of the work is to develop and validate an analytical method using UV-VIS spetrophotometry for the estimation of flupirtine maleate in bulk and pharmaceutical dosage forms.
FIGURE 1. Structure of flupirtine maleate
MATERIALS AND METHODS Flupirtine maleate was obtained as a gift sample. The solvent used was methanol. The instrument used was a double beam UV-VIS spectrophotometer (uv-1800, shimadzu). METHOD DEVELOPMENT Solubility Test: solubility test for the drug flupirtine maleate was performed by various solvents. The solvents include Water, methanol, DMSO, methanol, ethanol and chloroform. However methanol was chosen as a solvent for developing the method.
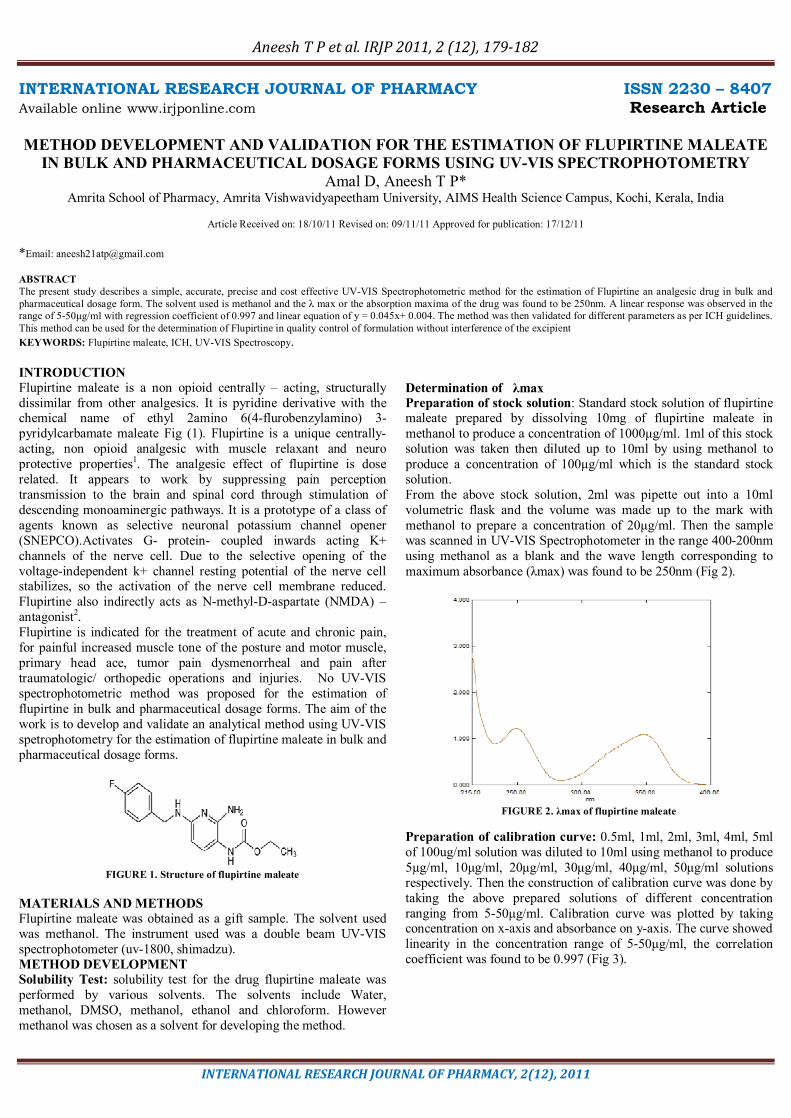
Determination of λmax Preparation of stock solution: Standard stock solution of flupirtine maleate prepared by dissolving 10mg of flupirtine maleate in methanol to produce a concentration of 1000μg/ml. 1ml of this stock solution was taken then diluted up to 10ml by using methanol to produce a concentration of 100μg/ml which is the standard stock solution. From the above stock solution, 2ml was pipette out into a 10ml volumetric flask and the volume was made up to the mark with methanol to prepare a concentration of 20μg/ml. Then the sample was scanned in UV-VIS Spectrophotometer in the range 400-200nm using methanol as a blank and the wave length corresponding to maximum absorbance (λmax) was found to be 250nm (Fig 2).
FIGURE 2. λmax of flupirtine maleate
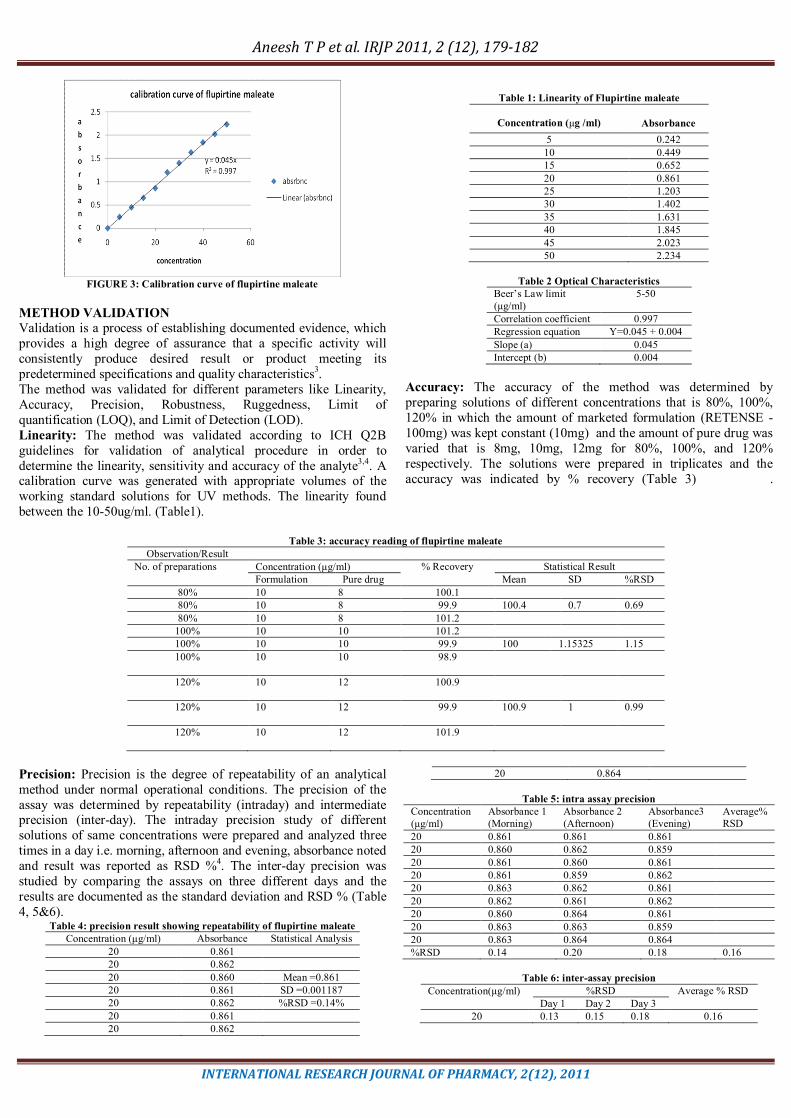
Preparation of calibration curve: 0.5ml, 1ml, 2ml, 3ml, 4ml, 5ml of 100ug/ml solution was diluted to 10ml using methanol to produce 5µg/ml, 10μg/ml, 20μg/ml, 30μg/ml, 40μg/ml, 50μg/ml solutions respectively. Then the construction of calibration curve was done by taking the above prepared solutions of different concentration ranging from 5-50μg/ml. Calibration curve was plotted by taking concentration on x-axis and absorbance on y-axis. The curve showed linearity in the concentration range of 5-50μg/ml, the correlation coefficient was found to be 0.997 (Fig 3).
Aneesh T P et al. IRJP 2011, 2 (12), 179-182
INTERNATIONAL RESEARCH JOURNAL OF PHARMACY, 2(12), 2011
FIGURE 3: Calibration curve of flupirtine maleate
METHOD VALIDATION
Validation is a process of establishing documented evidence, which provides a high degree of assurance that a specific activity will consistently produce desired result or product meeting its predetermined specifications and quality characteristics3. The method was validated for different parameters like Linearity, Accuracy, Precision, Robustness, Ruggedness, Limit of quantification (LOQ), and Limit of Detection (LOD). Linearity: The method was validated according to ICH Q2B guidelines for validation of analytical procedure in order to determine the linearity, sensitivity and accuracy of the analyte3,4. A calibration curve was generated with appropriate volumes of the working standard solutions for UV methods. The linearity found between the 10-50ug/ml. (Table1).
Table 1: Linearity of Flupirtine maleate
Concentration (μg /ml)
Absorbance
5 0.242 10 0.449 15 0.652 20 0.861 25 1.203 30 1.402 35 1.631 40 1.845 45 2.023 50 2.234
Table 2 Optical Characteristics
Beer’s Law limit (μg/ml)
5-50
Correlation coefficient 0.997 Regression equation Y=0.045 + 0.004 Slope (a) 0.045 Intercept (b) 0.004
Accuracy: The accuracy of the method was determined by preparing solutions of different concentrations that is 80%, 100%, 120% in which the amount of marketed formulation (RETENSE -100mg) was kept constant (10mg) and the amount of pure drug was varied that is 8mg, 10mg, 12mg for 80%, 100%, and 120% respectively. The solutions were prepared in triplicates and the accuracy was indicated by % recovery (Table 3) .
Table 3: accuracy reading of flupirtine maleate
Observation/Result No. of preparations Concentration (μg/ml) % Recovery Statistical Result
Formulation Pure drug Mean SD %RSD 80% 10 8 100.1 80% 10 8 99.9 100.4 0.7 0.69 80% 10 8 101.2
100% 10 10 101.2 100% 10 10 99.9 100 1.15325 1.15 100% 10 10 98.9
120% 10 12 100.9
120% 10 12 99.9 100.9 1 0.99
120% 10 12 101.9
Precision: Precision is the degree of repeatability of an analytical method under normal operational conditions. The precision of the assay was determined by repeatability (intraday) and intermediate precision (inter-day). The intraday precision study of different solutions of same concentrations were prepared and analyzed three times in a day i.e. morning, afternoon and evening, absorbance noted and result was reported as RSD %4. The inter-day precision was studied by comparing the assays on three different days and the results are documented as the standard deviation and RSD % (Table 4, 5&6).
Table 4: precision result showing repeatability of flupirtine maleate Concentration (μg/ml) Absorbance Statistical Analysis
20 0.861 20 0.862 20 0.860 Mean =0.861 20 0.861 SD =0.001187 20 0.862 %RSD =0.14% 20 0.861 20 0.862
20 0.864
Table 5: intra assay precision Concentration (μg/ml)
Absorbance 1 (Morning)
Absorbance 2 (Afternoon)
Absorbance3 (Evening)
Average% RSD
20 0.861 0.861 0.861 20 0.860 0.862 0.859 20 0.861 0.860 0.861 20 0.861 0.859 0.862 20 0.863 0.862 0.861 20 0.862 0.861 0.862 20 0.860 0.864 0.861 20 0.863 0.863 0.859 20 0.863 0.864 0.864 %RSD 0.14 0.20 0.18 0.16
Table 6: inter-assay precision
Concentration(μg/ml) %RSD Average % RSD Day 1 Day 2 Day 3
20 0.13 0.15 0.18 0.16

Aneesh T P et al. IRJP 2011, 2 (12), 179-182
INTERNATIONAL RESEARCH JOURNAL OF PHARMACY, 2(12), 2011
Specificity: 10mg of flupirtine maleate was spiked with 50% (5mg), 100% (10mg), 150% (15mg) of excipient mix (magnesium stearate) and the sample was analyzed for % recovery (Table 7).
Table 7: Test for specificity showing no effect of excipients Sample No Excipient Conc.
(%) Flupirtine Input (mg)
Flupirtine recovered (mg)
Flupirtine recovered (%)
Mean Recovered (%)
SD %RSD
1 100 10 9.81 98.1 2 50 10 10.05 100.5 100.1% 1.877 1.87% 3 150 10 10.18 101.8
Ruggedness: Analysis was carried out by different analyst in order to determine the ruggedness and the respective absorbance was noted and the result was indicated as% RSD (Table 8).
Table 8: Result showing Ruggedness
Analyst -1
Conc.(μg/ml) Absorbance Statistical analysis 20 0.861 20 0.861 Mean – 0.8606 20 0.862 SD – 0.00103 20 0.859 %RSD – 0.12% 20 0.860 20 0.861 Analyst -2
Conc.(μg/ml) Absorbance Statistical analysis 20 0.861 20 0.862 Mean – 0.860 20 0.861 SD – 0.0009 20 0.859 %RSD – 0.11% 20 0.861 20 0.861
Robustness: Analysis was carried out at two different temperatures ie, room temperature and 18°c to determine the robustness and the respective absorbance were noted and the result were indicated as% RSD (Table9).
Table 9: Result showing Robustness
Room temperature Conc.(μg/ml) Absorbance Statistical analysis 20 0.861 20 0.863 Mean – 0.8616 20 0.862 SD – 0.00136 20 0.859 %RSD – 0.16% 20 0.862 20 0.861 Temperature 18°c 20 0.861 20 0.862 Mean -0.861 20 0.863 SD-0.0015 20 0.859 %RSD-0.17% 20 0.862 20 0.861
LOD and LOQ: The limit of detection (LOD) is defined as the lowest concentration of an analyte in the sample that can be detected. The limit of quantification (LOQ) is defined as the lowest concentration of the standard curve that can be measured with an acceptable accuracy, precision and variability4.5. In this study, LOD and LOQ were based on the standard deviation of the response and the slope of the corresponding curve using the following equations-
LOD = 3 s/m; LOQ = 10 s/m Where s, the noise of estimate, is the standard deviation of the absorbance of the sample and m is the slope of the related calibrations graphs. The values of LOD and LOQ are found to be 0.5µg/ml and 1.55µg/ml respectively (Table 10). RESULT AND DISCUSSION The development of a simple, rapid, sensitive and accurate analytical method for the quantitative determination of samples will reduce
unnecessary tedious sample preparations and the cost of materials and labor. Flupirtine is a UV absorbing molecule with specific chromophores in the structure that absorb at a particular wavelength. The λmax of the drug for analysis was determined by scaning of the drug sample solutions in the entire UV region. It was found to be that maximum absorbance observed at the wavelength of 250nm (fig 2). The developed method was found to be precise as the %RSD values for the intra-day and inter-day was found to be less than 2%. Recoveries of the drug were obtained at 98.1%-101.8%, indicating the method was accurate and specific. The LOD and LOQ were found to be in sub microgram level indicating the sensitivity of the method. The method was also found to be rugged and robust as indicated by the %RSD values which are less than 2%. The summary of validation parameters of proposed method is shown in table 10.

Aneesh T P et al. IRJP 2011, 2 (12), 179-182
INTERNATIONAL RESEARCH JOURNAL OF PHARMACY, 2(12), 2011
Table 10:Summary of validation
Parameters Values Linearity Range 10-50
Precision(%) 0.16% Accuracy(%) 98.9-101.9% LOD(μg/ml) 0.5 LOQ(μg/ml) 1.55 Stability (h) 2
Std deviation(SD) 0.6314 %RSD 55.13
CONCLUSION All the above factors lead to the conclusion that the proposed method is accurate, precise, simple, sensitive, robust and cost effective and can be applied successfully for the estimation of flupirtine maleate in bulk and pharmaceutical dosage formulations.
REFERENCES 1. Karen Methling, et al Investigation of the in vitro metabolism of aanalgesic
flupirtine, The American Society for Pharmacology and Experimental Therapeutics, 2008 pp 1-49.
2. Available from url http://www.drug2day.com/index.php/drug/display/27971 (accessed on 12/10/2011).
3. ICH, Q2 (R1) Validation of analytical procedures: text and methodology, international conference on harmonization: Nov.1996
4. International Conference of Harmonization (ICH) of Technical Requirements for the Registration of Pharmaceuticals for Human Use, Validation of Analytical Procedures: Methodology, Adopted in Geneva (1996).
5. F.W. Fifield and D. Kealey, 5 Edition, Black Well Science Ltd. Principles and Practice of Analytical Chemistry, (2000) pp. 270 – 276.
6. J. Vessman, Selectivity or Specificity? Validation of Analytical Methods from the Perspective of an Analytical Chemist in the Pharmaceutical Industry, J. Pharm and Biomed. Anal., 14, 867 – 869 (1996).
7. G.C. Hokanson, A Life Cycle Approach to the Validation of Analytical Methods During Pharmaceutical Product Development, Part – II: Changes and the Need for Additional Validation, Pharm. Tech., 92 -100 (1994).
8. Xiaoyan Chen, Dafang zhong, Simultaneous determination of flupirtine and its major active metabolite in human plasma by liquid chromatography–tandem mass spectrometry, Journal of Chromatography B: Biomedical Sciences and Applications Volume 755, Issues 1-2, 5 May 2001, Pages 195-202.
Source of support: Nil, Conflict of interest: None Declared