
ANE LECTEDB ODYO FT HEF ACULTYO FAR TSAN DS CEINCES...
98
FAS Senate ANELECTEDBODY OF THE FACULTY OF ARTS ANDSCIENCES YALE UNIVERSITY Report on Faculty Diversity and Inclusivity in FAS APPROVEDBY THE SENATE FORDISTRIBUTIONTOTHE FACULTY ANDTHE UNIVERSITY MAY 19, 2016 Committee: Emily Greenwood (Chair), Pro ⇧ essor, Classics Beverly Gage, Pro ⇧ essor, History John Harris, Pro ⇧ essor, Physics MatthewJacobson, Pro ⇧ essor, A ⇧ rican American Studies, American Studies Reina Maruyama, Assistant Pro ⇧ essor, Physics Doug Rogers, Associate Pro ⇧ essor, Anthropology Charles Schmuttenmaer, Pro ⇧ essor, Chemistry Vesla Weaver, Associate Pro ⇧ essor, Political Science, A ⇧ rican American Studies
Transcript of ANE LECTEDB ODYO FT HEF ACULTYO FAR TSAN DS CEINCES...
FAS SenateAN ELECTED BODY OF THE FACULTY OF ARTS AND SCIENCES
YALE UNIVERSITY
Report on Faculty Diversityand Inclusivity in FAS
APPROVED BY THE SENATE
FOR DISTRIBUTION TO THE FACULTY AND THE UNIVERSITY
MAY 19, 2016
Committee:
Emily Greenwood (Chair), Pro⇧essor, Classics
Beverly Gage, Pro⇧essor, History
John Harris, Pro⇧essor, Physics
Matthew Jacobson, Pro⇧essor, A⇧rican American Studies, American Studies
Reina Maruyama, Assistant Pro⇧essor, Physics
Doug Rogers, Associate Pro⇧essor, Anthropology
Charles Schmuttenmaer, Pro⇧essor, Chemistry
Vesla Weaver, Associate Pro⇧essor, Political Science, A⇧rican American Studies
Report on Faculty Diversity and Inclusivity in FASFAS Senate, Ad Hoc Committee on the Diversity and Inclusivity
Approved by the FAS SenateMay 19, 2016
TABLE OF CONTENTS
I Introduction............................................................................................................3
II Recommendations...................................................................................................5
III ‘Doing diversity’ at Yale and other universities........................................................9
IV History o4 e5orts to increase diversity and inclusivity at Yale.................................14
V Underrepresented minority and women 4aculty: hiring patterns and trajectories...23
VI Findings o4 the FAS senate survey on 4aculty diversity and inclusivity...................35
VII Impact o4 diversity and inclusivity in FAS on graduate students............................53
VIIIConclusion............................................................................................................60
Acknowledgements...............................................................................................61
Appendices:
1 Views o4 Female and URM Faculty in the Physical and Biological Sciences...........62
2 Data Tables............................................................................................................73
FAS Senate – Report on Faculty Diversity and Inclusivity in FAS – page 2

I. INTRODUCTION
Yale is at a critical juncture: how should the university respond to recent reminders o4 the
troubling disconnect between the ideals o4 its educational mission and the varieties o4
exclusion that students, 4aculty, and sta5 variously experience in their work at Yale? A
world-leading university whose motto proclaims light and truth can ill a5ord divisions
along lines o4 gender, race, ethnicity, sexuality, and class, which threaten to undermine
the open exchange o4 knowledge. We have written this report in the belie4 that Yale can
and should take a leading national and international role in placing diversity and
inclusivity at the heart o4 the university in the twenty-first century.1
At a meeting o4 the Senate on January 28, 2016, the Senate voted to create an ad hoc
committee to study and report on the state o4 4aculty diversity and inclusivity in FAS. As
an elected, representative body 4or all 4aculty in FAS, it was 4elt that the Senate is well
placed to build upon past 4aculty e5orts to promote diversity and inclusivity. The
committee’s charge included the preparation o4 a report to be presented to the Senate by
the end o4 the Spring semester in 2016.
While the Senate, which was inaugurated in Fall 2015, is a new venture 4or Yale’s FAS,
e5orts to promote diversity and inclusivity in Yale’s academic community are not. In the
course o4 researching this report we have been reminded o4 the vast time, care, and
expertise that members o4 the FAS and the university’s administration have committed to
making our intellectual community more diverse and inclusive, 4rom the composition o4
the 4aculty to the content o4 the curriculum. We benefited 4rom excellent, existing reports
authored by 4aculty colleagues going back decades. We cite many o4 these reports in
section IV (‘History o4 e5orts to increase diversity and inclusivity at Yale’). Since its
inception in 2001, Yale’s Women Faculty Forum (WFF) has continuously monitored and
presented statistics o4 women and minority 4aculty at Yale and worked 4or a more
inclusive climate. But there are also reports and e5orts that have gone under the radar,
and 4aculty who have tirelessly advocated 4or greater inclusion and who have given
countless hours to diversity work at Yale, visible and invisible. This work has been
responsible 4or pro4ound changes and shiCs in the culture o4 the university. We are also
4ortunate to have colleagues, past and present, whose scholarship has been instrumental
4or the critical theories o4 diversity that we take 4or granted today. In short, that we can
write this report at all is a testament to the work o4 others. But there is 4rustration in this
insight, too. Many o4 the recommendations that we make in this report, and many o4 the
points that we make about challenges to diversity and inclusivity in FAS have been made
1 We note that President Salovey ended his letter to the Yale community on 27th April 2016 with the sentence: “We will create on our campus the most inclusive educational environment in the world, so that all who join our university community understand—and are enabled to take the 4ullest advantage o4—everything that Yale o5ers.”
FAS Senate – Report on Faculty Diversity and Inclusivity in FAS – page 3

in previous reports. In many cases recommendations were ignored, or accepted without
suGcient structures in place to ensure their long-term sustainability. We deplore these
missed opportunities.
Our report begins with overarching recommendations that have emerged out o4 our
discussions as a committee and wide consultation within FAS — not least the survey on
4aculty diversity and inclusivity in FAS (section VI below). More specific
recommendations are contained within individual sections. Where recommendations are
o4 particular interest to colleagues with particular mentoring responsibilities (4or
instance, department and program chairs and DGSes), we will produce accessible
summaries o4 relevant in4ormation and circulate them once this report is approved by the
FAS Senate.
A 4ew caveats be4ore we proceed to the main body o4 the report: the terms “diversity” and
“inclusivity” suggest an all-encompassing scope that a report like this cannot hope to
attain. We make no claim to comprehensiveness; instead, we have 4ocused on 4orms o4
under-representation within the 4aculty o4 FAS 4or which we have clear and statistically
significant data: namely gender, race, and ethnicity. Where possible, we have tried to take
into account the intersection o4 these categories with sexuality, age, and class, but an
adequate, 4ully inclusive discussion o4 diversity and inclusivity in FAS would need to go
much 4urther. Furthermore, there are two important aspects o4 diversity and inclusivity
that barely figure in this report and which we would like to flag 4or 4uture investigation:
disability issues and the structural inequalities built into the divide in FAS between
“ladder” and “non-ladder” 4aculty. In addition, 4uture reports could include religion and
political ideology as dimensions o4 diversity and inclusivity among the 4aculty. We also
note a distinction between 4ederally mandated guidelines on populations that are under-
represented in Higher Education (URMs), minority 4aculty who are not recognized as
‘URMs’, and Yale’s diverse international 4aculty who contribute richly to diversity in FAS
and who may also experience 4orms o4 exclusion.
Given the time constraints on the committee’s work, we have 4ocused our e5orts in areas
where we could make new contributions: a revised history and discursive timeline; new
data on patterns and trajectories 4or minority and women 4aculty in FAS; a climate survey
on inclusivity in history in FAS; an analysis o4 the impact o4 diversity and inclusivity in
FAS on graduate students, and where we could take advantage o4 the expertise o4
members o4 the committee who are already engaged in working with colleagues on the
challenges to diversity and inclusivity in the Sciences. It goes without saying that this
report is a contribution to an ongoing conversation, intended to give the FAS a cross and
inter-divisional voice in what has been a critical year 4or the progress o4 diversity and
inclusivity at Yale.
FAS Senate – Report on Faculty Diversity and Inclusivity in FAS – page 4
Lastly, a note on style: it is the view o4 this committee that intellectual pluralism is a key
element o4 diversity in Higher Education. For this reason, we have not tried to synthesize
our prose into academic committee-speak. Members o4 the committee speak in di5erent
voices, reflecting our diverse academic backgrounds and training. This heterogeneity is
one o4 the core strengths o4 the university.
II. RECOMMENDATIONS
The Senate’s Ad Hoc Committee on diversity and inclusivity in FAS makes the 4ollowing
recommendations:
1. Yale should set the goal o- becoming an acknowledged leader among its peers in -ostering diversity in its curriculum and in the composition o- its -aculty. This commitment to diversity must be matched by e2orts to make our university communitya model o- inclusion. Although this report draws attention to no small numbers o4 areas in need o4 significant
overhaul, we also point to many positive experiences, past and present successes, and
reasons 4or cautious optimism. Our committee believes that Yale has the resources,
experience, resolve, and support 4rom its 4aculty to make this a realistic goal.
2. The University leadership should reinvigorate the success-ul policies o- the 1996–2006 era, establishing specific numerical goals -or the hiring o- URM -aculty and women -aculty in FAS departments and programs where they are underrepresented. We call on the Provost’s o7ce to allocate -urther -unds so that the FAS can meet these goals. This initiative should place equal emphasis on 4ostering an inclusive climate and 4aculty
retention, which were neglected in previous policies.
3. The university leadership (the president, provost, deans, and divisional directors) must articulate a cogent vision -or the intellectual value o- diversity and inclusivity and a clearly stated plan o- action.While the report identifies microclimates in individual departments and programs as
critical 4or inclusivity, leadership on diversity and inclusivity needs to come 4rom the
university and FAS leadership. Without clear support, direction, and resources 4or
departments and programs, the current diversity initiative will 4ail to deliver lasting
change.
FAS Senate – Report on Faculty Diversity and Inclusivity in FAS – page 5
4. Policies to improve diversity and inclusivity in FAS should take a syncretic approach,recognizing that inclusivity and climate, curricular diversity, creating a pipeline o- diverse scholars, -aculty recruitment, and -aculty retention are all interrelated. In addition to setting general goals, policies, and recommendations, FAS leadership
should work with department chairs and program chairs to develop divisional,
departmental, and field-specific best practices 4or diversity-related issues.
5. The FAS administration should organize a regular review o- diversity and inclusivityin FAS, with a view to monitoring progress made on stated goals. This review process should include: (a) the publication o4 data on 4aculty diversity in
FAS, overall and by division; this should include tabulation / graphs showing trends; (b)
the publication o4 data on promotion, tenure, and retention so that 4aculty can analyze
trends in Yale’s success / 4ailure in supporting the careers o4 younger scholars, with
particular attention to women, URM, and minority 4aculty; (c) the collection o4 data on
promotion, tenure, and retention by FAS department; (d) a survey o4 all FAS 4aculty in
order to glean qualitative in4ormation about how 4aculty experience the climate in FAS,
both at the divisional and departmental level; and (e) an evaluation o4 whether research
4unds, hiring and retention packages, teaching and research prizes, and other 4aculty
resources and distinctions are 4airly and equitably allocated.
6. In addition, the FAS administration should maintain a dashboard* o- per-ormance indicators -or -aculty diversity and inclusivity in FAS, with a clear profile o- -aculty broken down according to relevant diversity indicators.This dashboard should be available online in a prominent location and there should be a
link to the dashboard 4rom relevant Yale websites.
* We note that the Diversity Summit report o4 02/14 suggested a dashboard
(recommendation no. 5, page 19).
7. The Provost’s o7ce should release a transparent breakdown o- how -unds -or the diversity initiative announced in November 2015 have been allocated to di2erent units o- the university. As a committee o4 the FAS Senate, we are concerned that there has been no clear
statement o4 the portion o4 4unds in the Provost’s Faculty Development Fund ($25
million) that have been allocated to FAS. At the moment the process 4or applying and
allocating 4unds is inscrutable. In various di5erent 4orums, 4aculty have been instructed to
apply to the Deputy Provost 4or Diversity, but no explicit guidelines 4or applications or
criteria 4or disbursing these 4unds have been published. This kind o4 piecemeal approach
does not reassure 4aculty about the oversight o4 the diversity initiative.
FAS Senate – Report on Faculty Diversity and Inclusivity in FAS – page 6
8. Working closely with department and program chairs, the FAS administration should strive toward a truly inclusive diversity strategy, which recognizes that -aculty diversity takes many di2erent -orms. Although this report 4ocuses on diversity o4 gender, race, and ethnicity, we point out that
diversity comes in many 4orms, including sexuality, age, class, disability, and nationality.
9. While implicit / unconscious bias are key aspects o- any diversity strategy, the university should broaden current strategies -or talking about the challenges o- diversity and inclusivity. Our committee is convinced that tackling Yale’s recent diversity problems requires just as
much attention to structural, administrative, budgetary and leadership matters as it does
to matters o4 implicit or unconscious bias. Over time, a disproportionate emphasis on
implicit / unconscious bias may inadvertently alienate under-represented 4aculty, as it
does not help in tackling other systemic 4orms o4 bias and challenges to inclusion 4aced by
URM / minority / women / LGBTQ / disabled 4aculty.
10. Leaders in FAS, -rom the FAS Dean to department and program chairs, should pay as much attention to the retention o- URM, minority, women, and other underrepresented -aculty and to -ostering a more inclusive climate as is currently paid to recruitment.
11. Working with department and program chairs, the FAS administration should introduce a transparent system -or tackling the problem o- invisible labor and the tax that diversity work, extensive service, and mentorship, exact on women, URM, and other minority -aculty.The committee notes the high levels o4 supererogatory service undertaken by many
4aculty in FAS and regrets the 4act that there are no 4ormal guidelines in place 4or
recognizing and rewarding heavy service burdens. Within this larger picture, we are
particularly concerned about the phenomenon o4 undocumented, invisible labor, which
4alls disproportionately on women, URM, and other minority 4aculty. URM 4aculty are
e5ectively subject to a diversity tax, whereby diversity work 4requently takes them away
4rom their research, and puts additional pressures on their teaching and other 4orms o4
academic engagement. One o4 the side e5ects o4 a diversity initiative, such as the one
launched in November 2015, is to create significant amounts o4 extra diversity work 4or
URM 4aculty and 4aculty who work in interdisciplinary fields that study ethnicity, gender,
race, and sexuality.
FAS Senate – Report on Faculty Diversity and Inclusivity in FAS – page 7

12. The University leadership should take seriously the shortcomings in its parental policies -or -aculty identified in the recent Senate report (March 10, 2016). The University leadership should ensure that 4aculty with young children have access to
adequate and a5ordable childcare. These shortcomings pose important barriers to
inclusivity in FAS.
13. In addition to distinction in research and teaching, the criteria used in selecting theFAS leadership and department chairs should include a track-record o- -ostering diversity and a more inclusive climate within their department, and an excellent record o- mentoring younger scholars.[See recommendation 3 o4 the Diversity Summit Report o4 02/14 (p. 18): “I4 diversity is
a priority 4or Yale, then individuals considered 4or leadership appointments and
reappointments should be assessed on the basis o4 their ability to lead in this area as well
as others.”]
14. Divisional Advisory committees responsible -or promotion and tenure decisions should be composed with a view to intellectual diversity. Care should be taken to ensure that there is a good balance o4 scholars who have expertise
in traditional disciplines and the inter-disciplines that have emerged in the academy in the
past sixty years. In addition, such committees should comprise scholars o4 diverse
backgrounds.
15. When -aculty who teach in underrepresented fields are promoted to major administrative positions, which e2ectively take them out o- their departments and out o- the classroom, their departments should receive resources to replace lost teaching, sothat the diversity o- the curriculum does not su2er. In such cases, departments should be given permission to recruit visiting 4aculty in this
field at a level commensurate with the expertise o4 the teaching that the department has
lost.
16. In consultation with department and program chairs, the FAS leadership should consider the creation o- prestigious, competitive, named postdoctoral -ellowships to increase the pipeline o- women, URM, and minority scholars in fields where they are under-represented and to bring even greater intellectual diversity to FAS.Departments and programs might bid 4or these 4ellowships in an annual competition.
FAS Senate – Report on Faculty Diversity and Inclusivity in FAS – page 8
17. The Interim Deputy Dean -or Diversity and Faculty Development in FAS (DDDD) should be given a dedicated budget to support initiatives in FAS. Although the initial appointment to this new position is an interim one, the FAS cannot
a5ord to 4all behind with the diversity initiative and will need resources that are targeted
at FAS and overseen by a member o4 4aculty who has oversight o4 diversity initiatives
across FAS.
18. We recommend that the FAS DDDD should review indicators -or -aculty diversity and inclusivity at other universities and, with appropriate consultation, develop a nuanced set o- indicators -or Yale. In addition to the data and trends that we analyze in section V o4 this report, indicators
could include the composition o4 the FAS leadership, holders o4 Sterling pro4essorships,
department chairs, DGSes, DUSes, FAS-wide committee membership, college heads, etc.
19. For the -uture, we envisage that the FAS DDDD will be given a substantial port-olioand budget.We envisage that this port4olio will include, among other things, oversight 4or resources
4or cluster hires and targets o4 eminence; responsibility 4or the retention o4 4aculty o4 color, URMs, and women 4aculty; and liaison with departments and programs that have
lost URM 4aculty.
III. ‘DOING DIVERSITY’ 2 AT YALE AND OTHER UNIVERSITIES
The definition o4 diversity is vexed, and numerous commentators have pointed out that
this is part o4 its allure. While its innocuous name recommends it, the opacity o4 the term
diversity means that evoking this term can be a way o4 avoiding diGcult topics (e.g.
racism, sexism, class bias, homophobia, transphobia, age discrimination, ableism,
religious intolerance, etc.). The term inclusivity is similarly honeyed, and equally prone to
vagueness. In using the terms “diversity” and “inclusivity” we mean to evoke the positive
valuing o4 di5erence and plurality suggested by diversity, and the reach 4or ever-greater
inclusion suggested by inclusivity. An intellectual community that reproduces itsel4 in its
own image is a moribund community that is incapable o4 out-imagining itsel4; a
university that values diversity and inclusivity is the opposite.
One o4 the guiding principles that runs throughout this document is the belie4 that the
renewed 4ocus on diversity and inclusivity 4ollowing student activism on campus in Fall
2 This phrase is widely used in the literature on diversity. See, e.g., the works cited in nn. 6 and 9 below.
FAS Senate – Report on Faculty Diversity and Inclusivity in FAS – page 9
2015 represents a pivotal opportunity 4or improving diversity and inclusivity in FAS. At
the same time, we recognize that ‘opportunities’ are inert unless those with real power to
instigate change at the highest level o4 an institution shape and define the moment in
their oGcial language and documents. Yale’s administration has done this with the
announcement o4 a diversity initiative on Tuesday, November 3, 2015,3 and the
subsequent release o4 the statement ‘Towards a Better Yale’ (released on November 17,
2015).4 But as studies on diversity in educational institutions have shown, to recognize
the exigency o4 a moment is not enough. Much depends on how thought4ully and
expeditiously commitments to diversity and inclusion are put into practice. We make this
point not as a criticism, but to acknowledge that 4aculty in FAS have a shared
responsibility 4or interpreting and implementing the university’s commitment to
diversity. In the past year it has been encouraging to witness the creation o4 several new
departmental Climate and Diversity committees across FAS — this provides a strong
4oundation 4or 4uture work. To take on diversity in the oGcial language o4 the institution
and as part o4 the mission o4 the university is to designate it as a common concern 4or all
who work 4or and benefit 4rom the university. It is in this spirit that we have produced
this report.
On Friday 1st April 2016, approximately 250 4aculty and administrators at Yale attended
a talk on “Hidden Biases: Leadership and Inclusion” by the social psychologist Pro4essor
Mahzarin Banaji. Members o4 this committee who were at the talk were stuck by
Pro4essor Banaji’s challenge to the audience: she pointed out that it is one thing to cast a
critical eye over past institutional practices, but altogether more pertinent to historicize
ourselves and imagine how the university o4 the 4uture will look back on and assess the
state o4 diversity and inclusion in the Yale o4 the present. But we do not even need to
project ourselves into the 4uture to gain this perspective: already the gap between the
diversity o4 the Yale student body, and our much less diverse 4aculty, reveals a yawning
gul4 between the 4aculty and the students whose education is the core rationale 4or our
university. As the next two sections o4 this report illustrate, there is no room 4or
complacency. On the contrary, the FAS has 4allen behind in its academic mission o4
building a 4aculty that is equal to the complex intersectional history o4 the nation (and the
world) in which we live.
Reports such as this do not exist in a vacuum. As we make clear in Section IV below, we
are conscious that this document stands in a chain o4 documents written by colleagues
past and present, which have sought to identi4y inequalities o4 gender and race at Yale and
to suggest policies to redress these inequalities. In turn, these Yale documents are part o4 a
larger national and international literature on diversity and inclusion in higher education.
3 http://president.yale.edu/excellent-4aculty-diverse-4aculty.
4 For 4urther in4ormation see, http://inclusive.yale.edu.
FAS Senate – Report on Faculty Diversity and Inclusivity in FAS – page 10
I4 the mere existence o4 documents were capable o4 improving diversity and inclusivity on
US campuses, there would be no need 4or this report. However, there is now good
research documenting the unintentional ways in which, without a clear, sustainable plan
4or action, diversity initiatives can pose a distraction 4rom the very conditions that they
are meant to address and improve. Sara Ahmed has provided a trenchant critique o4
“diversity as a ‘4eel good’ politics”.5 As a major research university that has access to all o4
these studies in its libraries, Yale cannot a5ord to ignore the expert literature on diversity
and inclusivity, some o4 which is represented in the work o4 its own 4aculty. Taking
diversity seriously means doing this intellectual work, and making sure that it in4orms the
work o4 committees that will design and help to implement policies.
Not to do this critical intellectual work is to run the risk o4 the mere language o4 diversity
standing in 4or genuine institutional trans4ormation. When this happens, diversity can
become a token. As has been well studied, the co-optation o4 diversity as part o4 the
image o4 a university risks the bureaucratization, marketization, and even glossification o4
diversity, in which the conscious inclusion o4 4aculty on grounds o4 their visible di5erence
4rom a prevailing norm risks excluding these very 4aculty.6 In un4oreseen ways, diversity
policies can end up compounding the 4orms o4 hypervisibility and alienation that URM
4aculty experience in society at large. As Sara Ahmed and Elaine Swan ask, ‘How does
being seen as the embodiment o4 diversity e5ect Black and Minority Ethnic sta5?’7
While the data in Section V documents the headcount o4 women and URM 4aculty in
FAS, it does so with a view to getting at underlying trends and patterns that point to
systemic institutional 4actors that may be influencing Yale’s ability to recruit and retain
these groups o4 4aculty. We stress that that the widespread 4ocus on numbers 4or
numbers’ sake misses the point, as such an approach makes tokens out o4 women and
URM 4aculty. To paraphrase Nirmal Puwar, the solution is not to change “organizations
by getting more racialized bodies” into them, but to change organizations so that they are
equally welcoming and supportive o4 all who belong to them, regardless o4 gender, race,
ethnicity, sexuality, religion, and class background.8
In addition to analyzing new data supplied by the OGce o4 Institutional Research, this
report contains the findings o4 a survey on diversity and inclusivity in FAS that we
5 Sara Ahmed On Being Included: Racism and Diversity in Institutional Li⇧e. Duke University Press, 2012, quoting 4rom p. 69. See also Walter Benn Michaels The Trouble with Diversity: How we Learned to Love Identity and Ignore Inequality. Holt and Company, 2006.
6 The terms ‘bureaucratization’ and ‘glossification’ are discussed by Sara Ahmed and Elaine Swan ‘Doing Diversity’ Policy Futures in Education, Vol. 4/2 (2006): 96–100, citing pp. 97–98.
7 Ibid., quoting 4rom p. 98.
8 Nirwal Pumar Space Invaders. Race, Gender and Bodies Out o⇧ Place. Ox4ord, 2004, p. 9. The precise quotation is “The obsession remains with changing organizations (diversi4ying them) by getting more racialised bodies into organizations”.
FAS Senate – Report on Faculty Diversity and Inclusivity in FAS – page 11
circulated to all FAS 4aculty in March 2016. In asking 4aculty to comment on their
experience o4 the state o4 diversity and inclusion at Yale, we hoped to complement the
quantitative data on diversity in the divisions o4 FAS in Section V, with qualitative data
that illuminates the experiences o4 4aculty at a departmental level. We analyze and expand
on the survey responses in Section VI below. For now, we note that the data 4rom the
survey reveals the importance o4 departments and programs 4or the way in which 4aculty
experience the university. These units constitute microclimates that determine the degree
o4 inclusion or exclusion that 4aculty 4eel and the recognition o4 their work among their
peers. As the survey responses and the case-study on the Physical and Biological Sciences
(Appendix 1) make clear, it is also at the departmental level that patterns o4 bias and
exclusion most oCen present themselves. Consequently, in order to succeed, Yale’s
diversity initiative will have to incorporate specific recommendations 4or departments and
programs and 4oster a bottom-up commitment to diversity and inclusivity on the part o4
each and every unit in FAS. As the authors o4 a report on ‘microclimate change’ at Smith
College caution, “Daily behaviors at the level o4 the department can e5ectively undercut
virtually any college-wide initiative.”9
All o4 us on this committee have heard it said on numerous occasions that the barrier to
greater diversity in individual departments is the lack o4 a national pipeline in their
corresponding disciplines. Indeed, this view was expressed in many o4 the responses to
the 4aculty survey and was recognized in the university’s recent announcement o4 an
“Emerging Scholars Initiative” — a partnership between the Graduate School o4 Arts and
Sciences and the OGce o4 the Provost, which builds on existing pipeline programs.10
However, as we show in section VI o4 this report, in too many departments o4 FAS,
4aculty are not working to improve the diversity o4 their discipline at a national level in
terms o4 undergraduate and graduate mentorship and the creation o4 a diverse pipeline o4
4uture scholars. Graduate students in these departments report that lack o4 support and
mentorship 4or women and / or underrepresented students is the norm (section VII
below). I4 we are committed to taking diversity seriously then the work o4 diversi4ying
the academy and making our disciplines accessible and welcoming to all students belongs
to all o4 us and not just to women / URM / LGBTQ 4aculty who currently do a
disproportionate share o4 ‘diversity work’ in FAS.
Our committee regards the phenomena o4 unacknowledged diversity work and invisible
labor as major threats to the retention and flourishing o4 a diverse 4aculty in FAS and the
pro4essional advancement o4 women and URM scholars. This state o4 a5airs undermines
9 ‘Faculty Microclimate Change at Smith College’, Martha Ackelsberg, Jeni Hart, Naomi J. Miller, KateQueeney, and Susan Van Dyne, in Doing Diversity in Higher Education: Faculty Leaders Share Challengesand Strategies, edited by Winni4red R. Brown-Glaude. Rutgers University Press, 2009: 83–102,quoting 4rom p. 84.
10 http://provost.yale.edu/news/emerging-scholars-initiatives-announcement#sthash.QfzGBaHD.dpuf.
FAS Senate – Report on Faculty Diversity and Inclusivity in FAS – page 12

the university’s goals and contributes to attrition among URM 4aculty in particular, as
service work compromises their research productivity and leads to unsustainable teaching
and mentoring commitments. To quote Sara Ahmed again, “the uneven distribution o4
responsibility 4or equality can become a mechanism 4or reproducing inequality.”11 In the
longer term, the solution is 4or a much wider group o4 4aculty in FAS to take shared
responsibility 4or mentoring students 4rom all backgrounds and working together to
make our departments and classrooms more inclusive. I4 we want to retain the under-
represented 4aculty we already have, then this shared ownership o4 diversity work is a
critical imperative. Meanwhile, the FAS Dean’s oGce should put a system in place to
better protect the research time o4 4aculty who do the brunt o4 the work promoting
diversity and inclusivity. One idea would be to consider a system where 4aculty are able to
accrue points 4or mentorship and service work.
We would also like to underscore the importance o4 generous parental support and
childcare provision in building and retaining a diverse 4aculty and promoting greater
inclusion. Here we can only point to the past advocacy o4 Yale’s Women Faculty Forum
(WFF) in this area and rein4orce the argument that questions o4 childcare directly a5ect
the quality and quantity o4 4aculty academic work. While Yale is oCen able to recruit
extraordinary 4aculty, the lack o4 adequate childcare options makes balancing pro4essional
and 4amily responsibilities an ongoing struggle 4or many o4 our 4aculty members. Junior
4aculty constitute a particularly vulnerable community in that regard. Yale leadership
needs to develop a long-term strategy designed to both meet the needs o4 the community
and 4acilitate 4aculty hiring and retention, especially in the context o4 4aculty diversity.
Such a strategy should increase the flexibility o4 services, expand the Yale-aGliated
programs, and subsidize the cost o4 childcare. Support 4or the work-li4e balance o4 4aculty
parents will accrue benefits not only 4or the individual 4aculty members but also 4or Yale
and the larger university community.
While the inclusion o4 4aculty representing gender, ethnic, and racial di5erence is a
prerequisite 4or greater equality, it does not guarantee greater inclusivity or intellectual
diversity. In rejecting a skin-deep approach to diversification and acknowledging that
diversity is not reducible to raced, gendered, and sexed bodies, we still need to ask what
the phrase ‘an excellent 4aculty is a diverse 4aculty’, widely used by the university
leadership, means. How do 4aculty contribute to a more diverse intellectual community
through their research and teaching? As we composed this report, we pondered an irony.
Graduate students and 4aculty who do intersectional research on race, ethnicity, gender,
and sexuality report that their disciplines and research are oCen marginalized within the
larger intellectual constellation o4 FAS.12 In this regard we recognize the creation o4 the
new Center 4or the Study o4 Race, Indigeneity, and Transnational Migration (RITM) as a
11Sara Ahmed On Being Included: Racism and Diversity in Institutional Li⇧e. Duke University Press, 2012, quoting 4rom p. 91.
FAS Senate – Report on Faculty Diversity and Inclusivity in FAS – page 13
very positive development in valuing the critical intellectual diversity that interdisciplines
bring to FAS. I4 these same disciplines / programs / departments were absent, the state o4
diversity and inclusivity in FAS would plunge 4rom bad to abysmal. In other words, the
presence o4 these disciplines masks the low level o4 diversity in traditional academic
disciplines in FAS.
We conclude this introduction by stressing that this committee includes members o4 all
three divisions in FAS, and aGrming our belie4 that the collective resolve, intelligence,
and imagination o4 4aculty in FAS can find creative and e5ective measures 4or improving
diversity and inclusivity. Is it too much to hope that, ten or fiCeen years 4rom now,
researchers o4 the 4uture might read about bold and innovative approaches that were
taken at Yale in 2016–17 and which inspired other universities in turn?13
IV. HISTORY OF EFFORTS TO INCREASE DIVERSITY & INCLUSIVITY AT YALE
Since the 1970s, Yale has devoted considerable resources and thousands o4 personnel
hours to the challenge o4 diversi4ying its 4aculty. This has yielded progress; Yale looks
very di5erent than it did hal4 a century ago. At the same time, Yale has oCen lagged
behind its institutional peers when it comes to 4aculty diversity. In 1991, the report o4 a
4aculty committee chaired by Gerald Jaynes (Pro4essor o4 Economics) warned that “Yale’s
position and its national image in this area remains precariously close to the backwaters o4
academic progress, not in the position o4 national leadership we proudly seek and claim in
other important areas” (pp. 3–4). Today, twenty-five years later, we see many o4 these
patterns and concerns being repeated. The question is why.
Earlier reports and explorations o4 this subject have pointed to a number o4 important
4actors that continue to play a role in Yale’s mixed record on 4aculty diversity:
— Inconsistent university leadership on diversity questions
— Lack o4 accountability mechanisms and monitoring o4 diversity initiatives
— InsuGcient financial resources 4or the hiring and retention o4 4aculty o4 color
— Lack o4 training 4or chairs and search committees tasked with hiring at the
departmental level
12See the discussion in Roderick A. Ferguson The Reorder o⇧ Things: The University and its Pedagogies o⇧Minority Di,erence. University o4 Minnesota Press, 2012, chapters 1 and 4.
13See, e.g., ‘Linking Mobilization to Institutional Power: The Faculty-Led Diversity Initiative atColumbia University’, in Doing Diversity in Higher Education: Faculty Leaders Share Challenges andStrategies, edited by Winni4red R. Brown-Glaude. Rutgers University Press, 2009: 249–275.
FAS Senate – Report on Faculty Diversity and Inclusivity in FAS – page 14
There are also several broader aspects o4 Yale’s history and institutional culture that
contribute additional challenges, including Yale’s historic mission as an institution aimed
at the education o4 young white men, its location within and tensions with the city o4
New Haven, and its relative lack (until recently) o4 4ormal mechanisms 4or 4aculty
governance and accountability. Within this broader history, activism by students and
4aculty—oCen connected to larger national and international movements—has proved
critical in pushing Yale to open itsel4 to new constituencies, policies, and perspectives.
Finally, Yale’s progress on diversity has oCen been linked to the overall state o4 the
university’s finances: when significant resources have been made available—usually in
times o4 economic health—diversity has increased. In time o4 austerity and cutbacks in
hiring, diversity measures have oCen su5ered. In short, Yale’s policies on and debates over
4aculty diversity do not occur in a historical vacuum.
A review o4 the history o4 Yale’s diversity initiatives and e5orts shows that many o4 the
issues we now con4ront are new in degree rather than in kind. Several past reports on
4aculty diversity, especially the 1989 Rodin Report and the 1991 Jaynes Report, might
be applied almost wholesale to the present situation, with a 4ew changes o4 procedures
and numbers and trends. In other words, many o4 the best practices 4or achieving 4aculty
diversity have been clear 4or decades. As the 4ollowing history shows, however, Yale’s
progress and commitment on the issue has waxed and waned over time.
The Early Years: 1968–1999In the late 1960s, when Yale began to admit significant numbers o4 women and students
o4 color as undergraduates, the Faculty o4 Arts and Sciences included virtually no women
or 4aculty o4 color. Unsurprisingly, the change in the student body—combined with
broader social movements—prompted calls 4or greater 4aculty diversity. Like universities
across the country, the Yale campus experienced significant social protest as well as new
legal mandates to develop an “aGrmative action” program 4or both students and 4aculty
during the late 1960s and early 1970s. In 1972, Yale President Kingman Brewster
introduced Yale’s first AGrmative Action Program to recruit 4aculty members 4rom
traditionally excluded groups.
During the late 1980s and early 1990s, Yale experienced a second significant wave o4
protest and campus action related to 4aculty diversity. This occurred in the context o4 the
era’s “culture wars,” in which debates over race, gender, and sexual identity took center
stage nationwide. Budget and hiring cutbacks at Yale raised additional questions about
the 4uture o4 4aculty hiring. In the midst o4 these debates, two significant reports, the
1989 “Rodin Report” and the 1991 “Jaynes Report,” laid out a power4ul critique o4 Yale’s
historic diversity e5orts as well as a road map 4or hiring and diversity e5orts in the
1990s.
FAS Senate – Report on Faculty Diversity and Inclusivity in FAS – page 15

This thirty-year period o4 institutional attention, 4aculty e5ort, and social protest yielded
slow but significant change, especially 4or women 4aculty. In 1982, a decade aCer
Brewster’s aGrmative action plan, women made up 5.4 percent o4 the university’s
tenured 4aculty, while 4aculty o4 color (including one woman) made up 5.0 percent. By
1991–1992, women made up 10.8 percent o4 tenured university 4aculty, while
“minority” pro4essors (now including eight women o4 color) made up 6.8 percent. By
1999–2000, the number o4 women had risen to 15.8 percent o4 the tenured 4aculty,
while the number o4 “minority” pro4essors increased more slowly, to 8.2 percent. During
that year, President Richard Levin announced a new diversity initiative (see next section)
designed to encourage more rapid change.
It is worth noting that while the total numbers o4 women and minority 4aculty increased
slowly over this thirty-year period, they did not increase consistently 4rom year to year. In
some categories, the numbers changed little at all. In 1982–83, Yale employed 10
tenured A4rican-American pro4essors, all o4 them men. In 1999–2000, almost two
decades later, Yale employed 17 tenured A4rican-American men and one tenured A4rican-
American woman. At the dawn o4 the 21st century, in short, black 4aculty made up just 2
percent o4 Yale’s tenured ranks.
* Note: The numbers and percentages in this section apply to the ⇧ull university ⇧aculty, not exclusively to the Faculty o⇧ Arts and Sciences. Data specific to the FAS was not available at the time o⇧ this report's distribution.
Timeline
1969: Yale admits 4emale undergraduate students 4or the first time, amidst significant
controversy.
1969: Yale creates A4ro-American Studies department and major. Also opens the A4ro-
American Cultural Center. Glenn DeChabert, moderator o4 the Black Students’ Alliance,
notes that that the Center was not an act o4 “separatism.” Instead, it marked an
acknowledgement that “Yale has 4ailed to deal with the social, psychological, and
educational problems 4aced by black students since more o4 us started coming here.”
(YDN 4/4/1969) History Department hires its first specialists in A4rican-American Studies.
1971: Yale appoints its first black college master: Richard Goldsby, associate pro4essor o4
biology. (YDN 4/22/1971)
FAS Senate – Report on Faculty Diversity and Inclusivity in FAS – page 16
1971: Yale appoints its first 4emale college master: Katharine Lustman (widow o4
Davenport Master Seymour Lustman). (YDN 9/13/1971)
1971: Yale establishes a “Committee to recommend procedures concerning the
recruitment o4 qualified women,” chaired by Ellen A. Peters. The final report recommends
an “expanded search network” as well as other measures to seek out qualified candidates.
It urges that Yale engage in a “systematic search 4or women.”
1972: Yale President Kingman Brewster sets aside resources 4or an “AGrmative Action
Plan” 4or the Yale 4aculty. Commits to a new goal o4 increasing representation o4 women
and minority scholars on the Yale 4aculty. (Rodin Report, 20) Brewster appoints an
associate provost to oversee the “recruitment o4 more women and members o4 other
minority groups.”
1978: A. Bartlett Giamatti becomes president o4 Yale.
1979: Yale establishes Women's Studies program. (YDN 9/1/1984)
1984: Report o4 the Faculty o4 Arts and Science Advisory Committee on the Education o4
Women, chaired by Chemistry pro4essor Donald Crothers. The report notes a
“discouraging loss o4 momentum since 1978 in increasing the number o4 women on the
4aculty” and attributes it to new budget constraints. (2) The report recommends
significant changes in university policy to recognize “the shiC to the two-career 4amily”
and to provide “parenting leaves available to either spouse” as well as “4ully adequate day
care 4acilities.” (3) At this point, only 15 o4 332 4emale 4aculty members hold tenure.
(YDN 10/3/84) Women are 4.5 percent o4 all tenured 4aculty. Minority women make up1.1 percent o4 Yale 4aculty. (12/3/84) Undergraduate students have reached 50–50
gender parity in enrollment. (YDN 9/1/84)
1984: In response to the Crothers Report, Yale commits to doubling the number o4
tenured women 4aculty in FAS by 1990.
1986: Benno Schmidt becomes president o4 Yale.
April 1989: Pro4essor John Blassingame resigns 4rom A4ro-American Studies program in
protest against lack o4 administration support. (YDN 4/3/1989)
April 1989: Yale law students stage strike to protest lack o4 4aculty diversity. (YDN 4/6/1989)
FAS Senate – Report on Faculty Diversity and Inclusivity in FAS – page 17

May 1989 The Rodin Committee Report on “Recruitment and Retention o4 Minority
Group members on the Faculty at Yale” chaired by Judith Rodin, calls 4or greater 4aculty
diversity. The report notes that “a 4ull and open commitment to embracing the breadth
and diversity o4 American society and clear procedures 4or accomplishing it are long
overdue at Yale.” (1) The report provides comprehensive statistics on the hiring o4
women and minority 4aculty since the 1970s and o5ers 22 recommendations. Those
recommendations include “targeted goals” as well as “specific procedures…4or reaching
these targeted goals” to improve 4aculty diversity. (15) The report also recommends “that
the President appoint a standing, University-wide committee to review, on an annual
basis, progress toward the general goals” o4 diversi4ying the 4aculty. The report lays out a
“conservative” goal 4or increasing minority representation on the Yale 4aculty 4rom 5.7
percent to 8 percent by 1999. (29) News coverage emphasizes the report’s
recommendation that Yale “spend time developing the pipeline [4or minority scholars] in
a very creative and dramatic way.” (YDN 10/2/1989)
1989: Yale President Benno Schmidt announces plan to cut 50 4aculty positions,
including the elimination o4 scholarly programs including linguistics and operations
research/statistics. (Yale Alumni Magazine, October 1998)
1989: Yale introduces the Mellon Mays Undergraduate Fellowship, intended to
encourage minority undergraduates to enter academic careers.
February 1990: President Schmidt releases a response to the Rodin report. Commits the
university to pay more attention to minority 4aculty recruitment and retention. Appoints
Economics pro4essor Gerald Jaynes to lead a committee on implementation o4 the Rodin
Report. (YDN 2/9/1990)
September 1990: Donald Kagan delivers 4reshman address emphasizing the importance
o4 teaching “Western civilization.” Student protests call 4or greater curricular diversity and
sensitivity. (YDN 9/5/1990; 11/28/1990)
November 28, 1990: President Schmidt denies the existence o4 “institutional racism” at
Yale, in conversation with the Yale College Council. Students push 4or mandatory
sensitivity training. (YDN 11/7/1990; 11/28/1990)
1991: Jaynes Committee Report on 4aculty diversity, chaired by Gerald Jaynes, Pro4essor
o4 Economics, recommends plan 4or major diversity improvements in response to 1989
Rodin Report. The report notes that despite modest gains, “Yale’s position and its
national image in this area remains precariously close to the backwaters o4 academic
progress, not in the position o4 national leadership we proudly seek and claim in other
important areas.” The report also expresses 4rustration that diversity reports and
FAS Senate – Report on Faculty Diversity and Inclusivity in FAS – page 18
committees have rarely led to significant change. “By our count, this is the eighteenth Yale
Committee, since 1968, to report on the recruitment o4 minority or women 4aculty”
(p. 3). The report recommends major re4orms in areas such as search committee
practices, the cluster hiring o4 a “critical mass” o4 minority 4aculty to counter isolation and
tokenism, and clarification o4 resources and procedures in diversity hiring, in addition to
other recommendation. The report also notes that lack o4 4aculty diversity has raised
concerns among minority students about their “right to belong” on Yale's campus and
within Yale’s community (p. 30).
January 1992: Yale introduces a 4aculty retrenchment and retirement plan, with the
explicit goal o4 reducing the size o4 the Faculty o4 Arts and Sciences. Jaynes committee
expresses concerns about the potential loss o4 diversity. (YDN 1/24/92; YDN 2/11/92)
January 1993: Protests at SOM call 4or increase in number o4 women 4aculty. (YDN 1/22/93)
April 1993: The Berson Report on 4aculty governance recommends the creation o4 a
4aculty council as well as an appointment o4 the dean o4 4aculty. The re4orms do not occur.
1993: Richard Levin inaugurated as president o4 Yale.
1994: Yale inaugurates the Edward A. Bouchet Fellowship 4or undergraduates, providing
money and summer 4ellowships to encourage minority students to pursue graduate
school.
1999: Yale succeeds in meeting the 4aculty diversity goals set out in the 1989 Rodin
Report. In 1999–2000, “minority” pro4essors make up 8.2 percent o4 the tenured ranks
and 16.1 percent o4 term 4aculty. Women compromise 15.8 percent o4 the tenured ranks,
and 33.7 percent o4 term 4aculty.
Years o- Progress: 1999–2007From the 1970s through 1990s, Yale made slow progress on 4aculty diversity. Between
1999 and 2007, that progress accelerated dramatically. Though many 4actors played a
role in this shiC, 4our seem particularly clear: 1) The university made a top-down and
open-ended commitment o4 resources to enhance 4aculty diversity. 2) The central
administration o5ered a clear statement o4 measurable goals. 3) President Richard Levin
repeatedly 4ocused on 4aculty diversity as a central administrative priority. 4) Faculty
themselves created new organizations—mostly notably the Women Faculty Forum—to
promote accountability on diversity issues. This “new era” began with President Levin’s
1999 commitment to provide open-ended resources in order to increase 4aculty diversity.
FAS Senate – Report on Faculty Diversity and Inclusivity in FAS – page 19

It reached its peak with the president’s 2006 commitment to hire 30 additional women
4aculty in the sciences, and 30 4aculty o4 color within the university overall. While 4aculty
diversity made great strides during this period, retention proved to be more o4 a
challenge, as many o4 the 4aculty hired in the “boom years” subsequently departed the
university.
Timeline
1999: President Richard Levin announces new 4aculty diversity plan. Commits that
suGcient financial resources will be available 4or hires at all ranks that promote diversity.
(Diversity Summit, 13; Yale Herald, 2/26/99)
Fall 1999: A4rican American Studies receives departmental status and hiring autonomy
aCer chair Hazel Carby resigns in protest o4 university inattention. (YDN 1/17/2002)
Spring 2000: The Journal o⇧ Blacks in Higher Education reports black 4aculty comprise 2.3 percent o4 Yale's total non-medical-school 4aculty, and 1.9 percent o4 Yale's ladder non-
medical 4aculty. The report notes that in the previous three decades “Yale lost to other
institutions a number o4 distinguished black 4aculty members, including Henry Louis
Gates Jr., Toni Morrison, Cornel West, and K. Anthony Appiah.” It concludes that “Yale’s
per4ormance is poor compared to most o4 its peers,” including Columbia, Brown, and
“even Dartmouth.” The report suggests that, based on “past per4ormance,” “it appears
that Yale will never achieve parity with nationwide percentages” o4 black 4aculty in higher
education. (“Black Faculty at Yale: Progress Stopped a Quarter o4 a Century Ago,” JBHE, spring 2000)
January 2001: Students protest holding classes on Martin Luther King Day. (YDN 1/12/01)
2001: Women Faculty Forum established.
December 2001: President Richard Levin announces that the university will not hold
classes on Martin Luther King Day. (YDN 1/16/02)
2002: Women Faculty Forum publishes first report on Women, Men, and Yale
University. Report documents percentages o4 women and other underrepresented groups
throughout 4aculty ranks, as well as other issues related to the visibility and recognition o4
women on campus.
FAS Senate – Report on Faculty Diversity and Inclusivity in FAS – page 20
2004: Between 1999 and 2004, the size o4 the Yale 4aculty expands by 10 percent.
Minority 4aculty in FAS grows by 30 percent. Women 4aculty in FAS grows by 43
percent. Women 4aculty in sciences grows by 113 percent (Diversity Summit, p. 13).
2005–2006: President Levin and Provost Andrew Hamilton allocate additional resources
to 4aculty diversity. Commit to: 1) adding at least 30 additional minority 4aculty by
2012; 2) adding at least 30 additional women 4aculty in fields where women are
underrepresented, especially in the sciences; 3) increased attention toward Ph.D. and
postdoctoral training o4 minority candidates. The plan includes a goal o4 increasing the
number o4 minority 4aculty members by 34 percent in seven years, and increasing women
4aculty by 20 percent, especially in the sciences. (Diversity Summit, p. 13; YDN 11/8/05)
2007: The Women Faculty Forum report Women, Men, and Yale University notes rapid
progress in the number o4 women among the university's ladder 4aculty: “by 2001–2002
women were over one-quarter o4 the 4aculty, and by 2006–2007 women are almost one-
third o4 the 4aculty.” In 2001–2002, minority women were 4 percent o4 university ladder
4aculty; in 2006–2007, that number jumped to 11 percent.14
The “Lost Decade”?: 2007–2016Just as several 4actors combined to produce rapid progress during the years 1999–2007,
4rom 2007 onward the university's diversity e5orts began to 4alter. This was due in large
part to the shock o4 the financial crisis, which produced an austerity policy that severely
limited 4aculty hiring in general, and had a particularly egregious (though unintended)
impact on the university’s diversity initiatives. In contrast to the relatively clear and well-
4unded diversity programs o4 the previous decade, aCer 2007 the university's diversity
policies appear to be more scattershot, composed o4 committees that 4ormed and then
disbanded. The gains o4 the prior years were not institutionalized and were quietly
allowed to erode.
Retention appears to have been a particular issue during this period. By one account, Yale
surpassed its own 2005 diversity hiring goals, hiring 56 4aculty o4 color and 30 women
by 2011. However, by 2012 just 22 o4 the 56 recently hired 4aculty o4 color and 18 o4
the 30 newly hired women remained on the Yale 4aculty. (YDN 2/25/13; 3/22/14) In 4all 2015, President Peter Salovey and Provost Benjamin Polak introduced a $25-million
university-wide Faculty Diversity Initiative to provide matching 4unds 4or departments
seeking to increase diversity through hiring, retention, and other strategies.
14The WFF report gives the 4ollowing definition o4 “minority” 4or the purposes o4 this report: “Minority includes any 4aculty identified as non-White (Black, Hispanic, Native American, Asian, Multi-race). OIR tables are broken down into these categories.”
FAS Senate – Report on Faculty Diversity and Inclusivity in FAS – page 21
Timeline
2010: Yale celebrates the 40th anniversary o4 co-education. (YDN 2/1/10)
2011–2013: Provost Peter Salovey appoints University Faculty Diversity Council. The
Council disbands in 2013, aCer two years. (YDN 2/15/12; Diversity Summit, 13)
2012: Women, Men, and Yale University: A View 4rom 2012, published by the Women
Faculty Forum, reveals slower increases in the numbers o4 women 4aculty, remaining at
roughly a third o4 university ladder 4aculty over the previous five years. FiCy percent o4
Yale undergraduate students are women. Minority women represent 9% o4 the total
ladder 4aculty (down 4rom 11 percent in 2006–2007).
Fall 2013: Peter Salovey becomes president o4 Yale.
2013–2014: Provost Ben Polak appoints a Faculty Diversity Hiring Committee to
conduct peer conversations with FAS search committees. (Diversity Summit, 13) ACer a
year’s work, committee o5ers nine recommendations 4or re4orm, including “a clear and
strong administration commitment to 4aculty diversity that emphasizes substantive
progress, and outcomes over time, rather than simply e5ort” as well “better record
keeping and monitoring o4 issues related to 4aculty diversity.” (FDHC report, 2) The
Committee is disbanded aCer one year.
February 2014: Yale Diversity Summit brings outside observers to campus 4or two-day
investigation and conversation. Final report notes “the perception that the University lags
behind some o4 its more prominent peers in achieving success in this area” and remarks
that this has been a “source o4 4rustration and, 4or some, a perceived deterrent to
recruiting some o4 the most outstanding scholars and researchers” (3). Report
recommends 16-point program 4or change, including greater accountability, tracking,
and public disclosure about Yale's diversity statistics. Concludes that “Yale is diversity
conscious, diversity, sensitive, but not diversity driven” (15).
Spring 2014: President Salovey announces major restructuring o4 FAS leadership,
including the appointment o4 Tamar Gendler as the inaugural Dean o4 the Faculty o4 Arts
and Sciences. Jonathan Holloway appointed as Dean o4 Yale College; Lynn Cooley
appointed as Dean o4 the Graduate School.
November 2014: Anthropology Pro4essor Richard Bribiescas appointed deputy provost
4or 4aculty diversity and development. (YDN 11/13/14)
September 2015: Newly created FAS Senate holds its first meeting.
FAS Senate – Report on Faculty Diversity and Inclusivity in FAS – page 22
November 2015: $25 million Faculty Diversity Initiative announced. The initiative
provides matching 4unds to departments 4or recruitment and 4aculty development.
November 2015: Student protests highlight 4aculty diversity as a key issue.
April 2016: Kathyrn LoCon (Pro4essor o4 Religious Studies, American Studies, History,
Divinity, and Women’s Gender and Sexuality Studies) is appointed as the inaugural
Faculty o4 Arts and Sciences Deputy Dean 4or Diversity and Faculty Development
(DDDD) 4or academic year 2016–17.
April 2016: President Salovey announces the outcome o4 a year-long consultation on
whether or not to retain the name o4 Calhoun College, deciding that Calhoun will stay. At
the same time, the names 4or Yale’s two new residential colleges are announced: Pauli
Murray College and Benjamin Franklin College. Two days aCer the announcement, the
student organization Next Yale holds a renaming ceremony on Cross Campus, outside
Calhoun College. They give the college the provisional name ‘The College 4ormerly
known as Calhoun’. The 4ollowing week 4aculty debate the naming decisions at a Yale
College Faculty Meeting.
V. UNDERREPRESENTED MINORITY AND WOMEN FACULTY: HIRING PATTERNS AND TRAJECTORIES
This section discusses Yale’s data collection and reporting with respect to 4aculty diversity.
We begin with our committee’s analysis o4 a new and significant set o4 data that was
assembled by the OGce o4 Institutional Research, with the 4ull support o4 the Dean o4 the
FAS, at our committee’s request. We then discuss Yale’s data collection and reporting in
general terms and make recommendations designed to bring Yale in line with peer
institutions. We are grate4ul to OIR, Dean Gendler, and Senate colleagues 4or generous
assistance in understanding and interpreting these data.
The data tables provided to us (and included in this report) o5er new in4ormation about
women and underrepresented minorities in the Faculty o4 Arts and Sciences, and are
particularly illuminating with respect to the composition o4 and trends within the ranks
o4 ladder, term 4aculty.15 The data come with some caveats, among them: numbers are
oCen too low to be statistically significant; aggregate FAS or division-level statistics may
mask important department-level trends or patterns; and many other kinds o4 data could
be gathered and analyzed to extend our analysis. (Women Faculty Forum reports, 4or
instance, have long analyzed trends in percentages o4 tenured and untenured women in
152015–16 data are complete as o4 October 2015; they do not cover later arrivals or departures.
FAS Senate – Report on Faculty Diversity and Inclusivity in FAS – page 23

various Yale units.) These data must also be understood in the overall context o4 this
report and many other approaches to and dimensions o4 4aculty diversity. Although
aggregate data such as these can be use4ul and important, diversity at Yale should never
be understood or appraised simply by counting gendered and/or racialized bodies.
A. Diversity, Austerity, and Untenured Faculty: A Lost Decade The new data enable us to track trends in assistant pro4essor hiring and in the overall
composition o4 the untenured, ladder 4aculty. As with other sections o4 this report, the
portrait o4 recent trends that emerges is troubling with respect to women 4aculty and
alarming with respect to URM 4aculty. Our committee’s view is that Yale’s recent
budgetary austerity has adversely and disproportionately a5ected women and URM 4aculty in the untenured ranks, with negative consequences 4or the short- and long-term
development o4 the FAS.
1. Trends in Hiring Women Faculty at the Assistant Pro⇧essor level As Figure 1 shows, in the five-year period between 2005 and 2009, Yale made 168 hires
at the assistant pro4essor level. In the next five-year period, 2010 to 2015, that number
dropped to 129. This represents an overall drop o4 23%, consistent with budgetary
austerity. However, this overall 23% drop comprises a 28% drop in hiring women (4rom
71 to 51), compared to a 20% drop in hiring men (4rom 97 to 78). This drop is
distributed di5erently across divisions, wherein a massive drop o4 54% in hiring women
in the Social Sciences pulls down the average much more than the small decrease in the
Humanities (10%) and Physical Sciences and Engineering (25%).16
Although a 15-year hiring rate o4 ~40% 4or women at the assistant pro4essor level may
appear more or less stable, it must be compared to the nationally available PhD pool.
During this same time period (2000–2015), the National Science Foundation’s Survey
o4 Earned Doctorates reports that women received an ever-increasing share o4 PhDs in
most broadly defined fields.17 Yale’s steady hiring may again be lagging this trend, despite
a significant period o4 catch up in the early 2000s. (The percent o4 women receiving
PhDs varies considerably by division and department; we make recommendations
concerning the use o4 this data in Section C, below; 4or an example o4 how new Yale data
might be used in particular divisions, see Appendix 1.)
16The numbers in the Biological Sciences are too low 4or the change in percentage to be meaning4ul in this period (hiring o4 women increased 4rom 2 to 3).
17National Science Foundation Survey o4 Earned Doctorates, 2014, Data Table 14, “Doctorate recipientsby sex and broad field o4 study: Selected years: 1984–2014.”
FAS Senate – Report on Faculty Diversity and Inclusivity in FAS – page 24

2. Trends in Hiring URM Faculty at the Assistant Pro⇧essor level Figure 1 shows that, over the past decade, URM assistant pro4essor hiring has also been
stagnant—at best. OGcial statistics show a decline in URM assistant pro4essor hiring
4rom 14% in the 2000–4 cohort to 7% in the 2010–15 cohort. The true picture is,
however, murkier and likely not quite so dire. Beginning in 2012, a 4ederally mandated shiC in the way universities collect race and ethnicity data—4rom obligatory institutional
reporting to optional sel4-reporting—has meant that the racial and/or ethnic identity o4
some newer 4aculty is “unknown” because these 4aculty neglected (or declined) to report.
Because o4 this shiC, we estimate the 7% figure is likely somewhat low and we do not
calculate percentage change in URM assistant pro4essor hiring 4or this cohort so as not to
create a misleading picture. However, we note that, over the past two decades, there has
been a 70% increase in U.S. doctorates awarded to A4rican Americans and a doubling o4
the number o4 doctorates awarded to Hispanics and Latinos.18 In no scenario is Yale
tracking these national trends.
18National Science Foundation Survey o4 Earned Doctorates, “Doctorate Recipients 4rom U.S. Universities, 2014 Report” December 2015, p. 2.
FAS Senate – Report on Faculty Diversity and Inclusivity in FAS – page 25
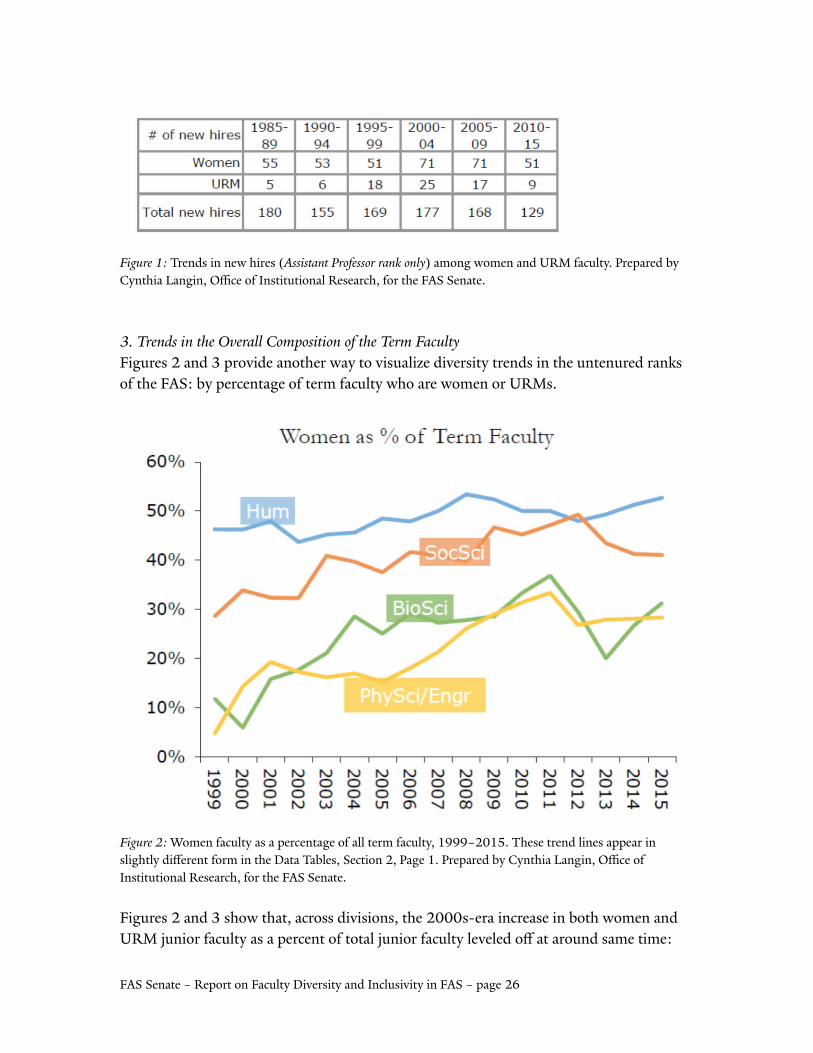
Figure 1: Trends in new hires (Assistant Pro⇧essor rank only) among women and URM 4aculty. Prepared by Cynthia Langin, OGce o4 Institutional Research, 4or the FAS Senate.
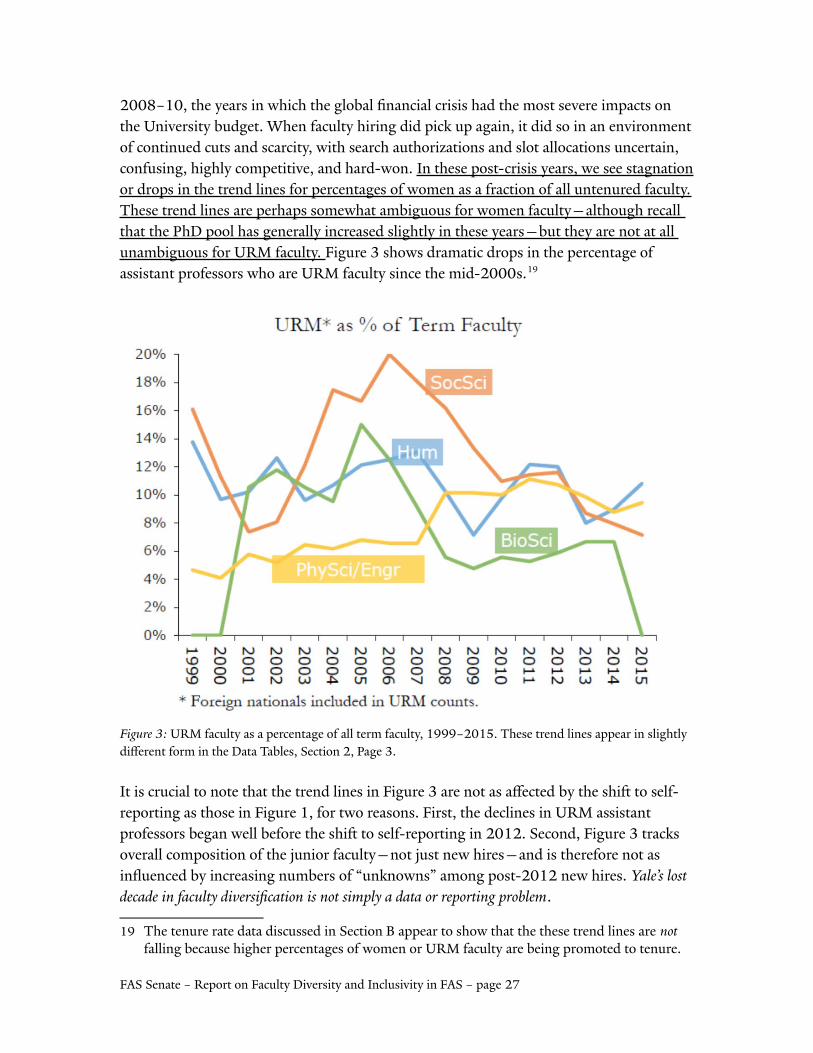
3. Trends in the Overall Composition o⇧ the Term Faculty Figures 2 and 3 provide another way to visualize diversity trends in the untenured ranks
o4 the FAS: by percentage o4 term 4aculty who are women or URMs.
Figure 2: Women 4aculty as a percentage o4 all term 4aculty, 1999–2015. These trend lines appear in slightly di5erent 4orm in the Data Tables, Section 2, Page 1. Prepared by Cynthia Langin, OGce o4
Institutional Research, 4or the FAS Senate.
Figures 2 and 3 show that, across divisions, the 2000s-era increase in both women and
URM junior 4aculty as a percent o4 total junior 4aculty leveled o5 at around same time:
FAS Senate – Report on Faculty Diversity and Inclusivity in FAS – page 26
2008–10, the years in which the global financial crisis had the most severe impacts on
the University budget. When 4aculty hiring did pick up again, it did so in an environment
o4 continued cuts and scarcity, with search authorizations and slot allocations uncertain,
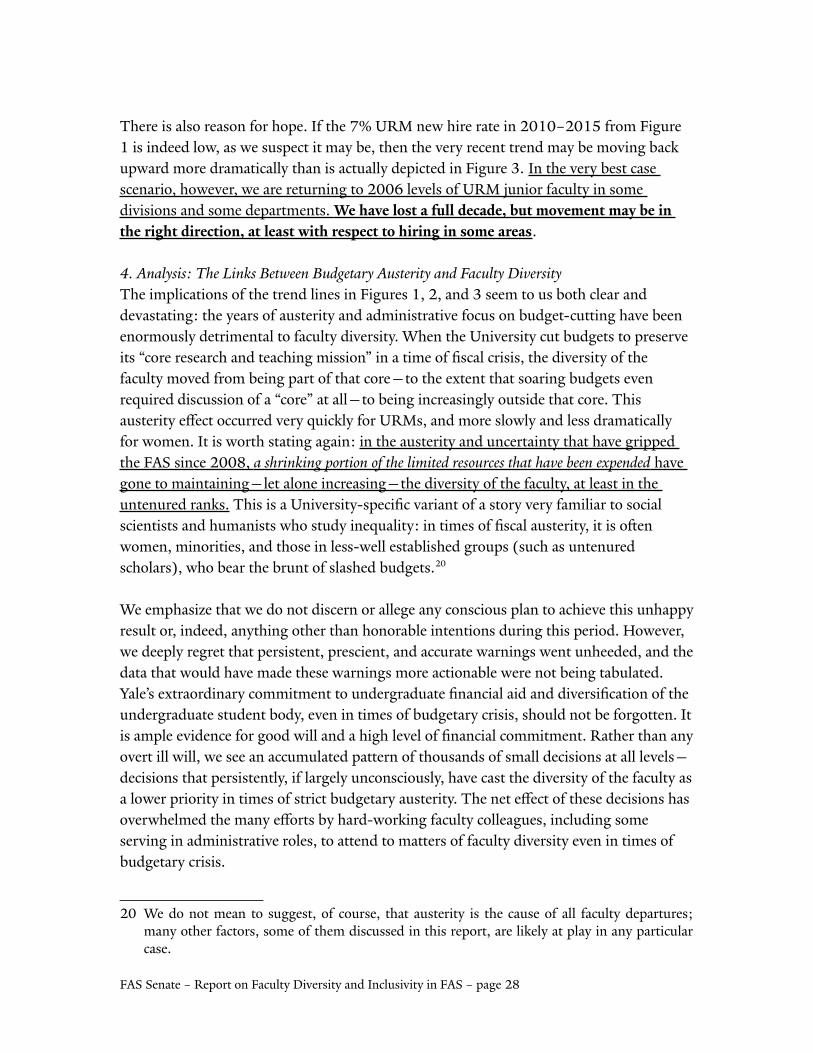
con4using, highly competitive, and hard-won. In these post-crisis years, we see stagnation
or drops in the trend lines 4or percentages o4 women as a 4raction o4 all untenured 4aculty.
These trend lines are perhaps somewhat ambiguous 4or women 4aculty—although recall
that the PhD pool has generally increased slightly in these years—but they are not at all
unambiguous 4or URM 4aculty. Figure 3 shows dramatic drops in the percentage o4
assistant pro4essors who are URM 4aculty since the mid-2000s.19
Figure 3: URM 4aculty as a percentage o4 all term 4aculty, 1999–2015. These trend lines appear in slightly di5erent 4orm in the Data Tables, Section 2, Page 3.
It is crucial to note that the trend lines in Figure 3 are not as a5ected by the shiC to sel4-
reporting as those in Figure 1, 4or two reasons. First, the declines in URM assistant
pro4essors began well be4ore the shiC to sel4-reporting in 2012. Second, Figure 3 tracks
overall composition o4 the junior 4aculty—not just new hires—and is there4ore not as
influenced by increasing numbers o4 “unknowns” among post-2012 new hires. Yale’s lost decade in ⇧aculty diversification is not simply a data or reporting problem.
19The tenure rate data discussed in Section B appear to show that the these trend lines are not 4alling because higher percentages o4 women or URM 4aculty are being promoted to tenure.
FAS Senate – Report on Faculty Diversity and Inclusivity in FAS – page 27
There is also reason 4or hope. I4 the 7% URM new hire rate in 2010–2015 4rom Figure
1 is indeed low, as we suspect it may be, then the very recent trend may be moving back
upward more dramatically than is actually depicted in Figure 3. In the very best case
scenario, however, we are returning to 2006 levels o4 URM junior 4aculty in some
divisions and some departments. We have lost a -ull decade, but movement may be in the right direction, at least with respect to hiring in some areas.
4. Analysis: The Links Between Budgetary Austerity and Faculty Diversity The implications o4 the trend lines in Figures 1, 2, and 3 seem to us both clear and
devastating: the years o4 austerity and administrative 4ocus on budget-cutting have been
enormously detrimental to 4aculty diversity. When the University cut budgets to preserve
its “core research and teaching mission” in a time o4 fiscal crisis, the diversity o4 the
4aculty moved 4rom being part o4 that core—to the extent that soaring budgets even
required discussion o4 a “core” at all—to being increasingly outside that core. This
austerity e5ect occurred very quickly 4or URMs, and more slowly and less dramatically
4or women. It is worth stating again: in the austerity and uncertainty that have gripped
the FAS since 2008, a shrinking portion o⇧ the limited resources that have been expended have gone to maintaining—let alone increasing—the diversity o4 the 4aculty, at least in the
untenured ranks. This is a University-specific variant o4 a story very 4amiliar to social
scientists and humanists who study inequality: in times o4 fiscal austerity, it is oCen
women, minorities, and those in less-well established groups (such as untenured
scholars), who bear the brunt o4 slashed budgets.20
We emphasize that we do not discern or allege any conscious plan to achieve this unhappy
result or, indeed, anything other than honorable intentions during this period. However,
we deeply regret that persistent, prescient, and accurate warnings went unheeded, and the
data that would have made these warnings more actionable were not being tabulated.
Yale’s extraordinary commitment to undergraduate financial aid and diversification o4 the
undergraduate student body, even in times o4 budgetary crisis, should not be 4orgotten. It
is ample evidence 4or good will and a high level o4 financial commitment. Rather than any
overt ill will, we see an accumulated pattern o4 thousands o4 small decisions at all levels—
decisions that persistently, i4 largely unconsciously, have cast the diversity o4 the 4aculty as
a lower priority in times o4 strict budgetary austerity. The net e5ect o4 these decisions has
overwhelmed the many e5orts by hard-working 4aculty colleagues, including some
serving in administrative roles, to attend to matters o4 4aculty diversity even in times o4
budgetary crisis.
20We do not mean to suggest, o4 course, that austerity is the cause o4 all 4aculty departures;many other 4actors, some o4 them discussed in this report, are likely at play in any particularcase.
FAS Senate – Report on Faculty Diversity and Inclusivity in FAS – page 28
We believe, moreover, that the data show a clear link between 4aculty search and
retention/promotion/tenure processes—the points at which we most oCen look to
explain disparities, perhaps through implicit/unconscious bias—and institutional and
budgeting priorities set at the highest levels o4 the University. Years o4 administrative
inattention to this area must now be made up 4or with significantly increased, sustained,
and qualitatively di5erent kinds o4 attention 4rom University leadership. At the same
time, it is also important to underscore that the topics we treat here—junior 4aculty hiring
and retention patterns—are the areas o4 4aculty composition and development that are
significantly determined by departments rather than by central and FAS administration.21
Diverse junior 4aculty hiring, retention, and promotion is an area in which we have all, as
a community o4 scholars and teachers and as a Faculty o4 Arts and Sciences, 4allen 4ar
short o4 our collective aspirations and commitments. We have done much to undo our
successes o4 2000–2009, and we have much to do to repeat those successes in 2016–
2025.
Some specific questions—and their potential overlaps and intersections—are worth
pondering at this juncture as we seek to understand where we are and discern the best
path 4orward:
• To what extent did the post-financial crisis elimination o4 scores o4 4aculty slots
disproportionately a5ect slots, departments, programs, or initiatives that were central
to the diversification successes o4 the early 2000s—such that departures 4rom those
slots/fields/subfields were unable to be easily replaced?
• To what extent does an environment o4 4aculty resource scarcity, and/or the pervasive
perception o4 4aculty resource scarcity, disproportionately impact e5orts to diversi4y the4aculty in line with national trends and Yale’s overall educational mission? In
retreating to 4ocus on “core strengths,” have departments 4ollowed the University in
opening a divide between “diversity” and “excellence” that seemed to be closing in the
early 2000s?
• What is the relationship between the current slot allocation system—as designed and,
especially, as it is developing in practice at various levels—and 4aculty diversity?
5. Reasons to Hope ⇧or the Next DecadeFor all o4 the bleakness o4 this portrait o4 a lost decade, there are reasons 4or hope, drawn
both 4rom Yale’s history and 4rom the present day. First, Yale’s expansion o4 hiring o4
women and URM 4aculty in the early 2000s was substantial, dramatic, and success4ul
across divisions. We find no evidence that Yale’s commitment to 4aculty diversification in
21Senior hires and retention packages, by contrast, can be and have been steered much morefirmly by the University administration; we look 4orward to more data and greater clarity onthose parts o4 the overall picture o4 4aculty diversification e5orts.
FAS Senate – Report on Faculty Diversity and Inclusivity in FAS – page 29

those years was anything other than genuine and central to its research and teaching
mission. Indeed, at the level o4 undergraduate admissions and financial aid, that
commitment has remained and increased. Yale has succeeded on this 4ront be4ore, and
succeeds now in domains other than 4aculty hiring and retention. Second, the newly
released tenure rates, discussed in the next section, show us that when URM and women
4aculty are hired in statistically significant proportions, they have generally been retained
in the junior ranks and then tenured at a rate broadly comparable to non-URM 4aculty
and men – although not without exceptions, not without remaining unacceptable gaps,
and not, we know all too well, without wide di5erences by department. (Recall that the
current data do not address senior-level retention rates or senior-level hiring, which are
also matters o4 concern.) Third, some o4 Yale’s peer universities have been succeeding
even in Yale’s lost decade. Sustained, determined attention to the diversity o4 the 4aculty
has, can, and does succeed.
B. Tenure Rates and Faculty DiversityFor the first time, to our knowledge, Yale has calculated and released tenure rates broken
out by gender, URM background, and FAS division, in data tables reaching back to the
cohort o4 assistant pro4essors hired in 1985–1989 (see Data Tables, Section 3:
Advancement to Tenure o4 Entering FAS Assistant Pro4essors, 1985–2015). These data
include all hired assistant pro4essors—not just those who stayed through a tenure
decision—and do not distinguish among reasons 4or departure (e.g. negative tenure vote
or accepting a more attractive o5er elsewhere be4ore coming up 4or tenure at Yale). Note,
too, that we do not have and do not discuss tenure rates by department; these rates may
diverge widely 4rom the rates o4 a department’s “parent” division.
1. Tenure rates ⇧or women and men assistant pro⇧essors. From 1985 to 2015, tenure rates 4or women in the FAS as a whole have consistently
been 3–6% lower than they have been 4or men.22
22It is instructive to look at this 4rom multiple perspectives. We can subtract the rate at whichwomen are tenured 4rom the rate at which men are tenured, and this comparison reveals the3–6% gap re4erred to above. So, 4or example, in the 1995–1999 cohort o4 entering assistantpro4essors, women were tenured at a rate o4 16% and men were tenured at a rate o4 20%; thedi5erence is there4ore 4%. We should also, however, look at the percentage di,erence betweenthe rates, which reveals a larger gap. So, in this method, we calculate that 16 is 80% o4 20;there4ore, in the 1995–1999 cohort, women were only 80% as likely as men to receivetenure. In 2000–2004, when the rates were 25% and 37%, women were only 67% as likelyas men to receive tenure.
FAS Senate – Report on Faculty Diversity and Inclusivity in FAS – page 30
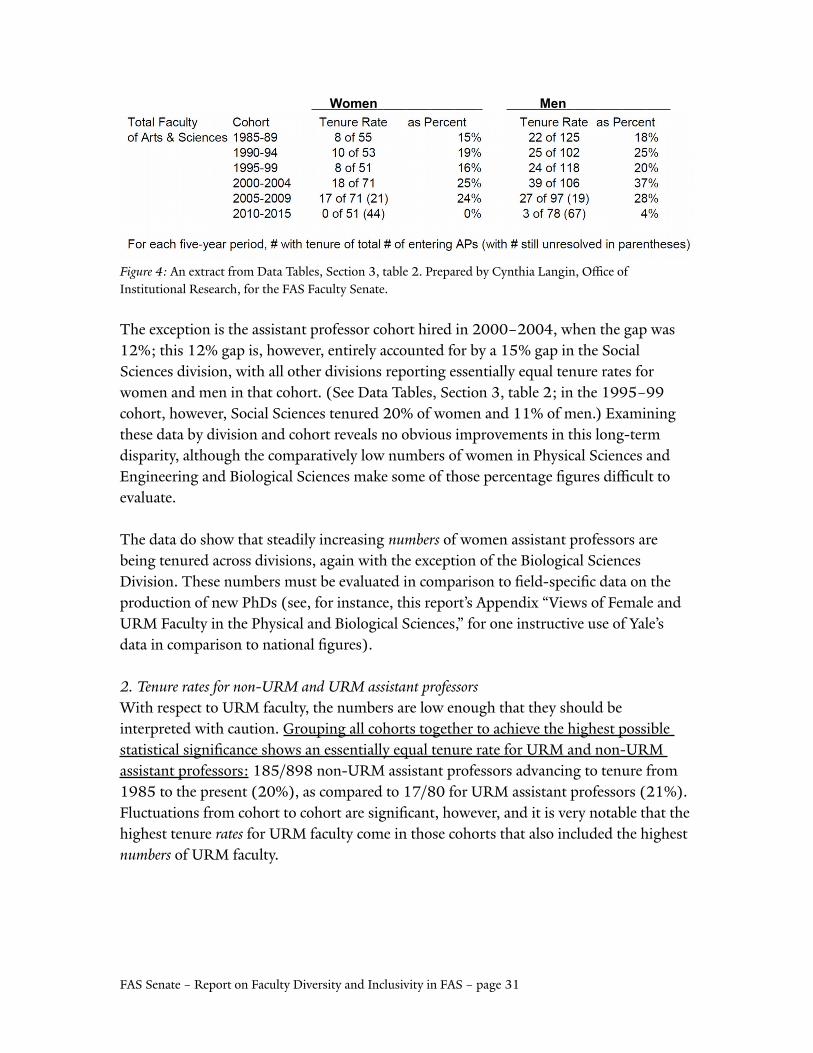
Women Men
Figure 4: An extract 4rom Data Tables, Section 3, table 2. Prepared by Cynthia Langin, OGce o4 Institutional Research, 4or the FAS Faculty Senate.
The exception is the assistant pro4essor cohort hired in 2000–2004, when the gap was
12%; this 12% gap is, however, entirely accounted 4or by a 15% gap in the Social
Sciences division, with all other divisions reporting essentially equal tenure rates 4or
women and men in that cohort. (See Data Tables, Section 3, table 2; in the 1995–99
cohort, however, Social Sciences tenured 20% o4 women and 11% o4 men.) Examining
these data by division and cohort reveals no obvious improvements in this long-term
disparity, although the comparatively low numbers o4 women in Physical Sciences and
Engineering and Biological Sciences make some o4 those percentage figures diGcult to
evaluate.
The data do show that steadily increasing numbers o4 women assistant pro4essors are being tenured across divisions, again with the exception o4 the Biological Sciences
Division. These numbers must be evaluated in comparison to field-specific data on the
production o4 new PhDs (see, 4or instance, this report’s Appendix “Views o4 Female and
URM Faculty in the Physical and Biological Sciences,” 4or one instructive use o4 Yale’s
data in comparison to national figures).
2. Tenure rates ⇧or non-URM and URM assistant pro⇧essorsWith respect to URM 4aculty, the numbers are low enough that they should be
interpreted with caution. Grouping all cohorts together to achieve the highest possible
statistical significance shows an essentially equal tenure rate 4or URM and non-URM
assistant pro4essors: 185/898 non-URM assistant pro4essors advancing to tenure 4rom
1985 to the present (20%), as compared to 17/80 4or URM assistant pro4essors (21%).
Fluctuations 4rom cohort to cohort are significant, however, and it is very notable that the
highest tenure rates 4or URM 4aculty come in those cohorts that also included the highest numbers o4 URM 4aculty.
FAS Senate – Report on Faculty Diversity and Inclusivity in FAS – page 31
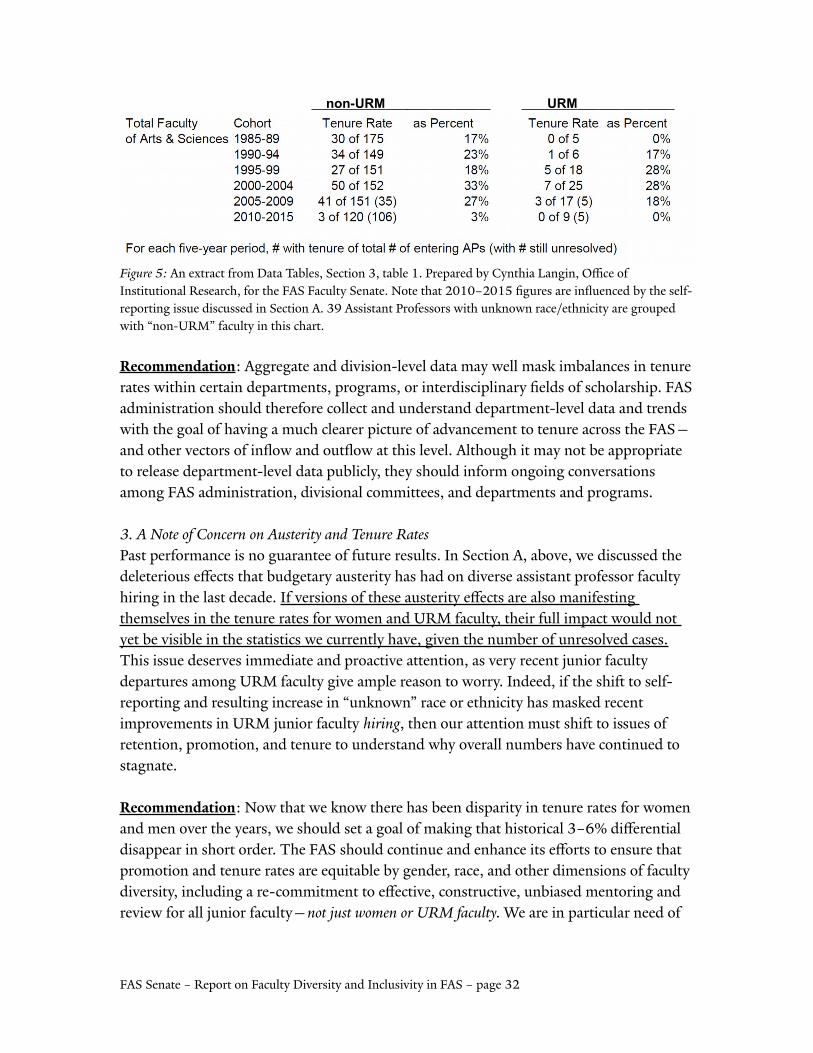
non-URM URM
Figure 5: An extract 4rom Data Tables, Section 3, table 1. Prepared by Cynthia Langin, OGce o4 Institutional Research, 4or the FAS Faculty Senate. Note that 2010–2015 figures are influenced by the sel4-
reporting issue discussed in Section A. 39 Assistant Pro4essors with unknown race/ethnicity are grouped
with “non-URM” 4aculty in this chart.
Recommendation: Aggregate and division-level data may well mask imbalances in tenurerates within certain departments, programs, or interdisciplinary fields o4 scholarship. FAS
administration should there4ore collect and understand department-level data and trends
with the goal o4 having a much clearer picture o4 advancement to tenure across the FAS—
and other vectors o4 inflow and outflow at this level. Although it may not be appropriate
to release department-level data publicly, they should in4orm ongoing conversations
among FAS administration, divisional committees, and departments and programs.
3. A Note o⇧ Concern on Austerity and Tenure RatesPast per4ormance is no guarantee o4 4uture results. In Section A, above, we discussed the
deleterious e5ects that budgetary austerity has had on diverse assistant pro4essor 4aculty
hiring in the last decade. I4 versions o4 these austerity e5ects are also mani4esting
themselves in the tenure rates 4or women and URM 4aculty, their 4ull impact would not
yet be visible in the statistics we currently have, given the number o4 unresolved cases.
This issue deserves immediate and proactive attention, as very recent junior 4aculty
departures among URM 4aculty give ample reason to worry. Indeed, i4 the shiC to sel4-
reporting and resulting increase in “unknown” race or ethnicity has masked recent
improvements in URM junior 4aculty hiring, then our attention must shiC to issues o4 retention, promotion, and tenure to understand why overall numbers have continued to
stagnate.
Recommendation: Now that we know there has been disparity in tenure rates 4or womenand men over the years, we should set a goal o4 making that historical 3–6% di5erential
disappear in short order. The FAS should continue and enhance its e5orts to ensure that
promotion and tenure rates are equitable by gender, race, and other dimensions o4 4aculty
diversity, including a re-commitment to e5ective, constructive, unbiased mentoring and
review 4or all junior 4aculty—not just women or URM ⇧aculty. We are in particular need o4
FAS Senate – Report on Faculty Diversity and Inclusivity in FAS – page 32
department-based and 4aculty-to-4aculty (in addition to existing administration-to-
4aculty) strategies.
Recommendation: Because it is not yet possible to discern whether the tenure rates o4 di5erent 4aculty demographics have shiCed aCer the introduction o4 FASTAP—and i4 so,
why—this possibility should be monitored.
Recommendation: It is critically important to increase the numbers o4 URM 4aculty entering at the assistant pro4essor level (not, o4 course, to the exclusion o4 senior-level
hiring as well). Regardless o4 the tenure rate, greater incoming numbers will lead to more
longer-term growth. It should not come as a surprise that larger cohorts o4 URM 4aculty
are associated with higher rates o4 retention and tenure: this is the insight that supports
the “cluster hires” that other universities sometimes pursue. Among other strategies, Yale
should consider its own version o4 this mode o4 hiring as a way o4 jump-starting the
process that, in 2000–2009, dramatically increased the numbers and percentages o4
URM 4aculty, including those advancing to tenure.
C. The Data We Have and the Data We Need Much o4 the data analyzed in the sections above was tabulated anew by the OGce o4
Institutional Research in response to our request and with the additional support o4 the
FAS Dean’s OGce. We hope our analysis in Sections A and B provides a sample o4 the
kind o4 constructive, collective reflection that is enabled when relevant data is provided.
In the course o4 our committee’s work, however, we learned that Yale is still not
systematically collecting or analyzing many kinds o4 data about the composition o4 the
Faculty o4 Arts and Sciences—despite numerous past recommendations to do so, 4rom the
Women Faculty Forum, previous diversity committees, and others. We agree with these
earlier reports that this lack o4 systematic data is a serious obstacle to attempts to diversi4y
the 4aculty.
For many years, Yale has released only overall 4aculty headcounts, in compliance with
4ederal reporting requirements. The 2015–16 oGcial headcount tables can be 4ound here
and here, on the website o4 Yale’s OGce o4 Institutional Research. Overall headcounts are,
however, an imprecise and poor measure o4 4aculty diversity. As our analysis above
revealed, headcounts do not uncover potential di5erences by gender or URM status in
tenure rates or hiring rates at di5erent ranks. They do not address potential disparities in
retention rates. They do not enable us to understand the extent to which diversity is
increasing or decreasing as a result o4 passive processes such as retirements (85–90% o4
which were white and male in 2000–2016), or as a result o4 active e5orts to trans4orm
our hiring, recruiting, promotion, and tenure practices.
FAS Senate – Report on Faculty Diversity and Inclusivity in FAS – page 33
It is important to note that, in many cases, Yale’s lack o4 publicly available data has not
been an issue o4 unreleased data (that is, o4 calculated data deemed confidential), but
rather a lack o4 systematically tracking or calculating those data in the first place. In recent
years, many o4 Yale’s peer institutions have recognized the inadequacy o4 headcount
statistics, and are now 4ar ahead o4 Yale in tracking and publicly reporting on 4aculty
diversity in great detail:
• The Annual Report o4 the Dean o4 the FAS at Harvard reports precisely on the
numbers o4 o5ers made each year to men, women, minorities, and underrepresented
minorities. The same report o5ers data on promotion and tenure rates, including
statistical tests 4or equality between tenure rates 4or men and women 4aculty who
stand 4or promotion and tenure (in the 2015 report, see pp. 6–12).
• Stan4ord issues an annual “Report on the Faculty: Pro4essorial Gains, Losses, and
Composition” that describes, in significant detail, short- and long-term trends in
diversity and other key indicators o4 4aculty composition.
• UC Berkeley breaks out its 4aculty statistics by division within the College o4 Letters
and Sciences, notably including hiring rates o4 women and minority 4aculty and
comparing those rates to Berkeley’s own internal pipeline (4rom BA through Full
Pro4essor) and to the US pool o4 available PhDs in each Division.23
• MIT has long been a leader in tracking data on women in the sciences, including on
the ways in which disparities in resource allocation (lab space, research 4unds) can
disadvantage the careers o4 women scholars at all ranks; a series o4 public reports on
these issues (see 1999 report, 2011 report] have led to notable successes in
increasing equity among men and women 4aculty. Note also the comprehensive MIT
report on minority and underrepresented minority 4aculty 4rom 2010.
Recommendation : The OGce o4 the Dean o4 the Faculty o4 Arts and Sciences should begin tracking and publicly reporting on multiple dimensions o4 4aculty composition and
diversity. This will likely involve designing and implementing new systems 4or tracking
4aculty careers and vectors o4 inflow and outflow at each critical juncture o4 a career, as
many o4 the relevant existing data are dispersed across di5erent systems, have not been
stored in 4ormats that are easily analyzable 4or trends, or have not been recorded at all.
These data, along with field-specific data about national trends, can 4urther enhance
meaning4ul and substantive conversations among FAS leadership, divisional committees,
and departments about their hiring, promotion, tenure, and retention practices.
23Women Faculty Forum reports have included this comparative pipeline data by Division o4 the FAS. To our knowledge, these data have not been systematically part o4 conversations about search authorizations or actual searches.
FAS Senate – Report on Faculty Diversity and Inclusivity in FAS – page 34
In order to design and implement these systems most e5ectively, the Dean o4 the FAS
should immediately establish a working group consisting o4 members o4 the FAS
leadership team, the OGce o4 Institutional Research, Faculty Administrative Services, the
FAS Senate Faculty Advancement Committee, the FAS Senate Diversity and Inclusivity
Committee, the Women Faculty Forum, and other 4aculty with relevant expertise. The
working group should, at a minimum, consider and make recommendations on the
4ollowing:
• How to collect and report data—including compiling historical data—on significant
aspects o4 4aculty career trajectories, inflows, and outflows as they relate to diversity.
There are, 4or instance, currently no systematic data on Department-level promotion
and tenure decisions and no data at all on the number o4 4aculty who leave prior to a
Departmental vote (including the reason 4or their early departure).
• How to track and evaluate whether there are gender-based or other disparities in
hiring or retention packages (i.e., in lab space, research 4unds, teaching assignments,
and other 4aculty support/activities) or other resources and distinctions, including but
not limited to: named pro4essorships, research and teaching prizes, etc. Ideally Yale
would undertake a rigorous, thorough, 4aculty-led, systematic investigation o4 these
issues using primary data—comparable to those conducted at MIT.
• The confidentiality levels that are appropriate to various kinds o4 in4ormation. In
addition to making specific recommendations on public reporting, the working group
may wish to consider establishing a diversity analog to the Committee on the
Economic Status o4 the Faculty, so that members o4 the 4aculty not currently serving
in administrative roles can review, evaluate, and comment on certain sensitive or non-
public in4ormation that relates to 4aculty diversity.
VI. RESULTS OF THE FAS SENATE SURVEY ON FACULTY DIVERSITY AND INCLUSIVITY
In March o4 2016, the FAS Senate’s Ad Hoc Committee on Diversity and Inclusivity
conducted a voluntary survey o4 the Faculty o4 Arts and Sciences at Yale. The goal o4 the
survey was to assess the climate 4rom the 4aculty’s point o4 view, highlight experiences
across the FAS community, and most importantly, to communicate 4aculty opinion to the
FAS leadership as the Diversity Initiative un4olds. Faculty input was considerable, with
313 4aculty members participating in the survey; about 40 percent o4 the FAS 4aculty
(ladder and 4ull-time non-ladder 4aculty) provided their input, a sizable response rate
given the length o4 the survey. This is the first time to our knowledge that the 4aculty have
been systematically surveyed specifically about their perceptions o4 an issue central to the
FAS Senate – Report on Faculty Diversity and Inclusivity in FAS – page 35
intellectual environment at Yale: diversity and inclusivity.24 With only one or two
exceptions, respondents 4rom all FAS departments provided their opinions and
experiences.
The main limitation o4 the survey is that it registered the opinions o4 4aculty based on the
assumption o4 belonging to one department; thus, 4aculty who are jointly appointed
could not register opinions about two departments. Faculty who are under-represented
minorities (URM) are concentrated in certain departments (like A4rican American
Studies) and oCen have joint appointments. Our ability to 4ully understand their
experiences may be skewed since our items only allow 4or communicating perceptions
about one department. Indeed, 4aculty o4 color rate their departments as more inclusive than other 4aculty, which may be an arti4act o4 their concentration in departments that are
already quite diverse.
Another limitation flows 4rom the very subject o4 this survey – low 4aculty representation
4rom underrepresented minority groups. Very low numbers o4 black and Latino(a)
4aculty in the FAS prevent subgroup analyses that would be very use4ul 4or this report and
our collective sense o4 the experiences o4 4aculty o4 color. Where subgroup analysis 4or
4emale 4aculty is possible – say looking at women in the sciences or untenured women
compared to tenured women – the very low representation o4 black, Latino(a), and
LGBTQ 4aculty prevents a 4uller portrait o4 their experiences. We cannot analyze the
experiences o4 black or Latino(a) 4aculty by division, by gender, by rank, or other
category even while we deem it very important to understand the perceptions o4, 4or
example, black 4aculty in the social sciences compared to their counterparts in the
humanities. To adjust 4or this limitation, in what 4ollows we sometimes group all 4aculty
o4 color together in the category “4aculty o4 color” (which includes those who identi4y as
Asian/Asian-American, black, Hispanic, or Native American). Lumping together these
groups is suboptimal and flattens distinctive experiences by racial/ethnic background;
however, given their underrepresentation among our 4aculty, this is the course we must
take. Even still, there are only 67 4aculty o4 color survey participants so while we would
ideally like to explore the perceptions o4 women 4aculty o4 color or untenured 4aculty o4
color, we cannot delve 4urther into divisions by gender, rank, or division given these small
numbers. We are con4ronted with an even sharper dilemma when it comes to 4aculty who
identi4y as LGBTQ; since there are only 21 respondents in this group (or 7 percent), we
are not able to examine their perceptions as a distinct group at all. This is a major
limitation.
24In creating the survey, the committee examined 4aculty diversity/climate surveys 4rom at least a dozen other universities and replicated questions 4ound on these surveys in addition to developing items that pertained to our own intellectual community.
FAS Senate – Report on Faculty Diversity and Inclusivity in FAS – page 36

In what 4ollows, we mainly 4ocus on 4aculty diversity as it pertains to race/ethnicity,
gender, and sexuality. While there are many other important 4acets o4 4aculty identity,
exclusion, and experience –age, ideology, religion, parenthood, just to name a 4ew –
examining them all in depth is beyond our purview.
Response Rates and Demographic In-ormationAs Figure 1 indicates, there is wide representation across rank, division, and demographic
group. Although the sel4-report item does not permit 4ull reporting here, 4aculty
participation came 4rom across the FAS departments and was particularly high 4rom the
departments o4 Chemistry, Physics, MCDB, History, and English.25
Figure 1: FAS survey respondent characteristics (%).
Steps in the Right Direction but Uneven Progress:An Overall Portrait o- Perceptions o- Diversity Progress and Departmental ClimateFaculty opinion on diversity is quite heterogeneous. Almost hal4 o4 the 4aculty
respondents reported being satisfied with climate, 35 percent said diversity had improved
in their department over past 5 years, 35 percent said the climate o4 inclusivity had
improved, and 23 percent said diversity in their department was somewhat or much
better than the same departments at peer institutions. On the other hand, a third o4
25Reporting one’s department was optional to keep confidentiality intact but about hal4 o4 4aculty respondents provided their department. All FAS departments were represented with the exception o4 the Engineering departments and Computer Science, Film and Media Studies, and Judaic Studies.
FAS Senate – Report on Faculty Diversity and Inclusivity in FAS – page 37
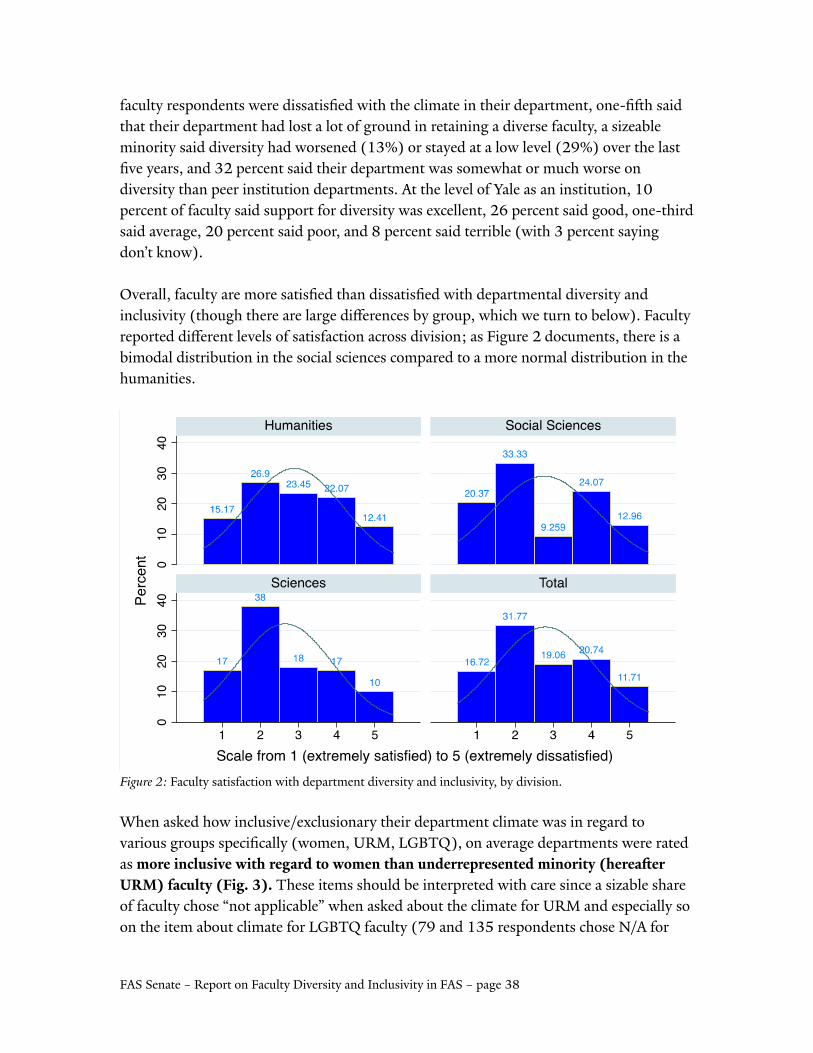
4aculty respondents were dissatisfied with the climate in their department, one-fiCh said
that their department had lost a lot o4 ground in retaining a diverse 4aculty, a sizeable
minority said diversity had worsened (13%) or stayed at a low level (29%) over the last
five years, and 32 percent said their department was somewhat or much worse on
diversity than peer institution departments. At the level o4 Yale as an institution, 10
percent o4 4aculty said support 4or diversity was excellent, 26 percent said good, one-third
said average, 20 percent said poor, and 8 percent said terrible (with 3 percent saying
don’t know).
Overall, 4aculty are more satisfied than dissatisfied with departmental diversity and
inclusivity (though there are large di5erences by group, which we turn to below). Faculty
reported di5erent levels o4 satis4action across division; as Figure 2 documents, there is a
bimodal distribution in the social sciences compared to a more normal distribution in the
humanities.
Figure 2: Faculty satis4action with department diversity and inclusivity, by division.
When asked how inclusive/exclusionary their department climate was in regard to
various groups specifically (women, URM, LGBTQ), on average departments were rated
as more inclusive with regard to women than underrepresented minority (hereaMer URM) -aculty (Fig. 3). These items should be interpreted with care since a sizable share o4 4aculty chose “not applicable” when asked about the climate 4or URM and especially so
on the item about climate 4or LGBTQ 4aculty (79 and 135 respondents chose N/A 4or
FAS Senate – Report on Faculty Diversity and Inclusivity in FAS – page 38
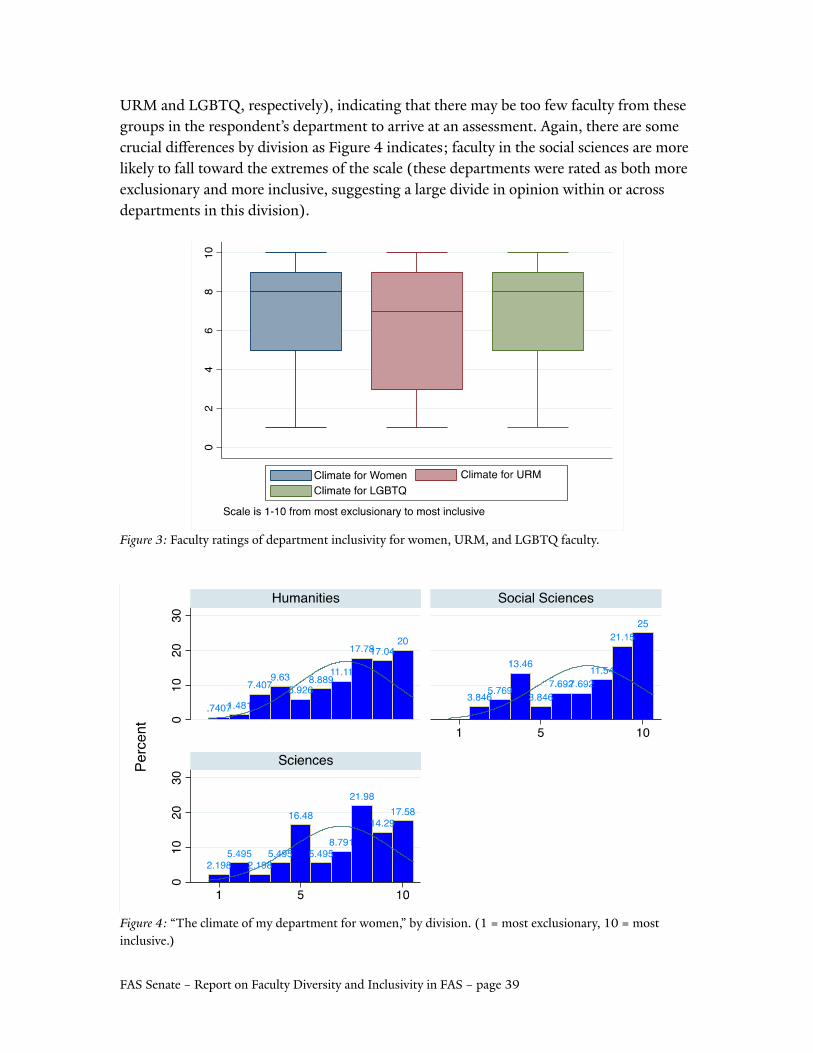
URM and LGBTQ, respectively), indicating that there may be too 4ew 4aculty 4rom these
groups in the respondent’s department to arrive at an assessment. Again, there are some
crucial di5erences by division as Figure 4 indicates; 4aculty in the social sciences are more
likely to 4all toward the extremes o4 the scale (these departments were rated as both more
exclusionary and more inclusive, suggesting a large divide in opinion within or across
departments in this division).
Figure 3: Faculty ratings o4 department inclusivity 4or women, URM, and LGBTQ 4aculty.
Figure 4: “The climate o4 my department 4or women,” by division. (1 = most exclusionary, 10 = most inclusive.)
FAS Senate – Report on Faculty Diversity and Inclusivity in FAS – page 39
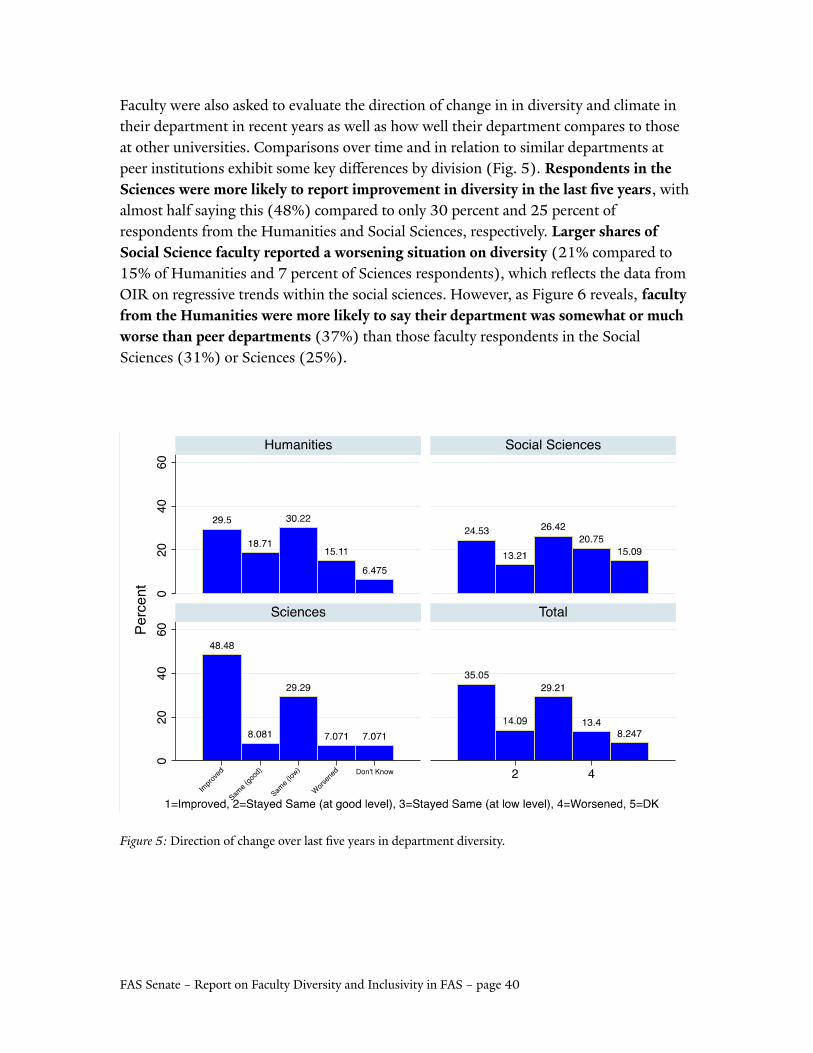
Faculty were also asked to evaluate the direction o4 change in in diversity and climate in
their department in recent years as well as how well their department compares to those
at other universities. Comparisons over time and in relation to similar departments at
peer institutions exhibit some key di5erences by division (Fig. 5). Respondents in the Sciences were more likely to report improvement in diversity in the last five years, with almost hal4 saying this (48%) compared to only 30 percent and 25 percent o4
respondents 4rom the Humanities and Social Sciences, respectively. Larger shares o- Social Science -aculty reported a worsening situation on diversity (21% compared to 15% o4 Humanities and 7 percent o4 Sciences respondents), which reflects the data 4rom
OIR on regressive trends within the social sciences. However, as Figure 6 reveals, -aculty -rom the Humanities were more likely to say their department was somewhat or much worse than peer departments (37%) than those 4aculty respondents in the Social Sciences (31%) or Sciences (25%).
Figure 5: Direction o4 change over last five years in department diversity.
FAS Senate – Report on Faculty Diversity and Inclusivity in FAS – page 40
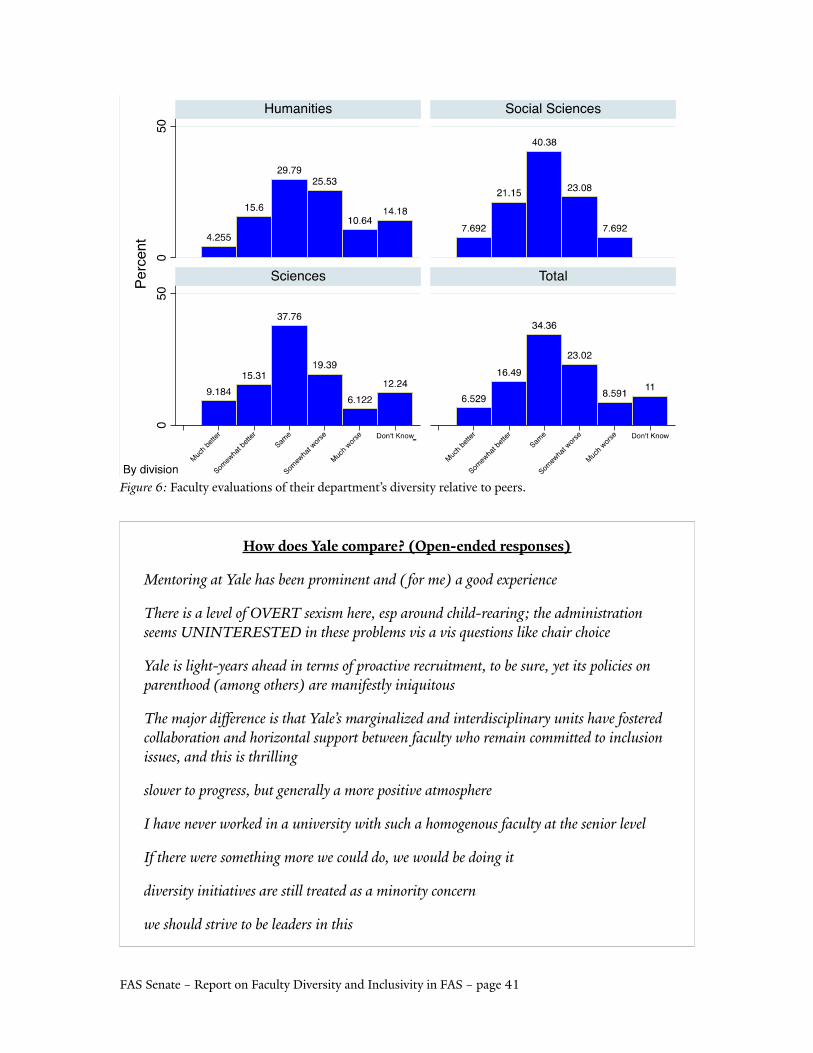
Figure 6: Faculty evaluations o4 their department’s diversity relative to peers.
How does Yale compare? (Open-ended responses)
Mentoring at Yale has been prominent and (⇧or me) a good experience
There is a level o⇧ OVERT sexism here, esp around child-rearing; the administration seems UNINTERESTED in these problems vis a vis questions like chair choice
Yale is light-years ahead in terms o⇧ proactive recruitment, to be sure, yet its policies on parenthood (among others) are mani⇧estly iniquitous
The major di,erence is that Yale’s marginalized and interdisciplinary units have ⇧ostered collaboration and horizontal support between ⇧aculty who remain committed to inclusion issues, and this is thrilling
slower to progress, but generally a more positive atmosphere
I have never worked in a university with such a homogenous ⇧aculty at the senior level
I⇧ there were something more we could do, we would be doing it
diversity initiatives are still treated as a minority concern
we should strive to be leaders in this
FAS Senate – Report on Faculty Diversity and Inclusivity in FAS – page 41
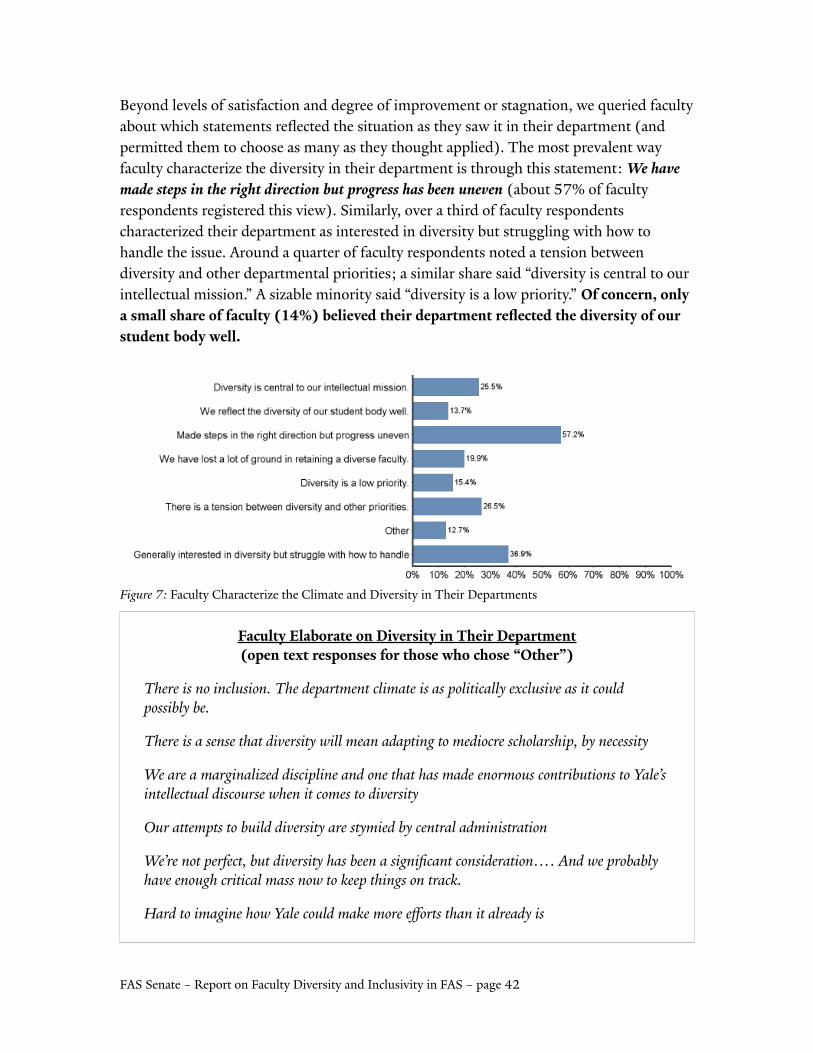
Beyond levels o4 satis4action and degree o4 improvement or stagnation, we queried 4aculty
about which statements reflected the situation as they saw it in their department (and
permitted them to choose as many as they thought applied). The most prevalent way
4aculty characterize the diversity in their department is through this statement: We have made steps in the right direction but progress has been uneven (about 57% o4 4aculty respondents registered this view). Similarly, over a third o4 4aculty respondents
characterized their department as interested in diversity but struggling with how to
handle the issue. Around a quarter o4 4aculty respondents noted a tension between
diversity and other departmental priorities; a similar share said “diversity is central to our
intellectual mission.” A sizable minority said “diversity is a low priority.” O- concern, only a small share o- -aculty (14%) believed their department reflected the diversity o- our student body well.
Figure 7: Faculty Characterize the Climate and Diversity in Their Departments
Faculty Elaborate on Diversity in Their Department(open text responses -or those who chose “Other”)
There is no inclusion. The department climate is as politically exclusive as it could possibly be.
There is a sense that diversity will mean adapting to mediocre scholarship, by necessity
We are a marginalized discipline and one that has made enormous contributions to Yale’sintellectual discourse when it comes to diversity
Our attempts to build diversity are stymied by central administration
We’re not per⇧ect, but diversity has been a significant consideration…. And we probably have enough critical mass now to keep things on track.
Hard to imagine how Yale could make more e,orts than it already is
FAS Senate – Report on Faculty Diversity and Inclusivity in FAS – page 42

On this measure, the sciences diverge 4rom the other divisions: only 17% o4 respondents
4rom the Sciences characterized their department as “diversity is central to our intellectual
mission” (compared to around 30% in the other divisions); very 4ew (7%) said they
reflect the diversity o4 their student body well (compared to 15 and 21% in humanities
and social sciences, respectively); and a larger share said “we have made steps in the right
direction but progress has been uneven” and “we are generally interested in diversity but
struggle with how to handle these issues.”
Given that a sizable share o4 4aculty believe that diversity progress has stagnated or
worsened, are dissatisfied with the climate o4 inclusion, and perceive their department as
not representative o4 the diversity among the student body, it is important to understand
what 4aculty think are the root causes o4 these 4ailures. The survey instrument asked
4aculty the reasons and 4actors that were most important in explaining this state o4 a5airs
(Fig. 8). The modal response is “Lack o4 diversity in the field at large” (54%). Around
thirty to thirty-five percent o4 4aculty respondents said: “diversity is not a priority 4or the
members and leaders o4 department”, “leaky pipeline”, “diGculty attracting 4aculty to New
Haven,” “lack o4 resources 4or making diversity a priority,” “pattern o4 institutional
4ailures and missed opportunities”. Smaller minorities said “lack o4 critical mass to recruit
excellent 4aculty,” “lack o4 department being held accountable by higher administration,”
“poor departmental climate or reputation 4or being unwelcoming o4 di5erence,” “we don’t
hire in the intellectual areas that would draw in more diverse 4aculty.” Open comments
exhibit a wide range o4 opinions but many respondents specifically mentioned the tenure
system, problems at the divisional level, and many drew distinctions between how
women 4ared vs. URM 4aculty (with the 4ormer 4aring better).
Figure 8: Faculty descriptions o4 4actors, practices, and obstacles that explain diversity concerns in their departments.
FAS Senate – Report on Faculty Diversity and Inclusivity in FAS – page 43
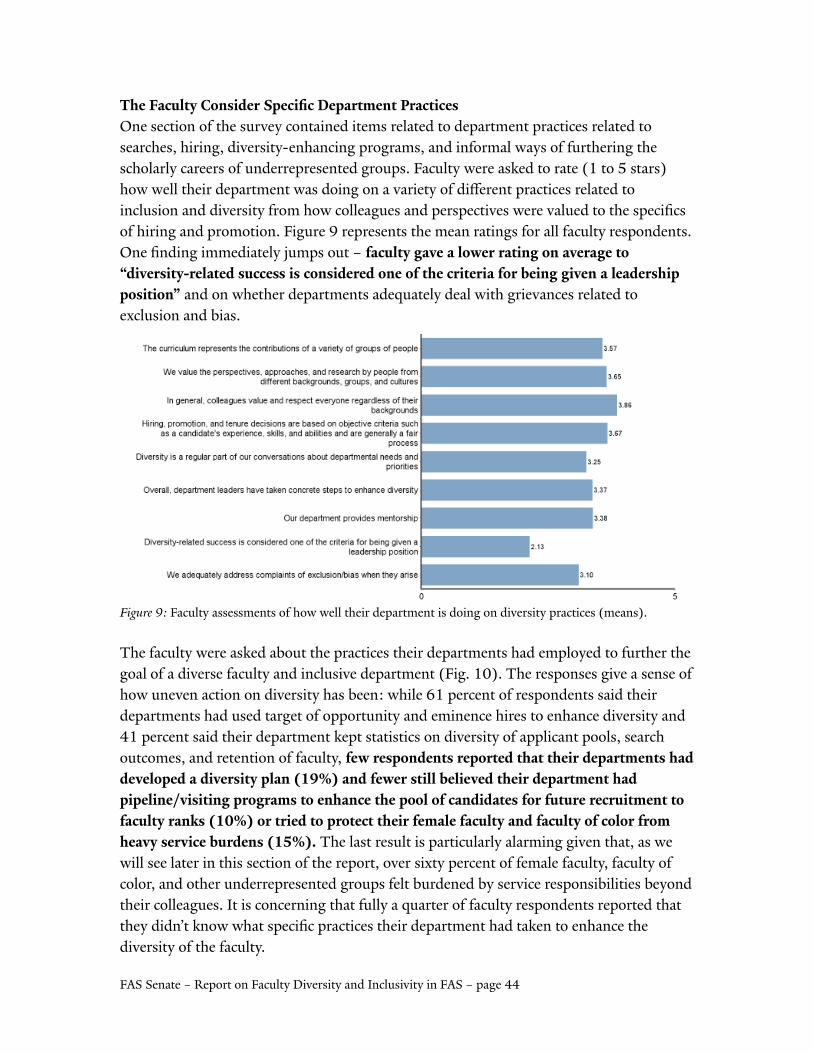
The Faculty Consider Specific Department PracticesOne section o4 the survey contained items related to department practices related to
searches, hiring, diversity-enhancing programs, and in4ormal ways o4 4urthering the
scholarly careers o4 underrepresented groups. Faculty were asked to rate (1 to 5 stars)
how well their department was doing on a variety o4 di5erent practices related to
inclusion and diversity 4rom how colleagues and perspectives were valued to the specifics
o4 hiring and promotion. Figure 9 represents the mean ratings 4or all 4aculty respondents.
One finding immediately jumps out – -aculty gave a lower rating on average to “diversity-related success is considered one o- the criteria -or being given a leadership position” and on whether departments adequately deal with grievances related to exclusion and bias.
Figure 9: Faculty assessments o4 how well their department is doing on diversity practices (means).
The 4aculty were asked about the practices their departments had employed to 4urther the
goal o4 a diverse 4aculty and inclusive department (Fig. 10). The responses give a sense o4
how uneven action on diversity has been: while 61 percent o4 respondents said their
departments had used target o4 opportunity and eminence hires to enhance diversity and
41 percent said their department kept statistics on diversity o4 applicant pools, search
outcomes, and retention o4 4aculty, -ew respondents reported that their departments haddeveloped a diversity plan (19%) and -ewer still believed their department had pipeline/visiting programs to enhance the pool o- candidates -or -uture recruitment to -aculty ranks (10%) or tried to protect their -emale -aculty and -aculty o- color -rom heavy service burdens (15%). The last result is particularly alarming given that, as we will see later in this section o4 the report, over sixty percent o4 4emale 4aculty, 4aculty o4
color, and other underrepresented groups 4elt burdened by service responsibilities beyond
their colleagues. It is concerning that 4ully a quarter o4 4aculty respondents reported that
they didn’t know what specific practices their department had taken to enhance the
diversity o4 the 4aculty.
FAS Senate – Report on Faculty Diversity and Inclusivity in FAS – page 44
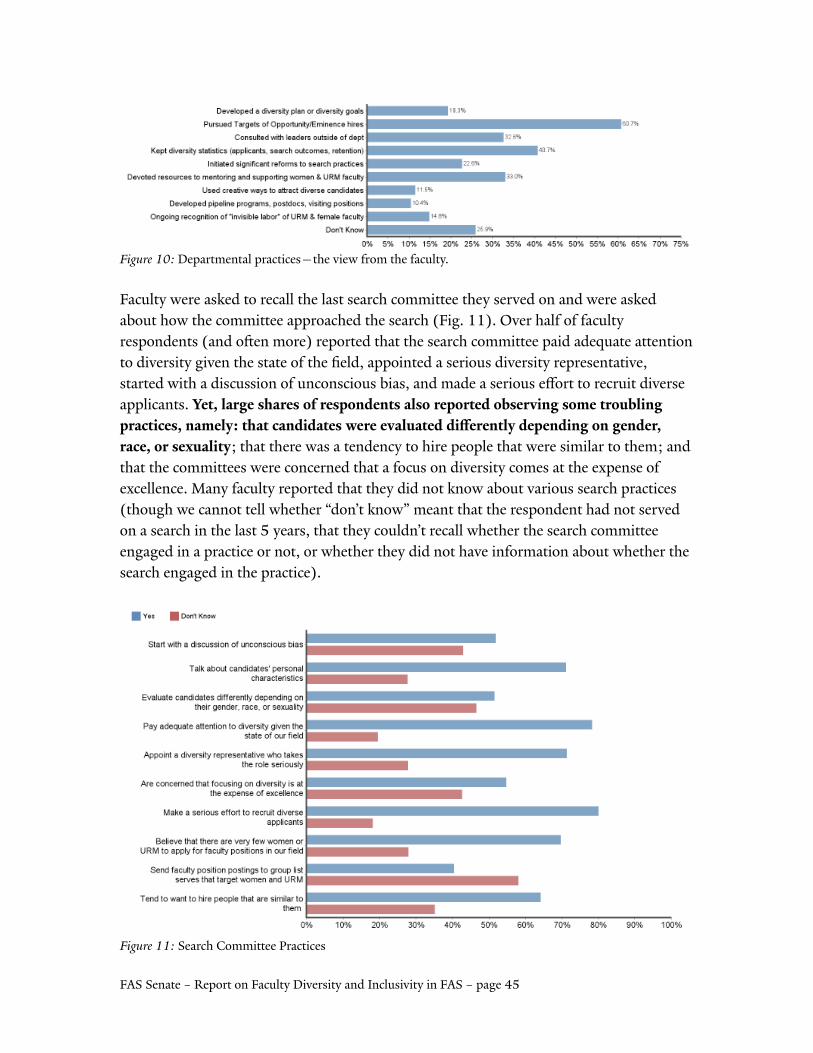
Figure 10: Departmental practices—the view 4rom the 4aculty.
Faculty were asked to recall the last search committee they served on and were asked
about how the committee approached the search (Fig. 11). Over hal4 o4 4aculty
respondents (and oCen more) reported that the search committee paid adequate attention
to diversity given the state o4 the field, appointed a serious diversity representative,
started with a discussion o4 unconscious bias, and made a serious e5ort to recruit diverse
applicants. Yet, large shares o- respondents also reported observing some troubling practices, namely: that candidates were evaluated di2erently depending on gender, race, or sexuality; that there was a tendency to hire people that were similar to them; andthat the committees were concerned that a 4ocus on diversity comes at the expense o4
excellence. Many 4aculty reported that they did not know about various search practices
(though we cannot tell whether “don’t know” meant that the respondent had not served
on a search in the last 5 years, that they couldn’t recall whether the search committee
engaged in a practice or not, or whether they did not have in4ormation about whether the
search engaged in the practice).
Figure 11: Search Committee Practices
FAS Senate – Report on Faculty Diversity and Inclusivity in FAS – page 45
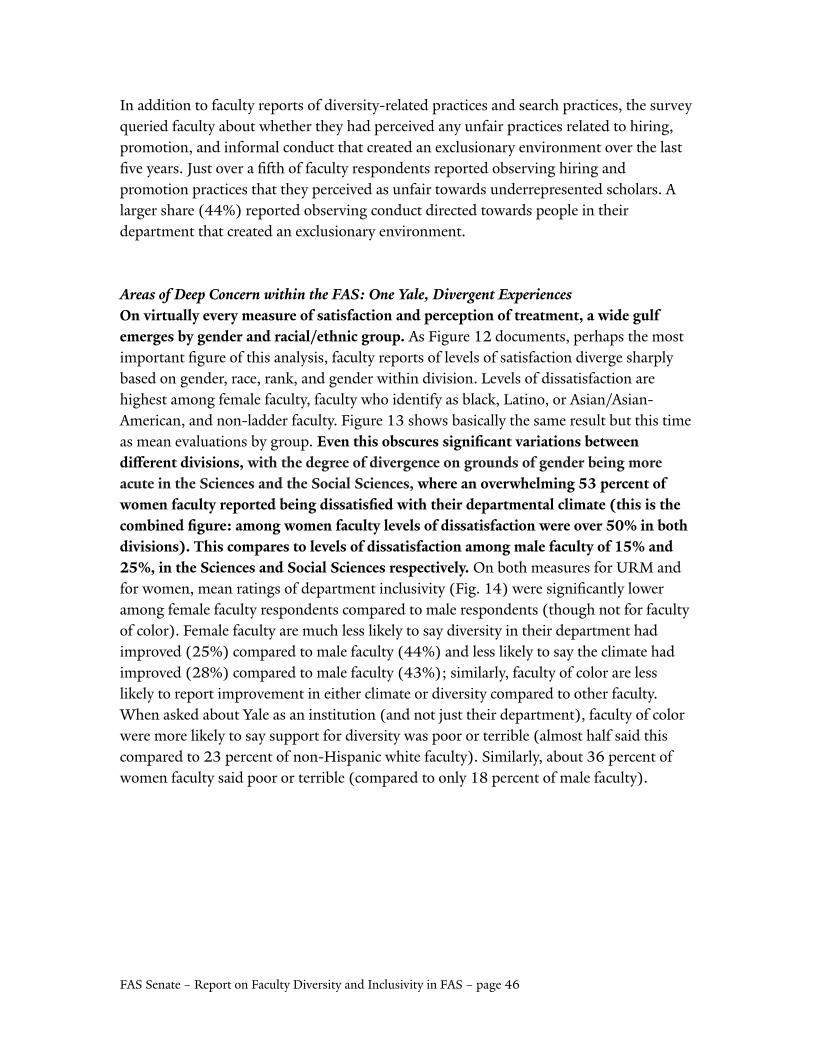
In addition to 4aculty reports o4 diversity-related practices and search practices, the survey
queried 4aculty about whether they had perceived any un4air practices related to hiring,
promotion, and in4ormal conduct that created an exclusionary environment over the last
five years. Just over a fiCh o4 4aculty respondents reported observing hiring and
promotion practices that they perceived as un4air towards underrepresented scholars. A
larger share (44%) reported observing conduct directed towards people in their
department that created an exclusionary environment.
Areas o� Deep Concern within the FAS: One Yale, Divergent ExperiencesOn virtually every measure o- satis-action and perception o- treatment, a wide gul- emerges by gender and racial/ethnic group. As Figure 12 documents, perhaps the most important figure o4 this analysis, 4aculty reports o4 levels o4 satis4action diverge sharply
based on gender, race, rank, and gender within division. Levels o4 dissatis4action are
highest among 4emale 4aculty, 4aculty who identi4y as black, Latino, or Asian/Asian-
American, and non-ladder 4aculty. Figure 13 shows basically the same result but this time
as mean evaluations by group. Even this obscures significant variations between di2erent divisions, with the degree o- divergence on grounds o- gender being more acute in the Sciences and the Social Sciences, where an overwhelming 53 percent o- women -aculty reported being dissatisfied with their departmental climate (this is the combined figure: among women -aculty levels o- dissatis-action were over 50% in both divisions). This compares to levels o- dissatis-action among male -aculty o- 15% and 25%, in the Sciences and Social Sciences respectively. On both measures 4or URM and 4or women, mean ratings o4 department inclusivity (Fig. 14) were significantly lower
among 4emale 4aculty respondents compared to male respondents (though not 4or 4aculty
o4 color). Female 4aculty are much less likely to say diversity in their department had
improved (25%) compared to male 4aculty (44%) and less likely to say the climate had
improved (28%) compared to male 4aculty (43%); similarly, 4aculty o4 color are less
likely to report improvement in either climate or diversity compared to other 4aculty.
When asked about Yale as an institution (and not just their department), 4aculty o4 color
were more likely to say support 4or diversity was poor or terrible (almost hal4 said this
compared to 23 percent o4 non-Hispanic white 4aculty). Similarly, about 36 percent o4
women 4aculty said poor or terrible (compared to only 18 percent o4 male 4aculty).
FAS Senate – Report on Faculty Diversity and Inclusivity in FAS – page 46
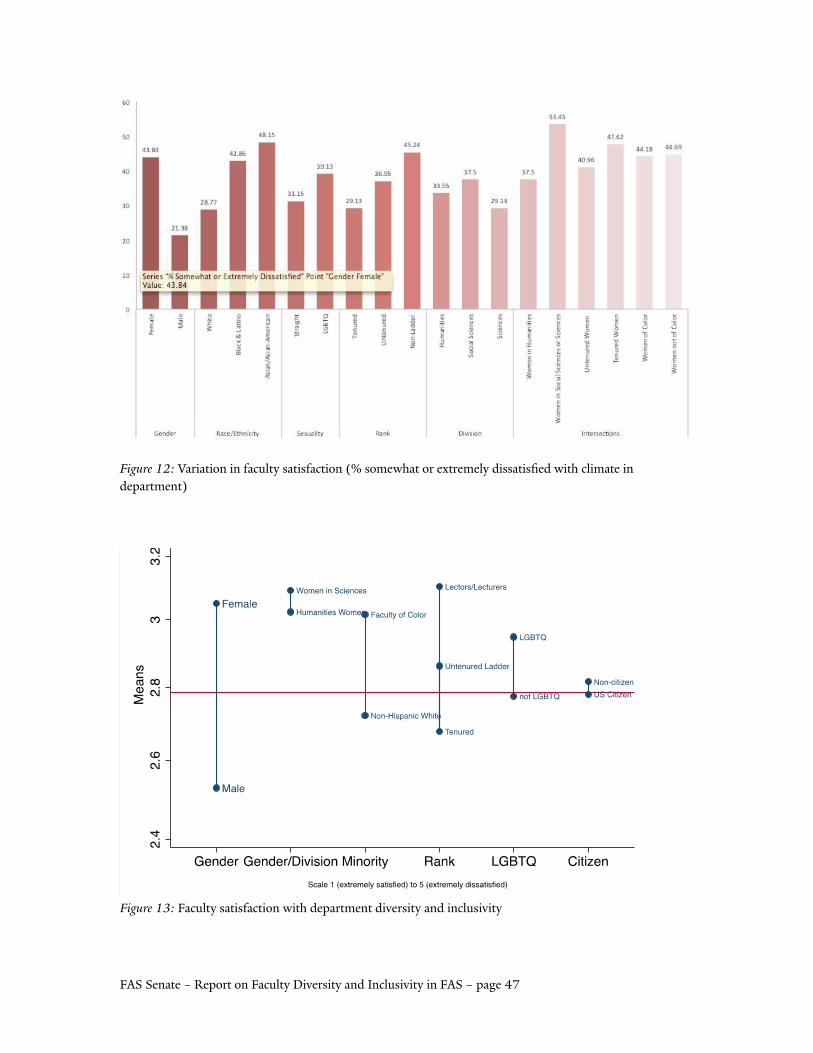
Figure 12: Variation in 4aculty satis4action (% somewhat or extremely dissatisfied with climate in department)
Figure 13: Faculty satis4action with department diversity and inclusivity
FAS Senate – Report on Faculty Diversity and Inclusivity in FAS – page 47
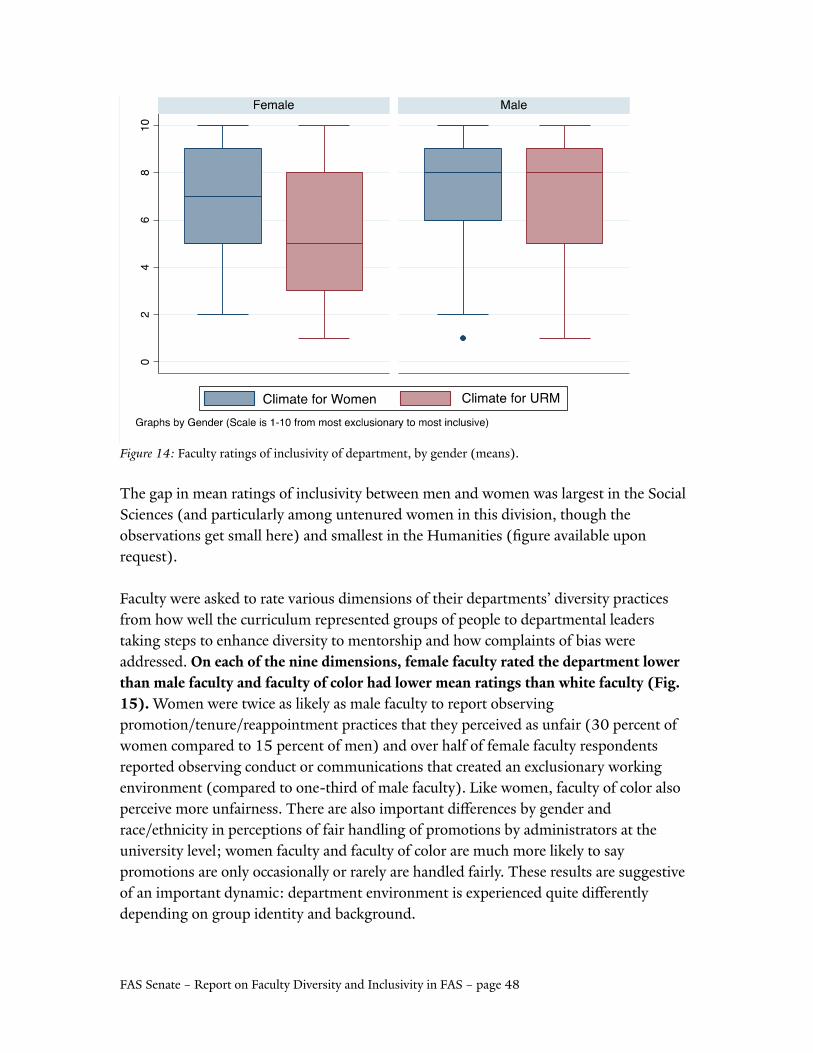
Figure 14: Faculty ratings o4 inclusivity o4 department, by gender (means).
The gap in mean ratings o4 inclusivity between men and women was largest in the Social
Sciences (and particularly among untenured women in this division, though the
observations get small here) and smallest in the Humanities (figure available upon
request).
Faculty were asked to rate various dimensions o4 their departments’ diversity practices
4rom how well the curriculum represented groups o4 people to departmental leaders
taking steps to enhance diversity to mentorship and how complaints o4 bias were
addressed. On each o- the nine dimensions, -emale -aculty rated the department lower than male -aculty and -aculty o- color had lower mean ratings than white -aculty (Fig. 15). Women were twice as likely as male 4aculty to report observing promotion/tenure/reappointment practices that they perceived as un4air (30 percent o4
women compared to 15 percent o4 men) and over hal4 o4 4emale 4aculty respondents
reported observing conduct or communications that created an exclusionary working
environment (compared to one-third o4 male 4aculty). Like women, 4aculty o4 color also
perceive more un4airness. There are also important di5erences by gender and
race/ethnicity in perceptions o4 4air handling o4 promotions by administrators at the
university level; women 4aculty and 4aculty o4 color are much more likely to say
promotions are only occasionally or rarely are handled 4airly. These results are suggestive
o4 an important dynamic: department environment is experienced quite di5erently
depending on group identity and background.
FAS Senate – Report on Faculty Diversity and Inclusivity in FAS – page 48
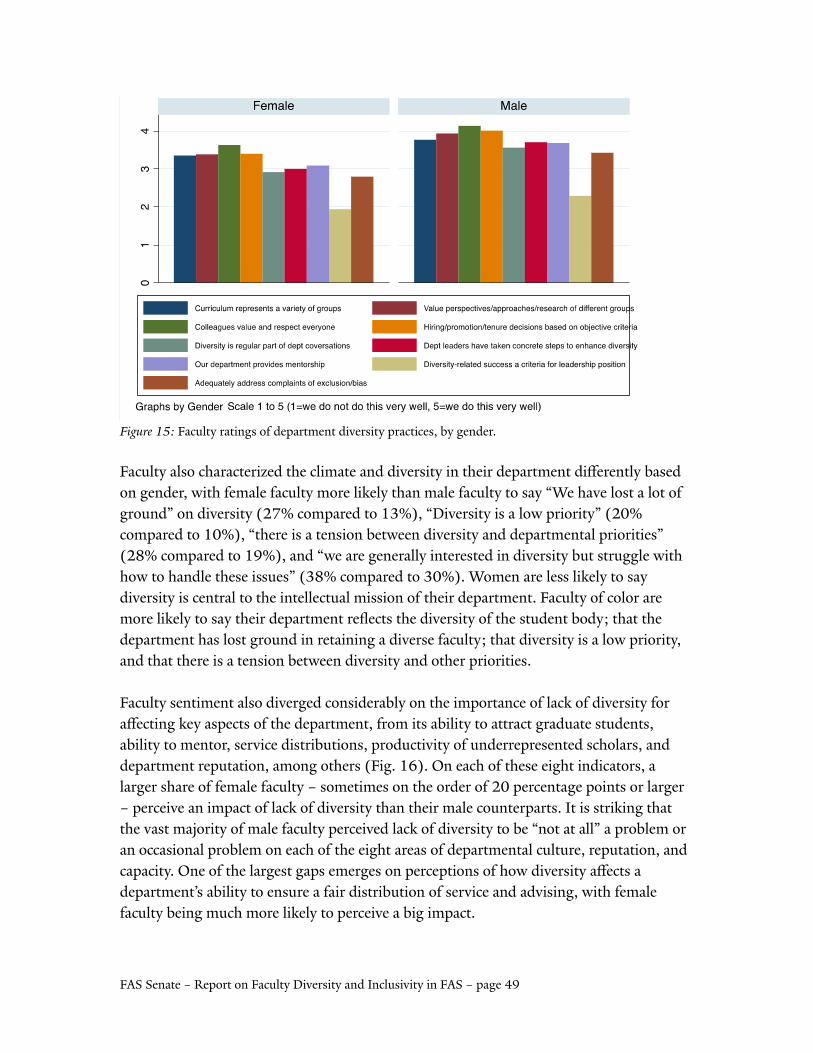
Figure 15: Faculty ratings o4 department diversity practices, by gender.
Faculty also characterized the climate and diversity in their department di5erently based
on gender, with 4emale 4aculty more likely than male 4aculty to say “We have lost a lot o4
ground” on diversity (27% compared to 13%), “Diversity is a low priority” (20%
compared to 10%), “there is a tension between diversity and departmental priorities”
(28% compared to 19%), and “we are generally interested in diversity but struggle with
how to handle these issues” (38% compared to 30%). Women are less likely to say
diversity is central to the intellectual mission o4 their department. Faculty o4 color are
more likely to say their department reflects the diversity o4 the student body; that the
department has lost ground in retaining a diverse 4aculty; that diversity is a low priority,
and that there is a tension between diversity and other priorities.
Faculty sentiment also diverged considerably on the importance o4 lack o4 diversity 4or
a5ecting key aspects o4 the department, 4rom its ability to attract graduate students,
ability to mentor, service distributions, productivity o4 underrepresented scholars, and
department reputation, among others (Fig. 16). On each o4 these eight indicators, a
larger share o4 4emale 4aculty – sometimes on the order o4 20 percentage points or larger
– perceive an impact o4 lack o4 diversity than their male counterparts. It is striking that
the vast majority o4 male 4aculty perceived lack o4 diversity to be “not at all” a problem or
an occasional problem on each o4 the eight areas o4 departmental culture, reputation, and
capacity. One o4 the largest gaps emerges on perceptions o4 how diversity a5ects a
department’s ability to ensure a 4air distribution o4 service and advising, with 4emale
4aculty being much more likely to perceive a big impact.
FAS Senate – Report on Faculty Diversity and Inclusivity in FAS – page 49
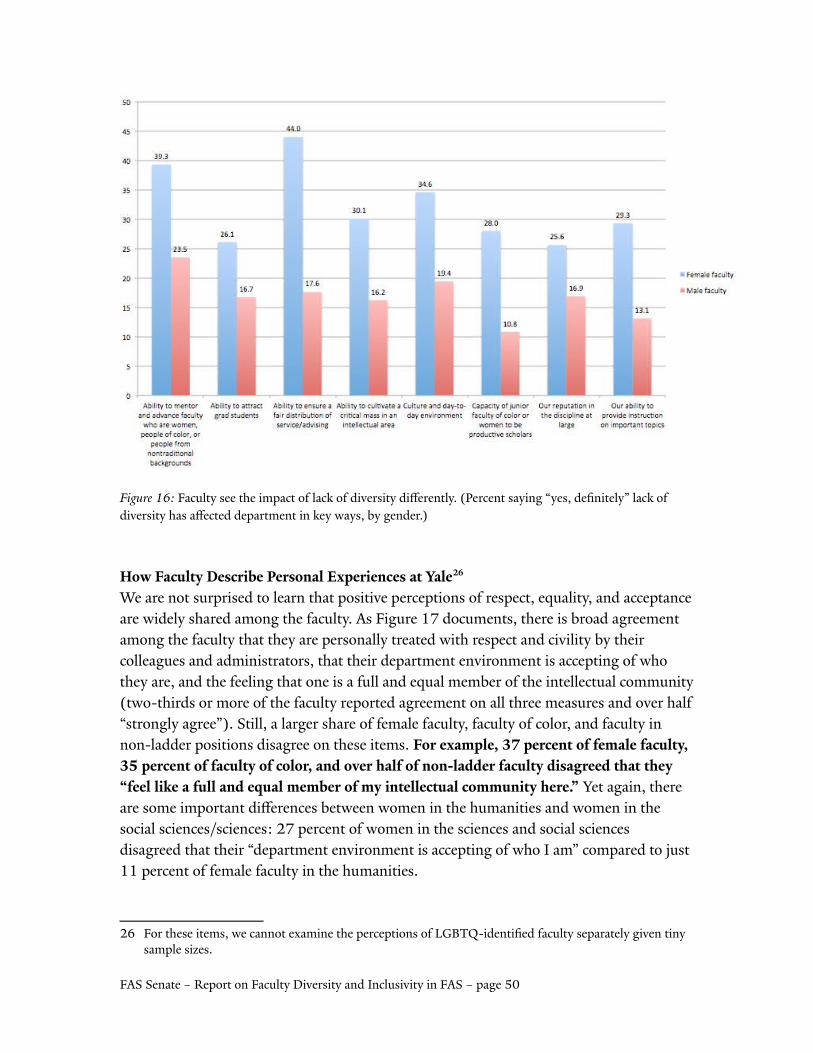
Figure 16: Faculty see the impact o4 lack o4 diversity di5erently. (Percent saying “yes, definitely” lack o4 diversity has a5ected department in key ways, by gender.)
How Faculty Describe Personal Experiences at Yale26
We are not surprised to learn that positive perceptions o4 respect, equality, and acceptance
are widely shared among the 4aculty. As Figure 17 documents, there is broad agreement
among the 4aculty that they are personally treated with respect and civility by their
colleagues and administrators, that their department environment is accepting o4 who
they are, and the 4eeling that one is a 4ull and equal member o4 the intellectual community
(two-thirds or more o4 the 4aculty reported agreement on all three measures and over hal4
“strongly agree”). Still, a larger share o4 4emale 4aculty, 4aculty o4 color, and 4aculty in
non-ladder positions disagree on these items. For example, 37 percent o- -emale -aculty, 35 percent o- -aculty o- color, and over hal- o- non-ladder -aculty disagreed that they “-eel like a -ull and equal member o- my intellectual community here.” Yet again, there are some important di5erences between women in the humanities and women in the
social sciences/sciences: 27 percent o4 women in the sciences and social sciences
disagreed that their “department environment is accepting o4 who I am” compared to just
11 percent o4 4emale 4aculty in the humanities.
26For these items, we cannot examine the perceptions o4 LGBTQ-identified 4aculty separately given tiny sample sizes.
FAS Senate – Report on Faculty Diversity and Inclusivity in FAS – page 50
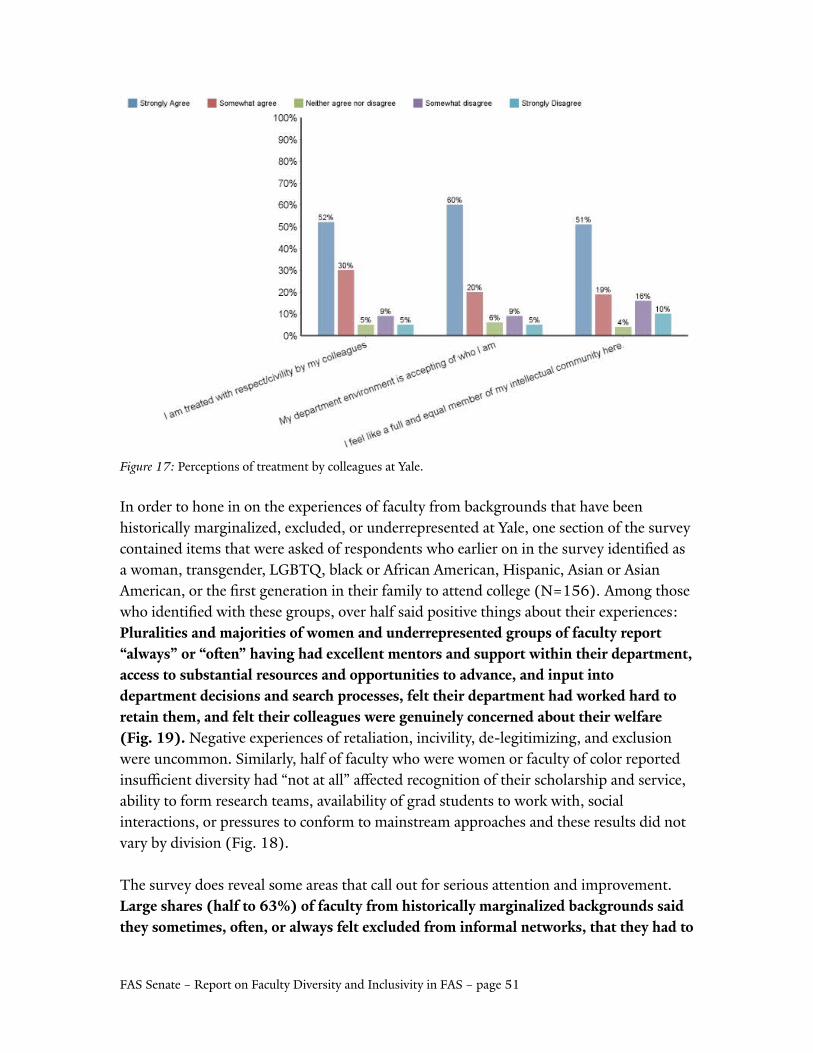
Figure 17: Perceptions o4 treatment by colleagues at Yale.
In order to hone in on the experiences o4 4aculty 4rom backgrounds that have been
historically marginalized, excluded, or underrepresented at Yale, one section o4 the survey
contained items that were asked o4 respondents who earlier on in the survey identified as
a woman, transgender, LGBTQ, black or A4rican American, Hispanic, Asian or Asian
American, or the first generation in their 4amily to attend college (N=156). Among those who identified with these groups, over hal4 said positive things about their experiences:
Pluralities and majorities o- women and underrepresented groups o- -aculty report “always” or “oMen” having had excellent mentors and support within their department,access to substantial resources and opportunities to advance, and input into department decisions and search processes, -elt their department had worked hard to retain them, and -elt their colleagues were genuinely concerned about their wel-are (Fig. 19). Negative experiences o4 retaliation, incivility, de-legitimizing, and exclusion were uncommon. Similarly, hal4 o4 4aculty who were women or 4aculty o4 color reported
insuGcient diversity had “not at all” a5ected recognition o4 their scholarship and service,
ability to 4orm research teams, availability o4 grad students to work with, social
interactions, or pressures to con4orm to mainstream approaches and these results did not
vary by division (Fig. 18).
The survey does reveal some areas that call out 4or serious attention and improvement.
Large shares (hal- to 63%) o- -aculty -rom historically marginalized backgrounds said they sometimes, oMen, or always -elt excluded -rom in-ormal networks, that they had to
FAS Senate – Report on Faculty Diversity and Inclusivity in FAS – page 51
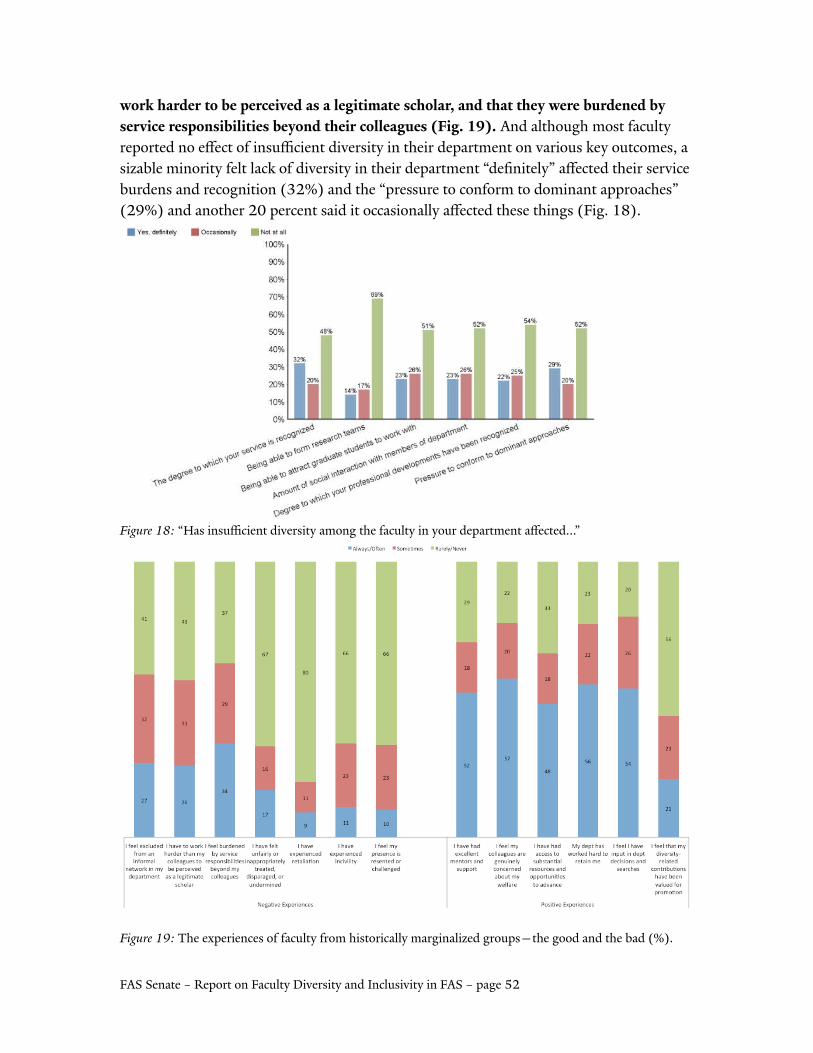
work harder to be perceived as a legitimate scholar, and that they were burdened by service responsibilities beyond their colleagues (Fig. 19). And although most 4aculty reported no e5ect o4 insuGcient diversity in their department on various key outcomes, a
sizable minority 4elt lack o4 diversity in their department “definitely” a5ected their service
burdens and recognition (32%) and the “pressure to con4orm to dominant approaches”
(29%) and another 20 percent said it occasionally a5ected these things (Fig. 18).
Figure 18: “Has insuGcient diversity among the 4aculty in your department a5ected...”
Figure 19: The experiences o4 4aculty 4rom historically marginalized groups—the good and the bad (%).
FAS Senate – Report on Faculty Diversity and Inclusivity in FAS – page 52
VII. IMPACT OF FACULTY DIVERSITY AND INCLUSIVITY ON GRADUATE STUDENTS
Graduate Students and the Issue o- Faculty DiversityThe subcommittee collected commentary on diversity and the campus climate 4rom the
graduate student body through meetings with students across the divisions in both large
and small groups, including the 64 members o4 the GSA’s representative body, members
o4 the Graduate Students o4 Color Coalition, representatives 4rom GESO, and clusters o4
students (in 4s and 5s) representing specific units across the humanities, social science,
and science divisions—4ace to 4ace conversations with over 100 students in all. In a 4ew
instances, students 4ollowed up privately with comments they had not 4elt com4ortable
expressing publically. Though this sample was not scientific or numerically
“representative,” the 4ollowing summary does convey important patterns o4 thought,
4eeling, opinion, and experience expressed across a large group o4 students who are
themselves diverse in race, gender, sexual orientation, cohort, and discipline. Their
insights and observations help to illuminate the costs to the university mission when we
4all short in meeting stated diversity objectives.
ClimateGraduate student comment on the existing campus climate was varied, but the
predominant note was one o4 extreme discouragement. In general, students in the social
sciences and humanities were more vocal on issues o4 race; students in the sciences, more
vocal on gender. One discussion group identified only one third o4 Yale’s 4aculty as
“proactive allies” in making the university a welcoming place 4or all students. The
remainder consisted in their view o4 one third “passive bystanders” and one third “a real
problem,” this latter category encompassing 4aculty behaviors ranging 4rom “o5ensively
insensitive” to “overtly hostile” (some incidents students say they have reported to chairs
or other administrators, but most they have not). The most striking thing about this
assessment is that, in the overall contours o4 our discussions with students, this was at the more positive end o⇧ the spectrum. One student o4 color in the social sciences set the percentage o4 “true allies” among his 4aculty at “1 to 2%” (“In my department there’s only
one 4aculty member who cares,” said another student o4 color). Pressed to characterize the
overall picture, one 4ocus group hazarded that beyond the 10 or 15% o4 students who are
4ully “disa5ected or alienated,” the “middle 70%” o4 the graduate population is
“dissatisfied,” though they did agree that the current diversity initiatives are “hope4ul.”
In its specifics, the picture that emerged 4rom these discussions is one o4 a campus climate
in urgent need o4 redress:
FAS Senate – Report on Faculty Diversity and Inclusivity in FAS – page 53

• The students we spoke with in under-represented populations perceive an
institutional culture at Yale in which they may occasionally be “invited in as
exceptions,” but only under scrutiny and with a power4ul and discomfiting imperative
to “fit in.”
• Students interviewed report a general lack o4 communication on important issues o4
inclusion, perceiving that meaning4ul discussion on these matters is limited to very
small circles on campus, and is 4ully 4oreclosed in many units by a stubborn and
widespread denial that discrimination exists at Yale.
• Students interviewed report “clumsy and disingenuous” recruiting e5orts in some
departments, in which women and people o4 color (both students and 4aculty) are
routinely “dragooned” into doing hollow and unheeded “diversity work” around
graduate recruiting or 4aculty searches.
• Students interviewed perceive a gendered division o4 labor in many departments,
according to which devalued labor flagged as “service” is disproportionately allocated
to women. This colors their outlook on the pro4ession.
• The morale in many social science units is extremely low according to students 4rom
under-represented populations—in some, due to a wave o4 recent departures; in
others, due to the general race/gender profile o4 the 4aculty.
• Despite some positive examples o4 important women 4aculty mentors in individual
units, one 4ocus group 4rom the sciences reported that being “scared” o4 the PI in a lab
is “common” at Yale, and that encounters with departmental oGcers is such that
students generally 4eel there is “nowhere to turn where complaints o4 discrimination
or harassment will be 4airly heard” in such circumstances.
Most common among students were assessments that the campus climate o4 inclusion is
“dire,” “poor,” “harsh,” or at best, that the university remains “mute” about issues o4
inclusion, and that genuine concern is rare, except in moments—like last 4all—o4 overt
crisis.
StakesGraduate students are 4orthcoming and eloquent in enumerating what they perceive to be
at stake in the current state o4 diversity at Yale.
Psychic costs Students interviewed 4rom under-represented groups experience Yale’s lack o4 4aculty
diversity as a kind o4 daily and unrelenting discouragement: “you can enter the system as
a student, but don’t expect a 4uture as a pro4essor.” Some discussed this as a matter o4
FAS Senate – Report on Faculty Diversity and Inclusivity in FAS – page 54
pro4essional hopelessness or pessimism; others as the institution’s implicit “non-
investment” in them or “devaluation” o4 them. But many described its immense psychic
cost in very personal terms.
Academic and pro⇧essional costsStudents in under-represented populations perceive the lack o4 4aculty diversity in many
fields as hampering their own productivity and success in significant ways:
• Inso4ar as women and/or students o4 color in many units experience support 4rom
4aculty who are in the majority as “ambivalent,” “unsteady,” or “rare,” they report
systemic imbalances between the general attention, guidance, support,
encouragement, and mentoring they receive in comparison with their white/male
counterparts.
• Many students in under-represented populations report an inverse relationship
between 4aculty rank on the one hand, and the accessibility, engagement, and care o4
their 4aculty on the other. In many fields, that is, it is junior 4aculty who are most
invested in minority candidates, and it is senior 4aculty (the most experienced and
influential among us) who remain aloo4. This generalization obviously does not hold
across every unit o4 the university; but where it does hold, students argue that it
represents another systemic imbalance in graduate training and support.
• Rates o4 4aculty attrition (whether through departure or non-promotion) may thus
a5ect minority students to a disproportionate extent. Women and students o4 color
report carrying out their work within a context o4 ever-present 4ear o4 losing their
most valued advisors. Faculty turnover has been “hurt4ul, both to my pro4essional
prospects and to my general morale,” said one.
• Many social science and humanities students wishing to specialize in areas o4 race,
ethnicity, or gender perceive that their areas o4 specialization are devalued or
marginalized within their departments. Others report systematic departmental e5orts
to mentor students away 4rom such subject areas—to 4oreclose legitimate paths o4 student inquiry as part o4 the “pro4essionalization” and “mentoring” process.
• Students 4rom under-represented populations note that “mentoring” and
“pro4essionalization” carry added layers o4 significance in their case, and 4eel that they
are underserved and perhaps disadvantaged by a 4aculty that does not/cannot speak to
these dimensions o4 their training. “In graduate school you are not only learning a
field,” said one A4rican American student, “you are learning how to 4unction in an
institution, how to inhabit the pro4ession. That can’t be taught to me 4ully by anyone
who hasn’t been black.”
For all o4 these reasons, students say they experience levels o4 intellectual and social
isolation that a5ect their studies and their prospects.
FAS Senate – Report on Faculty Diversity and Inclusivity in FAS – page 55

Costs to the institutionIn addition to these “substantial pro4essional or academic costs” paid by individual
students, graduate students interviewed argued that in the culture o4 Yale, exclusion
begets exclusion. They widely perceive that attrition among both 4aculty and graduate students in several units is attributable to diversity issues and to the pro4essional and
psychic costs paid by under-represented populations. Students express a strong certainty
—which they back with anecdotal evidence—that Yale loses prospective students because
o4 the under-representation o4 women and/or people o4 color on the 4aculty (students in
social science units were especially vocal on this issue, and spoke with strong and unified
conviction that this has been the case). Students also 4eel that Yale is not competitive with
its peer institutions when it comes to important topics across disciplines (they point to
“trans” issues as a particularly glaring example). Graduate students perceive an
intellectual conservatism in the articulation o4 Yale’s priorities and its reigning definitions
o4 “excellence” that disadvantages innovation and diversity, hindering the recruitment o4
potentially cutting-edge 4aculty and students.
Student Analysis and RecommendationsStudents articulate a sophisticated, systemic analysis o4 the issues at Yale, including a
critique o4 the institution’s piecemeal approach to re4orm and its neglect o4 pipeline
approaches. They also express concern that there seem to be “no teeth” to the university’s
diversity plan, that departments seem to have license to pursue the same 4ailed or
exclusionary practices year aCer year. They note, 4urther, that the dramatic under-
representation o4 certain populations among students and 4aculty translates directly into a
pervasive denial that minority concerns are important or legitimate. As noted above, the
lack o4 diversity reproduces its own conditions.
Students’ specific recommendations 4or redress and re4orm are as 4ollows:
The university should craC and widely publicize a comprehensive statement on diversity
in hiring, including an articulation o4 the administration’s strategic approach to
diversi4ying the institution; its plan 4or doing so; its specific goals; and its understanding
o4 the contribution that diversity makes to Yale’s intellectual mission. Thus 4ar, students
4eel, university communications on these issues have been either de4ensive, shallow, or
lacking in specificity.
Students are hungry 4or more dialogue with 4aculty at the departmental level, and
especially 4or 4aculty initiation o4 such dialogue. They uni4ormly report that their
confidence in the institution would increase i4 4aculty representing majority populations demonstrated more initiative, concern, and understanding.
FAS Senate – Report on Faculty Diversity and Inclusivity in FAS – page 56

Students say that meaning4ul support or its lack are lived most meaning4ully on the ground within departments; and so the department has to be the leading unit a5ecting
change across the university. To this end, students urge more rigorous and sophisticated
diversity training 4or department Chairs and DGSs. They find that de4ensiveness and
avoidance are the most common postures among departmental oGcers who seem poorly
in4ormed on the issues and on best practices.
Students desire lecture series and workshops that would educate them on the workings o4
the university and demysti4y the procedures and practices around hiring, recruitment,
and retention. They 4eel that they could be “better advocates 4or diversity” i4 they had
access to better in4ormation about how the university operates.
Students express a great deal o4 admiration 4or the work done in the oGce o4 the
Associate Dean 4or Graduate Student Development and Diversity, but they perceive this
oGce to be significantly under-resourced and under-sta5ed.
Students are highly critical o4, and insulted by, a rhetoric o4 “excellence” at Yale that
subtly implies that the goals o4 “excellence” and “diversity” are at odds with one another.
Almost to a person they report a certain cynicism regarding the university’s mantra that
“diversity is excellence,” as though that were merely a thin veneer to paper over the more
diversity-hostile logics that actually drive practice at Yale. Many are suspicious o4 a logic
o4 university standards that, in their experience, puts their most beloved and respected
mentors at risk.
Best Practices in MentoringIn addition, the students we con4erred with outlined the 4ollowing general guidelines 4or
best practices in graduate mentoring:
CommunicationMentors and mentees should be able to discuss openly and 4reely anything related to
work. Communication is an important component o4 a mentor-mentee relationship and
e5ective and honest communication enhances the relationship.
Mentors should take it upon themselves to find out about their mentees’ prior experience,
needs, and expectations regarding the mentoring relationship, as well as their general
level o4 preparation. They should also communicate their own expectations and goals to
the students.
Mentors should communicate their availability to mentees 4or help and questions outside
o4 classroom or lab settings; and they should take a proactive approach in anticipating
FAS Senate – Report on Faculty Diversity and Inclusivity in FAS – page 57
questions and providing necessary advice and background. Mentees do not always ask or
even know what to ask, and this can result in miscommunication and/or a student’s
4acing obstacles or diGculties that are in 4act avoidable. Mentors should strive to give
mentees the 4ull benefit o4 their own experience: it is help4ul to have a mentor who has
success4ully completed this process assist a student in strategic planning (i.e. helping the
student to refine a project well in advance o4 4ellowship deadlines, etc.).
Mentors should help students articulate clear goals and strategies 4or each semester’s
work, and should be available 4or honest discussions about e5ective planning in the
context o4 potential impediments a student might 4ace. Students in challenging financial
or 4amily circumstances should be able to plan realistically with their advisor without
4eeling shamed.
Mentors should initiate a 4rank conversation with students, i4 they see them 4alling
behind or otherwise 4ailing to meet expectations. Whether the problem is a shortcoming
in research, a mismanagement o4 priorities, or an ineGcient use o4 time and resources, a
mentor should help train the student in the processes that go into success4ul academic work.
AdvisingFaculty should educate themselves about the overall advisory and mentoring picture in
their department—who is doing what, 4or how many mentees, and how exactly. Advising
and mentoring would be tightly twinned processes in an ideal world, but this is not
always the case. While the advisor possesses the specialized knowledge to evaluate a
student's scholarship, s/he may not be the most strategically positioned to help the
student negotiate the complexities o4 pro4essionalization—whether this is because the
advisor is overcommitted, disinterested, or too 4ar removed 4rom the realities o4 today's
job market. For students o4 color, these concerns are 4urther compounded by anxieties
over how their work will be perceived and received. Faced with these challenges, students
oCen seek mentoring beyond their 4ormal advisors, which may disproportionately burden
non-tenured 4aculty, women, and scholars o4 color. Over time, this creates a circular
problem in which students do not receive the mentoring they need, and in which young
4aculty (oCen o4 color and/or women) may 4eel obligated to fill the void, perhaps to their
pro4essional detriment. I4 Yale is seriously committed to diversi4ying the pro4essoriate in
this generation and the next, we need to take these considerations into account when
recruiting and training graduate students and when hiring and tenuring 4aculty.
Stewarding Students into the Pro⇧essionA mentor should be thought4ul and intentional about appropriately introducing students
to his/her own pro4essional networks.
FAS Senate – Report on Faculty Diversity and Inclusivity in FAS – page 58
Advisors should be proactive about communicating vital insider in4ormation to their
students about how their field, discipline, and the academy in general work, and they
should be even-handed in dispensing such in4ormation.
Mentors should help their mentees to take advantage o4 every available and appropriate
opportunity, by alerting students to announcements, timetables, and protocols 4or
con4erence proposals, 4ellowship applications, workshops, and other important
experiences beyond the curriculum. This in4ormation, too, should be dispensed even-
handedly to relevant mentees across the department.
Cause -or OptimismDespite students’ critical views o4 university conditions in the area o4 diversity, several
important success stories do emerge 4rom their observations and commentary. Some
units at Yale have success4ully bucked the trends, and where that has been the case
(regarding gender issues in the sciences and race issues in the humanities, most
generally), students are very quick to recognize such success and to elaborate what this
has meant to them. The students interviewed in such units report 1) 4eeling a general
sense o4 belonging and ease that puts their own graduate school struggles on a par with
those o4 their white/male peers; 2) enjoying a strong rapport with 4aculty members, and
an experience o4 a kind o4 multi-dimensional mentoring that is deeply caring and also
pro4essionally thorough; 3) enjoying intellectual support 4or the specific work they wish
to pursue and 4aculty encouragement when it comes to their capacity to see it to 4ruition;
and consequently, 4) experiencing what one student called “a welcome to the field that
makes it possible to imagine a com4ortable 4uture—is that crazy?” This “welcome to the
field” is an enormous 4actor in the graduate experience, and we might reasonably suppose
that it translates into a student’s general outlook and success in myriad large and small
ways. It is important to know that, despite the problems in Yale’s culture outlined above
and elsewhere in this report, some women, students o4 color, and queer students at Yale
are nonetheless experiencing this in their departments.
FAS Senate – Report on Faculty Diversity and Inclusivity in FAS – page 59

VII. CONCLUSION
We began this report by stating that Yale is at a critical juncture where diversity and
inclusivity are concerned. The negative e5ects o4 inattention to diversity and inclusivity
undermine the teaching and research mission o4 the university and the flourishing o4 its
4aculty.
This Senate committee was conceived in the wake o4 the campus protests in Fall 2015
and as we were concluding our work on this report, we received a cogent reminder o4 the
imperative 4or greater diversity and inclusivity at Yale in the 4orm o4 the debate about the
recent college naming decisions o4 April 17, 2016. This debate is a reminder that Yale, in
common with many other universities, continues to grapple with a divided legacy and
divergent histories (in this case, the historical legacies o4 slavery in this nation’s history).
As a 4aculty, how we navigate our shared, intersectional history has a pro4ound bearing on
the curriculum that we teach, the way in which we mentor (or 4ail to mentor) the next
generation o4 scholars, and our interaction with each other. Regardless o4 our disciplines,
we are all in history.
The University leadership has a crucial responsibility 4or 4ostering a diverse intellectual
community rather than a divergent one. The ambiguous phrase ‘diverse intellectual
community’ captures what we see as the interdependence o4 intellectual diversity and
4aculty diversity. This is not to make the specious claim that 4aculty diversity
automatically entails intellectual diversity, but to make the simpler claim that an
expansive, intersectional model in which no single discipline or intellectual tradition has a
monopoly on knowledge and truth is a prerequisite 4or greater diversity and inclusivity.
President Salovey took a strong stance back in November 2015 in claiming diversity as
integral to the intellectual mission o4 the university and in calling 4or a better, more
inclusive Yale. This represents an important opportunity 4or the leadership o4 FAS to set
the tone 4or diversity as a shared academic and intellectual project, to secure the resources
necessary 4or realizing FAS-specific diversity goals, and 4or 4aculty in FAS to pool their
expertise and imagination to find ways o4 realizing these goals. When we review progress
on the diversity initiative in a year’s time, we hope that this will not prove to have been
another missed opportunity.
FAS Senate – Report on Faculty Diversity and Inclusivity in FAS – page 60

ACKNOWLEDGMENTS
While the committee takes 4ull responsibility 4or the contents o4 this report, we would
like to thank the 4ollowing colleagues 4or their assistance:
Henry (Sam) Chauncey, Jr., Former Secretary o4 Yale University
Dr. Francisco Cigarroa, M.D., University o4 Texas, Member o4 the Yale
Corporation (2010–16)
Pro4essor Jack Dovidio, Dean o4 Academic A5airs o4 the FAS
Pro4essor Tamar Gendler, FAS Dean
Pro4essor Shiri Goren
Pro4essor Margaret Homans
Cynthia Langin, Senior Analyst, OGce o4 Institutional Research
Tim Pavlis, Assistant Vice President 4or Strategic Analysis and Institutional Research
Rose Rita Riccitelli, Program Coordinator, FAS Faculty Senate
Pro4essor Katie Trumpener
Pro4essor Bill Rankin
All 4aculty who responded to the survey on Faculty Diversity and Inclusivity
Representatives o4 GSA
Representatives o4 GESO
The Graduate Students o4 Color Coalition
The Women Faculty Forum
FAS Senate – Report on Faculty Diversity and Inclusivity in FAS – page 61
APPENDIX 1
Views o- Female and URM Faculty in the Physical and Biological Sciences
IntroductionAs the data analyzed in Section V o4 this report shows, there is a notable imbalance in the
representation o4 women and URM 4aculty between the di5erent divisions o4 FAS and
between di5erent sub-fields within each division. While a systematic analysis o4 each
department and field is beyond the scope o4 this report, the committee recognizes that the
representation o4 women and URM 4aculty is particularly challenging in the Sciences, and
decided to undertake a detailed case-study o4 the situation in the Sciences, taking
advantage o4 the expertise and experience o4 members o4 our committee. We hope that
this case-study will encourage similarly searching studies within the di5erent Science,
Technology, Engineering, and Mathematics (STEM) fields at Yale and that the
recommendations that we make here might prove help4ul 4or 4uture discussions about the
underrepresentation o4 women and URM 4aculty in the Sciences at Yale. This section o4
the report is based on interviews with women and URM 4aculty in the sciences and also
draws on existing reports, which we cite on pp. 68–69 o4 this report. We note that views
on diversity and inclusivity may di5er across and within the di5erent Science
departments and units in FAS and this report makes no pretense o4 speaking 4or all
4aculty in the Sciences. Instead, starting with the assumption that no single racial or
gendered group has a monopoly on intelligence and the capacity 4or breakthrough
research in the sciences, we 4ocus on documenting existing challenges to diversity and
inclusivity and on suggestions and recommendations 4or improving the climate 4or
women and URM 4aculty.
Diversity and Inclusivity in the SciencesAs reported in Section III o4 this report and elsewhere, participation o4 women in the
Sciences has increased since the nineties. The National Science Foundation has conducted
recently a comprehensive study on the participation o4 Women, Minorities, and Persons
with Disabilities in Science and Engineering.27 While there are variations across fields, the
percentage o4 women in 4ull-time, 4ull pro4essor positions in STEM fields that include
science, engineering, and health doctorates at research institutions has increased 4rom
8.1% in 1993 to 22.4% in 2013 (see Figure 1). By contrast, the percentage o4 tenured
women 4aculty at Yale in 2015 is 10% in biological sciences, 15% in physical sciences,
and 6% in engineering (these numbers do not include the medical school). The numbers
are somewhat better at the term 4aculty level, at 29%, 29%, and 28% in biological,
physical sciences, and engineering, respectively. Currently, over 50% o4 doctoral degrees
in biological sciences are awarded to women, and 30% in the physical sciences.
27Women, Minorities, and Persons with Disabilities in Science and Engineering: 2013, National Center 4or Science and Engineering Statistics Directorate 4or Social, Behavioral and Economic Sciences, National Science Foundation. The report is available at: http://www.ns4.gov/statistics/wmpd/2013/pd4/ns413304_digest.pd4
Detailed data is available at http://www.ns4.gov/statistics/2015/ns415311/
FAS Senate – Report on Faculty Diversity and Inclusivity in FAS – page 63

The share o4 4ull-time, 4ull pro4essorships held by underrepresented minorities is lower
than and has risen more slowly than the share held by women. Data 4rom 2013 indicates
that URM 4ull pro4essors occupied 4% o4 positions at the nation’s most research-intensive
institutions. Although underrepresented minority women held smaller shares o4 tenure-
track positions than did Asian women, they held about the same share o4 tenured
positions. At Yale, the number o4 URM tenured 4aculty is 5% in Bio, 4% in Phys Sci, and
3% in Engr (“Unknown” reported at 2% Bio, 3% Phys, and 0% Engr). Term URM
4aculty is 0% Bio, 3% Phys, and 22% in Engr (with “unknown” at 12%, 11%, and 11%).
Figure 1: Women as a percentage o4 in 4ull-time, 4ull pro4essorships with science, engineering, and health doctorates, by employing institution: 1993–2013. Yale 2015 percentages are indicated in black on the
right. (source: http://www.ns4.gov/statistics/2015/ns415311/digest/theme7.c4m#women)
Figure 2: Underrepresented minorities as a percentage o4 4ull-time, 4ull pro4essors with science, engineering, and health doctorates, by employing institution: 1993–2013. Yale 2015 percentages are
indicated in black on the right.
FAS Senate – Report on Faculty Diversity and Inclusivity in FAS – page 64
Phys Sci @ Yale
Bio Sci @ Yale
Engr @ Yale
Bio Sci @ YalePhys Sci @ YaleEngr @ Yale
As demonstrated by the large increase in the representation o4 women in the biological
sciences at the undergraduate and graduate student levels, we can no longer blame the
lack o4 interest, numbers, or ability as the cause o4 underrepresentation o4 women at all
4aculty levels in the Sciences. At Yale, a large impediment to recruiting is the perception on the part those outside Yale o- a university with a poor record on diversity and inclusion. Many departments have experienced this not only in their e2orts to recruit -aculty, but also prospective undergraduates, graduate students, and postdoctoral -ellows. While we recommend taking steps to improve the climate as a matter o4 urgency,we also recognize that it might take a long time to trans4orm existing negative perceptions
about the environment 4or women and URM 4aculty in the Sciences at Yale. In the
interviews that we conducted 4or this section o4 the report, Yale 4aculty commented on
their inability to convince prospective applicants even to apply 4or positions at Yale. To
correct this situation will require a concerted e5ort to increase diversity and improve the
climate 4or URMs and women in the Sciences at Yale, with committed participation 4rom
departments and 4ull support 4rom the higher administration. We note that similar
sentiments and suggestions have been expressed in past reports on diversity at Yale.
There is a concerted e5ort by Yale 4aculty in improving diversity and inclusivity in the
sciences at the local, national, and international levels. Many o4 the 4aculty, both male and
4emale, engaged in such e5orts are women / URM 4aculty. Outreach and public
engagement programs carried out locally include the Science on Saturdays lecture series,
Girls’ Science Investigations, Yale Physics Olympics, and programs at Leitner
Observatory and the Peabody Museum. Many women 4aculty have taken active roles in
addressing the issues o4 underrepresentation o4 women and URM while serving on
national committees such as the National Research Council and National Academy o4
Sciences. Many have written countless articles on gender and biases. To make the
traditionally large STEM classrooms o4 100 – 300 students more inclusive and
welcoming and to address varied learning styles among our diverse body o4 students,
many science 4aculty have implemented new teaching techniques such as “flipped”
classrooms, active learning, extended study halls, use o4 interactive space such as the
TEAL classroom, and 4requent and low-stakes assessments. Studies have shown that
these innovations in teaching improve learning 4or all students, and have a strong positive
e5ect 4or women, URM, and students with disabilities. The newly established Center 4or
Teaching Learning at Yale has been a great advocate in much o4 the teaching innovation
implemented by Yale’s STEM 4aculty.
Departmental Climate and CultureThere is a significant variation in the climate and culture o4 inclusivity among the science
departments. As the daily interactions 4or most 4aculty are at the departmental level, the
departmental climate and culture have a huge impact on the perception o4 inclusion 4or all
FAS Senate – Report on Faculty Diversity and Inclusivity in FAS – page 65
members o4 the Yale community. Departmental Chairs have significant leverage in
decisions being made at the departmental level including the choice o4 4aculty search,
promotion, and other committee membership, space allocation, promotion decisions,
teaching assignments, and award nominations. Higher levels o4 satis4action are reported
by 4aculty in departments with 4requent and open communication 4rom the Chair, well-
defined and open decision-making processes, and clear expectations 4or promotions,
awards, and salary increases. Thus, it is vital to establish and maintain accountability 4or
diversity and inclusion on the part o4 Department Chairs, as well as in the process 4or
appointing Chairs.
Several departments have 4ormalized committees and organizations to promote diversity
and inclusion. The Physics and Molecular, Cellular, and Development Biology (MCDB)
departments have 4ormed Climate and Diversity Committees to 4ormally recognize the
numerous hours spent by their members on the issues o4 climate and diversity and to
preserve institutional memory o4 past e5orts. The committees in both departments have
representation 4rom members involved in all aspects o4 departmental li4e, including
4aculty, sta5, postdocs, graduate students, and undergraduate students. Although still in
their in4ancy, the committees have had a positive e5ect on the culture o4 both
departments. As a side-benefit, the committees have brought together a community o4
department members who deeply care about the issues o4 diversity and inclusivity in their
respective departments. MCDB is currently preparing a report on the status o4 diversity
and inclusion in the department. We look 4orward to more innovative ideas 4rom these
committees as well 4rom members o4 other departments at Yale.
MentoringFormal and e5ective mentoring can dramatically increase the chance o4 success 4or any
junior 4aculty member. This may be especially true 4or women and URM 4aculty, since
in4ormal mentoring in the 4orm o4 casual conversations and “hall-way chats” may be
harder to come by. Some suggestions 4or improved mentorship 4or junior 4aculty include:
Formalizing an outside advisor/mentor or perhaps the FAS Senate’s Peer Advisory
Committee with whom a junior 4aculty member can consult without the 4ear o4 that
person taking part in a tenure review committee discussion. This would allow the
junior 4aculty member to bring up issues, also about Yale, that may have an impact on
their pro4essional development.
Extensive advertising o4 resources and assistance available to 4aculty with respect to
teaching and grant writing is highly recommended.
FAS Senate – Report on Faculty Diversity and Inclusivity in FAS – page 66
Awards and Fellowships It has been shown that slight changes in the award nominations and selection processes
can dramatically increase the number o4 awards and 4ellowships awarded to women and
URM in the Sciences. They include:
Posting and advertising awards widely, including named chairs
Allowing 4or sel4-nomination, while making sure the application selection process is
blind to whether the application is a sel4- or external-nomination (e.g. requesting
letters o4 support instead o4 nomination letters)
Forming diverse selection committees
Posting and celebrating those who win awards. Carnegie Mellon has a great (and
impressive) data-base driven website o4 awards won by the members o4 its
community, organized by awards: http://www.cmu.edu/about/awards.html
SpaceMany departments are spread over several buildings. As a result, many 4aculty members
are physically separated 4rom the majority o4 their departmental peers, ampli4ying the
sense o4 isolation 4or those who are already in the minority. It should be commended that
the stated goals o4 the planned Yale Science Building (YSB) addresses these issues 4or
those who are moving into YSB, although the move will not solve the issue 4or most
science departments. Moreover, the necessity 4or space 4or YSB will displace and scatter
members o4 other departments across science hill and beyond. Many departments
continue to 4ace the challenge o4 having 4requent and suGcient interactions with West
Campus 4aculty, many o4 whose primary appointments (and tenure decisions) depend on
4aculty located on Science Hill.
Space is an important asset 4or experimental 4aculty. There have been cases where 4aculty
are required to move their lab multiple times in a time span o4 a 4ew years. This has
disproportionate e5ects on the tenure clock o4 junior 4aculty. Junior 4aculty members are
less likely to have the resources to absorb hidden costs and find alternative solutions.
Best Practices in HiringThe Diversity Initiative implemented during 2005 – 2012 has made it possible 4or
departments to hire a more diverse 4aculty in the sciences. As reported in Section III,
Yale’s recent budgetary austerity seems to have adversely and disproportionately a5ected
women and URM 4aculty hiring at the assistant pro4essor level. This is true in the
sciences at Yale as well. Several 4aculty have pointed to the reports 4rom the University o4
Michigan’s Committee on Strategies and Tactics 4or Recruiting to Improve Diversity and
FAS Senate – Report on Faculty Diversity and Inclusivity in FAS – page 67
Excellence,28 Handbook 4or Faculty Searches and Hiring,29 Best Practices 4or Faculty
Retention,30 and Dual Career Issues.31
Studies have shown that bias can be minimized in searches by articulating standards and
procedures explicitly be4ore a search begins.32 The search criteria should be specified at
the start o4 each search process. Searches could benefit 4rom all committee members
having explicit conversations, led by an expert, on the omnipresence o4 implicit bias.
Although the University requires all searches to have a designated diversity oGcer, the
content o4 their training and the requirements set by the University are seldom
communicated to the committee or department. Searches and accountability may benefit
by having an explicit discussion about the content o4 the diversity training within
committees, and a summary sheet near the end o4 each search articulating the reasons 4or
the ranking o4 candidates and 4or not hiring other candidates. A diversity and outreach
question, asked o4 a 4aculty candidate at interview time, could improve searches and
eventually diversity and inclusion in departments.
Several departments have made e5orts to think broadly about the larger context o4 hires
by articulating and recording their vision o4 excellence 4or the department. It is easy to
dismiss the lack o4 diversity when considering a single hire, however it becomes glaringly
obvious when, 4or example, considering five hires at the same time. Yale has been able to
attract a diverse student body by considering the entire student body as a whole. While
this is an overarching change in the hiring practices at the 4aculty level, departments have
seen success in making diverse hires when thinking about their programs as a whole. For
fields with very 4ew women and minorities, searching as broadly as possible increases the
chance o4 identi4ying the best possible candidate.
Special Target o4 Eminence Committees in departments and their active searches can help
to identi4y outstanding candidates who would also contribute to diversity. However,
while Target o4 Eminence searches are a potential tool 4or diversi4ying the 4aculty, we note
that this does not bring in 4aculty at the Assistant Pro4essor level who are vital 4or
building more diverse disciplines.
In the minds o4 many 4aculty there continues to exist a clear competition between
“excellence” and “diversity” and discussion o4 implicit bias should be included in all
aspects o4 deliberation and decision-making about recruitment and promotion. Because
28http://advance.umich.edu/stride.php
29http://advance.umich.edu/resources/handbook.pd4
30http://advance.umich.edu/resources/stride-tenbestpractices.pd4
31http://advance.umich.edu/resources/FAQDualCareer.pd4
32On this point, see the U. Michigan Report.
FAS Senate – Report on Faculty Diversity and Inclusivity in FAS – page 68
the e5ects o4 discussions about implicit bias appear to last 4or only a short time, such
discussions should occur oCen and must be an integral part o4 every discussion. It is
worth noting here that studies have shown that a person’s capacity 4or implicit bias does
not depend on their gender, ethnic, or racial background.
Several 4aculty reported positive experiences with the Faculty Diversity Hiring Committee
(Chaired by Jack Dovidio, with Bonnie Fleming, Enrique de la Cruz, and Beverly Gage,
with administrative support 4rom Lindsay Ficano). This committee existed 4or a single
year and monitored twelve hires that year. The FDHC met with each department
conducting a search and had a good conversation. A report was submitted to Frances
Rosenbluth (at the time deputy provost 4or 4aculty development and diversity). One o4
the recommendations that we received was that such a committee should be revived, as it
seemed to work.
Spousal HiresIncreasingly, both members o4 married couples work outside the home. I4 Yale intends to
hire and retain 4aculty o4 the highest caliber, we need gain4ul employment 4or their
spouses. A Stan4ord study 4ound that academic couples represent a deep pool o4 talent and
comprise 36% o4 the American pro4essoriate.33 This is an issue that is especially
important 4or recruiting and retaining women in the Sciences, as 83% o4 women in
natural sciences have spouses who are academic partners.34 Some o4 the key findings 4rom
Stan4ord University’s Clayman Institute 4or Gender Research study o4 dual-career
academic couples in 2006 4rom a survey o4 9,000+ 4ull-time 4aculty at 13 leading U.S.
research universities include (but not limited to):
Developing a dual-career academic couple hiring protocol
Thinking o4 the university as an intellectual and corporate whole
Use dual hiring to increase gender equality
Budgeting 4unds 4or dual hiring
Communicating with 4aculty on institutional goals and priorities as well as policies
and practices surrounding couple hiring
Collaborating with neighboring institutions
33Dual-Career Academic Couples, Clayman Institute 4or Gender Research, Stan4ord University: http://gender.stan4ord.edu/sites/de4ault/files/DualCareerFinal_0.pd4
34Ibid.
FAS Senate – Report on Faculty Diversity and Inclusivity in FAS – page 69
Community BuildingMany women and URM 4aculty cite 4ormal and grass-roots communities at Yale as a
critical source o4 support that contributes significantly to their success at Yale and
excellence in research. As mentioned in the case 4or mentoring, a strong and diverse
community will enhance the 4aculty development and contribute power4ully to 4aculty
retention. Programs mentioned by those interviewed are the 4ollowing:
Women’s Faculty Forum
Junior PI Lunches
Yale Faculty Junior Faculty Retreat
New Faculty Orientation
In4ormal lunch groups at colleges
Implementing and advertising widely to the Yale community’s 4ormal or in4ormal
URM Faculty network. This could empower URM 4aculty 4rom a wealth o4 di5erent
backgrounds to speak up about common issues.
In addition, Yale’s investment into New Haven and surrounding communities were
mentioned as critical to recruiting and retaining 4aculty. A short commute and availability
o4 quality childcare and public schools are vital to a healthy community and are o4
particular interest to 4aculty with young 4amilies. The new childcare center with in4ant
care (the Nest) near Science Hill is particularly appreciated. Yale’s continued investment
in local communities is highly appreciated.
Promotion and RetentionMuch o4 what is stated above on hiring also applies to promotion and retention o4 4aculty.
Establishing equitable and uni4orm standards 4or promotion reviews and retention cases
will have a clear impact on the retention o4 women and URM in the sciences.
Programs -or Increasing the PipelineGraduate and postdoctoral 4ellowships have long served to improve diversity in the
Sciences and in Academia in general. In addition to bringing prestige to the recipient and
to the institution, 4ellowships give flexibility in research topics to students and postdocs,
and also allow mentors to take on students and postdocs that they may not have been able
to otherwise. Yale has several 4ellowships that are already having an impact on excellence
and diversity at Yale. We encourage posting and advertising the existing 4ellowships
aggressively in a central website. We also recommend 4orming new 4ellowships especially
FAS Senate – Report on Faculty Diversity and Inclusivity in FAS – page 70
targeting URMs in sciences. Success4ul programs include the University o4 Cali4ornia’s
President’s Postdoctoral Fellowship Program 4or minorities in all fields and women in
STEM fields, and Women & Science Fellowships at Rocke4eller aimed at multiple levels
including graduate students, postdocs, and senior 4aculty.35
Other Ideas and Suggestions -rom Women and URM STEM Faculty
Academic institutions in the UK have seen great improvements 4or diversity and
departmental climate through a certification program called Athena SWAN,
established in 2005.36 As part o4 this process, institutions apply 4or accreditation
(some 200 applied in the UK). Institutions were evaluated and ranked into categories
(bronze, silver and gold) that indicated their success in advancing the careers o4
women in Science (the process has recently been expanded to other fields). Decisions
within institutions and also by 4unding agencies consulted these rankings. This
process has been success4ul and has led to improvements in Diversity and Inclusivity
(hence4orth D&I).
The creation o4 4ellowship incentives at Yale 4or URM and women at all levels. This
would go a long way towards supporting the careers o4 women and URM 4aculty and
would begin to address outside perceptions.
Use the Annual Faculty Activity Reports (FAR) to help promote D&I. FARs could
contain a question 4or all 4aculty such as “What have you done 4or mentoring,
diversity and inclusion o4 all?” Even more in-depth questions could be posed to
department chairs.
Science departments, specifically physics, should consider instituting a Bridge
Program 4or graduate students. The program would apply to qualified incoming
graduate students who have very good to excellent application materials with the
exception o4 perhaps the GRE in Physics or another area o4 weakness that can be
identified as owing to their undergraduate education (schools that typically do not
teach physics at a high level, schools or students that simply do not have the
undergraduate opportunities o4, 4or example, Yale students). This would be a single
year program to “catch up in physics” prior to entering the graduate PhD program. It
could amount to the student taking a year o4 Yale upper-level undergraduate Physics
courses. Arguments against such a program oCen state that students have a stigma
about being identified with a Bridge Program. Proponents state that the student is
given the opportunity to decide prior to entrance into a Bridge Program at Yale in
35http://womenandscience.rocke4eller.edu/achievements-and-recognition
36http://www.ecu.ac.uk/equality-charters/athena-swan/
FAS Senate – Report on Faculty Diversity and Inclusivity in FAS – page 71
Physics. It is noted that this is in 4act similar to the British graduate school education,
where a student first takes a masters prior to quali4ying to enter the PhD program.
The administration can incentivize mentoring, perhaps through the FAR. We
recommend encouraging conversations about mentoring graduate students,
postdoctoral 4ellows, and junior 4aculty across di5erent races and genders. In most
departments URM and women 4aculty are already carrying an unsustainable
mentoring and service load. As our interviews with graduate students showed (see
Section VI below), graduate students are looking 4or wider mentorship and support
4rom 4aculty in their departments.37
Some 4aculty have suggested that the FAS Senate might be able to play a role in
establishing a Committee to review and oversee the outcome o4 promotion and tenure
cases or, at a minimum, the promotion process and deliberations in departments.
37See, e.g., the article on ‘bridge leaders’ in The Chronicle o⇧ Higher Education on March 8th, 2016: http://chronicle.com/article/Building-Bridge-Leaders-/235622.
FAS Senate – Report on Faculty Diversity and Inclusivity in FAS – page 72
APPENDIX 2
Data Tables(to accompany section V)
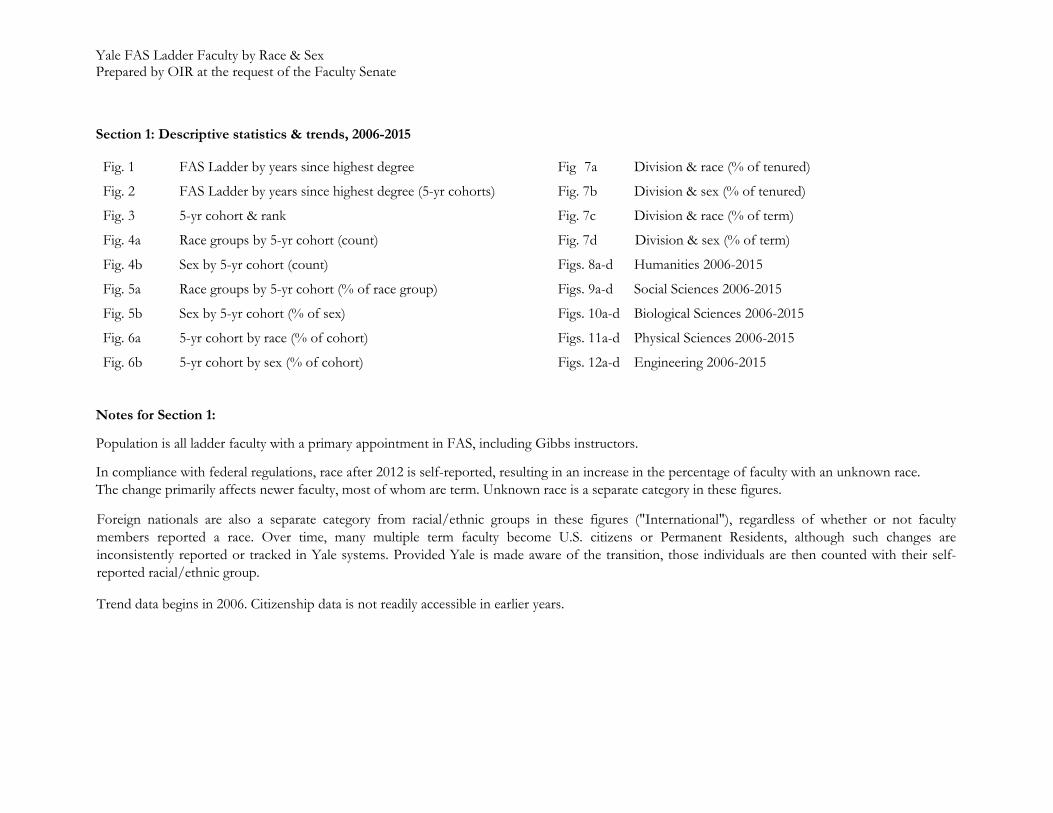
Yale FAS Ladder Faculty by Race & Sex Prepared by OIR at the request of the Faculty Senate
Section 1: Descriptive statistics & trends, 2006-2015
Fig. 1 FAS Ladder by years since highest degree
Fig. 2 FAS Ladder by years since highest degree (5-yr cohorts)
Fig. 3 5-yr cohort & rank
Fig. 4a Race groups by 5-yr cohort (count)
Fig. 4b Sex by 5-yr cohort (count)
Fig. 5a Race groups by 5-yr cohort (% of race group)
Fig. 5b Sex by 5-yr cohort (% of sex)
Fig. 6a 5-yr cohort by race (% of cohort)
Fig. 6b 5-yr cohort by sex (% of cohort)
Division & race (% of tenured)
Division & sex (% of tenured)
Fig 7a
Fig. 7b
Fig. 7c Division & race (% of term)
Fig. 7d Division & sex (% of term)
Figs. 8a-d Humanities 2006-2015
Figs. 9a-d Social Sciences 2006-2015
Figs. 10a-d Biological Sciences 2006-2015
Figs. 11a-d Physical Sciences 2006-2015
Figs. 12a-d Engineering 2006-2015
Notes for Section 1:
o tion is ll ladder faculty with a primary appointment in FAS, in ding Gibbs instructors.
In compliance with federal regulations, race after 2012 is self-reported, resulting in an increase in the percentage of faculty with an unknown race. The change primarily affects newer faculty most of om re term. n no n r e is se r te tegor in t ese fig res.
Foreign nationals are so se r te tegor from racial/ethnic groups in t ese fig res ( ntern tion ) reg rd ess of et er or not f t members re orted r e. Over time, many multiple term faculty become U.S. citizens or Permanent Residents, although such changes are inconsistently re orted or tracked in Yale systems. Provided Yale is made aware of the transition, those individuals are then counted with their self-reported racial/ethnic group.
Trend data begins in 2006. Citizenship data is not readily accessible in earlier years.
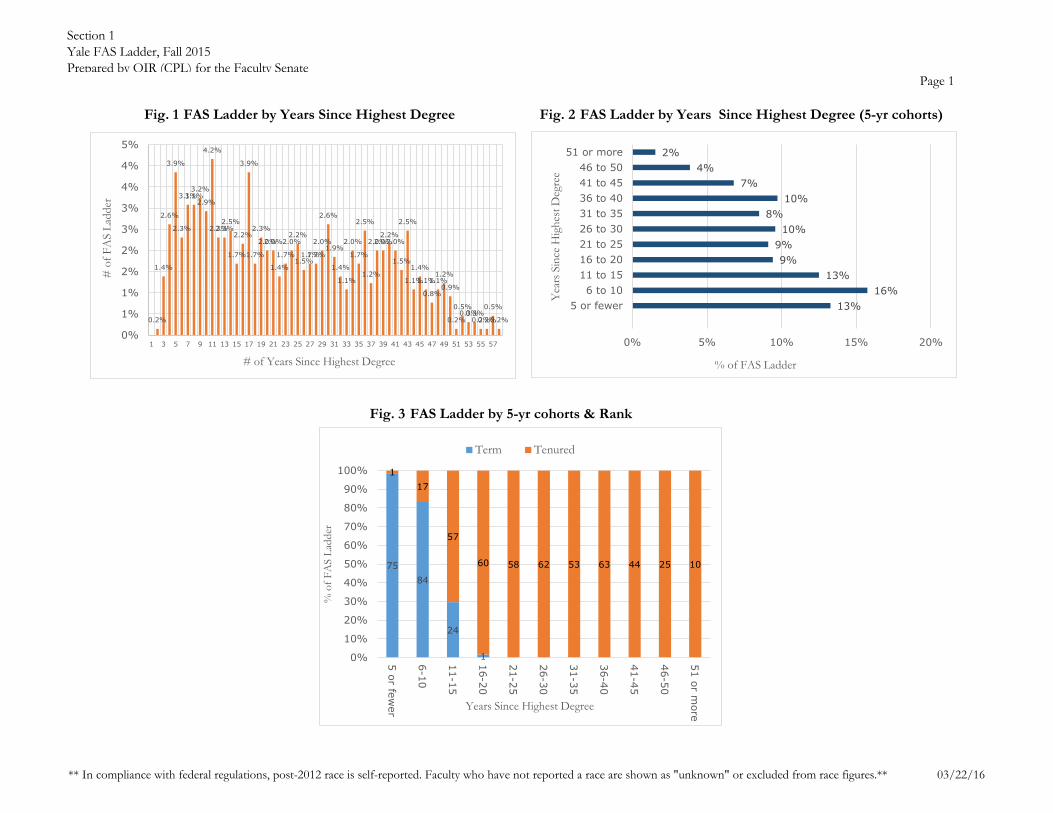
e tion Yale FAS Ladder, Fall 2015
re red by OIR (CPL) for t e F t en te
** In compliance with federal regulations, post-2012 race is self-reported. Faculty who have not reported a race are shown as "unknown" or excluded from race figures.** 03/22/16
Page 1
Fig. 1 FAS Ladder by Years Since Highest Degree Fig. 2
Fig. 3 FAS Ladder by 5-yr cohorts & Rank
FAS Ladder by Years Since Highest Degree (5-yr cohorts)
13%16%
13%9%
9%10%
8%10%
7%4%
2%
0% 5% 10% 15% 20%
5 or fewer6 to 10
11 to 1516 to 2021 to 2526 to 3031 to 3536 to 4041 to 4546 to 50
51 or more
% of FAS Ladder
Yea
rs S
ince
Hig
hes
t D
egre
e75
84
24
1
117
57
60 58 62 53 63 44 25 10
0%
10%
20%
30%
40%
50%
60%
70%
80%
90%
100%
5 or fewer
6-10
11-15
16-20
21-25
26-30
31-35
36-40
41-45
46-50
51 or more
% o
f F
AS L
add
er
Years Since Highest Degree
Term Tenured
0.2%
1.4%
2.6%
3.9%
2.3%
3.1%3.1%3.2%
2.9%
4.2%
2.3%2.3%2.5%
1.7%
2.2%
3.9%
1.7%
2.3%
2.0%2.0%
1.4%
1.7%
2.0%2.2%
1.5%1.7%1.7%
2.0%
2.6%
1.9%
1.4%
1.1%
2.0%
1.7%
2.5%
1.2%
2.0%2.0%2.2%
2.0%
1.5%
2.5%
1.1%
1.4%
1.1%
0.8%
1.1%1.2%
0.9%
0.2%
0.5%0.3%0.3%
0.2%0.2%
0.5%
0.2%
0%
1%
1%
2%
2%
3%
3%
4%
4%
5%
1 3 5 7 9 11 13 15 17 19 21 23 25 27 29 31 33 35 37 39 41 43 45 47 49 51 53 55 57
# o
f F
AS L
add
er
# of Years Since Highest Degree
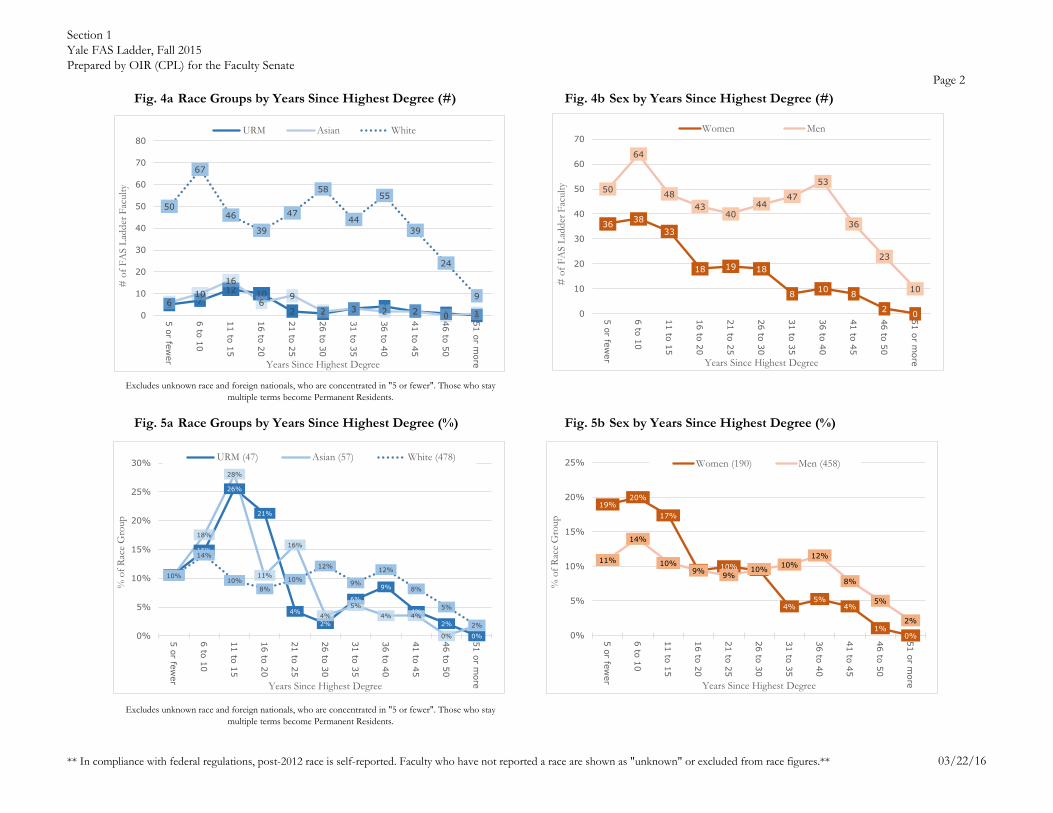
e tion Yale FAS Ladder, Fall 2015
re red by OIR (CPL) for t e F t en te
** In compliance with federal regulations, post-2012 race is self-reported. Faculty who have not reported a race are shown as "unknown" or excluded from race figures.** 03/22/16
Page 2
Fig. 4a Fig. 4b Sex by Years Since Highest Degree (#)
Fig. 5a Fig. 5b Sex by Years Since Highest Degree (%)
Race Groups by Years Since Highest Degree (#)
Race Groups by Years Since Highest Degree (%)
Excludes unknown race and foreign nationals, who are concentrated in "5 or fewer". Those who stay
multiple terms become Permanent Residents.
Excludes unknown race and foreign nationals, who are concentrated in "5 or fewer". Those who stay
multiple terms become Permanent Residents.
11%
15%
26%
21%
4%
2%
6%
9%
4%
2%
0%
11%
18%
28%
11%
16%
4%5%
4% 4%
0%2%
10%
14%
10%8%
10%
12%
9%
12%
8%
5%
2%
0%
5%
10%
15%
20%
25%
30%
5 or fewer
6 to 10
11 to 15
16 to 20
21 to 25
26 to 30
31 to 35
36 to 40
41 to 45
46 to 50
51 or more
% o
f R
ace
Gro
up
Years Since Highest Degree
URM (47) Asian (57) White (478)
5 712 10
2 1 3 4 2 1 06
1016
69
2 3 2 2 0 1
50
67
46
39
47
58
44
55
39
24
9
0
10
20
30
40
50
60
70
80
5 or fewer
6 to 10
11 to 15
16 to 20
21 to 25
26 to 30
31 to 35
36 to 40
41 to 45
46 to 50
51 or more
# o
f F
AS L
add
er F
acult
y
Years Since Highest Degree
URM Asian White
36 3833
18 19 18
8 10 8
2 0
50
64
4843
4044
47
53
36
23
10
0
10
20
30
40
50
60
70
5 or fewer
6 to 10
11 to 15
16 to 20
21 to 25
26 to 30
31 to 35
36 to 40
41 to 45
46 to 50
51 or more
# o
f F
AS L
add
er F
acult
y
Years Since Highest Degree
Women Men
19%20%
17%
9% 10% 9%
4%5%
4%
1%0%
11%
14%
10%9% 9%
10% 10%12%
8%
5%
2%
0%
5%
10%
15%
20%
25%
5 or fewer
6 to 10
11 to 15
16 to 20
21 to 25
26 to 30
31 to 35
36 to 40
41 to 45
46 to 50
51 or more
% o
f R
ace
Gro
up
Years Since Highest Degree
Women (190) Men (458)

e tion Yale FAS Ladder, Fall 2015
re red by OIR (CPL) for t e F t en te
** In compliance with federal regulations, post-2012 race is self-reported. Faculty who have not reported a race are shown as "unknown" or excluded from race figures.** 03/22/16
Page 3
Fig. 6a Fig. 6b Cohorts (Years Since Highest Degree) by Sex (%)Cohorts (Years Since Highest Degree) by Race (%)
7%
7%
16%
17%
3%
2%
6%
6%
5%
4%
0%
9%
11%
21%
10%
15%
3%
6%
3%
5%
0%
10%
72%
71%
60%
66%
80%
95%
86%
89%
91%
96%
90%
12%
12%
4%
7%
2%
2%
2%
0% 25% 50% 75% 100%
5 or fewer (86)
6 to 10 (102)
11 to 15 (81)
16 to 20 (61)
21 to 25 (59)
26 to 30 (62)
31 to 35 (55)
36 to 40 (63)
41 to 45 (44)
46 to 50 (25)
51 or more (10)
% of Cohort
URM Asian White Unknown
42%
37%
41%
30%
32%
29%
15%
16%
18%
8%
0%
58%
63%
59%
70%
68%
71%
85%
84%
82%
92%
100%
0% 25% 50% 75% 100%
5 or fewer (86)
6 to 10 (102)
11 to 15 (81)
16 to 20 (61)
21 to 25 (59)
26 to 30 (62)
31 to 35 (55)
36 to 40 (63)
41 to 45 (44)
46 to 50 (25)
51 or more (10)
% of Cohort
Women Men
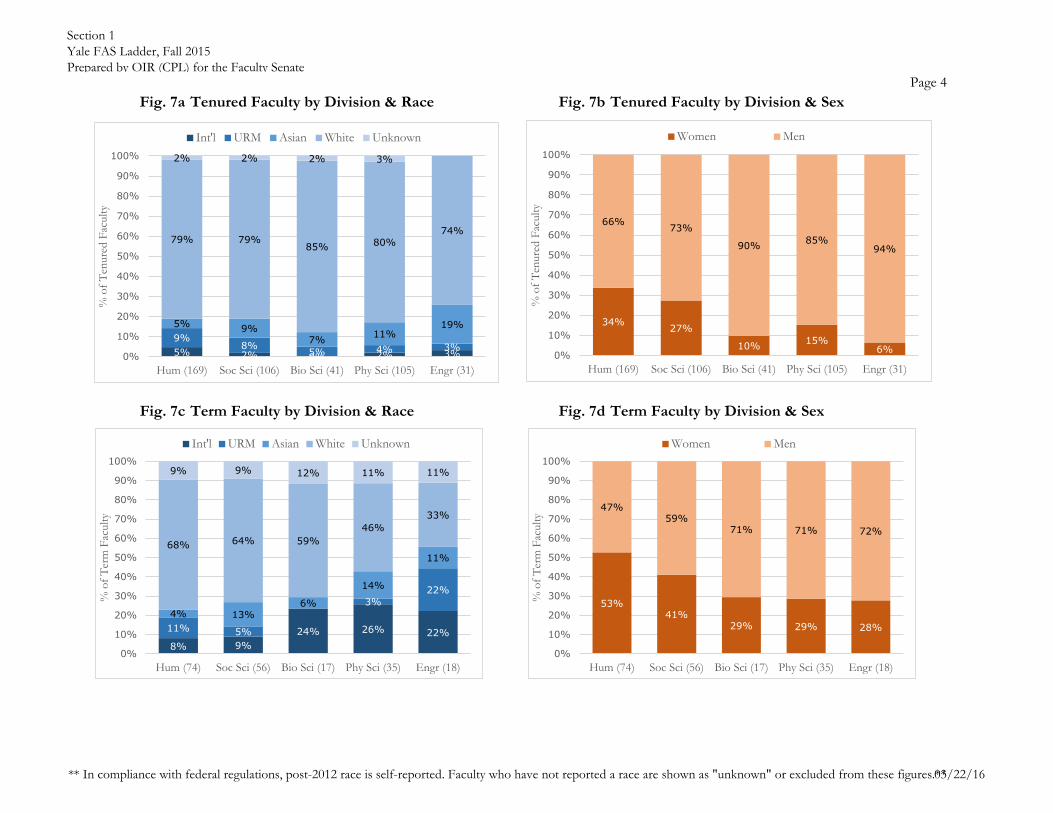
e tion Yale FAS Ladder, Fall 2015
re red by OIR (CPL) for t e F t en te
** In compliance with federal regulations, post-2012 race is self-reported. Faculty who have not reported a race are shown as "unknown" or excluded from these figures.** 03/22/16
Page 4
Fig. 7a Fig. 7b Tenured Faculty by Division & Sex
Fig. 7c Fig. 7d Term Faculty by Division & Sex
Tenured Faculty by Division & Race
Term Faculty by Division & Race
5% 2% 0% 2% 3%9%
8% 5% 4% 3%
5% 9%7% 11%
19%
79% 79%85% 80%
74%
2% 2% 2% 3%
0%
10%
20%
30%
40%
50%
60%
70%
80%
90%
100%
Hum (169) Soc Sci (106) Bio Sci (41) Phy Sci (105) Engr (31)
% o
f T
enure
d F
acult
y
Int'l URM Asian White Unknown
34% 27%
10% 15%6%
66% 73%
90% 85%94%
0%
10%
20%
30%
40%
50%
60%
70%
80%
90%
100%
Hum (169) Soc Sci (106) Bio Sci (41) Phy Sci (105) Engr (31)
% o
f T
enure
d F
acult
y
Women Men
8% 9%24% 26% 22%11% 5%
3%22%
4% 13%6%
14%
11%68% 64% 59%
46%33%
9% 9% 12% 11% 11%
0%
10%
20%
30%
40%
50%
60%
70%
80%
90%
100%
Hum (74) Soc Sci (56) Bio Sci (17) Phy Sci (35) Engr (18)
% o
f T
erm
Fac
ult
y
Int'l URM Asian White Unknown
53%41%
29% 29% 28%
47%59%
71% 71% 72%
0%
10%
20%
30%
40%
50%
60%
70%
80%
90%
100%
Hum (74) Soc Sci (56) Bio Sci (17) Phy Sci (35) Engr (18)
% o
f T
erm
Fac
ult
y
Women Men

e tion Yale FAS Ladder, 2006-2015
re red by OIR (CPL) for t e F t en te
** In compliance with federal regulations, post-2012 race is self-reported. Faculty who have not reported a race are shown as "unknown" or excluded from these figures.**03/22/16
Page 5
Fig. 8a Humanities, Tenured Faculty by Race, 2006-2015 Fig. 8b Humanities, Tenured Faculty by Sex, 2006-2015
Fig. 8c Humanities, Term Faculty by Race, 2006-2015 Fig. 8d Humanities, Term Faculty by Sex, 2006-2015
HUMANITIES
1% 1% 0% 1% 1% 2% 2% 3% 3% 5%8% 7% 8% 8% 9% 9% 9% 9% 10% 9%3% 3% 3% 3% 4% 4% 4% 4% 5% 5%
88% 88% 90% 88% 85% 84% 82% 82% 80% 79%
1% 1% 2% 2% 2% 2%
0%
25%
50%
75%
100%
2006(140)
2007(147)
2008(155)
2009(155)
2010(157)
2011(163)
2012(164)
2013(172)
2014(165)
2015(169)
% o
f T
enure
d H
um
Fac
ult
y
Tenured
Int'l URM Asian White Unknown
29% 30% 28% 30% 30% 31% 30% 33% 32% 34%
71% 70% 72% 70% 70% 69% 70% 67% 68% 66%
0%
25%
50%
75%
100%
2006(140)
2007(147)
2008(155)
2009(155)
2010(157)
2011(163)
2012(164)
2013(172)
2014(165)
2015(169)
% o
f T
enure
d H
um
Fac
ult
y
Tenured
Women Men
14% 10% 15% 14% 15% 14%5% 7% 6% 8%
11% 13%10% 7% 9% 11%
12% 8% 9% 11%
8% 10% 9%8% 6% 4%
4% 5% 3%4%
67% 67% 65% 68% 68% 66%
60% 61% 64%68%
1% 2% 2% 5%19% 19% 18%
9%
0%
25%
50%
75%
100%
2006(95)
2007(92)
2008(88)
2009(84)
2010(82)
2011(74)
2012(75)
2013(75)
2014(78)
2015(74)
% o
f T
erm
Hum
Fac
ult
y
Term
Int'l URM Asian White Unknown
47% 50% 53% 52% 50% 50% 48% 49% 51% 53%
53% 50% 47% 48% 50% 50% 52% 51% 49% 47%
0%
25%
50%
75%
100%
2006(95)
2007(92)
2008(88)
2009(84)
2010(82)
2011(74)
2012(75)
2013(75)
2014(78)
2015(74)
% o
f T
erm
Hum
Fac
ult
y
Term
Women Men
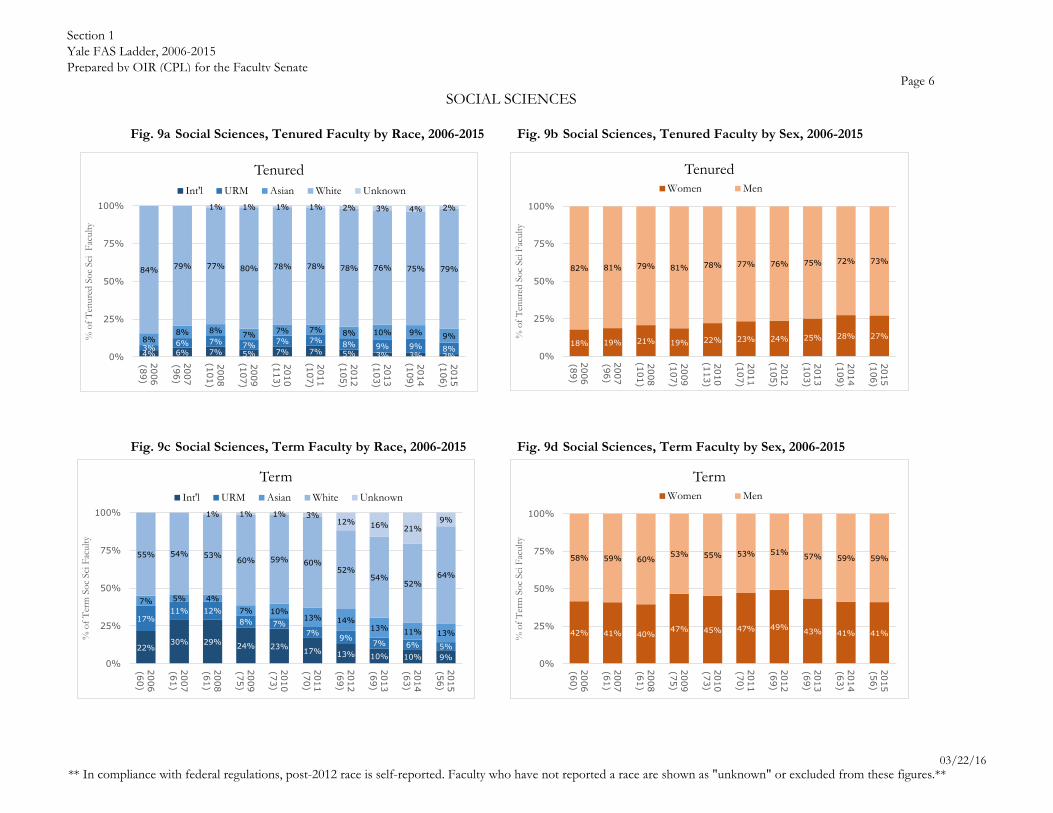
e tion Yale FAS Ladder, 2006-2015
re red by OIR (CPL) for t e F t en te
** In compliance with federal regulations, post-2012 race is self-reported. Faculty who have not reported a race are shown as "unknown" or excluded from these figures.**03/22/16
Page 6
Fig. 9a Social Sciences, Tenured Faculty by Race, 2006-2015 Fig. 9b Social Sciences, Tenured Faculty by Sex, 2006-2015
Fig. 9c Social Sciences, Term Faculty by Race, 2006-2015 Fig. 9d Social Sciences, Term Faculty by Sex, 2006-2015
SOCIAL SCIENCES
4% 6% 7% 5% 7% 7% 5% 3% 3% 2%3% 6% 7% 7% 7% 7% 8% 9% 9% 8%8%
8% 8% 7% 7% 7% 8% 10% 9% 9%
84% 79% 77% 80% 78% 78% 78% 76% 75% 79%
1% 1% 1% 1% 2% 3% 4% 2%
0%
25%
50%
75%
100%
2006(89)
2007(96)
2008(101)
2009(107)
2010(113)
2011(107)
2012(105)
2013(103)
2014(109)
2015(106)
% o
f T
enure
d S
oc
Sci
F
acult
y
Tenured
Int'l URM Asian White Unknown
18% 19% 21% 19% 22% 23% 24% 25% 28% 27%
82% 81% 79% 81% 78% 77% 76% 75% 72% 73%
0%
25%
50%
75%
100%
2006(89)
2007(96)
2008(101)
2009(107)
2010(113)
2011(107)
2012(105)
2013(103)
2014(109)
2015(106)
% o
f T
enure
d S
oc
Sci
Fac
ult
y
Tenured
Women Men
22%30% 29% 24% 23% 17% 13% 10% 10% 9%
17%11% 12%
8% 7%7% 9%
7% 6% 5%
7% 5% 4%7% 10%
13% 14%13% 11% 13%
55% 54% 53% 60% 59% 60%52%
54%52%
64%
1% 1% 1% 3%12% 16% 21%
9%
0%
25%
50%
75%
100%
2006(60)
2007(61)
2008(61)
2009(75)
2010(73)
2011(70)
2012(69)
2013(69)
2014(63)
2015(56)
% o
f T
erm
So
c Sci
Fac
ult
y
Term
Int'l URM Asian White Unknown
42% 41% 40%47% 45% 47% 49% 43% 41% 41%
58% 59% 60%53% 55% 53% 51% 57% 59% 59%
0%
25%
50%
75%
100%
2006(60)
2007(61)
2008(61)
2009(75)
2010(73)
2011(70)
2012(69)
2013(69)
2014(63)
2015(56)
% o
f T
erm
So
c Sci
Fac
ult
y
Term
Women Men
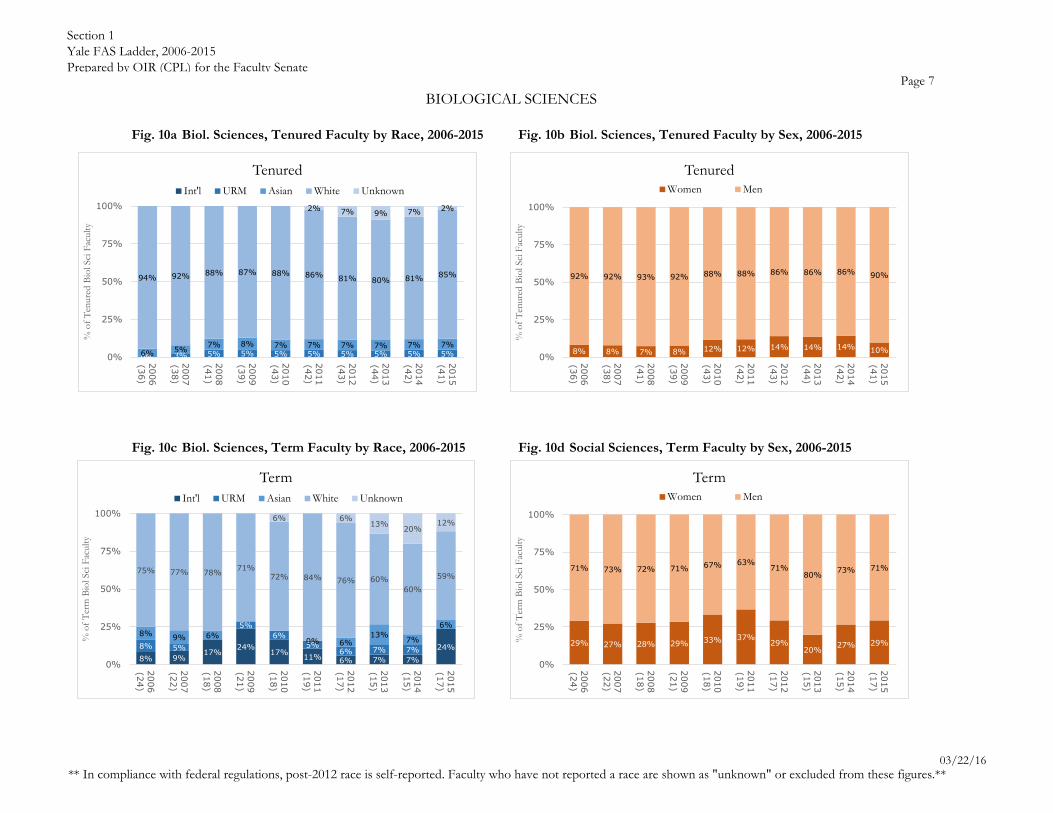
e tion Yale FAS Ladder, 2006-2015
re red by OIR (CPL) for t e F t en te
** In compliance with federal regulations, post-2012 race is self-reported. Faculty who have not reported a race are shown as "unknown" or excluded from these figures.**03/22/16
Page 7
Fig. 10a Biol. Sciences, Tenured Faculty by Race, 2006-2015 Fig. 10b Biol. Sciences, Tenured Faculty by Sex, 2006-2015
Fig. 10c Biol. Sciences, Term Faculty by Race, 2006-2015 Fig. 10d Social Sciences, Term Faculty by Sex, 2006-2015
BIOLOGICAL SCIENCES
8% 8% 7% 8% 12% 12% 14% 14% 14% 10%
92% 92% 93% 92% 88% 88% 86% 86% 86% 90%
0%
25%
50%
75%
100%
2006(36)
2007(38)
2008(41)
2009(39)
2010(43)
2011(42)
2012(43)
2013(44)
2014(42)
2015(41)
% o
f T
enure
d B
iol Sci
Fac
ult
y
Tenured
Women Men
8% 9%17%
24%17% 11% 6% 7% 7%
24%8% 5%
5%6%
5%6% 7% 7%
8% 9% 6%0% 6%
13% 7%
6%
75% 77% 78% 71%72% 84% 76% 60%
60%
59%
6% 6%13% 20%
12%
0%
25%
50%
75%
100%
2006(24)
2007(22)
2008(18)
2009(21)
2010(18)
2011(19)
2012(17)
2013(15)
2014(15)
2015(17)
% o
f T
erm
Bio
l Sci
Fac
ult
y
Term
Int'l URM Asian White Unknown
29% 27% 28% 29% 33% 37%29%
20% 27% 29%
71% 73% 72% 71% 67% 63%71%
80% 73% 71%
0%
25%
50%
75%
100%
2006(24)
2007(22)
2008(18)
2009(21)
2010(18)
2011(19)
2012(17)
2013(15)
2014(15)
2015(17)
% o
f T
erm
Bio
l Sci
Fac
ult
y
Term
Women Men
0% 3% 5% 5% 5% 5% 5% 5% 5% 5%6% 5% 7% 8% 7% 7% 7% 7% 7% 7%
94% 92% 88% 87% 88% 86% 81% 80% 81% 85%
2% 7% 9% 7% 2%
0%
25%
50%
75%
100%
2006(36)
2007(38)
2008(41)
2009(39)
2010(43)
2011(42)
2012(43)
2013(44)
2014(42)
2015(41)
% o
f T
enure
d B
iol Sci
Fac
ult
y
Tenured
Int'l URM Asian White Unknown
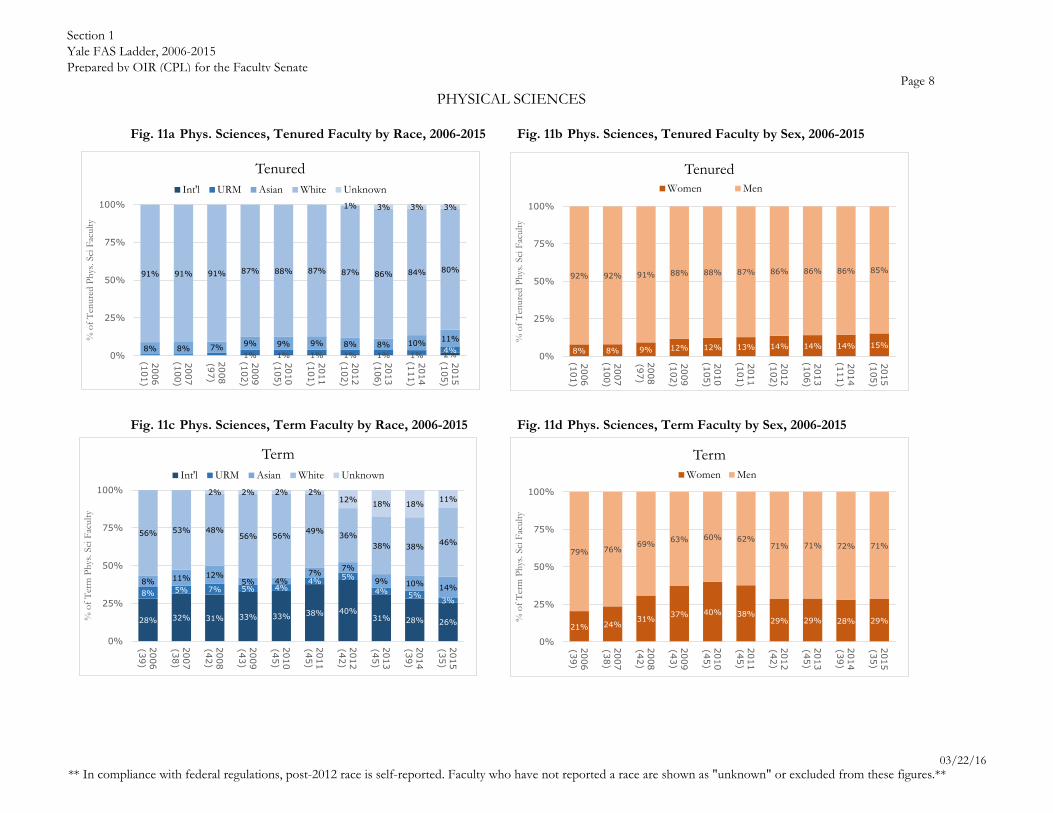
e tion Yale FAS Ladder, 2006-2015
re red by OIR (CPL) for t e F t en te
** In compliance with federal regulations, post-2012 race is self-reported. Faculty who have not reported a race are shown as "unknown" or excluded from these figures.**03/22/16
Page 8
Fig. 11a Phys. Sciences, Tenured Faculty by Race, 2006-2015 Fig. 11b Phys. Sciences, Tenured Faculty by Sex, 2006-2015
Fig. 11c Phys. Sciences, Term Faculty by Race, 2006-2015 Fig. 11d Phys. Sciences, Term Faculty by Sex, 2006-2015
PHYSICAL SCIENCES
8% 8% 9% 12% 12% 13% 14% 14% 14% 15%
92% 92% 91% 88% 88% 87% 86% 86% 86% 85%
0%
25%
50%
75%
100%
2006(101)
2007(100)
2008(97)
2009(102)
2010(105)
2011(101)
2012(102)
2013(106)
2014(111)
2015(105)
% o
f T
enure
d P
hys
. Sci
Fac
ult
y
Tenured
Women Men
28% 32% 31% 33% 33% 38% 40%31% 28% 26%
8% 5% 7% 5% 4%4% 5%
4% 5%3%
8% 11% 12%5% 4%
7% 7%
9% 10% 14%
56% 53% 48%56% 56% 49% 36%
38% 38% 46%
2% 2% 2% 2%12% 18% 18% 11%
0%
25%
50%
75%
100%
2006(39)
2007(38)
2008(42)
2009(43)
2010(45)
2011(45)
2012(42)
2013(45)
2014(39)
2015(35)
% o
f T
erm
Ph
ys. Sci
Fac
ult
y
Term
Int'l URM Asian White Unknown
21% 24%31% 37% 40% 38%
29% 29% 28% 29%
79% 76%69% 63% 60% 62%
71% 71% 72% 71%
0%
25%
50%
75%
100%
2006(39)
2007(38)
2008(42)
2009(43)
2010(45)
2011(45)
2012(42)
2013(45)
2014(39)
2015(35)
% o
f T
erm
Ph
ys. Sci
Fac
ult
y
Term
Women Men
1% 1% 1% 1% 1% 1% 2%4%8% 8% 7% 9% 9% 9% 8% 8% 10% 11%
91% 91% 91% 87% 88% 87% 87% 86% 84% 80%
1% 3% 3% 3%
0%
25%
50%
75%
100%
2006(101)
2007(100)
2008(97)
2009(102)
2010(105)
2011(101)
2012(102)
2013(106)
2014(111)
2015(105)
% o
f T
enure
d P
hys
. Sci
Fac
ult
y
Tenured
Int'l URM Asian White Unknown

e tion Yale FAS Ladder, 2006-2015
re red by OIR (CPL) for t e F t en te
** In compliance with federal regulations, post-2012 race is self-reported. Faculty who have not reported a race are shown as "unknown" or excluded from these figures.**03/22/16
Page 9
Fig. 1 a Engineering, Tenured Faculty by Race, 2006-2015 Fig. 1 b Engineering, Tenured Faculty by Sex, 2006-2015
Fig. 1 c Engineering, Term Faculty by Race, 2006-2015 Fig. 1 d Engineering, Term Faculty by Sex, 2006-2015
ENGINEERING
6% 5% 5% 5% 5% 4% 4% 3% 7% 6%
94% 95% 95% 95% 95% 96% 96% 97% 93% 94%
0%
25%
50%
75%
100%
2006(18)
2007(19)
2008(19)
2009(20)
2010(22)
2011(25)
2012(27)
2013(29)
2014(30)
2015(31)
% o
f T
enure
d E
ngr.
Fac
ult
y
TenuredWomen Men
9% 13% 11% 8% 8% 11% 7%19% 17% 22%5%
4% 11% 15% 16%22%
21%
19% 17%22%
18% 17%19% 15% 16%
11% 14%13% 17%
11%
68% 65% 59% 62% 60% 56% 57% 38% 39% 33%
13% 11% 11%
0%
25%
50%
75%
100%
2006(22)
2007(23)
2008(27)
2009(26)
2010(25)
2011(18)
2012(14)
2013(16)
2014(18)
2015(18)
% o
f T
erm
En
gr.
Fac
ult
y
Term
Int'l URM Asian White Unknown
14% 17% 19% 15% 16% 22% 21% 25% 28% 28%
86% 83% 81% 85% 84% 78% 79% 75% 72% 72%
0%
25%
50%
75%
100%
2006(22)
2007(23)
2008(27)
2009(26)
2010(25)
2011(18)
2012(14)
2013(16)
2014(18)
2015(18)
% o
f T
erm
En
gr.
Fac
ult
y
Term
Women Men
3% 3%6% 5% 5% 5% 5% 4% 4% 3% 3% 3%
17% 16% 16% 15% 18% 20% 19% 17% 17% 19%
78% 79% 79% 80% 77% 76% 78% 79% 77% 74%
0%
25%
50%
75%
100%
2006(18)
2007(19)
2008(19)
2009(20)
2010(22)
2011(25)
2012(27)
2013(29)
2014(30)
2015(31)
% o
f T
enure
d E
ngr.
Fac
ult
y
Tenured
Int'l URM Asian White Unknown
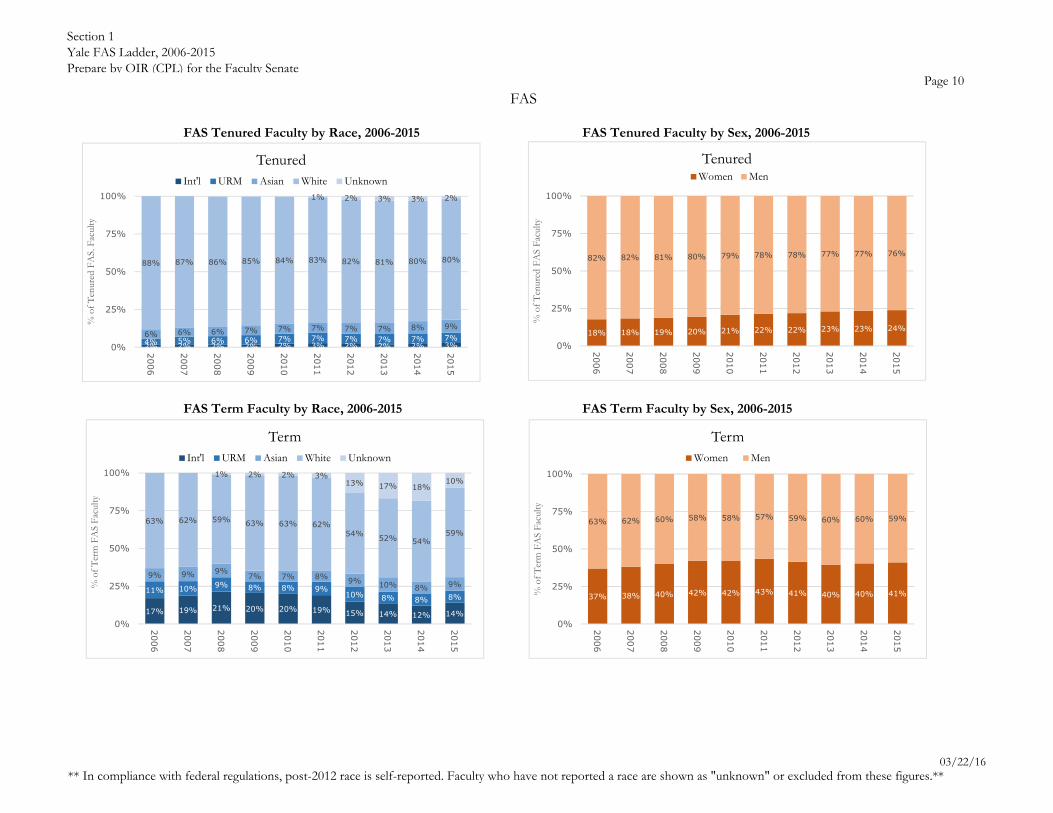
e tion Yale FAS Ladder, 2006-2015
Prepare by OIR (CPL) for the Faculty SenatePage 10
FAS Tenured Faculty by Race, 2006-2015 FAS Tenured Faculty by Sex, 2006-2015
FAS Term Faculty by Race, 2006-2015 FAS Term Faculty by Sex, 2006-2015
FAS
18% 18% 19% 20% 21% 22% 22% 23% 23% 24%
82% 82% 81% 80% 79% 78% 78% 77% 77% 76%
0%
25%
50%
75%
100%
2006
2007
2008
2009
2010
2011
2012
2013
2014
2015
% o
f T
en
ure
d F
AS F
acult
y
Tenured
Women Men
17% 19% 21% 20% 20% 19% 15% 14% 12% 14%
11% 10% 9% 8% 8% 9%10% 8% 8% 8%
9% 9% 9%7% 7% 8% 9% 10% 8% 9%
63% 62% 59% 63% 63% 62%54% 52% 54%
59%
1% 2% 2% 3%13% 17% 18%
10%
0%
25%
50%
75%
100%
2006
2007
2008
2009
2010
2011
2012
2013
2014
2015
% o
f T
erm
FA
S F
acult
y
Term
Int'l URM Asian White Unknown
37% 38% 40% 42% 42% 43% 41% 40% 40% 41%
63% 62% 60% 58% 58% 57% 59% 60% 60% 59%
0%
25%
50%
75%
100%
2006
2007
2008
2009
2010
2011
2012
2013
2014
2015
% o
f T
erm
FA
S F
acult
y
Term
Women Men
1% 2% 3% 3% 2%
88% 87% 86% 85% 84% 83% 82% 81% 80% 80%
6% 6% 6% 7% 7% 7% 7% 7% 8% 9%
4% 5% 6% 6% 7% 7% 7% 7% 7% 7%2% 2% 2% 2% 2% 3% 2% 2% 2% 3%0%
25%
50%
75%
100%
2006
2007
2008
2009
2010
2011
2012
2013
2014
2015
% o
f T
en
ure
d F
AS. F
acult
y
Tenured
Int'l URM Asian White Unknown
** In compliance with federal regulations, post-2012 race is self-reported. Faculty who have not reported a race are shown as "unknown" or excluded from these figures.**
03/22/16

Section 2: Trends by division (alternate format)
Figs. 13a-d Percent women by division
Figs. 14a-d Count of women by division
Figs. 15a-d Percent URM by division
Figs. 16a-d Count women by division
Notes for Section 2:
o tion is ladder faculty with a primary appointment in FAS, in ding Gibbs instructors.
In compliance with federal regulations, race after 2012 is self-reported, resulting in an increase in the percentage of faculty with an unknown race. e nge rim ri ffe ts ne er f t most of om re term. F t it n no n r e re in ded on in t e denomin tors for e division.
Foreign nationals are in ded in t e r e o nts. If a non-U.S. citizen reported being Black/AfAm, for example, then they are s o n ere s .

Ladder/Tenured
Ladder/Term
Ladder/Tenured
Ladder/Term
Ladder/Tenured
Ladder/Term
Ladder/Tenured
Ladder/Term
Humanities
Social Sciences
Physical Sciences & Eng.
Biological sciences
10%
20%
30%
40%
50%
10%
20%
30%
40%
50%
10%
20%
30%
40%
50%
10%
20%
30%
40%
50%
2000 2005 2010 2015Creation_Date
Perc
ent W
omen
Percent Women by Division
Section 2Yale FAS Ladder Faculty, 2000-2015Prepared by OIR (JRG) for the Faculty Senate
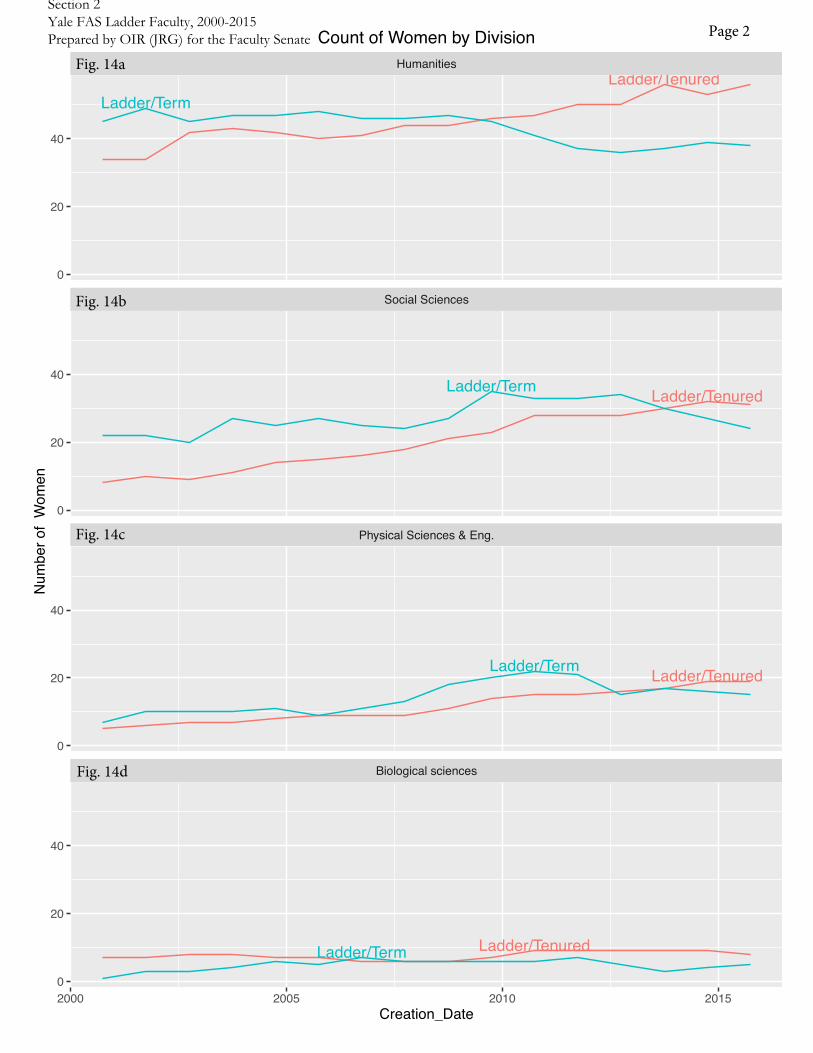
Ladder/TenuredLadder/Term
Ladder/TenuredLadder/Term
Ladder/TenuredLadder/Term
Ladder/TenuredLadder/Term
Humanities
Social Sciences
Physical Sciences & Eng.
Biological sciences
0
20
40
0
20
40
0
20
40
0
20
40
2000 2005 2010 2015Creation_Date
Num
ber o
f W
omen
Count of Women by Division
Section 2Yale FAS Ladder Faculty, 2000-2015Prepared by OIR (JRG) for the Faculty Senate

Ladder/Tenured
Ladder/Term
Ladder/Tenured
Ladder/Term
Ladder/Tenured
Ladder/Term
Ladder/Tenured
Ladder/Term
Humanities
Social Sciences
Physical Sciences & Eng.
Biological sciences
0%
5%
10%
15%
20%
0%
5%
10%
15%
20%
0%
5%
10%
15%
20%
0%
5%
10%
15%
20%
2000 2005 2010 2015Creation_Date
Perc
ent U
RM
Percent URM by Division
Section 2Yale FAS Ladder Faculty, 2000-2015Prepared by OIR (JRG) for the Faculty Senate

Ladder/Tenured
Ladder/Term
Ladder/TenuredLadder/Term
Ladder/TenuredLadder/Term
Ladder/TenuredLadder/Term
Humanities
Social Sciences
Physical Sciences & Eng.
Biological sciences
0
5
10
15
0
5
10
15
0
5
10
15
0
5
10
15
2000 2005 2010 2015Creation_Date
Num
ber o
f UR
MCount of URM by Division
Section 2Yale FAS Ladder Faculty, 2000-2015Prepared by OIR (JRG) for the Faculty Senate
Section 3: c to tenure of entering FAS Assistant Professors, 1985-2015
Table 1 dv n ement to tenure of entering AP’s, URM vs. All others
Table 2 dv n ement to tenure of entering AP’s, Women vs. Men
Fig res s o iring nd ten re r tes nd o nts for F b r e & sex.
Notes for Section 3:
o tion is Assistant Professors with a primary appointment in FAS in 5-year cohorts bv year of hire. For each cohort, er ent ges s o n re # with tenure of total # of entering APs, with # still unresolved in parentheses.
In compliance with federal regulations, race after 2012 is self-reported, resulting in an increase in the percentage of faculty with an unknown race. e nge rim ri ffe ts ne er f t most of omre term.
Table 1 gro s faculty of unknown race with non-URM faculty.
Foreign n tion s re in ded in t ese r e o nts. f non- . . iti en re orted being f m for ex m e t en t e re s o n ere s .
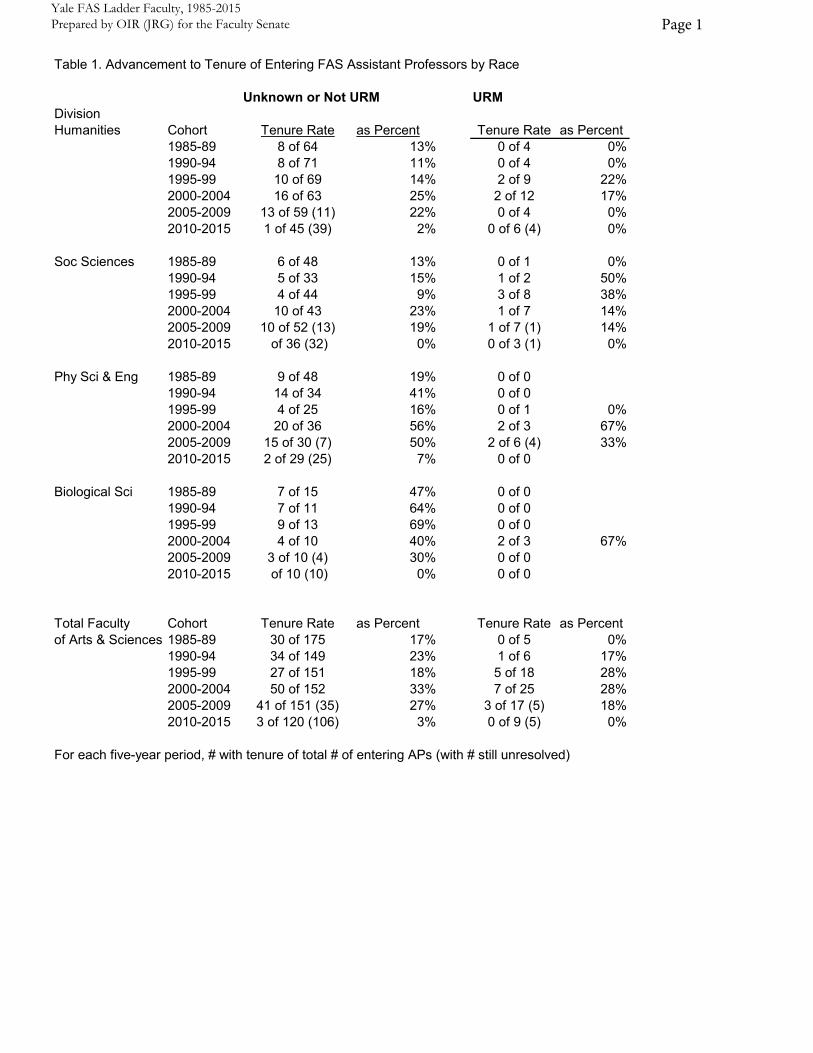
Table 1. Advancement to Tenure of Entering FAS Assistant Professors b a e
Unknown or Not URM URMDivisionHumanities Cohort Tenure Rate as Percent Tenure Rate as Percent
1985-89 8 of 64 13% 0 of 4 0%1990-94 8 of 71 11% 0 of 4 0%1995-99 10 of 69 14% 2 of 9 22%2000-2004 16 of 63 25% 2 of 12 17%2005-2009 13 of 59 (11) 22% 0 of 4 0%2010-2015 1 of 45 (39) 2% 0 of 6 (4) 0%
Soc Sciences 1985-89 6 of 48 13% 0 of 1 0%1990-94 5 of 33 15% 1 of 2 50%1995-99 4 of 44 9% 3 of 8 38%2000-2004 10 of 43 23% 1 of 7 14%2005-2009 10 of 52 (13) 19% 1 of 7 (1) 14%2010-2015 of 36 (32) 0% 0 of 3 (1) 0%
Phy Sci & Eng 1985-89 9 of 48 19% 0 of 01990-94 14 of 34 41% 0 of 01995-99 4 of 25 16% 0 of 1 0%2000-2004 20 of 36 56% 2 of 3 67%2005-2009 15 of 30 (7) 50% 2 of 6 (4) 33%2010-2015 2 of 29 (25) 7% 0 of 0
Biological Sci 1985-89 7 of 15 47% 0 of 01990-94 7 of 11 64% 0 of 01995-99 9 of 13 69% 0 of 02000-2004 4 of 10 40% 2 of 3 67%2005-2009 3 of 10 (4) 30% 0 of 02010-2015 of 10 (10) 0% 0 of 0
Total Faculty Cohort Tenure Rate as Percent Tenure Rate as Percentof Arts & Sciences 1985-89 30 of 175 17% 0 of 5 0%
1990-94 34 of 149 23% 1 of 6 17%1995-99 27 of 151 18% 5 of 18 28%2000-2004 50 of 152 33% 7 of 25 28%2005-2009 41 of 151 (35) 27% 3 of 17 (5) 18%2010-2015 3 of 120 (106) 3% 0 of 9 (5) 0%
For each five-year period, # with tenure of total # of entering APs (with # still unresolved)
Section 3Yale FAS Ladder Faculty, 1985-2015Prepared by OIR (JRG) for the Faculty Senate
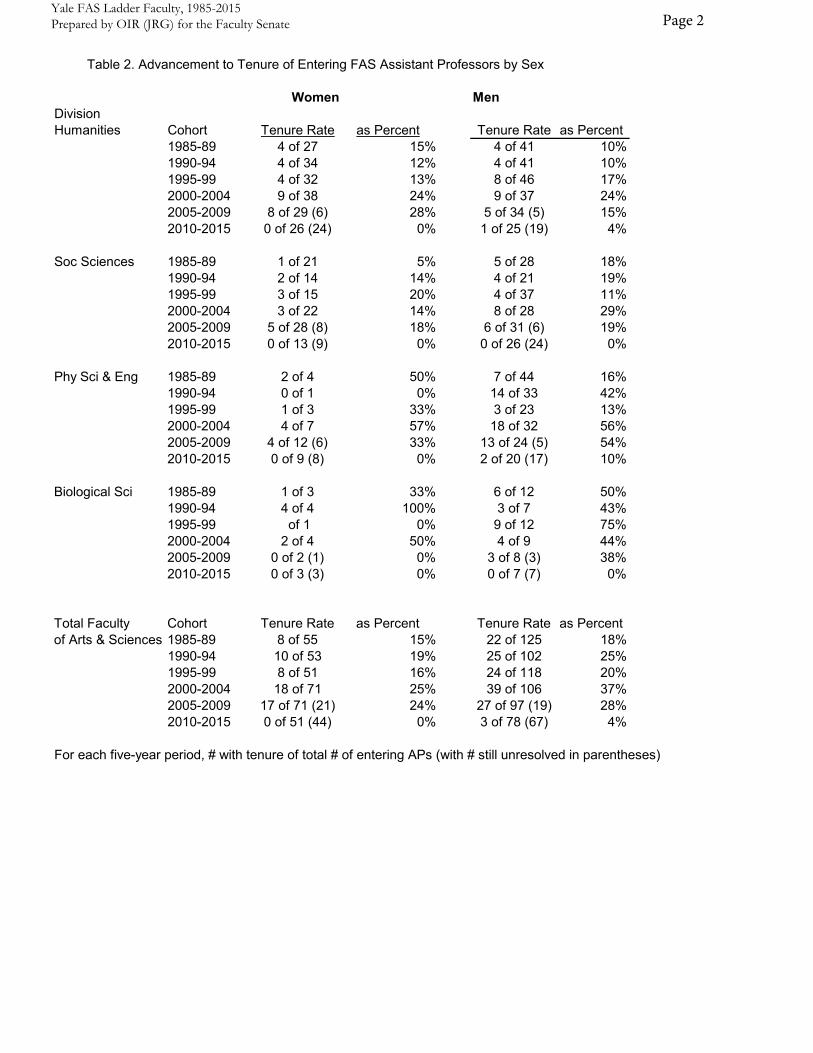
Table . Advancement to Tenure of Entering FAS Assistant Professors b e
Women MenDivisionHumanities Cohort Tenure Rate as Percent Tenure Rate as Percent
1985-89 4 of 27 15% 4 of 41 10%1990-94 4 of 34 12% 4 of 41 10%1995-99 4 of 32 13% 8 of 46 17%2000-2004 9 of 38 24% 9 of 37 24%2005-2009 8 of 29 (6) 28% 5 of 34 (5) 15%2010-2015 0 of 26 (24) 0% 1 of 25 (19) 4%
Soc Sciences 1985-89 1 of 21 5% 5 of 28 18%1990-94 2 of 14 14% 4 of 21 19%1995-99 3 of 15 20% 4 of 37 11%2000-2004 3 of 22 14% 8 of 28 29%2005-2009 5 of 28 (8) 18% 6 of 31 (6) 19%2010-2015 0 of 13 (9) 0% 0 of 26 (24) 0%
Phy Sci & Eng 1985-89 2 of 4 50% 7 of 44 16%1990-94 0 of 1 0% 14 of 33 42%1995-99 1 of 3 33% 3 of 23 13%2000-2004 4 of 7 57% 18 of 32 56%2005-2009 4 of 12 (6) 33% 13 of 24 (5) 54%2010-2015 0 of 9 (8) 0% 2 of 20 (17) 10%
Biological Sci 1985-89 1 of 3 33% 6 of 12 50%1990-94 4 of 4 100% 3 of 7 43%1995-99 of 1 0% 9 of 12 75%2000-2004 2 of 4 50% 4 of 9 44%2005-2009 0 of 2 (1) 0% 3 of 8 (3) 38%2010-2015 0 of 3 (3) 0% 0 of 7 (7) 0%
Total Faculty Cohort Tenure Rate as Percent Tenure Rate as Percentof Arts & Sciences 1985-89 8 of 55 15% 22 of 125 18%
1990-94 10 of 53 19% 25 of 102 25%1995-99 8 of 51 16% 24 of 118 20%2000-2004 18 of 71 25% 39 of 106 37%2005-2009 17 of 71 (21) 24% 27 of 97 (19) 28%2010-2015 0 of 51 (44) 0% 3 of 78 (67) 4%
For each five-year period, # with tenure of total # of entering APs (with # still unresolved in parentheses)
Section 3Yale FAS Ladder Faculty, 1985-2015Prepared by OIR (JRG) for the Faculty Senate
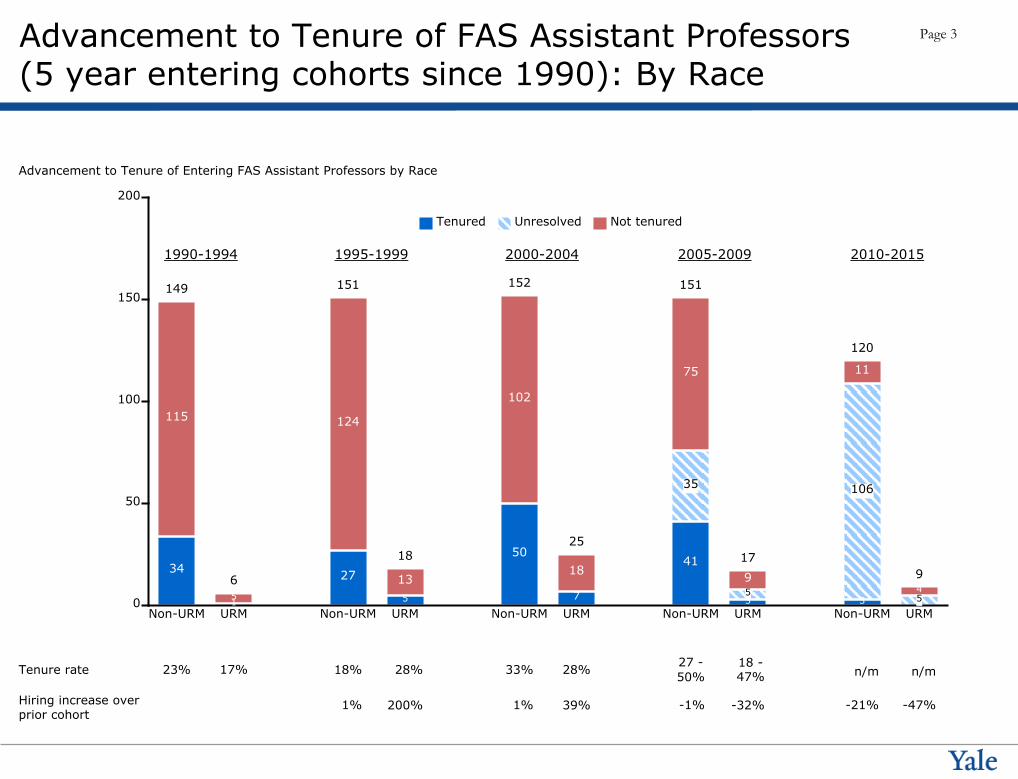
Advancement to Tenure of FAS Assistant Professors (5 year entering cohorts since 1990): By Race
0
50
100
150
200
Advancement to Tenure of Entering FAS Assistant Professors by Race
Non-URM
34
115
149
URM156
Non-URM
27
124
151
URM5
13
18
Non-URM
50
102
152
URM7
18
25
Non-URM
41
35
75
151
URM35917
Non-URM3
106
11
120
URM549
23% 27 -50%
18 -47% n/m n/m17% 18% 28% 33% 28%Tenure rate
-1% -32% -21% -47%1% 200% 1% 39%Hiring increase overprior cohort
Tenured Unresolved Not tenured
1990-1994 1995-1999 2000-2004 2005-2009 2010-2015
ge

Advancement to Tenure of FAS Assistant Professors (5 year entering cohorts since 1990): By Gender
0
25
50
75
100
125
150
Advancement to Tenure of Entering FAS Assistant Professors by Gender
Male
25
77
102
Female
10
43
53
Male
24
94
118
Female8
43
51
Male
39
67
106
Female
18
53
71
Male
27
19
51
97
Female
17
21
33
71
Male3
67
8
78
Female
44
751
25% 24 -54%
28 -47% n/m n/m19% 20% 16% 37% 25%Tenure rate
-8% 0% -20% -28%16% -4% -10% 39%Hiring increase overprior cohort
Tenured Unresolved Not tenured
1990-1994 1995-1999 2000-2004 2005-2009 2010-2015
ge

Section 4: Attrition among FAS Assistant Professors, 1985-2015
Figs. 17a-f Attrition among entering AP’s in FAS, by 5-year cohorts
Figs. 18a-f Attrition among entering AP’s in FAS, by 5-year cohorts, Women vs. Men
Figs. 19a-f Attrition among entering AP’s in FAS, by 5-year cohorts, URM vs. All others
Notes for Section 4:
o tion is Assistant Professors with a primary appointment in FAS in 5-year cohorts bv year of hire.
Solid lines are resolved; dotted lines indicate unresolved cases remaining. (Dotted lines will drop as tenure decisions are made.)
“Percent tenured” only shows the outcome of the tenure process. It does not indicate that those who received tenure remained at Yale.
De rt res in de those who left before a tenure decision s re ed.
In compliance with federal regulations, race after 2012 is self-reported, resulting in an increase in the percentage of faculty with an unknown race. e nge rim ri ffe ts ne er f t most of omre term.
Figs. -f gro s faculty of unknown race with non-URM faculty.
Foreign n tion s re in ded in t ese r e o nts. f non- . . iti en re orted being f m for ex m e t en t e re s o n ere s .
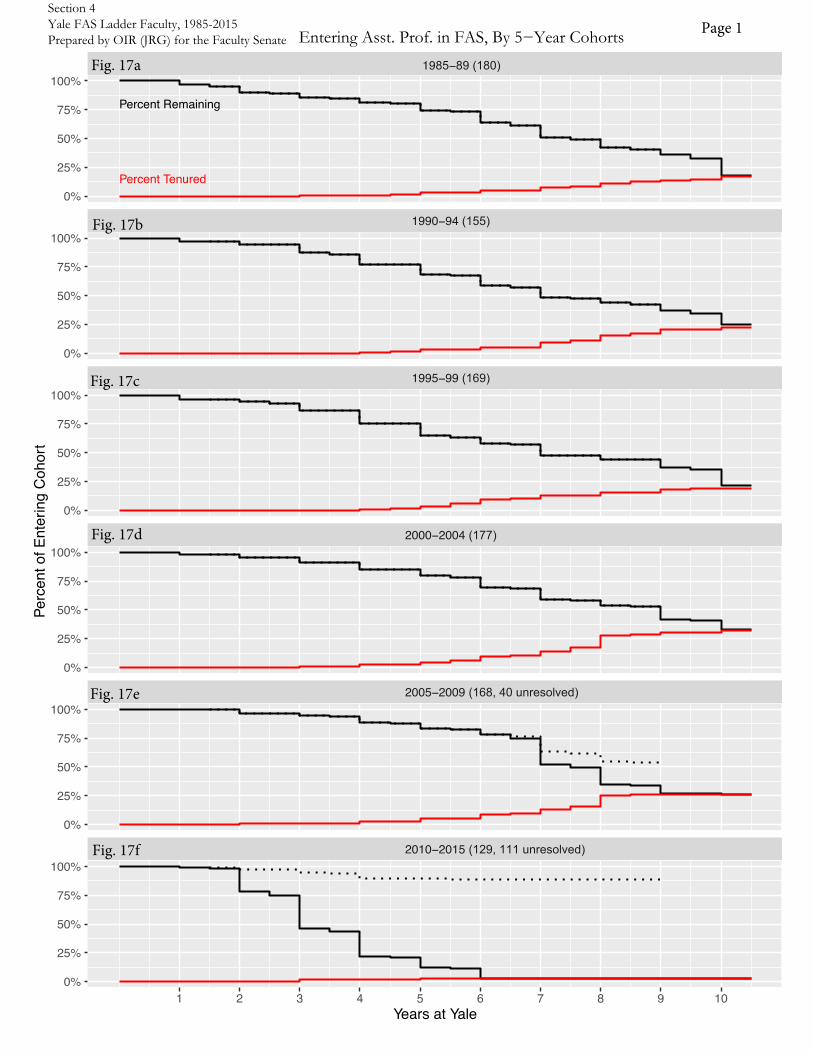
Percent Remaining
Percent Tenured
1990−94
1995−99
2000−2004
2005−2009 n e ved
2010−2015 n e ved
0%
25%
50%
75%
100%
0%
25%
50%
75%
100%
0%
25%
50%
75%
100%
0%
25%
50%
75%
100%
0%
25%
50%
75%
100%
0%
25%
50%
75%
100%
1 2 3 4 5 6 7 8 9 10Years at Yale
Perc
ent o
f Ent
erin
g C
ohor
tntering sst. rof. in F e r o orts
19 −
Section 4Yale FAS Ladder Faculty, 1985-2015Prepared by OIR (JRG) for the Faculty Senate

Percent RemainingWomen Men
Percent TenuredWomen Men
ntering o orts of sst. rof. in F ( ender)
1990−94
1995−99
2000−2004
2005−2009
2010−2015
0%
25%
50%
75%
100%
0%
25%
50%
75%
100%
0%
25%
50%
75%
100%
0%
25%
50%
75%
100%
0%
25%
50%
75%
100%
0%
25%
50%
75%
100%
1 2 3 4 5 6 7 8 9 10Years at Yale
Perc
ent o
f Ent
erin
g C
ohor
t19 −
Section 4Yale FAS Ladder Faculty, 1985-2015Prepared by OIR (JRG) for the Faculty Senate
ta Womenta Men
ta Womenta Men
ta Womenta Men
ta Womenta Men
ta Womenta Men
ta Womenta Men
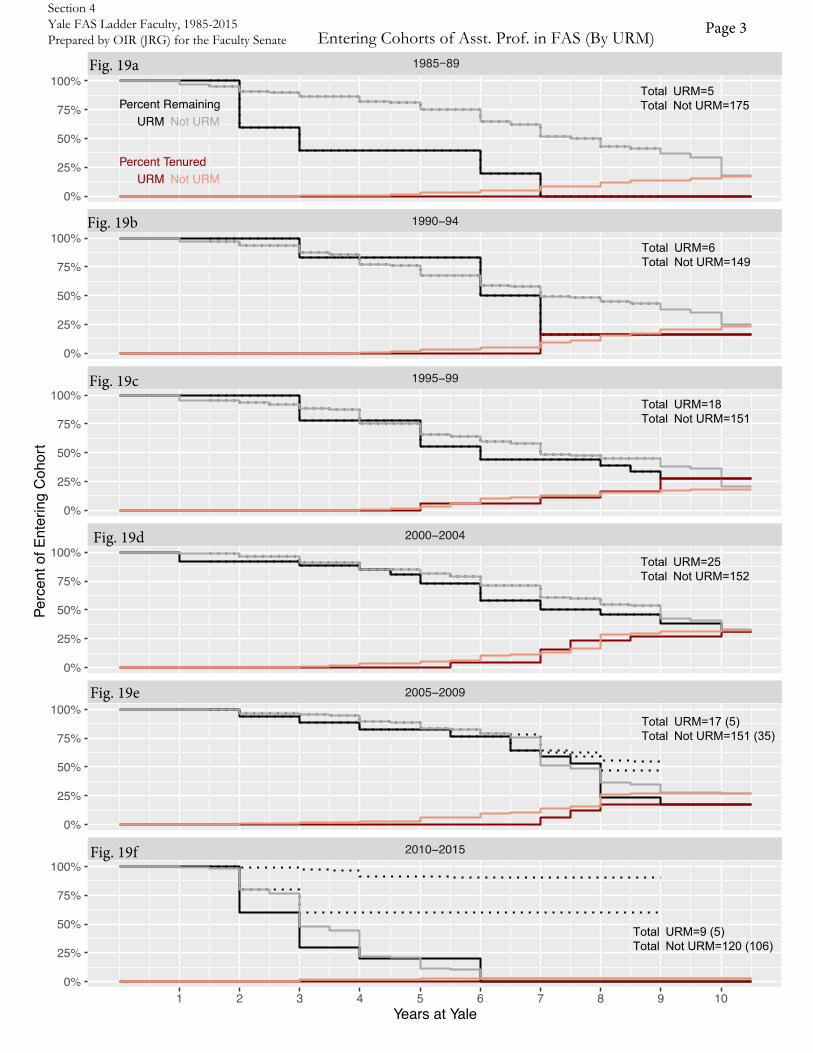
Percent RemainingURM Not URM
Percent TenuredURM Not URM
ntering o orts of sst. rof. in F ( )
1990−94
1995−99
2000−2004
2005−2009
2010−2015
0%
25%
50%
75%
100%
0%
25%
50%
75%
100%
0%
25%
50%
75%
100%
0%
25%
50%
75%
100%
0%
25%
50%
75%
100%
0%
25%
50%
75%
100%
1 2 3 4 5 6 7 8 9 10Years at Yale
Perc
ent o
f Ent
erin
g C
ohor
t1
Section 4Yale FAS Ladder Faculty, 1985-2015Prepared by OIR (JRG) for the Faculty Senate
tata t
tata t
tata t
tata t
tata t
tata t


![Product Specification Tsan 燦 - Farnell · 2015. 3. 16. · Tsan. 10W Series. 燦. of Light or a Combination of “Tsan [Can] is the English translation for the Chinese word representing](https://static.fdocuments.us/doc/165x107/60dffccd096356320a5477cf/product-specification-tsan-c-2015-3-16-tsan-10w-series-c-of-light.jpg)