Ultrastructural characteristics and histological impacts ...

A Computational Framework for Ultrastructural Mapping of Neural Circuitry J.R. Anderson1, B.W. Jones1, J-H Yang1, M.V. Shaw1, C.B. Watt1, P. Koshevoy2,3, J. Spaltenstein3, E. Jurrus3, Kannan U V3, R. Whitaker3, D. Mastronarde4 , T. Tasdizen3,5, R.E. Marc1
Affiliations: 1Dept. Ophthalmology, Moran Eye Center, University of Utah; 2Sorenson Media, Salt Lake City, UT; 3Scientific Comput-ing and Imaging Institute, University of Utah; 4The Boulder Laboratory For 3-D Electron Microscopy of Cells, University of Colorado,
Boulder; 5Dept. Electrical and Computer Engineering, University of Utah.
Circuity mapping of metazoan neural systems is difficult because canonical neural regions (re-gions containing one or more copies of all components) are large, regional borders are uncertain, neuronal diversity is high, and potential network topologies so numerous that only anatomical ground truth can resolve them. Complete mapping of a specific network requires synaptic resolution, canonical region coverage and robust neuronal classification. Though transmission electron microscopy (TEM) remains the optimal tool for network mapping, the process of building large serial section TEM (ssTEM) image volumes is rendered difficult by the need to precisely mo-saic distorted image tiles and register distorted mosaics. Moreover, most molecular neuronal class markers are poorly compatible with optimal TEM imaging.
Our objective was to build a complete framework for ultrastructural circuitry mapping. This framework combines strong TEM-compliant small molecule profiling with automated image tile mosaicking, automated slice-to-slice image registration and gigabyte-scale image browsing for volume annotation. Specifically we show how ultrathin molecular profiling datasets and their re-sultant classification maps can be embedded into ssTEM datasets and how scripted acquisition tools (SerialEM), mosaicking and registration (ir-tools), and large slice viewers (MosaicBuilder, Viking) can be used to manage terabyte-scale volumes. These methods enable large-scale con-nectivity analyses of new and legacy data. In well-posed tasks (e.g. complete network mapping in retina), terabyte scale image volumes that previously would require decades of assembly can now be completed in months. Perhaps more importantly, the fusion of molecular profiling, image ac-quisition by SerialEM, ir-tools volume assembly and data viewers/annotators also allow ssTEM to be used as prospective tool for discovery in non-neural systems and a practical screening meth-odology for neurogenetics. Finally, this framework provides a mechanism for parallelization of ssTEM imaging, volume assembly, and data analysis across an international user base, enhancing the productivity of a large cohort of electron microscopists.
IntroductionNeural network reconstruction is a grand challenge in neuroscience and vision science in particular. Defining complete network (CN) maps or connectomes [1,2] for canonical regions of any metazoan neural assembly re-quires robust cataloguing of neuronal classes [3,4,5,6,7], mapping statistically distinct neuronal patterns [8,9,10,11] and tracing characteristic connec-tions[12,13,14]. Moreover, anatomic methods for net-work analysis have not kept pace with the demands for phenotyping an immense and expanding library of ge-
netic models of neurologic disorders in general [15] and retinal disorders in particular [16]. This is all the more distressing since, historically, anatomy has shown far more power to define neural network ground truth1 than either modeling or physiological strategies and, in prac-tice, ssTEM has been the most powerful generator of validated existing network maps. The need to expand these abilities beyond the purview of a limited number of specialized laboratories has never been more acute.
Anderson et al. A Framework for Ultrastructural Mapping in press PLoS Biology
1 The term "ground truth" emerged first in remote sensing and refers to specific ground information used to validate opti-cal data captured from afar. In neuroscience, ground truth is the physical connectivity of identified neurons. Patterns of connectivity inferred from behavior, modeling or physiology are thus subject to the test of anatomical ground truth.

Figure 1. Neuronal elements for building networks. A five ele-ment micronetwork involving one amacrine cell (A) mediating cross talk between two vertical channels (i,j) with bipolar cells (B) synaptically driving ganglion cells (G). There are eight dis-crete amacrine cell connnections (0-7) and the network can be configured in 90 formal motifs, at least 40 of which are of bio-logical significance. Solid dots and arrows are excitatory; open dots and arrows are inhibitory.
We have developed a complete suite of software tools and strategies that leverage existing ultrastructural re-sources (Table 1). Commercial [17] and academic [18,19] software solutions for small-scale, user-guided mosaicking and multimodal registration have long been available, but have not proven viable for large datasets or high throughput. By providing tools to precisely and automatically tile many images ( ≈ 1000) into large mo-saics, to precisely register serial mosaics (including mul-timodal frames) and to browse gigabyte image sets and terabyte volumes, we hope to enable expanded analysis of connectivity patterns in legacy as well as new image databases.
Why are such tools important? Simply, the unraveling of connective patterns in complex neural tissue and the
characterization of deranged circuitry in disease states requires sampling scales that have been impractical. Some important neural reconstruction tasks are so large that they transcend investigator lifetimes using current resources [20]. The volume that must be constructed to approach sampling completeness in the inner plexiform layer of the mammalian retina is three orders of magni-tude larger than most typical ssTEM volumes used in CNS [18,21]. Other programs are addressing these chal-lenges by developing novel platforms to acquire pre-aligned serial electron microscope images [22,23,24,25]. However these platforms alone are not the sole nor op-timal strategies for ssTEM volume assembly, as some new methods destroy samples, are limited in resolution and speed (Table 2), and most of the platforms are develop-mental or highly restricted in availability. Conversely, ssTEM has high resolution, tremendously flexibility in staining and immunocytochemical options, very fast ac-quisition times and the potential for parallelization, by analogy with grid computing, via the subdivision of ssTEM samples into packets for parallel data acquisition. Data assembly could be readily done if tools to harmo-nize the effort were widely available. We present the essential software tools here, specifically those for as-sembling large-scale mosaics and achieving slice-to-slice image registration.
The challenge of network diversity.Is ssTEM really necessary? Why can’t we deduce net-works from physiology, confocal imaging or behavior? The answer is that potential network motifs derived by these methods are not unique. Diversity in potential net-work topologies is so high [17,26] that only anatomical ground truth can produce a valid connectome [17]. For example, mammalian retinas are simpler than those of most other vertebrates [27] but even so, no fewer than 70 unique cell classes exist [28]. And though the flow of
signals from cone photoreceptors to ganglion cells (GCs) involves stereo-typed networks that seem simple [29], a vast number of synaptic mo-tifs can be produced from even a limited neuron set [17]. A small net-work of two different bipolar cells (BCs) driving two GC channels, in-terconnected by one amacrine cell (AC) class can be connected in 90 formal motifs and at least 40 of these are biologically tenable (Fig. 1, S1, S2). This is further compounded by unknown synaptic weights, molecu-lar diversity of receptors and chan-nels, gap junction display, and elec-trotonic constraints. With electro-tonic constraints, the geometric locus of a synaptic contact matters [30,31,32] and the number of struc-
Anderson et al. A Framework for Ultrastructural Mapping PLoS Biology
2
Table 1: Software Tools and Sources
Application Function Platform(s) LinkSerialEM [1] TEM Acquisition W Univ Colorado, BoulderSyncroscanRT LM Acquisition W Objective Imagingir-fft [2] autotiling L, M Univ Utah SCI Instituteir-refine-grid [2] autotiling L, M Univ Utah SCI Instituteir-translate [3] metadata tiling L, M Univ Utah SCI Instituteir-tweak [2] registration L, M, W Univ Utah SCI Instituteir-stos-brute [2] autoregistration L, M Univ Utah SCI Instituteir-stos-grid [2] autoregistration L, M Univ Utah SCI Instituteir-blob [2] feature enhancement L,M Univ Utah SCI Instituteir-clahe [2] image equalization L, M Univ Utah SCI InstituteCMPView [4] classification L, M, W Univ Utah SCI InstituteMosaicBuilder [3] 2D viewer & annotation M Univ Utah SCI InstituteViking [4] Multi-slice annotation W Univ Utah SCI Institute
Key: W Wintel, L Linux, M Macintosh OS XPrimary Authors: [1] D. Mastronarde, [2] P. Koshevoy, [3] J. Spaltenstein, [4] J. AndersonLinks: Colorado: http://bio3d.colorado.edu/SerialEM/, Objective Imaging: http://www.objectiveimaging.com, Utah http://code.sci.utah.edu/Microscopy

tural motifs possible in the simple 5 element example extends to at least 640 (Fig. S1). In stark contrast, we know that the outflow of signals from the mammalian retina is represented by only 15-20 ganglion cell classes, each representing a discrete filter channel [5,33,34].
Anatomy uncovers unique network motifsAn anatomical approach that unambiguously determines motifs is required. This is justified by the fact that the efficacy of anatomy discovering complex motifs is unri-valed. Mammalian night (scotopic) vision is a prime ex-ample. The main scotopic signal flow network is rod →
rod BC → rod AC, which then bifurcates into two synap-tic arms that re-enter the ON and OFF cone BC path-ways. This motif was reported in 1974 by Helga Kolb and
E.V. Famiglietti Jr. using ssTEM [12]. Subsequent physiological and genetic analyses [35,36] provided correlative support for the anatomical model, but nei-ther study would have uniquely yielded the correct topology. Moreover, both TEM [12,37,38,39,40] and LM imaging studies [41,42] reveal that this network is even more complex. There are, in fact, no physiologi-cal data that either explain or predict these network submotifs. And despite five decades of robust physiol-ogy of retinal rod signaling, the discovery of a second scotopic pathway was also based on ssTEM [43,44]. Finally, corruption of scotopic motifs in retinal disease was discovered by TEM [45], again despite decades of electroretinographic analysis. It is unlikely that the day of ultrastructural discovery is past and we argue that it is just dawning.
Requirements for building CN maps.Manually acquiring even small maps by ssTEM re-quires Herculean effort, high technical skill [21]. The gold-standard for such mapping has long been the Caenorhabditis elegans (C. elegans) ssTEM reconstruc-tion project [46,47,48,49,50] where over 300 neurons, over 6000 synapses and nearly 900 gap junctions were traced through several instances of 1000-2000 section series, initially aligned and manually marked-up using the cinematographic method of Levinthal and Ware [51] developed in the early 1970’s. While the actual build and analysis times are not available, we will show that a typical vertebrate brain canonical volume (see below) involves 1-3 orders of magnitude more connections and vastly more complex topology, since most of the C. elegans sections involve tracing linear tracts. The brute force manual method is simply im-practical for building CN maps of more complex neu-ral systems.
Three essential factors in building CN maps are (i) proper resolution, (ii) statistical coverage and (iii) com-plete classification.
Resolution must be sufficient to unambiguously identify synaptic contacts and gap junctions [21] but not so high as so be unmanageable: nominally 2 nm/pixel. This yields synaptic vesicles spanned by 8-10 pixels which are robust for circuitry tracing.
Coverage scales with neuronal diversity and density: a canonical region must be sampled. We define two cov-erage units (Fig. 2). A canonical tile is bounded by the Voronoi domain (see Reese [11]) of the rarest neuronal element in a cellular array. In retina, this might be the dopaminergic polyaxonal cell [52] or OFF α GCs [5]. A slightly larger element is the canonical field, bounded by three somas (in planar systems such as retina) or four somas (in brain volumes) of the sparsest neuronal class. This ensures inclusion of multiple somas of all element
Anderson et al. A Framework for Ultrastructural Mapping PLoS Biology
3
Table 2: Platform Comparisons for a 250 µm diameter x 30 µm high volume
Operation ssTEM Block-face SEM*Sectioning Manual AutomaticSectioning speed < 1 wk NARisk of section loss High LowThickness range 40-90 nm 20-70 nmStaining Manual, fast Manual en blocStaining options** Numerous LimitedImmunochemistry Compatible Not yet compatibleSingle tile size 16 megapixels 16 megapixels*Single mosaic size 15-30 Gb 16 megapixels*Image capture time 3130 tiles/day NAMosaic capture time 3/day 0.5/day*Resolution ≈ 2 nm/pixel ≈ 10 nm/pixelUse constraints*** None ExtremeScalability**** High LowMosaic build times……………………………. †MRC to TIF convert 55 m NABuild image pyramids 43 m NAir-translate time 16 m NAir-refine time 64 m NAir-assemble time 12 m NAmosaic builds/day 8 0.5Mosaic register times…………………………..ir-stos-brute 43 s NAir-stos-grid 8 m NApairs aligned/day >100 0.5
* Data from GATAN Corporation; otherwise from Denk and Horstman (2004). Bloc face SEM can capture ≈ half of a 0.25 mm diameter bloc face daily. This is equivalent to aligning half of an image pair daily.** All standard ssTEM strategies, including CMP and post-embedding immunocytochemistry are available*** ssTEM may be interrupted at any time to image other samples. Block-face imaging cannot be interrupted.**** ssTEM capture and processing speed can be enhanced further by parallelization† Assumes that no image processing is required for bloc-face imagingNA not applicable
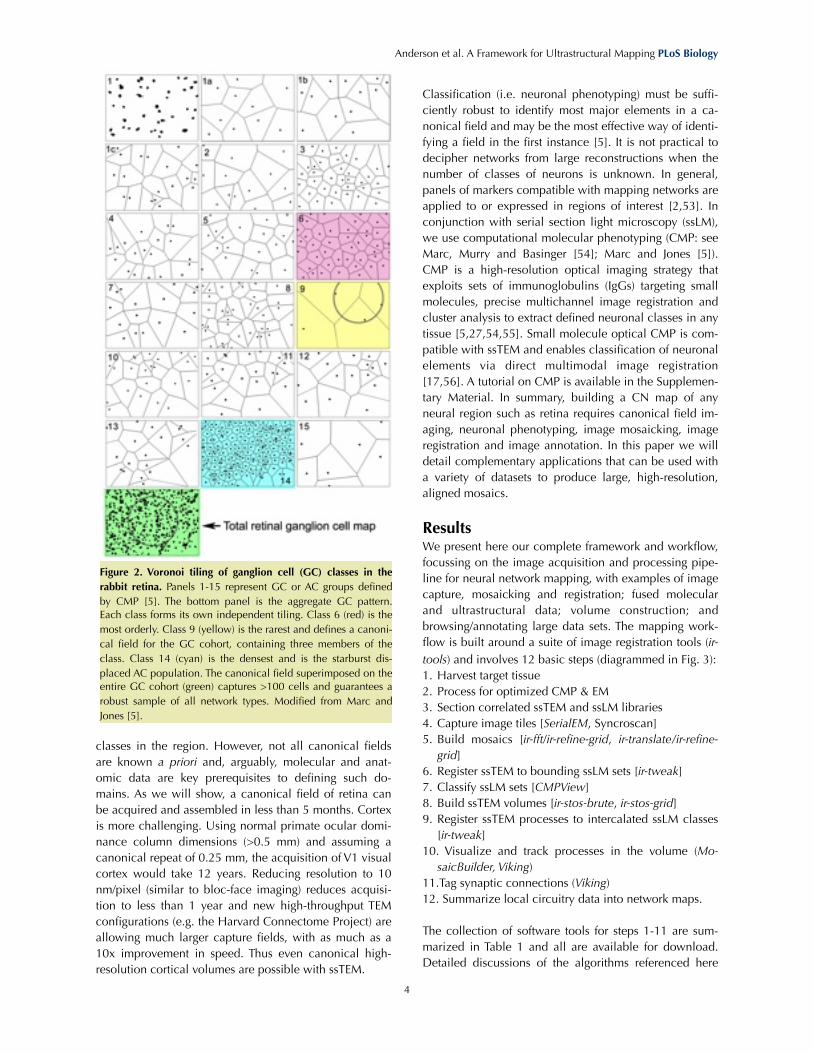
classes in the region. However, not all canonical fields are known a priori and, arguably, molecular and anat-omic data are key prerequisites to defining such do-mains. As we will show, a canonical field of retina can be acquired and assembled in less than 5 months. Cortex is more challenging. Using normal primate ocular domi-nance column dimensions (>0.5 mm) and assuming a canonical repeat of 0.25 mm, the acquisition of V1 visual cortex would take 12 years. Reducing resolution to 10 nm/pixel (similar to bloc-face imaging) reduces acquisi-tion to less than 1 year and new high-throughput TEM configurations (e.g. the Harvard Connectome Project) are allowing much larger capture fields, with as much as a 10x improvement in speed. Thus even canonical high-resolution cortical volumes are possible with ssTEM.
Classification (i.e. neuronal phenotyping) must be suffi-ciently robust to identify most major elements in a ca-nonical field and may be the most effective way of identi-fying a field in the first instance [5]. It is not practical to decipher networks from large reconstructions when the number of classes of neurons is unknown. In general, panels of markers compatible with mapping networks are applied to or expressed in regions of interest [2,53]. In conjunction with serial section light microscopy (ssLM), we use computational molecular phenotyping (CMP: see Marc, Murry and Basinger [54]; Marc and Jones [5]). CMP is a high-resolution optical imaging strategy that exploits sets of immunoglobulins (IgGs) targeting small molecules, precise multichannel image registration and cluster analysis to extract defined neuronal classes in any tissue [5,27,54,55]. Small molecule optical CMP is com-patible with ssTEM and enables classification of neuronal elements via direct multimodal image registration [17,56]. A tutorial on CMP is available in the Supplemen-tary Material. In summary, building a CN map of any neural region such as retina requires canonical field im-aging, neuronal phenotyping, image mosaicking, image registration and image annotation. In this paper we will detail complementary applications that can be used with a variety of datasets to produce large, high-resolution, aligned mosaics.
ResultsWe present here our complete framework and workflow, focussing on the image acquisition and processing pipe-line for neural network mapping, with examples of image capture, mosaicking and registration; fused molecular and ultrastructural data; volume construction; and browsing/annotating large data sets. The mapping work-flow is built around a suite of image registration tools (ir-tools) and involves 12 basic steps (diagrammed in Fig. 3):1. Harvest target tissue2. Process for optimized CMP & EM3. Section correlated ssTEM and ssLM libraries 4. Capture image tiles [SerialEM, Syncroscan]5. Build mosaics [ir-fft/ir-refine-grid, ir-translate/ir-refine-
grid]6. Register ssTEM to bounding ssLM sets [ir-tweak]7. Classify ssLM sets [CMPView]8. Build ssTEM volumes [ir-stos-brute, ir-stos-grid]9. Register ssTEM processes to intercalated ssLM classes
[ir-tweak]10. Visualize and track processes in the volume (Mo-
saicBuilder, Viking)11.Tag synaptic connections (Viking)12. Summarize local circuitry data into network maps.
The collection of software tools for steps 1-11 are sum-marized in Table 1 and all are available for download. Detailed discussions of the algorithms referenced here
Anderson et al. A Framework for Ultrastructural Mapping PLoS Biology
4
Figure 2. Voronoi tiling of ganglion cell (GC) classes in the rabbit retina. Panels 1-15 represent GC or AC groups defined by CMP [5]. The bottom panel is the aggregate GC pattern. Each class forms its own independent tiling. Class 6 (red) is the most orderly. Class 9 (yellow) is the rarest and defines a canoni-cal field for the GC cohort, containing three members of the class. Class 14 (cyan) is the densest and is the starburst dis-placed AC population. The canonical field superimposed on the entire GC cohort (green) captures >100 cells and guarantees a robust sample of all network types. Modified from Marc and Jones [5].

are available in the supplementary material. This framework is obvi-ously not restricted to analysis of the nervous system or any TEM or SEM platform, but analyses of syn-aptic connectivity specifically re-quire a characteristic resolution and canonical field, as will recon-struction of any other tissue vol-ume.
Acquiring mosaic tiles manually.Many TEM facilities lack automated montaging, but this does not mean that high quality imagery cannot be obtained. Standard TEM imaging with sufficient image overlap can be obtained manually and images scanned at high resolution and bit depth. We use magnifications rang-ing from 5,000x-10,000x and a typical manual ssTEM project size would be 100 image tiles per sec-tion. Similarly, corresponding bounding or intercalated ssLM sec-tions can be imaged manually and require only a few tiles even at high resolution. However, as the positions of each ssLM and ssTEM image tile in the original sections are often lost, software tools to provide precise mosaic alignments are necessary.
Acquiring mosaic tiles with SerialEM.Larger ssTEM datasets can be cap-tured with automated imaging, exceeding 1000 tiles. Such mon-taging requires robust control of stage position, camera behavior, metadata collection and efficient use of resources. All of these are available through use of SerialEM s o f t wa r e d e ve l o p e d a t t h e University of Colorado. SerialEM allows the use irregular capture patterns. No further user attention is required once all sections on a grid have been queued which al-lows one to utilize the TEM during commonly idle night and weekend periods. In all regards we have found automated capture very re-source efficient compared to man-ual approaches. Our current con-figuration captures 3000 tiles in a
Anderson et al. A Framework for Ultrastructural Mapping PLoS Biology
5
Figure 3. The workflow for the ssTEM ultrastructural circuitry framework. Parallel serial section grid (ssTEM) and slide (ssLM) libraries are built. The ssLM libraries define either the bounds of the canonical field or are intercalated. Each library is acquired as a set of tiles mosaicked by ir-tools. ssLM and ssTEM mosaicks are registered by ir-tweak and ssTEM vol-umes built with ir-stos applications. CMP classified ssLM imagery is merged with the volume to tag neurons and processes. The volumes are browsed with MosiacBuilder/Viking for proc-ess tracking and annotation.

day. The expanded capacity of ssTEM imaging requires a corresponding automation of ssLM tile collection. There are a number of commercial microscope tiling stages and our initial experience showed that the highest precision stages were essential to building mosaics of sufficient quality for CMP. However, the development of software tools for building mosaics informed by but not depend-ent upon stage metadata makes the X-Y precision of the stage less critical as long as overlap is adequate.
Building mosaics with ir-fft, ir-translate and ir-refine-grid. There are several challenges in ssTEM or ssLM image mosaicking with manual tile acquisition. First, every sec-tion exhibits an unpredictable rotation when placed in the TEM or on a slide and the number of tiles in each scan-line will differ. Thus it is typically not known which tiles are neighbors in a section. We developed the ir-fft algorithm to deduce the tile ordering automatically (see Supplementary Material for a detailed description of ir-fft). The next challenge is the correction of non-linear warps introduced into each tile from variations in elec-
tron imaging quality (Fig. 4; also see Methods and Mate-rials). Our solution finds pairs of overlapping tiles, com-putes their relative displacement, deduces a tile ordering, builds a layout of the mosaic without non-linear warping, and refines the mosaic by applying non-linear warps to each tile.
Ultimately, it is more efficient to build ssLM and ssTEM mosaics when coordinate information is available in the image metadata and the tool ir-translate exploits this. Only overlapping tiles are matched using the Fourier shift method (ir-fft). This reduces the complexity of the method from a quadratic to a linear function of the num-ber of tiles. Next, we define a tension vector proportional to the offset between the approximate position,and the preferred position as found by matching. These tensions are relaxed by iteratively moving the tiles (see Supple-mentary Material).
Regardless of tile placement, most mosaics require some non-linear warp refinement and this is accomplished with ir-refine-grid, an approach that places a course tri-
Anderson et al. A Framework for Ultrastructural Mapping PLoS Biology
6
Figure 4. Distortions in overlapping tile regions visualized on film capture of ssTEM data. A typical low magnification (3000x) field for synaptic screening in the rabbit inner plexiform layer was captured on a Hitachi H-600 with film images at ≈ 25% overlap. Panels A and B represent part of the overlapping fields with slightly different densities due to the auto-exposure of different images. Panels C and D represent the difference of panels A and B after translational/rotational best alignments for two regions (circles 1 and 2). When imagery in circle 2 is aligned best (panel C) the regions in circle 1 are shifted and have a higher image dispersion. The same is true when imagery in circle 1 is aligned best (panel D). The quality of alignment is quantified by normalized intensity histograms of corre-sponding patches. When spots are well-aligned (blue) the histograms are narrow, when poorly aligned (yellow) the intensity variance
is high. The two spots are 6 µm apart. The histograms are peak normalized pixel number (ordinate) versus pixel value (abscissa, 0-255). Arrows indicate various ribbon and conventional synapses.

angular mesh over each tile Vertices are repositioned by registering their immediate neighborhood to overlapping tiles with the same matching algorithm utilized by ir-fft. Details of algorithm development are in the Supplemen-tary Material. Each tile is sampled onto a coarse uniform triangle mesh and small, neighborhoods is sampled from all of the tile neighbors in the mosaic and the best matches determined as in ir-fft. A simple example of the ability of ir-refine-grid to manage subtle distortions is shown in Fig. 5, where the TEM image tiles previously shown intractable under translation are readily aligned without user intervention. These are low resolution tiles: a worst-case scenario.
Even when thousands of tiles are assembled, the align-ment remains excellent. Fig. 6 displays a randomly se-lected tile from a 120+ mosaic series of >1000 tiles each, aligned with ir-translate. At the screen resolution used for synaptic markup, the tile edges are rarely visible. The error in aligment in this set of four overlapping tiles is extremely small, ranging from no detectable misalign-ment across three tiles to 7.8 nm x shift in one tile: roughly ⅓ of a vesicle. Such errors are random rather than systematic through the volume, and do not accumu-late. Together, ir-tools assemble superb mosaics. As an exam-ple, our Syncroscan system builds mosaics from arrays of LM tiles but invariably shows subtle misalignments or blurring at boundaries (Fig. 7A). Conversely, ir-tools per-form beautifully on exactly the same image tiles, generat-ing seamless mosaics (Fig 7B). In truth, the Syncroscan errors are so small (≈ 200-2000 nm) that they are gener-
ally invisible when the full image is viewed, but a Lapla-cian transform (Fig. 7C) shows that there are many of them. When multiple channels are registered for CMP, these errors are additive, resulting in corruption of classi-fication and ssLM-ssTEM registration. The LM images mosaicked by ir-tools are essentially perfect.
Image registration with ir-tweak and ir-brute-stos / ir-refine-stos. Both user-guided and automated image registration tools are needed for ssLM and ssTEM. User-guided applica-tions are essential because some images (e.g. certain CMP imagery) lack sufficient information to drive auto-mation. Ir-tweak is an interactive, multi-threaded, cross-platform application for manual slice-to-slice registration. As control points are placed by the user in one image, their locations in the other image are estimated by the current thin-plate spline transform parameters. When the user corrects the locations of estimated points in the sec-ond image, the transform parameters are updated. Figure 8 shows the ir-tweak interface where the operator places points in the fixed image, adjusts their locations on the moving target image and observes the registration dy-namically.
While automated multimodal slice-to-slice registration remains an open challenge (see publicly available tests at http://prometheus.med.utah.edu/~marclab/gallery_CS.html), such boundary or intercalated registrations are man-ageable with user-guided tools such as ir-tweak. Con-versely, automated ssTEM slice-to-slice (stos) image registration is essential to building volumes, even when image metadata are unavailable. As any section may be
Anderson et al. A Framework for Ultrastructural Mapping PLoS Biology
7
Figure 5. Recovery of distortion errors in tile overlaps with ir-fft and ir-grid-refine. Panels A and B are mirror images of the transparent overlays of fully overlapping regions of two tiles, both with best alignment centers on a large mitochondrion (white spot). Panel A was auto-registered by ir-translate and many membranes appear as double images (arrows) due to non-linear image distortions between the image pairs. Panel B was registered with ir-grid-refine yielding improved membrane definition, even at very low magnification (resolution is about 5nm/pixel, which accounts for the blurring). This is a worst-case scenario. With higher resolutions (more pixels) recovery is even more effective. The inset panels are high-pass 3x3 pixel filtered patches of the same region, showing severe moiré defects in panel A. Scale = 2 µm.

distorted by stretching or electron-optical defects, stos registration is similar to ir-refine-grid, with two differ-ences. Since the orientation of slice pairs is arbitrary, we cannot use image correlation to estimate image to image
translation parameters. Instead, we first perform a brute force search (ir-stos-brute) for tile translation/rotation parameters by downscaling the section mosaics to 128x128 pixel thumbnails and pre-processing (ir-blob) to
Anderson et al. A Framework for Ultrastructural Mapping PLoS Biology
8
Figure 6. Representative tile overlaps randomly selected from a 1000 tile array. A: A randomly selected region of rabbit retinal inner plexiform layer displaying parts of section #105 containing 28 overlapping tiles. The overlaps are invisible at this magnification. Image
width = 46.6 μm, M Müller cell processes. B. Randomly selected boxed region from A containing tile overlaps, width = 4.76 um. Ar-rows indicate a corner region among four tiles. A pair of vesicles (circled) is enlarged in the inset at left showing a misalignment be-tween upper and lower tiles (arrows) corresponding to 7.8 nm or roughly 1/3 vesicle. The four corner region (arrows) is enlarged in the inset at right, showing no significant misalignment. The shaded margins of each tile are due to image processing edge enhancements. Most tiles have no measurable misalignment. AC, amacrine cell terminal.

enhance large blob-like features, preventing feature washout when downscaling. These parameters are then used to initialize the mesh transform at a fine resolution (ir-stos-grid) and applied to a “moving” slice relative to a chosen fixed slice. Figure 9 is a down-sampled QuickTi-me® movie of a mouse retinal microneuroma ssTEM dataset acquired manually on film and automatically built into a volume of 45 auto-registered mosaics. This is a representative legacy dataset and is by far the most challenging type of data for automatic mosaicking and volume assembly due to lack of metadata and the pres-ence of many section defects (stain artifacts, folds, dirt, beam burns). Even so, the alignment is excellent and suggests that many legacy ssTEM datasets can be ex-ploited.
The availability of a large-format digital camera for TEM (e.g. the Gatan Ultrascan 4000) coupled with the most recent builds of SerialEM now make it possible to acquire large image fields at synaptic resolution from any speci-men and begin assembling volumes automatically, such as the retinal circuitry volume for the rod BC layer in the mouse retina (Fig. 10). In this example, each slice was automatically mosaicked from 16 tiles (5000x) with ir-translate and ir-refine-grid and a volume of 20 slices automatically registered with ir-stos (Fig. 10A,B). Manu-
ally registering these datasets are impossible because of the many required distortion corrections among tiles and slices. With the ir-tools a year’s manual work can be done in a day. Upon browsing the volume, characteristic con-nection motifs can be quickly extracted (Fig. 10C,D; S4) and graphically summarized (Fig. 10E) from a text list of relations. Again, the goal is not to render 3D shapes, but rather browse and markup synaptic motifs. This volume readily detects characteristic reciprocal feedback, GA-BAergic local feedforward and glycinergic long-range feedforward synaptic arrangements in the locale of the BC (see animation in Fig. S3). Importantly, all regions are registered, not just the ones of local interest. We have similarly built volumes from 1000-tile datasets of mouse retinal microneuromas (see below) and over 100 serial 1000-tile mosaics from a 300+ section series through the rabbit inner plexiform layer (Fig. 11). This demonstrates the quality of large-scale automated alignment and the absence of cumulative distortions. After automated regis-tration through a volume of >100 sections (2 Tb), no er-ror emerges from transforming all sections into the same volume space. While subtle slice-to-slice distortions exist due to physical deformation of sections, they do not ac-cumulate and section-to-volume distortions are statisti-cally indistinguishable from any those of any slice pair. Should such unlikely distortions emerge, our fast trans-
Anderson et al. A Framework for Ultrastructural Mapping PLoS Biology
9
Figure 7. Auto-registration of ssLM image tiles with ir-translate and ir-grid-refine. A thin 200 nm section was probed with anti-AGB IgGs after excitation of the rabbit retinal GC layer [60], visualized by silver-intensified immunogold detection [54], captured on a Syn-croscanRT montaging system (182 nm/pixel), and aligned with Syncroscan software (A,C) and ir-translate / ir-grid-refine (B,D). At low magnification, both images appear perfect, but at near pixel level, many small defects emerge in the Syncroscan-aligned mosaic (arrows in A,C) that include 200-2000 nm image shifts and image blurring (box). By using the raw image tiles and their metadata, ir-translate and ir-grid-refine create defect-free mosaics. While the image shifts shown in A are irrelevant (indeed invisible) for image display, they are highly corrupting in mathematically sensitive procedures such as clustering and multimodal alignments with ssTEM datasets. Panels A and B are bright-field images and C and D are contrast-stretched Laplacian filtered images that enhance discontinuities and clearly show alignment defects. The circle in image D represents a lysosome of approximately 200 nm diameter. Its contrast is better preserved in the ir-translate and ir-grid-refine mosaic. Scale = 20 µm.

form management method (see Visualization and Annota-tion below) allows the volume to be partitioned at any point and structures tracked across the parts. We can define break points and reference slices anywhere in the volume and rapidly create new series of transforms. This method is ideal for automated registration.
Computational Molecular Phenotyping CMP is a thin-section optical method that provides mo-lecular signals for classification of cells and large proc-esses. Ultrathin sections are immunoprobed for different
small molecules, imaged optically, registered by ir-tools, and visualized as multi-channel molecular signatures of different cell types. A tuto-rial on CMP is provided in the Supplementary Material. All cells have small molecule signatures and these are most evident in the central nervous system [57,58] and retina [5,27,54,59] . A library of 4-8 small molecules can seg-ment retinal populations into 20 or more natural molecular cell classes [5,55]. CMP can also segment many cell proc-esses into different functional classes with high fidelity [17,56]. Figure 12 displays a retinal microneuroma ssTEM (Fig 12A), its bounding CMP ssLM images as multispectral overlays (Fig. 12B,C), and its corresponding theme map after K-means classification with CMPView (Fig. 12D). The four 90 nm sections preced-ing the ssTEM set were proc-essed for CMP using IgGs targeting glutamate (IgG E), glycine (IgG G), taurine (IgG τ), and GABA (IgG γ) and aligned with the initial ssTEM image with ir-tweak. After classification with these four signatures alone, we show that there are four super-classes of ACs (γ1, γ2, G1, G2), two BC superclasses (Eτ, EτG), two GC superclasses (E, Eγ), the glial Müller cell class (τQ) and the retinal pig-mented epithelium class, similar to results in normal
mouse, primate and rabbit retinas. One critical feature of such theme maps is completeness: every cell in the TEM mosaic is classified into a known biological group and every process traced from it is similarly tagged. No other method has yet achieved this scale of functional cover-age.
On a larger scale, a 0.75 mm wide sample of the mouse inner plexiform layer was mosaicked and augmented with CMP at sufficient resolution to identify many syn-apses directly (Fig. 13). An example of the value of CMP
Anderson et al. A Framework for Ultrastructural Mapping PLoS Biology
10
Figure 8. Registering ssTEM image tiles with ir-tweak. The entire image represents two windows of the ir-tweak interface. The top window shows two serial sections from a manual film capture with tiles in different orientations (arrows), the left being the fixed and the right the moving or warped image. Successive control points (dots) entered on the fixed image by the user are predic-tively placed on the moving image based on the model calculated from all previous points, with a thin-plate spline strategy for accommodating local warps. The bottom panel shows the superim-posed fixed (blue) and warped (orange) in real-time.

signatures in defining circuits is shown in Fig. 13B, where an ON cone BC [59,60] is presynaptic to a class γ1 AC process, which also makes a reciprocal synapse back onto the bipolar cell. This is an archetypal feedback motif (see Fig. 10), one of the most common in retina [17]. In addition a G1 glycinergic AC process is pre-synaptic to the BC. This illustrates the powerful segmen-tation possible with ssLM CMP, even at the ultrastructural scale, enabled by ir-tweak. But why isn’t simply sam-pling random examples sufficient? As shown by Marc and Liu [17], one of the most common motifs in retinal signaling is the nested feedback synapse, yet its full to-pology is rarely observed without ssTEM reconstruction.
Visualization and Annotation. Individual TEM mosaics can be many gigabytes in size, while final ssTEM volumes can be multiple terabytes. This requires tools optimized for viewing large datasets. A single section can easily exceed the 32-bit limit (64K x 64K pixels) of most contemporary image file formats.
Even if we exported full resolution mosaics to an image file for use with conventional imaging tools, each 8-bit grayscale 1000-tile mo-saic would require 16GB of mem-ory. This is not yet common on desktop computers. To enable real-time viewing of the completed mosaics we used the established technique (e.g. Google Earth) of constructing an image pyramid for each tile and transforming them with the graphical processing unit. Only tiles visible on the screen are loaded and displayed at the needed resolution (Fig. 14). This makes the viewer memory foot-p r i n t e s s e n t i a l l y v o l u m e -independent, providing several advantages. (1) Tile versions en-hanced for contrast (ir-clahe), fea-tures (ir-blob), or any other proc-essing can be substituted in real time by pointing the viewer at a different pyramid and using the same transforms. (2) Different transformations can be substituted to view results at each pipeline stage. (3) Reduced memory and bandwidth requirements of the pyramid-GPU approach make it possible for viewers to work over an HTTP connection. This is an important feature for collaborative annotation since the terabyte scale of the completed volume makes it difficult to relocate. (4) The trans-
formations between volume and sections are known. Annotation loci can be moved from volume space back to section space for persistent storage, allowing one to update transforms or even reorder sections in the volume without losing the locations of established annotations.
MosaicBuilder is our completed Mac OSX viewer for viewing single sections and was our first visualization/annotation tool. MosaicBuilder imports the images files and transformation definitions generated by the ir-tools and then creates a single project file containing the im-age pyramid for the section and any annotations. A sin-gle logical file allows the final mosaic to be easily moved and shared among colleagues.
Viking is our web based volume viewer which allows the viewing of volumes over a reasonably fast internet con-nection. It uses the same image pyramid display strategy as Mosaic Builder, but instead of importing files into a single package, Viking reads an XML file containing
Anderson et al. A Framework for Ultrastructural Mapping PLoS Biology
11
Figure 9. A QuickTime ® movie of a volume slice through a mouse retinal microneuroma.
The microneuroma is 27 µm long and 16 µm wide at mid-length. The volume slice spans 45 sections, 90 nm each for a thickness of 4 µm. The original data were scanned from manually acquired TEM film images, aligned using ir-stos tools, and converted to a smaller movie using ir-stom (slice-to-movie) which generates 90 frames. Each slice is cropped such that only pixels with valid mapping onto every slice in the volume are kept. The raw serial image output from ir-stom was imported into QuickTime Pro v7 and saved as a movie. Link.

Anderson et al. A Framework for Ultrastructural Mapping PLoS Biology
12
Figure 11. Automatic registration of canonical scale mosaics. The left two columns are six 1000+ tile mosaics from a series of over 120 horizontal plane 70 nm sections of the rabbit inner nuclear layer (sections 1, 20, 40, 61, 80, 103) spanning over 9 µm. Each mosa-ics is 250 µm wide. The middle column shows mosaics 20, 40, 61, 80, 103 with a colored overlay of the tile adjustment mesh (the true subtile mesh is much finer). The high contrast version of the mosaic 20 mesh shows that the bounding and bisecting lines show only slight deviations from linearity due to slice-to-slice distortions. However, these do not accumulate. The arrow indicates a patch of the
true mesh density. The right column (53 μm wide) is a magnified region of each slice showing the excellent cell-to-cell and subcellular alignment achieved by purely automatic image registration with ir-tools.

HTTP links to all transforms and image files. Viking uses the slice-to-slice transforms (ir-stos-grid) to register all slices to a single reference section. The user can display any section in register with the volume and can easily page to adjacent sections to track structures. Viking also supports switching to view any grid transformation gen-erated by the pipeline or alternate image pyramids gen-erated by running image filters over the tiles.
ScriptingAs tools for the framework were developed, we were faced with the option to blend the tools into a single integrated application with a rich user interface or pre-serve each algorithm as a separate executable in a library of tools. We chose the latter as it is more flexible for code refinement and enhancement. However, by scripting each stage of the pipeline as a separate function in a Python package, we can invoke them with additional short scripts, automating pipeline execution. This allows building the entire volume starting from raw microscope output using a single command. Data can be driven from any source into any stage of the volume building process via addition of a new function. The current scripting ap-proach for building volumes does have a higher barrier to entry for new users compared to a single application. Though Python is not nearly as technical as the C++ en-vironment used to create the ir-tools, changing the pipe-line (e.g. adding support for a new microscope platform) does require some programming skill. The ir-tools have eliminated the most difficult technical challenges to vol-ume construction, but the current state of the technology still mandates support from skilled programming person-nel for the computational side of the reconstruction effort to be successful.
Framework Parameters. Though sectioning and staining a 400+ section dataset is in itself a tour-de-force, it is well within the abilities of many ultrastructural laboratories and can be done in a few work days. And while even manual EM capture can take much longer than section-ing, multiplexing the task across several TEMs and opera-tors also makes the task of acquiring ssTEM data practi-cal. The image processing step has always been the real “show-stopper” when large scale ssTEM projects were conceived. Table 3 summarizes the canonical field, cap-ture, and image processing parameters and timelines for a concrete project: a CN map of the rabbit retinal inner plexiform layer. This project specifies a resolution of 2.18 nm/pixel, which is sufficient to identify conventional/ribbon synapses and moderate scale gap junctions. In broad terms, an optimal canonical volume can be cap-tured in about 3-5 months with a complete volume build on a single machine.
Discussion
Anderson et al. A Framework for Ultrastructural Mapping PLoS Biology
13
Figure 12. Fusion of ssLM CMP and ssTEM data. The mouse retinal microneuroma data shown in previous figures are comprised of the initial section in the ssTEM set (A), a set of four bounding 90 nm ssLM sections visualized by IgG γ, IgG
G, IgG E and IgG τ, all registered by ir-tweak, mapped as γGE :: rgb (B) and γτE :: rgb (C) triplets, converted by cluster analy-sis in CMPView into a classified theme map of 9 discrete superclasses (see text).

Anderson et al. A Framework for Ultrastructural Mapping PLoS Biology
14
Figure 13. Fusion of ssLM CMP and ssTEM data at the synaptic scale. A. A 20 µm wide strip from a 750 µm wide mouse retinal dataset of the inner plexiform layer extending from the AC layer (top) to the GC layer (bottom). The color map is a γGτ :: rgb mapping visualized as a
transparency overlay onto the TEM data. Scale 10 µm. B. The synaptic terminal of an ON cone BC (as identified by its signature and the region of the inner plexiform layer from which it was sampled, outlined in Panel A). Four synapses are marked by arrows. The shaft of each arrow originates in the presynaptic process and the arrowhead lie in the target process. The BC is presynaptic to two profiles at a
ribbon synapse (r) and postsynaptic to profiles γ1 and G1. C. The ssLM CMP overlay, showing the characteristic blue τ+ signature of BCs, two different red GABAergic profiles (γ1 and γ2), and the green glycinergic profile (G1). D. Enlargement of the classic BC ↔ AC GABAer-gic reciprocal feedback synapse. Scale 1 µm for both B and C, and 400 nm for D.

Our ultrastructural mapping framework removes three major barriers to large scale ssTEM reconstruction: mo-saicking, registration and viewing. While mathematically robust tools have long existed for analyst-guided nonlin-ear mosaicking and registration (e.g. PCI Geomatica ®); see Marc and Cameron [27]), and many solid efforts have been made to provide small-volume tools [19], the scale of ssTEM canonical volume reconstruction precludes a user-guided software solution. The ability of ir-fft / ir-grid-refine to automatically mosaic individual tiles and ir-stos-brute / ir-stos-grid to automatically register mosaics means that we have enabled any laboratory to build high-performance ssTEM volumes. Since scanned film imagery can be readily managed, we have also enabled volume construction and exploration of legacy datasets. Many extremely high quality ssTEM datasets have been produced in the past three decades [40,61,62,63,64,65] but their analyses have been restricted to one-time man-ual tabulations, drawings and representative halftone imagery. Arguably, a key advance for anatomy would be the ability to allow global primary data access, similar to gene accessions. Our tools provide the framework for such global access via a central repository. And despite the development of early far-sighted reconstruction frameworks [66] and subsequent enhancements, the code, platforms and throughput of those schemata reached neither the performance nor availability required for canonical field reconstructions.
CMP and ssTEM.The importance of molecular classification of neural data cannot be overstated. Without even partial classification, ssTEM reconstructions remain of limited value. This re-mains true even with the ability to nominally identify individual cells by stochastic, multivariate protein ex-pression (Lichtman et al. 2008.) In contrast, small mole-cule CMP allows the categorization of class partners in networks before the network is built from ssTEM. Classi-fication by post-hoc unraveling of connectivity is un-doubtedly the most unwieldy and statistically challenging way to identify synaptic partners.
The retinal CN mapping framework. Our specific objective in developing these tools is retinal CN mapping. We have begun implementation of this process by developing a rabbit retinal preparation with strong image segmentation. As shown previously, [5,60,67] augmenting CMP libraries with the activity marker 1-amino-4-guanidobutane (AGB) generates a nearly complete neuronal classification. These signals are also fully compatible with ssTEM [56]. We have prepared a single retinal preparation with sixteen patches each defined as a canonical field for CN mapping. These patches are being sectioned, stained and captured with an estimated completion date of mid-March 2009. The
Anderson et al. A Framework for Ultrastructural Mapping PLoS Biology
15
Figure 14. Browsing 30 Gigabyte datasets with MosaicBuilder. For this image, 1001 TEM images were captured at 5000x (2.18 nm/pixel) with SerialEM, tiled into a single mosaic dataset by ir-translate and ir-grid-refine, and visualized with MosaicBuilder. The overlap of each image with its neighbors is shown in panel A and the entire seamless image visualized in B. The polygonal region in B is visual-ized in C simply by “zooming” in MosaicBuilder and the classifica-tions obtained in Fig. 11 annotated onto the initial section of the dataset. The rectangles in C are further enlargements that extend to the synaptic level. The ease of use of MosaicBuilder in synaptic markup is shown in the QuickTime ® movie of Supplementary Figure 3.

strategy uses horizontal serial sections (sections in the plane of the retina) beginning from either the AC or GC side of the inner plexiform layer (Fig. 15). Those cellular layers are first classified as CMP bounding layers regis-tered to the ssTEM set of >400 sections, with each sec-tion captured in mosaics of 950-1100 tiles. Upon com-pletion of each volume, it will be available for our own and community browsing and annotation, described as follows.
A proposal for multi-TEM projects.Most of the example ssTEM volumes our group has pro-duced so far have been collected with a single high-performance microscope. We can capture 3000 tiles/day. However, the install base of manual TEM systems or film-based systems with montaging stages far exceeds those with high-resolution digital cameras. Further, the performance of film is still superior to any digital system and the potential for capturing high bit-depth scanned images manually augmented with positional metadata makes our ultrastructural framework even more practical. By fragmenting large projects into packets of grids that can be captured in parallel, it is possible to speed tile acquisition multiplicatively and then distribute tiles to a central resource for volume builds.
The next phase of CN mapping is analysis: building a description of connectivity by tagging cells and processes and marking synapses. Our goal is not to render 3D
ultrastructural images, but rather tabulate connections within the volume. While it is plausible to develop automated synapse and gap junction recognition tools (perhaps augmented by molecular probes), those tools are in early development stages. Our experience is that analysts can perform excellent tagging and synapse markup with these tools. Furthermore, large datasets can be analyzed in parallel by large groups. A wonderful example of this is the www.galaxyzoo.org project to classify millions of galaxies imaged by various platforms such as the Sloan Digital Sky Survey (www.sdss.org). Given the importance of mammalian CNS circuitry analysis in neurological disorders, the notion of a single lab performing cradle-to-grave processing on a system is increasingly impractical, as is the notion that computa-tional pattern recognition can adequately screen data without missing important observations. Human eyes remain the best pattern recognition systems for ssTEM data. The value of our strategy to develop a scalable, web-compliant viewer for community markup lies in the fact that new, powerful acquisition platforms [23,24,25] and their descendants will soon create an additional deluge of high-quality data.
Future Developments.Our next phases of development target six areas. (1) Auto-tracking: Computational techniques for segmenting and tracing individual neurons across a large number of ssTEM sections [68,69] are critical to speed network data
Anderson et al. A Framework for Ultrastructural Mapping PLoS Biology
16
Figure 15. The Retinal CN mapping framework. Canonical fields of rabbit retina are being sectioned from the GC to the AC layers at 70 nm and tiled mosaics acquired for volume assembly. Bounding the ssTEM set are classified sets of GCs (top) and ACs (bottom) whose
processes enter the field and can be tagged and tracked. The GC patch is shown as a theme map and the AC patch as a γ.AGB.E :: rgb mapped image. At 5000x it is possible to unambiguously identify both conventional and ribbon synapses as well as most gap junctions that exceed ≈ 200 nm in lateral extent. As CMP can be performed on sections as thin as 40 nm, selected molecular signals can be inter-calated into ssTEM sets without significant disruption of volume builds by saving spaced sections for CMP, using them if needed, or reinserting them as ssTEM elements if not.

collection. (2) Auto-markup: We are exploring a large library of identified synapses to train automate synapse markup and implement logical rules for synapse identifi-cation and signal polarity. These efforts will not replace human tracking and markup in the short term, but needn’t be extremely efficient to accelerate analysis several-fold. (3) Enhanced pipeline speed: Even though we can speed mosaic and volume builds by using more machines, we still seek to vastly improve tool speed to accommodate larger canonical volumes. For example, a canonical volume in primary visual cortex spanning an ocular dominance column is several times larger than the retinal canonical volume. (4) Simplified pipeline integra-tion: Our efforts to develop acquisition, classification, mosaicking, registration, browsing and markup tools have originated with several developers using different platforms. How much multi-platform development is justified? Certainly we argue for an open, platform neu-tral code base for future development. However, data transport across platforms is now so simple that it is not essential to spend development resources in replicating applications. Rather, improved pipeline scripts and inter-faces will be our short-term focus. (5) Volume viewing with http compliance: We are creating a volume slice-by-slice viewer that enhances the speed of synapse tagging for building CN maps. While not essential to our frame-work, it offers the ability to lever current web protocols to facilitate community markup. (6) Enhanced CMP power: We are screening libraries of macromolecules (e.g. Marc et al. [70]; Micheva and Smith [7]) for ssTEM-compliance to augment our CMP library.
Finally, the informatics challenges deserve mention. We are hardly alone in this venture. Many groups have addressed the informatics of neuroscience data collections, especially the need to aggregate resources, e.g the Neuroscience Information Framework (http://nif.nih.gov), soon to be trans-ferred to the supervision of the the National Center for Microscopy and Imaging Research at the U n ive r s i t y o f C a l i f o r n i a a t S a n D i e g o (http://www-ncmir.ucsd.edu/), and the International Neu ro in fo rma t i c s Coo rd ina t i ng Fac i l i t y (http://incf.org). However, a key issue is a lack of multiresolution annotation tools and task admini-stration for large-scale distributed, multiresolution datasets. Though large scale navigational tools have been built by the Allen Institute for Brain Science (http://www.brain-map.org/) and Brain Maps devel-oped by Ed Jones and colleagues at Univ California Davis (http://brainmaps.org/), robust tools for com-munity markup that can navigate high resolution TEM datasets have yet to be created or validated. Ontologies for neural systems are under rapid de-v e l o p m e n t (http://ccdb.ucsd.edu/CCDBWebSite/sao.html), which will be essential to building these markup
tools. These and other groundbreaking efforts validate the need for next-generation software including rapid naviga-tion of fused TEM-multivariate molecular data, true volumetric atlases, graph-theory based analyses and dy-namic ontology updating.
SummaryHigh-performance ssTEM is a powerful technology cou-pled to traditionally artisanal data presentation and analysis methods. These are poorly adapted to large-scale collaborations or high-throughput screening. Many labo-ratories have attempted to develop stronger tools for ssTEM throughput, but most efforts were hampered by many barriers: code that did not scale, limited processor speed, expensive storage, and small canonical volumes. Our framework largely overcomes all computational barriers, providing highly standardized collaborative environments that enable ssTEM to serve as both a statis-tically practical CN mapping tool and an effective screening / phenotyping tool for modern neurogenetics.
Materials and MethodsTissue harvest, processing and sectioning. All animal use including methods for anesthesia and euthanasia conformed to institutional animal care and use authorizations at the University of Utah and to the Association for Research in Vision and Ophthalmology Statement for the Use of Animals in Ophthalmic and Visual Research. Retinal samples were taken from Dutch Belted rabbits (Oregon Rabbitry, OR), C57Bl/6J mice (The
Anderson et al. A Framework for Ultrastructural Mapping PLoS Biology
17
Table 3: Parameters & Timeline for CN Mapping a Canonical Field in the Rabbit Retina
Parameter / Operation ValueIdeal field diameter 250 µmOptimal section thickness 70 nmStack thickess 0.035 mm (GCL - IPL - ACL)Stack sections 400TEM magnification 5000x, 2.18 nm/pixel TEM tile size 8.7 x 8.7 μmTiles / mosaic 900-1000 (15% overlap)mosaic acquisition time 7 hvolume acquisition time 133 d volume build time 33 d high BC, AC, GC, dAC sample ≈ 1600 BCs, 800 ACs, 200 GCs, 100 dACslow BC, AC, GC, dAC sample ≈ 400 BCs, 200 ACs, 50 GCs, 25 dACsestimated high: low synapses 72,000 : 18,000high class 6 / class 9 numbers 30 : 3low class 6 / class 9 numbers 7 : 1
Key: GCL ganglion cell layer, IPL inner plexiform layer, ACL amacrine cell layer, BC bipolar cell, AC amacrine cell, GC gan-glion cell, dAC displaced amacrine cell. Class 6 GCs are the most abundant class and Class 9 GCs the rarest.

Jackson Laboratories, Bar Harbor, ME) and TG9N trans-genic mice that have an aggressive photoreceptor degen-eration and neural remodeling defect (Jones et al. 2003). Light-adapted adult male and female pigmented rabbits tranquilized with intramuscular ketamine/xylazine were deeply anesthetized with intraperitoneal urethane in saline, euthanized by thoracotomy in accord with University of Utah Institutional Animal Care and Use Committee guidelines, and the eyes immediately injected with 0.1 ml fixative and an additional 18 Ga needle pressure relief. Rabbit eyes were enucleated, hemisected, and fixed in 1% formaldehyde, 2.5% glutaraldehyde, 3% sucrose, 1 mM MgSO4, in 0.1 M phosphate or cacodyl-ate buffer, pH 7.4. Light-adapted mice were rapidly euthanized with halothane or an isoflurane vaporizer. Mouse eyes were slit at the limbus and injected slowly with 0.1 ml fixative before enucleation and immersion fixation for 24h. All tissues were osmicated 45-60 min in 0.5-1% OsO4 in 0.1M cacodylate buffer, processed in maleate buffer for en bloc staining with uranyl acetate, and processed for resin embedding as described in Marc and Liu [17]. Specifically for CN maps, flat resin mounts of retina are remounted for serial sections in the horizon-tal plane through the inner plexiform layer [27,71]. Verti-cal sections of mouse retina were used to define normal C57Bl6/j and disordered TG9N mouse retinal circuitries. Serial sections were cut at 60-90 nm with various models of Leica ultramicrotomes onto carbon-coated Formvar® films on gold slot grids and imaged at 80 KeV in either a Hitachi H-600 or JEOL JEM 1400 electron microscope at 5,000-10,000x magnification. Images were captured directly on film (Kodak 4489 Electron Microscope Film) and digitized at 16 bits greyscale on Ultramax or Creoscitex scanners, or captured digitally on a GATAN Ultrascan 4000 16 megapixel 16-bit camera.
Image Capture.Creating the CN map of the retina requires digitizing each tissue section and registering it to its neighbors. Creating a volume of this scale is a significant undertak-ing: The CN map for the rabbit inner plexiform layer in the visual streak requires a volume delimited by a ca-nonical field 250 µm in diameter x 30 µm high: roughly 1.47 x 106 µm3. A cylindrical volume is a more efficient capture object than rhomboidal prisms which will have extremities clipped out as sections are rotated during registration. While the issue is irrelevant at small volumes [18], it tremendously impacts beam time at canonical scales. In practice, at a magnification of 5000x on the JEOL JEM-1400, we capture 950-1100 images or tiles/section and ≈ 333 sections at 90 nm thickness. Storage of unprocessed 16-bit images requires 10.4 terabytes. With a time of capture at roughly 30 s/frame, this requires some 70-100 calendar days on a single TEM, which ar-gues for automated capture scripts and efficient capture geometries. To ensure the images can be positioned
properly in the total mosaic, each image has 15% area overlap with its neighbors. With some of the software tools developed below, it is also evident that such tasks can be parallelized across microscopes and users.
We capture ssTEM data using SerialEM software devel-oped by D. Mastronarde at the University of Colorado at Boulder [72]. Though originally developed for TEM to-mography, SerialEM is ideal for large-scale mosaicking. The most recent build version of SerialEM allows defini-tion of multiple circular or polygonal regions of interest on a grid and automates stage drive and image capture within the regions of interest on the JEOL JEM 1400 TEM (and other recent TEMs as well such as FEI Tecnais) and, critically, stores stage position metadata for each tile. This greatly reduces the computational cost of the initial posi-tioning of mosaic tiles from O(n2) to O(n). The program includes a scripting capability that provides the flexibility needed to optimize the acquisition strategy, for example, by focusing only on an appropriately spaced subset of the image tiles. While automated capture is ideal for the microscope's Gatan Ultrascan 4000 (4K x 4K) camera, it can also serve on a smaller scale with film capture.
Mosaicking.We use the same software suite (ir-tools) to mosaic ssLM and ssTEM data. In an ideal setting, we have stage posi-tion metadata for both kinds of datasets (from Syncroscan and SerialEM), which can be used by ir-translate to pro-duce precise initial image mosaics. This is then followed by ir-refine grid to correct for image aberrations in each tile. However, some users may lack capture automation. In this more general case, an operator manually adjusts the position of each tile, aiming for a specified but often imprecise overlap between tiles. Even approximate coor-dinate information is often not recorded. Given a large number of tiles specified in no particular order, a mosaic must be constructed and individual tiles corrected for distortions, especially subtle electron-optical aberrations (spherical aberrations, magnification astigmatism, local heating motions, charging motions, etc.) that are often undetectable until precise alignment is attempted (Fig. 4). It is rare that the magnification in the average TEM is exactly the same at the field center and edge. At a mod-est magnification yielding a 7.5 µm wide field (about 5000x), a 1% error in magnification at the edge of the field (4950x) yields a displacement of over 3 vesicles: potentially a massive misalignment in tracing circuits. A mosaicking scheme that addresses this general problem is ir-fft followed by ir-refine-grid.
Image registration and volume construction.Slice-to-slice image registration is further complicated by differences in imaging modalities (ssLM vs ssTEM), changing shapes of cells and processes, and physical distortions affecting individual sections (folds, stretching). At the boundaries of or intercalated within the ssTEM
Anderson et al. A Framework for Ultrastructural Mapping PLoS Biology
18

volume, we collect ssLM data for CMP analysis. Similar to the multimodal alignment strategies used by Marc and colleagues [5,56], ssLM images are operator-registered to adjacent ssTEM slices using ir-tweak. However, manually registering large ssTEM volumes is impractical and auto-mated slice-to-slice tools are needed: (ir-stos-brute, ir-stos-grid).
CMP and classification.CMP is a method to extract quantitative molecular signa-tures from cells or even cellular processes [5,54] and fuse molecular signature data with ssTEM datasets [17,56]. ssLM samples (40-90 nm) are arrayed on 12-spot Teflon®-coated slides (Cel-Line; Erie Scientific Inc), fully sodium ethoxide etched, probed with IgGs targeting various molecules, and visualized with silver-intensified 1.4 nm gold granules conjugated to goat anti-rabbit or goat anti-mouse IgG (Nanoprobes, Yaphank, NY). Immu-noreactivity in these samples is a pure surface phenome-non independent of section thickness [54]. The IgG li-brary includes (but is not limited to) anti-L-aspartate [IgG D], anti-L-glutamate [IgG E], anti-glycine [IgG G], anti-L-glutamine [IgG Q], anti-taurine [IgG τ], and anti-GABA [IgG γ] (Signature Immunologics Inc, Salt Lake City, UT). All data were captured as 8-bit 1388 pixel x 1036 line frames under voltage regulated tungsten halogen flux with a variation of 1.2 ± 0.6%/min (mean ± sd). Image mosaic tiles were captured with a Peltier-cooled QImag-ing Fast 1394 QICAM (QImaging, Burnaby, BC, Canada) and a Syncroscan montaging system (Synoptics Inc, Fre-derick, MD) on a Scan 100x100 stage (Märzhäuser Wetzlar GMBH & Co, Germany). ssLM mosaics were prepared using various ir-tools and aligned using ir-tweak (see below). CMP classification (clustering, histogram analysis, PCA, etc.) is performed on the CMP dataset using CMPView (© James Anderson 2008) to phenotype processes and cells. CMPview is built in MATLAB2008a. Clustering is based on the robust K-means and isodata algorithms (see Marc et al. [5,54]), augmented with in-teractive histogram splitting tools. CMPView operates on either pixel-based or object-based images. The interme-diate product of relevance for this paper is the produc-tion of a high-resolution theme map of cell classes that is then registered to ssTEM data [17,56]. Finally, image analysis for characterization of mosaicking and registra-tion performance was performed using ImageJ [73].
Image Browsing and Annotation.Once large mosaics are built, it is essential to have tools to browse, annotate and record annotations. Some mosa-ics are 15-30 gigabyte datasets, which are unmanageable by most commercial imaging tools. We have developed two applications, MosaicBuilder (Mac OS X) and Viking (Win) , that allow a single slices to be viewed, browsed and annotated. By using image pyramids, these tools quickly navigates between low and high magnification views. Volumes are even more challenging, as they ex-
pand into terabyte size and Viking allows rapid paging through the build over an HTTP connection, enabling single image repositories to serve multiple users.
Managing the processing pipeline.This twelve stage framework requires significant user management and exceptional digital hygiene in data archiving, access and revision control. Since each com-putational stage invokes a different program and occa-sional transitions between data formats we elected to use the Python scripting language and Python Imaging Li-brary to bridge stages. The scripts perform tasks such as conversion from microscope-specific formats to the plain text “.mosaic” format of ir-tools, image cropping, contrast enhancement, down-sampling and launching multiple instances of single-threaded algorithms to ensure each CPU core is fully utilized. Pipeline automation improves throughput, eases integration, produces consistent re-sults, and stabilizes performance.
FundingNEI R01 EY02576, R01 EY015128, P01 EY014800 (REM); support from the Cal and JeNeal Hatch Presiden-tial Endowed Chair (REM); an unrestricted grant from Research to Prevent Blindness to the Moran Eye Center; a Research to Prevent Blindness Career Development Award (BWJ); NIBIB EB005832 (TT). Tolga Tasdizen would like to acknowledge the support of the Utah Sci-ence Technology and Research Initiative (USTAR). D. Mastronarde’s work was supported by Grant Number P41RR00592 to A. H. Hoenger from the National Center for Research Resources (NCRR), a component of the Na-tional Institutes of Health (NIH). This paper's contents are solely the responsibility of the authors and do not neces-sarily represent the official view of NCRR or NIH. The funders had no role in study design, data collection and analysis, decision to publish, or preparation of the manuscript.
Author RolesAnderson: 1° Author, CMP, ssTEM, imaging, code devel-opment, pipeline development; Jones: 2° Author, CMP, ssTEM, imaging; Yang: 3° Author, CMP, ssTEM; Shaw: 3° Author, CMP, imaging; Watt: 2° Author, CMP, ssTEM, imaging; Koshevoy: 3° Author, code development, pipe-line development; Spaltenstein: 2° Author, code devel-opment, pipeline development; Jurrus: 3° Author, code development; Kannan: 3° Author, code development; Tasdizen: 1° Author, code development, pipeline devel-opment; Whitaker: 3° Author, code development, pipe-line development; Mastronarde: 2° Author, ssTEM, code development, pipeline development; Marc: 1° Author, CMP, ssTEM, imaging, code development
Anderson et al. A Framework for Ultrastructural Mapping PLoS Biology
19

Definitions. 1° Authors generated primary manuscript; 2° Authors generated manuscript sections and contributed substantial revisions; 3° Authors generated area-specific manuscript revisions; CMP: computational molecular phenotyping - sample array probing, visualization, cap-ture; ssTEM: serial section TEM - ultrathin section arrays, TEM imaging; imaging: ssLM (serial section LM) capture, image mosaicking, registration and markup; code devel-opment: primary code for CMP, mosaicking, registration, browsing, markup; pipeline development: code / scripts for interoperability and automation.
References 1. Sporns O, Tononi G, Kötter R (2005) The Human Con-nectome: A structural description of the human brain. PLoS Computational Biology 1: e42.
2. Lichtman JW, Livet J, Sanes JR (2008) A technicolour approach to the connectome. Nat Rev Neurosci 9: 417-422.
3. MacNeil MA, Heussy JK, Dacheux RF, Raviola E, Ma-sland RH (1999) The shapes and numbers of amacrine cells: matching of photofilled with Golgi-stained cells in the rabbit retina and comparison with other mammalian species. J Comp Neurol 413: 305-326.
4. MacNeil MA, Heussy JK, Dacheux RF, Raviola E, Ma-sland RH (2004) The population of bipolar cells in the rabbit retina. J Comp Neurol 472: 73-86.
5. Marc RE, Jones BW (2002) Molecular phenotyping of retinal ganglion cells. J Neurosci 22: 413-427.
6. Otsuna H, Ito K (2006) Systematic analysis of the vis-ual projection neurons of Drosophila melanogaster - I: Lobula-specific pathways. J Comp Neurol 497: 928-958.
7. Micheva KD, Smith SJ (2007) Array tomography: A new tool for imaging the molecular architecture and ul-trastructure of neural circuits. Neuron 55: 25-36.
8. Vaney DI (1990) The mosaic of amacrine cells in the mammalian retina. Progress in retinal research. New York: Pergamon. pp. 49–100.
9. Peters A, Cifuentes JM, Sethares C (1997) The organi-zation of pyramidal cells in area 18 of the rhesus mon-key. Cereb Cortex 7: 405-421.
10. Lund JS, Angelucci A, Bressloff PC (2003) Anatomical substrates for functional columns in macaque monkey primary visual cortex. Cereb Cortex 13: 15-24.
11. Reese B (2008) Mosaics, tiling and coverage by reti-nal neurons. In: Masland RH, Albright T, editors. The Senses: A comprehensive reference Vision. Amsterdam: Elsevier. pp. 439-456.
12. Kolb H, Famiglietti EVJ (1974) Rod and cone path-ways in the retina of the cat. Invest Ophthal 15: 935-946.
13. Calkins DJ, Sterling P (1996) Absence of spectrally specific lateral inputs to midget ganglion cells in primate retina. Nature 381: 613-615.
14. Klug K, Herr S, Ngo IT, Sterling P, Schein S (2003) Macaque retina contains an S-cone OFF midget pathway. J Neurosci 23: 9881-9887.
15. Crawley JN (2008) Behavioral phenotyping strategies for mutant mice. Neuron 57: 809-818.
16. Marc RE, Jones BW, Watt CB, Strettoi E (2003) Neural remodeling in retinal degeneration. Prog Ret Eye Res 22: 607-655.
17. Marc RE, Liu W (2000) Fundamental GABAergic amacrine cell circuitries in the retina: nested feedback, concatenated inhibition, and axosomatic synapses. J Comp Neurol 425: 560-582.
18. Fiala JC, Harris KM (2001) Extending unbiased stere-ology of brain ultrastructure to three-dimensional vol-umes. J Am Med Inform Assoc 8: 1-16.
19. Fiala JC (2005) Reconstruct: a free editor for serial section microscopy. J Microscopy 218: 52-61.
20. Fiala JC (2002) Three-dimensional structure of syn-apses in the brain and on the web 2002 World Congress on Computational Intelligence. May 12-17, Honolulu, Hawaii.
21. Harris KM, Perry E, Bourne J, Feinberg M, Ostroff L, et al. (2006) Uniform serial sectioning for transmission electron microscopy. J Neurosci 26: 12101-12103.
22. Denk W, Horstmann H (2004) Serial block-face scanning electron microscopy to reconstruct three-dimensional tissue nanostructure. PLoS Biol 2: e329.
23. Briggman KL, Denk W (2006) Towards neural circuit reconstruction with volume electron microscopy tech-niques. Current Opinion in Neurobiology 16: 562-570.
24. Hayworth KJ, Kasthuri N, Schalek R, Lichtman JW (2006) Automating the collection of ultrathin serial sec-tions for large volume TEM reconstructions. Microscopy and Microanalysis 12: 86-87.
25. Knott G, Marchman H, Wall D, Lich B (2008) Serial section scanning electron microscopy of adult brain tis-sue using focused ion beam milling. J Neurosci 28: 2959-2964.
26. Chklovskii DB, Mel BW, Svoboda K (2004) Cortical rewiring and information storage. Nature 431: 782-788.
27. Marc RE, Cameron DA (2002) A molecular pheno-type atlas of the zebrafish retina. J Neurocytol 30: 593-654.
28. Masland RH (2001) Neuronal diversity in the retina. Curr Opinion Neurobiol 11: 431-436.
29. Sterling P (2004) How retinal circuits optimize the transfer of visual information. In: Chalupa LM, Werner J, editors. The visual neurosciences. Cambridge: MIT Press. pp. 234–259.
Anderson et al. A Framework for Ultrastructural Mapping PLoS Biology
20

30. Miller RF, Bloomfield SA (1983) Electroanatomy of a unique amacrine cell in the rabbit retina. Proc Natl Acad Sci USA 80: 3069-3073.
31. Rall W (1995) The Theoretical Foundation of Den-dritic Function: Selected Papers of Wilfred Rall with Commentaries.; Segev I. RJ, Shepherd G.M., editor. Cambridge, MA: The MIT Press.
32. Weiss TF (1996) Cellular Biophysics: Electrical Prop-erties. Cambridge, MA: The MIT Press.
33. Rockhill RL, Daly FJ, MacNeil MA, Brown SP, Ma-sland RH (2002) The diversity of ganglion cells in a mammalian retina. J Neurosci 22: 3831–3843.
34. Berson DM (2008) Retinal ganglion cell types and their central projections. In: Masland RH, Albright T, edi-tors. The Senses: A comprehensive reference Vision. Am-sterdam: Elsevier. pp. 491-519.
35. Muller F, Wassle H, Voigt T (1988) Pharmacological modulation of the rod pathway in the cat retina. J Neuro-physiol 59: 1657-1672.
36. Deans MR, Volgyi B, Goodenough DA, Bloomfield SA, Paul DL (2002) Connexin36 is essential for transmis-sion of rod-mediated visual signals in the mammalian retina. Neuron 36: 703-712.
37. Marc RE, Liu WL (1985) (3H) glycine-accumulating neurons of the human retina. Journal of Comparative Neurology 232: 241-260.
38. Sterling P, Lampson LA (1986) Molecular specificity of defined types of amacrine synapse in cat retina. J Neu-rosci 6: 1314-1324.
39. Marc RE (1989) The role of glycine in the mammalian retina. In: Osborne N, Chader G, editors. Progress in Retinal Research. London: Pergamon Press. pp. 67-107.
40. Strettoi E, Raviola E, Dacheux RF (1992) Synaptic connections of the narrow-field, bistratified rod amacrine cell (AII) in the rabbit retina. J Comp Neurol 325: 152-168.
41. Vaney DI (1986) Morphological identification of serotonin-accumulating neurons in the living retina. Sci-ence 233: 444-446.
42. Li W, Zhang J, Massey SC (2002) Coupling pattern of S1 and S2 amacrine cells in the rabbit retina. Visual Neu-roscience 19: 119-131.
43. Soucy E, Wang Y, Nirenberg S, Nathans J, Meister M (1998) A Novel signaling pathway from rod photorecep-tors to ganglion cells in mammalian retina. Neuron 21: 481-493.
44. Tsukamoto Y, Morigiwa K, Ueda M, Sterling P (2001) Microcircuits for night vision in mouse retina. Journal of Neuroscience 21: 8616-8623.
45. Peng Y-W, Hao Y, Petters RM, Wong F (2000) Ectopic synaptogenesis in the mammalian retina caused by rod photoreceptor-specific mutations. Nat Neurosci 3: 1121-1127.
46. Hall DH, Russell RL (1991) The posterior nervous system of the nematode Caenorhabditis elegans: serial reconstruction of identified neurons and complete pat-tern of synaptic interactions. J Neurosci 11: 1-22.
47. Hall DH (1995) Electron microscopy and three-dimensional image reconstruction. Methods Cell Biol 48: 395-436.
48. Altun ZF, Hall DH (2002-2006) WormAtlas. http://www.wormatlas.org.
49. Chen BL, Hall DH, Chklovskii DB (2006) Wiring optimization can relate neuronal structure and function. PNAS 103: 4723-4728.
50. White JG, Southgate E, Thomson JN, Brenner S (1976) The structure of the ventral nerve cord of Caenorhabditis elegans. Philos Trans R Soc Lond B Biol Sci 275: 327-348.
51. Levinthal C, Ware RW (1972) Three-dimensional reconstruction from serial sections. Nature 236: 207-210.
52. Eglen SJ, Raven MA, Tamrazian E, Reese BE (2003) Dopaminergic amacrine cells in the inner nuclear layer and ganglion cell layer comprise a single functional reti-nal mosaic. J Comp Neurol 466: 343-355.
53. Deerinck TJ, Giepmans BN, Smarr BL, Martone ME, Ellisman MH (2007) Light and electron microscopic lo-calization of multiple proteins using quantum dots. Methods Mol Biol 374: 43-53.
54. Marc RE, Murry RF, Basinger SF (1995) Pattern recog-nition of amino acid signatures in retinal neurons. J Neu-rosci 15: 5106-5129.
55. Marc RE (1999) Kainate activation of horizontal, bi-polar, amacrine, and ganglion cells in the rabbit retina. J Comp Neurol 407: 65-76.
56. Jones BW, Watt CB, Frederick JM, Baehr W, Chen CK, et al. (2003) Retinal remodeling triggered by photorecep-tor degenerations. Journal of Comparative Neurology 464: 1-16.
57. Hill E, Kalloniatis M, Tan S-S (2000) Glutamate, GABA and precursor amino acids in adult mouse neocor-tex: Cellular diversity revealed by quantitative immuno-cytochemistry. Cereb Cortex 10: 1132-1142.
58. Hill E, Kalloniatis M, Tan S-S (2001) Cellular diversity in mouse neocortex revealed by multispectral analysis of amino acid immunoreactivity. Cereb Cortex 11: 679-690.
59. Kalloniatis M, Marc RE, Murry RF (1996) Amino acid signatures in the primate retina. J Neurosci 16: 6807-6829.
60. Marc RE (1999) Mapping glutamatergic drive in the vertebrate retina with a channel-permeant organic cat-ion. J Comp Neurol 407: 47-64.
61. Stevens JK, Davis TL, Friedman N, Sterling P (1980) A systematic approach to reconstructing microcircuitry by electron microscopy of serial sections. Brain Res 2: 265-293.
Anderson et al. A Framework for Ultrastructural Mapping PLoS Biology
21

62. Linberg KA, Fisher SK (1986) An ultrastructural study of interplexiform cell synapses in the human retina. J Comp Neurol 243: 561-576.
63. Kolb H, Nelson R (1993) OFF-alpha and OFF-beta ganglion cells in cat retina: II. Neural circuitry as re-vealed by electron microscopy of HRP stains. J Comp Neurol 329: 85-110.
64. Calkins DJ, Sterling P (2007) Microcircuitry for two types of achromatic ganglion cell in primate fovea. J Neurosci 27: 2646-2653.
65. Harris KM, Jensen FE, Tsao B (1997) Three-dimensional structure of dendritic spines and synapses in rat hippocampus (CA1) at postnatal day 15 and adult ages: implications for the maturation of synaptic physiol-ogy and long-term potentiation. J Neurosci 12: 2685-2705.
66. Stevens JK, McGuire BA, Sterling P (1980) Toward a functional architecture of the retina: serial reconstruction of adjacent ganglion cells. Science 207: 317-319.
67. Marc RE, Jones BW, Anderson JR, Kinard K, Marshak DW, et al. (2007) Neural reprogramming in retinal de-generation. Invest Ophthal Vis Sci 48: 3364-3371.
68. Macke JH, Maack N, Gupta R, Denk W, Schölkopf B, et al. (2008) Contour-propagation algorithms for semi-automated reconstruction of neural processes. J Neurosci Methods 167: 349-357.
69. Jurrus E, Hardy M, Tasdizen T, Fletcher PT, Koshevoy P, et al. (2008) Axon tracking in serial block-face scan-ning electron microscopy. Med Image Anal: [Epub ahead of print].
70. Marc RE, Jones BW, Watt CB, Vazquez-Chona F, Vaughan DK, et al. (2008) Extreme retinal remodeling triggered by light damage: implications for age related macular degeneration. Molecular Vision 14: 782-806.
71. Marc RE, Liu WL, Kalloniatis M, Raiguel SF, van Haesendonck E (1990) Patterns of glutamate immunore-activity in the goldfish retina. J Neurosci 10: 4006-4034.
72. Mastronarde DN (2005) Automated electron micro-scope tomography using robust prediction of specimen movements. J Struct Biol 152: 36-51.
73. Rasband WS (2007) ImageJ. Bethesda, Maryland: U. S. National Institutes of Health.
Competing InterestsRobert E. Marc is a principal of Signature Immunologics. All other authors declare no other competing interests.
AbbreviationsAC, amacrine cell; AGB 1-amino-4-guanidobutane; BC, bipolar cell; CMP, computational molecular phenotyp-ing; CN, complete network; D, aspartate; E, glutamate;
en endothelial cell; GC, ganglion cell; G, glycine; γ, GABA; IgGs, immunoglobulins; IgG D, anti-L-aspartate;
IgG E, anti-L-glutamate; IgG G, anti-glycine; IgG Q, anti-L-glutamine; IgG τ, anti-taurine; IgG γ, anti-GABA; L, Linux; M, Mac OS X; mGluR6, type 6 metabotropic glu-tamate receptor; rgb, red, green, blue image mapping; RPE retinal pigmented epithelium; ssLM, serial section light microscopy; ssTEM, serial section transmission elec-
tron microscopy; τ, taurine; TEM, transmission electron microscopy; W, Wintel.
Anderson et al. A Framework for Ultrastructural Mapping PLoS Biology
22