and utilization of agro as energy source in Brazil - Simple …723822/FULLTEXT… · ·...
49
i Characterization and utilization of agro‐ forestry residues as energy source in Brazil MSc. thesis Muhammad Abdul Hayee Department of Chemical Engineering and Technology Division of Chemical Technology KTH Royal Institute of Technology Stockholm Sweden March 2012
Transcript of and utilization of agro as energy source in Brazil - Simple …723822/FULLTEXT… · ·...

i
Characterization and utilization of agro‐forestry residues as energy source in Brazil
MSc. thesis
Muhammad Abdul Hayee
Department of Chemical Engineering and Technology Division of Chemical Technology KTH Royal Institute of Technology
Stockholm Sweden
March 2012

ii
Characterization and utilization of agro‐forestry residues as energy source in Brazil
MSc. thesis Muhammad Abdul Hayee
Supervisor
Rolando Zanzi Vigouroux Department of Chemical Engineering and Technology
Division of Chemical Technology KTH Royal Institute of Technology
Stockholm, Sweden
Examiner
Krister Sjöström
Department of Chemical Engineering and Technology Division of Chemical Technology KTH Royal Institute of Technology
Stockholm, Sweden
March 2012

iii
Abstract:
Brazil is very much rich in agriculture and forestry. The agro industry occupies an area of 28840726 ha. The more important crops are sugarcane (7080920 ha), rice (289030 ha), wheat (1853220 ha), coconut (283205 ha), cassava (1894460 ha), corn (13767400 ha) and grass (140000 ha). These crops generated 597 million tons of residues. Forest plantations in Brazil supplied 102.9 million m3 of industrial roundwood, of which nearly half is for renewable fuelwood and charcoal. Part of this plantation output is destined for the pulp and paper industry:
The renewable sources are fulfilling 46.4% of the total Brazilian energy demands.
Energy forestation in Brazil includes mainly Eucalyptus and Bracatingas.
In this study three biomasses abundant in the Brazil are studied: i.e. Eucalyptus, Garapeira/Peroba (wood dust) and Sewage Sludge.
The wood samples (Eucalyptus and Peroba/Garapeira) have higher heating value than the sewage sludge because the wood samples have higher amounts of carbon and hydrogen than the sewage sludge. The sewage sludge has higher ash content and lower amount of volatiles and fixed carbon than the wood samples resulting in a lower heating value.
The pyrolysis of eucalyptus, garapeira/peroba and sewage sludge has been studied in a thermobalance over a wide range of degradation temperatures. Between 225 °C ‐ 375 °C (for eucalyptus) and 225 °C ‐ 425 °C (for garapeira), the thermal decomposition of the biomass leads to significant weight loss.
The weight loss for Eucalyptus between 265°C and 350°C is 0.48 % / °C and taking into account a heating rate of 10°C/min, the weight loss is 4.8 % /min. Garapeira has a similar behaviour than eucalyptus. The weight loss for garapeira between 265°C and 365°C is 0.4 % / °C and taking into account a heating rate of 10°C/min, the weight loss is 4 % /min.
The behaviour of the sewage sludge to the increase of temperature from 25°C to 700 °C in an inert atmosphere do not show such different zones as the behaviour of the woody biomass. Between 150 °C and 235°C the weight loss of the sewage sludge was 0.07 %/°C (0.7 %/min). The highest weight loss takes place between 300 °C and 390 °C (0.15 %/°C or 1.5 %/min). In the third zone, between 500 °C and 600°C, the weight loss was 0.03 %/°C (0.3 %/min).
The pyrolysis is assumed to be a first order decomposition. The activation energy (E) and the pre exponential factor (A) are calculated for the studied samples.
The proximate analysis shows differences between the woody biomass and the sewage sludge. The sewage sludge has higher ash content and lower fixed carbon and volatiles. Eucalyptus has lower carbon fixed and higher volatiles than peroba‐garapeira.

iv
Table of Contents
1 Introduction: ...................................................................................................................................... 1
1.1 Renewable Energy: ......................................................................................................................... 1
1.2 Background: .................................................................................................................................... 1
2 Biomass: ..................................................................................................................................................... 2
2.1 All about Brazilian potential towards biomass: .................................................................................. 2
Brazil and rest of the world crop production in 2009 ........................................................................... 3
2.1.1 Brazilian Energy Forestation: ....................................................................................................... 5
2.1.2 Brazilian Forestall Species: ........................................................................................................... 5
2.1.3 Sugarcane: .................................................................................................................................... 6
2.1.4 Oleaginous crops: ......................................................................................................................... 7
2.1.5 Vegetable coal: ............................................................................................................................. 8
2.2 Brazil’s National Energy Balance: ........................................................................................................ 9
3 Biomass: ..................................................................................................................................................... 9
3.1.1 Cellulose: .................................................................................................................................... 10
3.1.2 Hemi cellulose: ........................................................................................................................... 10
3.1.3 Lignin: ......................................................................................................................................... 11
3.1.4 Extractives: ................................................................................................................................. 12
3.2 Agricultural Residues Samples: ......................................................................................................... 12
3.2.1 Eucalyptus: ................................................................................................................................. 12
3.2.2 Garapeira: .................................................................................................................................. 12
3.2.3 Sewage Sludge: .......................................................................................................................... 13
3.3 Biomass conversion technologies: .................................................................................................... 14
3.3.1 Thermal conversion: .................................................................................................................. 14
3.3.2 Chemical conversion: ................................................................................................................. 14
3.3.3 Bio chemical conversion: ........................................................................................................... 14
3.3.4 Combustion: ............................................................................................................................... 15
Combustion Basics: ............................................................................................................................. 15
3.3.5 Agriculture Residues Combustion: ............................................................................................. 16
Densification: ...................................................................................................................................... 17

v
Briquetting and pelleting: ................................................................................................................... 17
3.4 Gasification: ...................................................................................................................................... 18
3.4.1 Gasification historical background: ............................................................................................ 18
3.4.2 Gasification Theory: ................................................................................................................... 19
3.4.3 Gasification process: .................................................................................................................. 19
3.4.4 Updraft Gasifier:......................................................................................................................... 22
3.4.5 Downdraft Gasifier: .................................................................................................................... 22
3.4.6 Cross draft gasifier: .................................................................................................................... 23
3.4.7 Fluidized bed Gasifier: ................................................................................................................ 24
3.4.8 Choice of Gasifier: ...................................................................................................................... 25
3.4.9 Synthesis Gas Production: .......................................................................................................... 27
3.5 Pyrolysis: ........................................................................................................................................... 29
3.5.1 Slow Pyrolysis: ............................................................................................................................ 31
3.5.2 Fast Pyrolysis: ............................................................................................................................. 31
4. Experimental ........................................................................................................................................... 32
4.1 Proximate Analysis: ........................................................................................................................... 32
4.1.1 Moisture content: ...................................................................................................................... 32
4.1.2 Fixed Carbon – Volatile Matter: ................................................................................................. 33
4.1.3 Ash Content: .............................................................................................................................. 33
4.2 Thermo gravimetric Analysis (TGA): ................................................................................................. 33
4.3 Calorific value determination: .......................................................................................................... 34
5. Results: .................................................................................................................................................... 35
5.1 Calorific Value: .................................................................................................................................. 35
5.2 Thermogravimetric Analysis: ........................................................................................................... 36
6. Conclusions ............................................................................................................................................. 39
7. References: ..................................................................................................................................... 40

vi
List of Figures
Figure 1: Monthly crude oil prices from 1946 – 2010 ‐‐‐‐‐‐‐‐‐‐‐‐‐‐‐‐‐‐‐‐‐‐‐‐‐‐‐‐‐‐‐‐‐‐‐‐‐‐‐‐‐‐‐‐‐‐‐‐‐‐‐‐‐‐‐‐‐‐‐‐‐‐‐‐‐‐‐ 1 Figure 2: Brazilian crop Production 2008 ‐‐‐‐‐‐‐‐‐‐‐‐‐‐‐‐‐‐‐‐‐‐‐‐‐‐‐‐‐‐‐‐‐‐‐‐‐‐‐‐‐‐‐‐‐‐‐‐‐‐‐‐‐‐‐‐‐‐‐‐‐‐‐‐‐‐‐‐‐‐‐‐‐‐‐‐‐‐‐‐‐‐ 2 Figure 3: Brazilian Planted Area in thousand hectares. ‐‐‐‐‐‐‐‐‐‐‐‐‐‐‐‐‐‐‐‐‐‐‐‐‐‐‐‐‐‐‐‐‐‐‐‐‐‐‐‐‐‐‐‐‐‐‐‐‐‐‐‐‐‐‐‐‐‐‐‐‐‐‐‐‐ 7 Figure 4: Production of vegetable coal in Brazil year wise. ‐‐‐‐‐‐‐‐‐‐‐‐‐‐‐‐‐‐‐‐‐‐‐‐‐‐‐‐‐‐‐‐‐‐‐‐‐‐‐‐‐‐‐‐‐‐‐‐‐‐‐‐‐‐‐‐‐‐‐‐ 8 Figure 5: Production of Vegetable coal with respect to different states of Brazil. ‐‐‐‐‐‐‐‐‐‐‐‐‐‐‐‐‐‐‐‐‐‐‐‐‐‐‐‐‐‐‐ 8 Figure 6: Brazilian National Energy Balance. ‐‐‐‐‐‐‐‐‐‐‐‐‐‐‐‐‐‐‐‐‐‐‐‐‐‐‐‐‐‐‐‐‐‐‐‐‐‐‐‐‐‐‐‐‐‐‐‐‐‐‐‐‐‐‐‐‐‐‐‐‐‐‐‐‐‐‐‐‐‐‐‐‐‐‐‐‐‐ 9 Figure 7: Wood Constituents ‐‐‐‐‐‐‐‐‐‐‐‐‐‐‐‐‐‐‐‐‐‐‐‐‐‐‐‐‐‐‐‐‐‐‐‐‐‐‐‐‐‐‐‐‐‐‐‐‐‐‐‐‐‐‐‐‐‐‐‐‐‐‐‐‐‐‐‐‐‐‐‐‐‐‐‐‐‐‐‐‐‐‐‐‐‐‐‐‐‐‐‐‐‐‐ 10 Figure 8: Cellulose Structure ‐‐‐‐‐‐‐‐‐‐‐‐‐‐‐‐‐‐‐‐‐‐‐‐‐‐‐‐‐‐‐‐‐‐‐‐‐‐‐‐‐‐‐‐‐‐‐‐‐‐‐‐‐‐‐‐‐‐‐‐‐‐‐‐‐‐‐‐‐‐‐‐‐‐‐‐‐‐‐‐‐‐‐‐‐‐‐‐‐‐‐‐‐‐‐‐ 10 Figure 9: Hemi cellulose structure ‐‐‐‐‐‐‐‐‐‐‐‐‐‐‐‐‐‐‐‐‐‐‐‐‐‐‐‐‐‐‐‐‐‐‐‐‐‐‐‐‐‐‐‐‐‐‐‐‐‐‐‐‐‐‐‐‐‐‐‐‐‐‐‐‐‐‐‐‐‐‐‐‐‐‐‐‐‐‐‐‐‐‐‐‐‐‐‐‐ 11 Figure 10: Lignin structure. ‐‐‐‐‐‐‐‐‐‐‐‐‐‐‐‐‐‐‐‐‐‐‐‐‐‐‐‐‐‐‐‐‐‐‐‐‐‐‐‐‐‐‐‐‐‐‐‐‐‐‐‐‐‐‐‐‐‐‐‐‐‐‐‐‐‐‐‐‐‐‐‐‐‐‐‐‐‐‐‐‐‐‐‐‐‐‐‐‐‐‐‐‐‐‐‐‐ 11 Figure 11: Eucalyptus Residues. ‐‐‐‐‐‐‐‐‐‐‐‐‐‐‐‐‐‐‐‐‐‐‐‐‐‐‐‐‐‐‐‐‐‐‐‐‐‐‐‐‐‐‐‐‐‐‐‐‐‐‐‐‐‐‐‐‐‐‐‐‐‐‐‐‐‐‐‐‐‐‐‐‐‐‐‐‐‐‐‐‐‐‐‐‐‐‐‐‐‐‐‐ 12 Figure 12: Garapeira (Sawdust). ‐‐‐‐‐‐‐‐‐‐‐‐‐‐‐‐‐‐‐‐‐‐‐‐‐‐‐‐‐‐‐‐‐‐‐‐‐‐‐‐‐‐‐‐‐‐‐‐‐‐‐‐‐‐‐‐‐‐‐‐‐‐‐‐‐‐‐‐‐‐‐‐‐‐‐‐‐‐‐‐‐‐‐‐‐‐‐‐‐‐‐ 13 Figure 13: Sewage Sludge ‐‐‐‐‐‐‐‐‐‐‐‐‐‐‐‐‐‐‐‐‐‐‐‐‐‐‐‐‐‐‐‐‐‐‐‐‐‐‐‐‐‐‐‐‐‐‐‐‐‐‐‐‐‐‐‐‐‐‐‐‐‐‐‐‐‐‐‐‐‐‐‐‐‐‐‐‐‐‐‐‐‐‐‐‐‐‐‐‐‐‐‐‐‐‐‐‐‐‐ 13 Figure 14: Combustion efficiency Vs excess air. ‐‐‐‐‐‐‐‐‐‐‐‐‐‐‐‐‐‐‐‐‐‐‐‐‐‐‐‐‐‐‐‐‐‐‐‐‐‐‐‐‐‐‐‐‐‐‐‐‐‐‐‐‐‐‐‐‐‐‐‐‐‐‐‐‐‐‐‐‐‐‐‐ 16 Figure 15: Briquetting press ‐‐‐‐‐‐‐‐‐‐‐‐‐‐‐‐‐‐‐‐‐‐‐‐‐‐‐‐‐‐‐‐‐‐‐‐‐‐‐‐‐‐‐‐‐‐‐‐‐‐‐‐‐‐‐‐‐‐‐‐‐‐‐‐‐‐‐‐‐‐‐‐‐‐‐‐‐‐‐‐‐‐‐‐‐‐‐‐‐‐‐‐‐‐‐‐ 18 Figure 16: Gasifier ‐‐‐‐‐‐‐‐‐‐‐‐‐‐‐‐‐‐‐‐‐‐‐‐‐‐‐‐‐‐‐‐‐‐‐‐‐‐‐‐‐‐‐‐‐‐‐‐‐‐‐‐‐‐‐‐‐‐‐‐‐‐‐‐‐‐‐‐‐‐‐‐‐‐‐‐‐‐‐‐‐‐‐‐‐‐‐‐‐‐‐‐‐‐‐‐‐‐‐‐‐‐‐‐‐‐‐‐‐ 20 Figure 17: Gasification Process ‐‐‐‐‐‐‐‐‐‐‐‐‐‐‐‐‐‐‐‐‐‐‐‐‐‐‐‐‐‐‐‐‐‐‐‐‐‐‐‐‐‐‐‐‐‐‐‐‐‐‐‐‐‐‐‐‐‐‐‐‐‐‐‐‐‐‐‐‐‐‐‐‐‐‐‐‐‐‐‐‐‐‐‐‐‐‐‐‐‐‐‐‐ 21 Figure 18: Updraft Gasifier ‐‐‐‐‐‐‐‐‐‐‐‐‐‐‐‐‐‐‐‐‐‐‐‐‐‐‐‐‐‐‐‐‐‐‐‐‐‐‐‐‐‐‐‐‐‐‐‐‐‐‐‐‐‐‐‐‐‐‐‐‐‐‐‐‐‐‐‐‐‐‐‐‐‐‐‐‐‐‐‐‐‐‐‐‐‐‐‐‐‐‐‐‐‐‐‐‐‐ 22 Figure 19: Downdraft Gasifier ‐‐‐‐‐‐‐‐‐‐‐‐‐‐‐‐‐‐‐‐‐‐‐‐‐‐‐‐‐‐‐‐‐‐‐‐‐‐‐‐‐‐‐‐‐‐‐‐‐‐‐‐‐‐‐‐‐‐‐‐‐‐‐‐‐‐‐‐‐‐‐‐‐‐‐‐‐‐‐‐‐‐‐‐‐‐‐‐‐‐‐‐‐‐ 23 Figure 20: Cross draft Gasifier ‐‐‐‐‐‐‐‐‐‐‐‐‐‐‐‐‐‐‐‐‐‐‐‐‐‐‐‐‐‐‐‐‐‐‐‐‐‐‐‐‐‐‐‐‐‐‐‐‐‐‐‐‐‐‐‐‐‐‐‐‐‐‐‐‐‐‐‐‐‐‐‐‐‐‐‐‐‐‐‐‐‐‐‐‐‐‐‐‐‐‐‐‐‐ 24 Figure 21: Fluidized Bed Reactor ‐‐‐‐‐‐‐‐‐‐‐‐‐‐‐‐‐‐‐‐‐‐‐‐‐‐‐‐‐‐‐‐‐‐‐‐‐‐‐‐‐‐‐‐‐‐‐‐‐‐‐‐‐‐‐‐‐‐‐‐‐‐‐‐‐‐‐‐‐‐‐‐‐‐‐‐‐‐‐‐‐‐‐‐‐‐‐‐‐‐ 25 Figure 22: Pyrolysis of Biomass Particle ‐‐‐‐‐‐‐‐‐‐‐‐‐‐‐‐‐‐‐‐‐‐‐‐‐‐‐‐‐‐‐‐‐‐‐‐‐‐‐‐‐‐‐‐‐‐‐‐‐‐‐‐‐‐‐‐‐‐‐‐‐‐‐‐‐‐‐‐‐‐‐‐‐‐‐‐‐‐‐‐‐‐ 29 Figure 23: Fast Pyrolysis System ‐‐‐‐‐‐‐‐‐‐‐‐‐‐‐‐‐‐‐‐‐‐‐‐‐‐‐‐‐‐‐‐‐‐‐‐‐‐‐‐‐‐‐‐‐‐‐‐‐‐‐‐‐‐‐‐‐‐‐‐‐‐‐‐‐‐‐‐‐‐‐‐‐‐‐‐‐‐‐‐‐‐‐‐‐‐‐‐‐‐‐ 31 Figure 24: Flash Pyrolysis Study ‐‐‐‐‐‐‐‐‐‐‐‐‐‐‐‐‐‐‐‐‐‐‐‐‐‐‐‐‐‐‐‐‐‐‐‐‐‐‐‐‐‐‐‐‐‐‐‐‐‐‐‐‐‐‐‐‐‐‐‐‐‐‐‐‐‐‐‐‐‐‐‐‐‐‐‐‐‐‐‐‐‐‐‐‐‐‐‐‐‐‐‐ 32 Figure 25: Bomb Calorimeter ‐‐‐‐‐‐‐‐‐‐‐‐‐‐‐‐‐‐‐‐‐‐‐‐‐‐‐‐‐‐‐‐‐‐‐‐‐‐‐‐‐‐‐‐‐‐‐‐‐‐‐‐‐‐‐‐‐‐‐‐‐‐‐‐‐‐‐‐‐‐‐‐‐‐‐‐‐‐‐‐‐‐‐‐‐‐‐‐‐‐‐‐‐‐‐ 35 Figure 26: TGA of biomass samples ‐‐‐‐‐‐‐‐‐‐‐‐‐‐‐‐‐‐‐‐‐‐‐‐‐‐‐‐‐‐‐‐‐‐‐‐‐‐‐‐‐‐‐‐‐‐‐‐‐‐‐‐‐‐‐‐‐‐‐‐‐‐‐‐‐‐‐‐‐‐‐‐‐‐‐‐‐‐‐‐‐‐‐‐‐‐‐ 37 Figure 27: Kinetic plot of the decomposition of the studied biomass ‐‐‐‐‐‐‐‐‐‐‐‐‐‐‐‐‐‐‐‐‐‐‐‐‐‐‐‐‐‐‐‐‐‐‐‐‐‐‐‐‐‐‐‐‐ 38 Figure 28: Proximate Analysis of Biomass ‐‐‐‐‐‐‐‐‐‐‐‐‐‐‐‐‐‐‐‐‐‐‐‐‐‐‐‐‐‐‐‐‐‐‐‐‐‐‐‐‐‐‐‐‐‐‐‐‐‐‐‐‐‐‐‐‐‐‐‐‐‐‐‐‐‐‐‐‐‐‐‐‐‐‐‐‐‐‐ 39

vii
List of Tables Table 1: Brazil & the World’s crop production 2009. ................................................................................... 3 Table 2: Approximate Area of Brazilian Biomes. .......................................................................................... 4 Table 3: Brazilian Production of Sugar Cane 2002‐2008. .............................................................................. 6 Table 4: Brazilian Alcohol Production: 2002‐2008. ....................................................................................... 6 Table 5: Production of soy bean and castor‐oil in Brazil, in millions tons, 1998‐2008. ................................ 7 Table 6: Advantages and disadvantages of various gasifiers ...................................................................... 19 Table 7: Bulk densities of Wood, Charcoal & Peat. ..................................................................................... 27 Table 8: influence of the type of gasifier on the composition of the produced gas. .................................. 28 Table 9: Gasification conditions at some type of gasifier ........................................................................... 28 Table 10: Pyrolysis types and parameters. ................................................................................................. 30 Table 11: Ultimate Analysis and HHV ......................................................................................................... 36 Table 12: Proximate Analysis and HHV ....................................................................................................... 36 Table 13: Estimated parameters E and A .................................................................................................... 38
1
1 Introduction:
1.1 Renewable Energy: Renewable energy is energy derived from the natural resources (naturally occurring) that are inexhaustible e.g. solar radiation, wind power, geothermal, hydropower, biomass etc. [1].
These natural energy resources can be converted to mechanical energy, heat also electricity using different technologies. Most common processes are hydropower generation, combustion, gasification, and pyrolysis of biomass as well as waste combustion. Other commonly known techniques are wind turbines and photovoltaic cells for solar radiations. These two technologies are highly appropriated for areas with abundant wind or/and solar radiations.
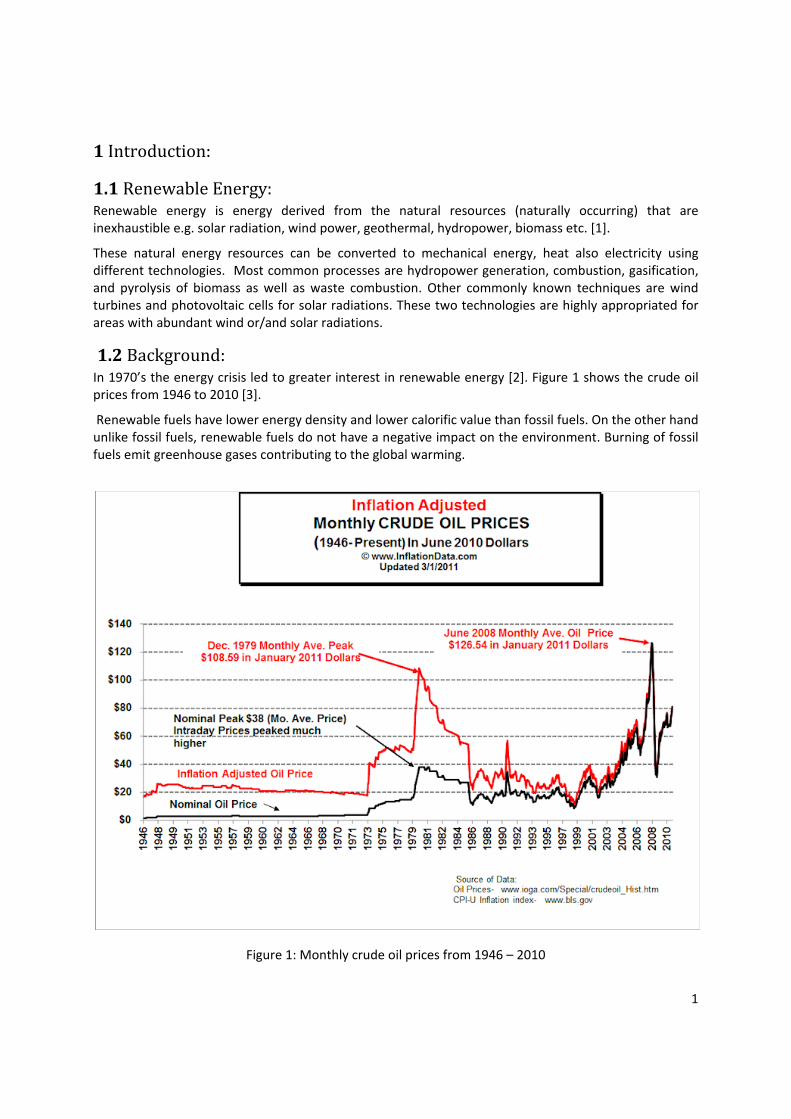
1.2 Background: In 1970’s the energy crisis led to greater interest in renewable energy [2]. Figure 1 shows the crude oil prices from 1946 to 2010 [3].
Renewable fuels have lower energy density and lower calorific value than fossil fuels. On the other hand unlike fossil fuels, renewable fuels do not have a negative impact on the environment. Burning of fossil fuels emit greenhouse gases contributing to the global warming.
Figure 1: Monthly crude oil prices from 1946 – 2010

2
2 Biomass: Biomass refers to vegetable and animal derived material. It is carbon based and it is composed also of hydrogen, oxygen and nitrogen. There are five basic types from which one can categorize the Biomass depending on its origin:
• Virgin wood from forestry, wood processing • Energy crops crop especially for energy applications • Agricultural residues from harvesting or processing • Food waste processing techniques of food or drinks and consumer waste • Industrial waste & co products different process plants manufacturing waste. [4]
2.1 All about Brazilian potential towards biomass: Brazil is very much rich in agriculture & forestry. In Brazil the agro industry occupies an area of 28840726 ha. The more important crops are sugarcane (7080920 ha), rice (289030 ha), wheat (1853220 ha), coconut (283205 ha), cassava (1894460 ha), corn (13767400 ha) and grass (140000 ha). These crops generated 597 million tons of residues [5].
Figure 2: Brazilian crop Production 2008
Figure 2 shows the Brazilian crop production during 2008 [6]. Table 1 compares the Brazilian crop production with crop production in the world [6].

3
Brazil and rest of the world crop production in 2009
Table 1: Brazil & the World’s crop production 2009.
Crops World production(1000 ton)
Production in Brazil (1000 ton)
% Brazilian production
Sugar cane 1 590 702 549 707 34.6
Soya 220 533 57 857 26.2
Citrus 117 382 20 981 17.9
Cassava 214 515 26 541 12.4
Corn 791 795 52 112 6.6
Coconut 61 504 2 831 4.6
Rice 659 591 11061 1.7
Wheat 605 995 4 114 0.7
The residues from the agro industry can be used for production of fuel, chemicals and energy. Moreover the use of renewable energy source has positive environmental impacts. Regarding GHG emissions, 644 million metric tons of CO2 has been avoided from 1975 till 2005, because of the use of ethanol as fuel.
Other agricultural byproducts like wheat straw, corn straw, rice straw and rice hulls, variety of forestry residues, grasses and residues from the processing of cassava, citrus and coconut etc are at high level of interest for the Brazilian Government in using it as local feedstock for production of energy and different types of Chemicals and Bio fuel.
The federal state of Rio Grande do Sul (RS) is the major state in Brazil that is contributing main share in the Brazilian rice production. The rice husks amounts about 22 percent of the total rice crops. 2 millions of rice husks are produced only in South Brazil. The farmers normally burn 15 percent of husks for drying the rice and nearly 35 percent goes to chickens’ bedding [7]. Federal state of Minas Gerais (MG) from South east of Brazil leading the coffee production and exportation as well, in 2007 produced 1.3 million tons of coffee. During processing, the coffee yields 20 percent of husks. Like rice farmers the coffee farmers dealing at small scale use a part of these residues for direct application on soil to avoid from erosion. [7]
Brazil is pioneer in using biomass based fuel in the world and it’s just because of the abundant natural resources of the biomass and lot of agricultural area. It is noted that the potential energy that can be produced from biomass in Brazil is 50 TWH and it is equivalent to 17% of the total power consumption in the country [8].
From a survey in 2006 it was noticed that only forests covered 40 million km2 area of the world (FAO, 2006). In accordance with this survey 50% of this ratio was covering Europe & South America. In South

4
America the forests are covering 8.66 million km2 amongst which 61% are located in Brazil. Brazil is the 2nd highest forestry area in the world after Russia. Natural forest area in Brazil is covered almost with 56% of the total area. 0.7% of the natural forest area is covered by planted forests and the rest of the natural forest area is covered by urban area, cattle farming and agricultural land etc.
Forest plantations in Brazil supplied 102.9 million m3 of industrial roundwood, of which nearly half is for renewable fuelwood and charcoal. Part of this plantation output is destined for the pulp and paper industry.
Brazil can be divided into six Biomes i.e. Amazon, Caatinga, Cerrado, Pantanal, Atlantic & Pampa (table 2) [10]. Biome can be defined as biotic community characterized by distinctive plants & animal species that are maintained by local climatic conditions [9].
Table 2: Approximate Area of Brazilian Biomes.
Brazilian Continental Biomes Approximate Area (km2) Area / Total Brazil
Amazon Biome 4 196 943 49.3%
Cerrado Biome 2 036 448 23.9%
Atlantic Forest Biome 1 110 182 13.0%
Caatinga Biome 844 453 9.9%
Pampa Biome 176 496 2.1%
Pantanal Biome 150 355 1.8%
Total Area Brazil 8 514 877 100%
Amazon biome is the largest biome. It is covering 49% of the Brazil area and is known as the biggest tropical forest. Amazon contains land and flooded forests with 1.5 million vegetable species, 950 kinds of birds, three thousand different species of fish and different kinds of insects, amphibians & mammals.
Cerrado biome is mainly constituted by short trees up to 20 m with wide spread of bushes and subshrubs. It contains nearly 10000 different species of plants.
Atlantic forest biome contains nearly twenty thousand different species of vascular plants. The south of Bahia, currently the biggest worldwide known for ligneous plants, contains nearly 454 species in only one hectare area of land.
Caatinga biome is known as the main ecosystem in the northeast of Brazil. It is mainly covered by the dry vegetation species xerophytic in nature resulting from heated and thorny land along with medium sized plants up to 3‐7 meters in height. [10].

5
Brazilian Energetic Crops/Plant:
This type of plantation deals with the aim of production of biomass at larger area in smaller span of time which is mainly utilized in power generation. Brazil is fulfilling the environmental requirements in this way to produce clean energy matrix when compared to the rest of the world. Renewable energy sources now account for just over 47% of the Brazilian energy matrix, compared to 7% for OECD (Organisation for Economic Co‐operation and Development) countries [11].
In Brazilian energy market sugar cane is mainly used for the sugar production, ethanol fuel and for electricity/power generation. It has been estimated that 25 Mtep (million tons equivalent of petro oil) wasted today can be converted to useful energy merely from some cultural changes. Brazilian government wants to increase its biodiesel production by increasing biofuel production.
2.1.1 Brazilian Energy Forestation: Energy forestation refers to the plantation that is an aimed plantation for energy production. In Brazil it is mainly comprised of Eucalyptus and Bracatingas. Energy forestation reduces the emission while substituting energetic matrix from fossil fuel to biomass. Now days in energy market, the use of wood from these forest plantations for energy/power generation is playing an important role. In accordance with Brazilian National Energy Balance 2007 in energy market wood as a renewable source is taking 13% of the Brazilian energy production. If we take a view of the production of firewood in 2005, then it would be noticed that 45.1 million m3 was produced in Brazil, 24.8% of which was only from the state of Bahia. Whereas in the production of planted forests the total Brazilian production was 36.1 million m3 in which State of Rio Grande do Sul was the major producer i.e. 37.1% of the total (IBGE, 2007). In Brazil the available technologies allows the production of Eucalyptus based plantations as 45 m3/hectare in which States of Bahia, São Paulo and Minas Gerais are taken as major producers.
Brazilian annual capacity of producing sustainable forestation is 390 million m3 amongst which 73% is Eucalyptus based.
2.1.2 Brazilian Forestall Species: The main Brazilian forestall species are as follows;
Acácia Negra: It has basic origin from Australia, 3rd most planted species. It is mostly planted in the state of Rio Grande do Sul. This species covered nearly 156 thousand hectares. It is used in the firewood production.
Araucaria or Pinheiro do Paraná: This species is mainly found in the State of Paraná. Its wood is not good for firewood but its knots have energetic behavior towards energy production also in the coking coal. This wood has very much high value of calorific power i.e. 8000 kcal/kg.
Angico ‐ branco and cascudo: It has tropical American origin. It is specially used for recovery of terrain. This type of wood produces efficient firewood and coal as well.
Bracatinga: It originates from the cold Brazilian regions especially in the South of Brazil. It produces both firewood and coal with high calorific powers of which fire wood has 4.6 to 4.8 Kcal/kg and coal has 7.2 to 7.5 Kcal/kg.
Eucalyptus: the Eucalyptus based plants are very much intensely employed in the Brazilian society amongst which firewood at the top. These plants are normally found in the South and South east region.

6
Taxi Branco: it has origin from Amazon forest, and covers almost 15 thousand hectares of the north region of Brazil. It is contributing in the production of wood used for energy productions [10].
2.1.3 Sugarcane: This crop has basic origin from Southeast of Asia. Its growth is compatible with tropical weathers. In early times it was merely introduced to the Northeast of Brazil. Then looking at its efficient growth it was brought to the Southeast region i.e. São Paulo. Although sugarcane is being cultivated in all the Brazilian states but São Paulo contributes 60% of the total production [10]. Sugarcane was mainly used for the production of sugar. Today it is used also for the production of ethanol as a fuel in the transport sector. Brazil is the biggest ethanol producer in the world. Table3 and Table4 show the production of Sugar cane and Alcohol respectively [10].
Table 3: Brazilian Production of Sugar Cane 2002‐2008.
Region Harvest (ton)
02/03 03/04 04/05 05/06 06/07 07/08
North/North East
50 243 383 59 990 025 57 392 755 48 345 359 54 405 520 74 375 900
Center/ South
265 878 367 297 120 858 324 054 347 334 136 643 373 912 899 475 529 500
Total Brazil 316 121 750 357 110 883 381 447 102 382 482 002 428 318 419 549 905 400
Table 4: Brazilian Alcohol Production: 2002‐2008.
Region Harvest (m3)
02/03 03/04 04/05 05/06 06/07 07/08
North/North East
1 471 141 1 723 416 1 825 786 1 508 085 1 770 726 1 572 892
Center/ South
11 014 285 12 916 507 13 382 123 14 298 845 16 160 925 20 105 570
Total Brazil 12 485 426 14 639 923 15 207 909 15 806 930 17 931 651 21 678 462
The use of sugar cane for production of alcohol increased since 1975. In 1973 the oil crises lead the price of oil from US$ 2.84 to US$12.27 per barrel. This incident greatly affected the energy market in Brazil in order to overcome the energy import from other countries. Thus the Brazilian Government promoted the bio ethanol as a fuel. The National Alcohol Program ‐Pró‐Álcool‐ (Portuguese: 'Programa Nacional do Álcool' was established in 1975 in order to promote the use of sugar cane based ethanol in the Brazilian transport sector. This was the major turn of the Brazilian Government towards renewable fuel [12].

7
In 2002 Brazilian Government initiated an energy programme i.e. Program of Incentives for Alternative Electricity Resources (PROINFA). Its main motive was to provide incentives for the use of renewable sources. The programme aims to increase renewables’ share of annual energy consumption to 10% [13].
2.1.4 Oleaginous crops: These crops contains fruits which are naturally abundant in oil and can be further processed in the production of vegetable oil. It also can be used in the production of Biodiesel. Brazil is very much rich in these crops’ production. Brazilian Government in 2004 launched a program with name Brazilian Program of Technical Development for Biodiesel – PROBIODIESEL, in which they intiated the use of vegetable oil for biodiesel fabrication which proved later a major and efficient part of the Brazilian energy matrix. In Brazil today the main material used for the oil production is soybean. However the soybean production at large scale may lead us to some svere environmental impacts. Avoiding these environmental impacts researches in these areas are being carried out and Brazilian Government wants to utilize other oleaginous crops in the production of oil like palm tree in Pará also in Amazon , castor oil plants in Piauí, Ceará, Bahia and Rio Grande do Norte. The oil from palm tree is known as dendê oil. Table5 shows the production of soybean and castor oil [10]. Figure 3 shows the planted area of palm tree in Brazil [10].
Table 5: Production of soy bean and castor‐oil in Brazil, in millions tons, 1998‐2008.
Year 1999/00 2000/01 2001/02 2002/03 2003/04 2004/05 2005/06 2006/07 2007/08
Soybean 32.34 38.43 41.92 52.02 49.79 51.45 53.43 58.19 59.58
Castor 0.107 0.080 0.072 0.086 0.107 0.210 0.104 0.087 0.130
Figure 3: Brazilian Planted Area in thousand hectares.

8
2.1.5 Vegetable coal: This type of coal is produced by using firewood as raw material in the carbonization/pyrolysis process. Vegetable coal has vast use in the Brazilian communities e.g. household; industry etc. Figure 4 shows the production of vegetable coal in Brazil. The major part of the vegetable coal in Brazil is produced in Minas Gerais (figure 5)
Figure 4: Production of vegetable coal in Brazil year wise.
Figure 5: Production of Vegetable coal with respect to different states of Brazil.
9
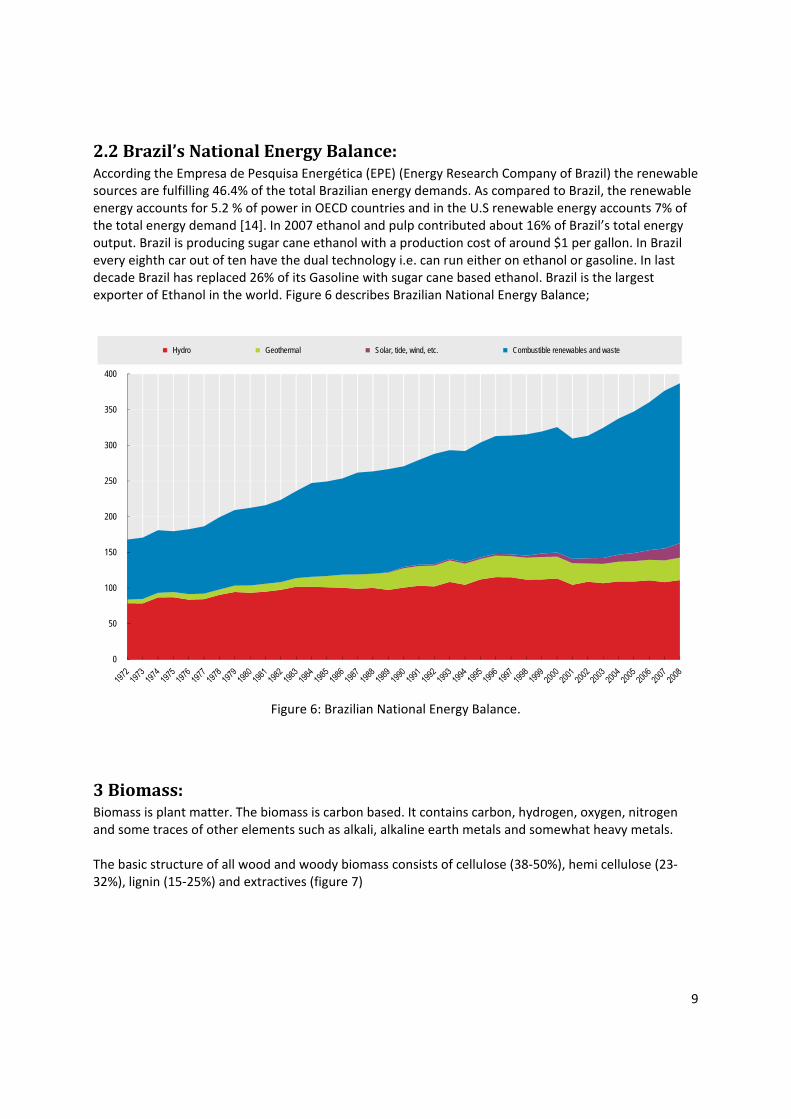
2.2 Brazil’s National Energy Balance: According the Empresa de Pesquisa Energética (EPE) (Energy Research Company of Brazil) the renewable sources are fulfilling 46.4% of the total Brazilian energy demands. As compared to Brazil, the renewable energy accounts for 5.2 % of power in OECD countries and in the U.S renewable energy accounts 7% of the total energy demand [14]. In 2007 ethanol and pulp contributed about 16% of Brazil’s total energy output. Brazil is producing sugar cane ethanol with a production cost of around $1 per gallon. In Brazil every eighth car out of ten have the dual technology i.e. can run either on ethanol or gasoline. In last decade Brazil has replaced 26% of its Gasoline with sugar cane based ethanol. Brazil is the largest exporter of Ethanol in the world. Figure 6 describes Brazilian National Energy Balance;
Figure 6: Brazilian National Energy Balance.
3 Biomass: Biomass is plant matter. The biomass is carbon based. It contains carbon, hydrogen, oxygen, nitrogen and some traces of other elements such as alkali, alkaline earth metals and somewhat heavy metals. The basic structure of all wood and woody biomass consists of cellulose (38‐50%), hemi cellulose (23‐32%), lignin (15‐25%) and extractives (figure 7)
0
50
100
150
200
250
300
350
400
Hydro Geothermal Solar, tide, wind, etc. Combustible renewables and waste

10
Figure 7: Wood Constituents
3.1.1 Cellulose: The name cellulose was named by a French Chemist Anselme Payen; he was also physicist & mathematician in 1838. According to him almost every plant cell walls are mainly composed of cellulose. It is mainly composed of D‐glunnncose linked ß‐1, 4‐glycosidic bonds while the degree of polymerization is nearly 10,000. Its chemical formula is (C6H12O5) n. it is mainly composed of glucose monomers. It has a crystal structure Figure 8 shows the structure of the cellulose [15].
Figure 8: Cellulose Structure
3.1.2 Hemi cellulose: Unlike cellulose it is amorphous. It is present in 30‐40% of the wood’s dry weight. It has very low degree of polymerization i.e. around 50‐300. Hemi cellulose in softwood is mainly galactoglucomannans (15‐20%) and arabinoglucuronoxylan (5‐10%). In hardwood, glucuronoxylan (15‐30%) is the predominant hemicellulose. Figure 9 describes the structure of Hemi cellulose.

11
Figure 9: Hemi cellulose structure
3.1.3 Lignin: It is 5‐6% of the wood’s dry weight. It is a complex class, of high molecular weight polymer. Lignin consists of several bonded hydroxyl‐ and methoxy‐substituted phenylpropane units. Likewise hemicelluloses it is also amorphous. Figure 10 describes the structure of lignin in both hard & soft wood.
Figure 10: Lignin structure.

12
3.1.4 Extractives: The extractives are present in very much small quantity. In some cases they impart more roles in the composition of the wood but normally at low level. Of most known class of extractives are oleoresins. Varieties of oils like turpentine are extractives. Another class of extractives is polyphenols from which flavones, tannins, kinos etc are derived. Ash is inorganic residues remaining after ignition at high temperature. Ash contains silicon, calcium, magnesium, potassium etc.
3.2 Agricultural Residues Samples: In this study three biomasses abundant in the Brazil are studied: i.e. Eucalyptus, Garapeira / Peroba (wood dust) and Sewage Sludge.
3.2.1 Eucalyptus: Eucalyptus has its origin that originated from Eucalyptus was introduced in Brazil in 1910. It has extensive uses in the paper & pulp industry. In 1967 the Brazilian Federal Government introduced a program based on tax free plantation of forests. Among the subsidized tress were eucalyptus and pine. In 1999 the total sales was 17 billion US$. The export of eucalyptus was 3.3 billions US$ representing 7% of the total Brazilian export [16]. Brazil is one of the major exporter and producer of Eucalyptus wood and pulp. In Brazil the Eucalyptus is used for charcoal production. The charcoal is used in the iron and steel industries in Brazil. Figure 11 shows eucalyptus residues.
Figure 11: Eucalyptus Residues.
3.2.2 Garapeira: Its scientific name is Apuleia Ieiocarpa (Vog.) Macbr. Commonly it is known as garapeira, muirajuba, muiratauá, egg‐yolk, barapibo. It is a hardwood with a density of 830 kg/m3. It looks yellowish pink or light yellow. Its surface is glossy, smooth in touch and has a specific smell and taste. Its wood has a high strength and it is used extensively in outdoor construction [17]. Figure 12 shows garapeira sawdust.

13
Figure 12: Garapeira (Sawdust).
3.2.3 Sewage Sludge: Sewage sludge is the mixture water and solid waste from industrial/home activities. The sludge can be converted into energy by gasification. The heavy metals will be fixed in the ash [18]. Figure 13 is showing the used Sewage Sludge in this study.
Figure 13: Sewage Sludge
14
3.3 Biomass conversion technologies: There are numerous processes to convert the biomass into energy, chemicals, gas: thermal conversion, chemical conversion and biochemical conversion
3.3.1 Thermal conversion: In thermal conversion of biomass the dominant mechanism is heat. The main thermal conversion processes are:
• Combustion • Gasification • Pyrolysis
Other important thermal conversion processes are liquefaction (hydro thermal upgrading, HTU) and hydroprocessing (hydrogenation)
By liquefaction high moisture content biomass is converted into a product with high energy density. HTU deals with a 25% slurry in water at conditions of 350�C for 5‐20 minutes and pressure ranges up to 120‐180 Bar.
Hydro processing is the hydrogenation of vegetable oils used to remove all unsaturated double bonds. The oil is fully hydrogenated enhancing the properties (higher viscosity and melting point, resistance to rancidity.
3.3.2 Chemical conversion: Chemical conversion involves different types of chemical processes in series, in order to get a liquid fuel that is used conveniently.
3.3.3 Bio chemical conversion: Many bio chemical processes are being developed in order to break down the molecules of biomass. Bio chemical process makes use of natural micro organisms like enzymes of bacteria for breaking down the biomass. There are different biochemical processes such as;
• Anaerobic digestion • Fermentation • Composting
In anaerobic digestion the bacteria break down the biomass in an atmosphere in the absence of air in order to produce biogas.
In fermentation, the bacteria growth is needed in order to convert the sugar rich crops like sugarcane beat or starch to the bio fuel like bio ethanol (first generation ethanol). In the production of second generation ethanol the raw materials are agricultural residues, wood or energy crops. But these lignocellulosic raw materials have be broken down into simple sugars prior to distillation using either acid or enzyme hydrolysis.
Composting is the same technique likewise anaerobic digestion but the difference is only that this technique is applied in the presence of oxygen and is applied to the solid material not to the slurry.

15
3.3.4 Combustion: Combustion is an exothermic chemical reaction in which the fuel and the oxidizer (normally oxygen) When an organic compound (hydrocarbons) in solid, liquid or gaseous phase reacts with an oxidizing agent the following reaction is obtained;
Fuel + Oxygen → Heat+ Water+ Carbon dioxide
Combustion Basics: Combustion is done mainly in reactors called as combustors.
• Types of combustors specifically are steady and un‐steady chambers of combustion and the burners. There are some basic processes of combustion like; stationary combustion or can say at rest, premixed flame, non‐premixed flame, and pollutant generation.
• There are subsystems of generic combustors; intake, injectors, igniters, energy flows, exhausts safety and controls.
• Some fundamental study issues like, thermodynamics, chemistry, heat & mass transfer, instrumentation & process control, fluid dynamics etc.
• Some kinetic and mathematical modeling is required in order to validate the theories.
Different parameters influence the combustion:
• Type of fuel is the basic or the back bone of the combustion process. The study of the fuel is concerned the availability, the price, the properties. It is important to determine i.e. physical (shape, size etc), chemical properties (proximate and ultimate analysis etc).
• Choice of oxidizer is of basic commodity comes in this way. As there are available oxidizers in nature, e.g. oxygen, air (21% oxygen + 79% nitrogen), air with higher percentage of oxygen i.e. oxygen higher than 21%, some oxides etc.
• Third most important thing for the combustion process is the air to fuel ratio. Available methods to calculate the mixture ratio are on fuel molar fraction in the mixture xF, mass fraction of fuel vF, fuel to air ratio f, air to fuel ratio A, ratio of air stoichiometric basis λ (λ = A/A0), the equivalence ratio (fuel to air ratio at stoichiometric basics) φ=1/λ. The excess air is calculated as e=λ‐1.
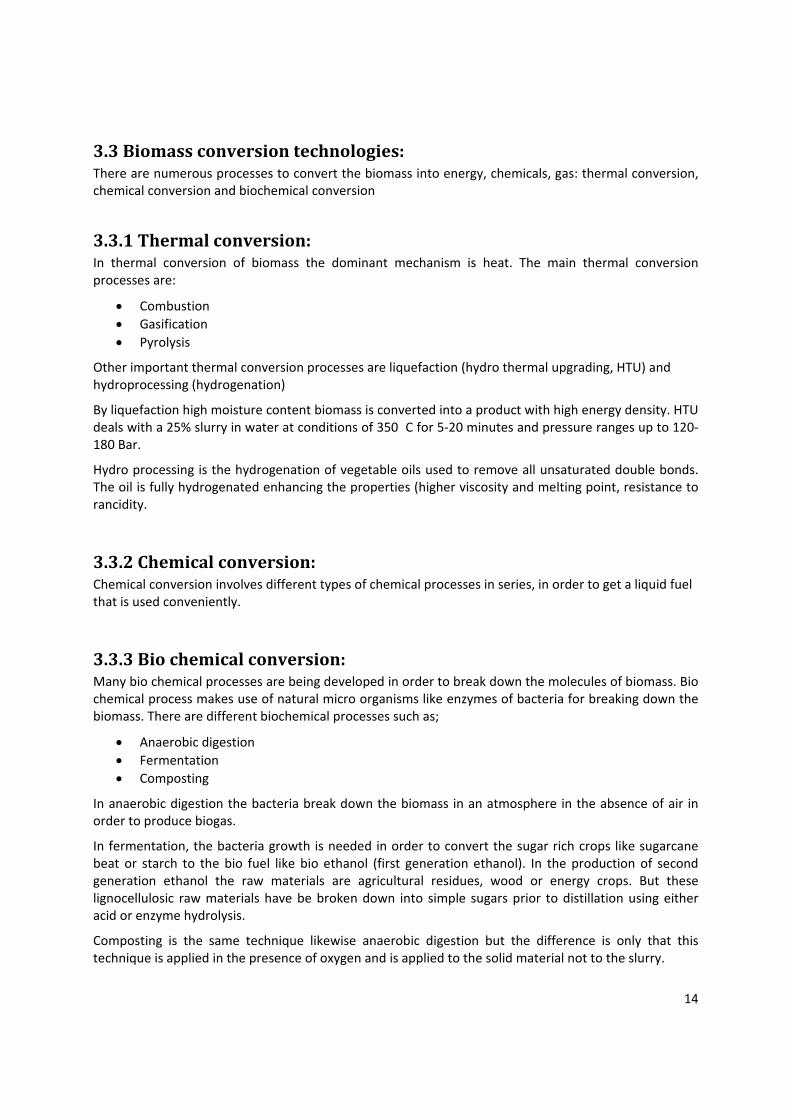
Figure 14 describes the relation between combustion efficiency and the excess of air in the combustion process.
16
Figure 14: Combustion efficiency Vs excess air.
3.3.5 Agriculture Residues Combustion: As our main area of interest amongst biomass is agriculture residues, so we will have some study from this area. Agriculture residues include bagasse, wheat & rice husks, coffee husks, and residues from forestry like barks, wood chips, saw dust as well. The production of all these residues have been discussed in earlier sections which are very much, quantitatively and qualitatively promising in Brazilian territory. The problems concerned with these agricultural residues can be summarized as; high moisture content, high volatile matter content, ash with low melting point and lower bulk density.
With respect to moisture content studies it has been noticed that bagasse is fired with 40 – 60 wt%. [19]
These high values of moisture content leads the firing process to poor ignition also reduces the temperature of combustion process as high amount of energy is initially employed to remove the moisture content [20].
Presence of high moisture content in the biomasses reduces the release time of volatile matter in the biomass. It has been observed in coal also in the wood chips. [21]
In case of bulk density mostly agricultural residues have low bulk densities, e.g. rice husks comprise 50 – 120 kg/m3 which is very much low when we compare it with the coal bulk density i.e. 560 – 600 kg/m3 [22]. This factor of low bulk density greatly effects the processing of agricultural residues like in storage and firing.
Ash content varies from species to species, like in rice husks it is 18 – 25%. The main problem in the combustion related to ash content is the low melting point of the ash from that particular biomass. It is observed in most residues that this is due to the presence of potassium oxide in greater amount, which

17
leads towards the corrosion, scaling fouling of the reactor and bed agglomeration in the case of fluidized bed. [23]
Compared with coal, agricultural residues have normally higher content of volatile matter which leads towards easy ignition. Nitrogen and Chlorine in the fuel is converted into their oxides during combustion producing pollutant emissions.
Densification: This compressing technique is employed in the way to remove the voids present in the particles of agricultural residues i.e. inter‐particle and intra‐particle. This technique is adopted in the pattern of first to bale the residues, and then pelletize or briquetting the residues. The densification process greatly affects the properties of residues like bulk densities are increased e.g. Baled straws have 70 – 90 kg/m3, heating values are also increased as 260 – 360 kWh/m3 and moisture content is reduced as 15 – 20%. [24]
Briquetting and pelleting: The basic purpose of this technique is to increase the bulk density of the concerned residues, which normally e.g. 250 kg/m3 especially where transport or storage is concerned. The industrial briquetting press unit is a simple and common technique that can be well illustrated by the following Figure 15.
Charcoal briquettes produced from eucalyptus are popularly used in Brazil. Briquettes are made by compressing charcoal with a binder and other minor additives. Charcoal briquettes are produced from charcoal fines and starch. The fines result from the production of charcoal from eucalyptus plantations. Starch is extracted from babaçu pulp in the Amazon region [25]
Pellets are cylindrical, 6 to 8 mm in diameter and 10 to 12 mm long. During pelleting the specific density of biomass is increased to more than 1000 kg/m3. The pelleting process involves the drying of the biomass to about 10% normally in a rotary drum dryer. After drying, a hammer mill reduces the size of the biomass particles to 3.2 to 6.4 mm. Then the biomass is compacted in the press mill to form pellets. Important variables in the process are the physical and chemical properties of the biomass, temperature and pressure. In some operations, binders or stabilizing agents are used. When wood is used as biomass the lignin can acts as binder. Wood contains higher amount of lignin than agricultural crop residues [26].

18
Figure 15: Briquetting press
3.4 Gasification: Gasification is a partial oxidation process. Less oxygen is used in gasification than in combustion. In gasification it is used between 25 to 40% of the theoretical oxidant in order to produce heat and gasify the remaining the unoxidized fuel into synthesis gas i.e. a mixture of carbon mono oxide and hydrogen. These both gases CO and H2 are colorless and odorless and highly flammable as well can then be converted to liquid fuels, chemicals, electricity etc.
Synthesis gas is utilized to run the IC (internal combustion) engines of any type like (compression or spark ignition). Syngas can be used for thermal application, as fuel for furnaces, etc. Syngas can be used for production of transport fuels as methanol and dimethyl ether (DME).
3.4.1 Gasification historical background: Process of gasification was first used 180 years ago. Initially town gas for lighting was produced by gasification. Coal and peat was used as raw materials. Then gasification was used in blast furnace to produce combustible gases. With passage of time it was realized that the resulting gas i.e. producer gas could be utilized in heating and power generation. In Europe gasification systems was developed using charcoal and peat as raw material. At that time petroleum/fossil fuel was as fuel. But during World War II the shortage of petroleum products turned the scenario and the gasification technology was reintroduced. In 1945 the producer gas was utilized in heavy duty vehicles (trucks and buses) also in industrial and agricultural machines. After World War II, the availability of cheap fossil fuel resulted in the fall of producer gas technology. But the Sweden maintained its research on producer gas and it was seen that there was some acceleration in this field after 1956 crisis of Suez Canal. After then it was decided to include gasifiers in the Swedish strategy of emergency planning.
The interest in gasification restarted in the world in 1973 because of the oil crisis.
19
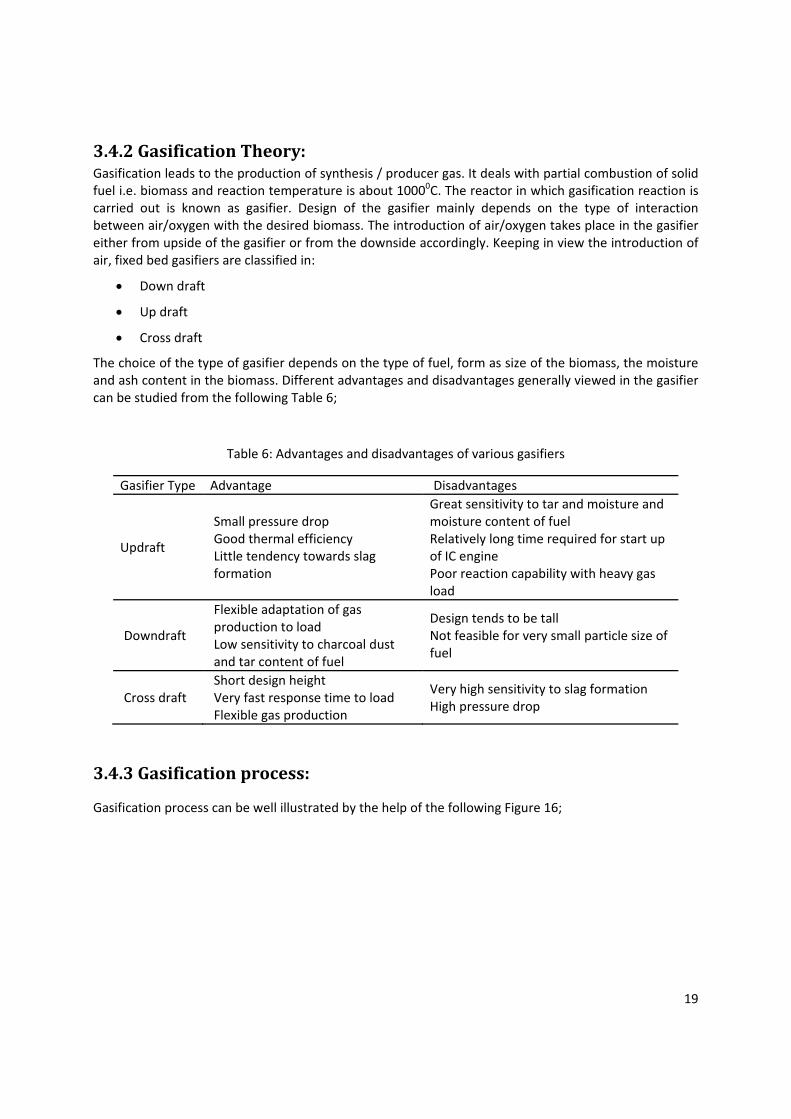
3.4.2 Gasification Theory: Gasification leads to the production of synthesis / producer gas. It deals with partial combustion of solid fuel i.e. biomass and reaction temperature is about 10000C. The reactor in which gasification reaction is carried out is known as gasifier. Design of the gasifier mainly depends on the type of interaction between air/oxygen with the desired biomass. The introduction of air/oxygen takes place in the gasifier either from upside of the gasifier or from the downside accordingly. Keeping in view the introduction of air, fixed bed gasifiers are classified in:
• Down draft
• Up draft
• Cross draft
The choice of the type of gasifier depends on the type of fuel, form as size of the biomass, the moisture and ash content in the biomass. Different advantages and disadvantages generally viewed in the gasifier can be studied from the following Table 6;
Table 6: Advantages and disadvantages of various gasifiers
Gasifier Type Advantage Disadvantages
Updraft
Small pressure drop Good thermal efficiency Little tendency towards slag formation
Great sensitivity to tar and moisture and moisture content of fuel Relatively long time required for start up of IC engine Poor reaction capability with heavy gas load
Downdraft
Flexible adaptation of gas production to load Low sensitivity to charcoal dust and tar content of fuel
Design tends to be tall Not feasible for very small particle size of fuel
Cross draft Short design height Very fast response time to load Flexible gas production
Very high sensitivity to slag formation High pressure drop
3.4.3 Gasification process:
Gasification process can be well illustrated by the help of the following Figure 16;

20
Figure 16: Gasifier
In figure 20 the feeding of the biomass is showed in point 1. The point 2 in the figure the different reactions like drying, pyrolysis, oxidation, reduction, combustion are taking place. In point 3 the char are removed from the process. In point 4 synthesis gas/producer gases are coming out.
The gasification process of biomass can be divided into four main steps;
• Drying
• Devolatilization / Pyrolysis
• Combustion
• Reduction

21
Figure 17: Gasification Process
These four steps occupy respective zones in the gasifier and in each zone thermal and chemical reactions take place. Each reaction takes place at different specific temperature depending on the needs of that particular reaction’s nature, e.g. drying zone lies in 200 0C – 400 0C, Pyrolysis zone lies in 400 0C ‐ 600 0C, reduction zone lies in 600 0C ‐ 1000 0C and combustion starts from 900 0C ‐ 1300 0C.
Normally solid biomasses contain 30 – 40% of moisture content which has to be removed in order to prepare the biomass for further processing and it needs some heat applications to dry that particular biomass sample. When biomass is free from moisture content then it comes in the Pyrolysis zone which as discussed earlier starts from/above 250 � C and devolatilization starts. Pyrolysis is the application of heat to biomass in the absence of air/oxygen. It produces tar and gases. The gases contain hydrogen, carbon dioxide, carbon monoxide and light hydrocarbons. The partially cracked products from Pyrolysis go to the charcoal bed, and here the main reduction reactions (gasification) take place [28]:
C + CO2 2CO (‐ 164.9 MJ/kg mole)
C + H2O CO + H2 (‐ 122.6 MJ/kg mole)
Other reactions in the reduction zone are:
CO + H2O CO + H2 (+ 42 MJ/kg moles)
C + 2H2 CH4 (+ 75 MJ/kg moles)
CO2 + H2 CO + H2O (‐ 42.3 MJ/kg mole)
In combustion zone, the heat is produced. Carbon dioxide is produced from carbon in fuel and water is produced usually as steam from the hydrogen [28]. Combustions reaction yields very high temperature and referred as exothermic. The main reactions are:
C + O2 CO2 (+ 393 MJ/kg moles)
2H2 + O2 2H2O (‐ 242 MJ/kg mole)

22
3.4.4 Updraft Gasifier: The updraft gasifier is also known as counter current fixed bed gasifier because the air acts as countercurrent to fuel flow. The air is injected from the bottom while the biomass enters at the top. The biomass moves down and first is dried by the outgoing hot product gas. The gases leave the gasifier at low temperature. After drying zone the biomass is pyrolyzed. The pyrolysis gases are carried up by the upflowing hot product gas. The biomass continues to moves down and it is gasified. It has high thermal efficiency as the exit gas temperature is low. The gases leave the gasifier with high tar content. Th amount of methane is also significant. In this type of gasifier it is very important, that the biomass going to be used must has non‐caking behavior. In this way it can form a permeable bed for the upcoming oxidizer. Updraft technology have some drawbacks i.e. it produces excessive amount of tar in the raw gas with poor loading capability therefore it is not used for continuous processes like in the use of vehicles. Figure 22 represents the updraft design
Figure 18: Updraft Gasifier
3.4.5 Downdraft Gasifier: The Downdraft gasifier is also called co‐current gasifier because both the biomass and the air move down. Its advantage over updraft is that the gases leave with low tar content. The gases leave also at higher temperature than in an updraft gasifier.
But main problem with the downdraft design is that it faces with high ash and moisture content. The downdraft gasifier has a lower overall efficiency then the updraft because the gases leave the gasifier at
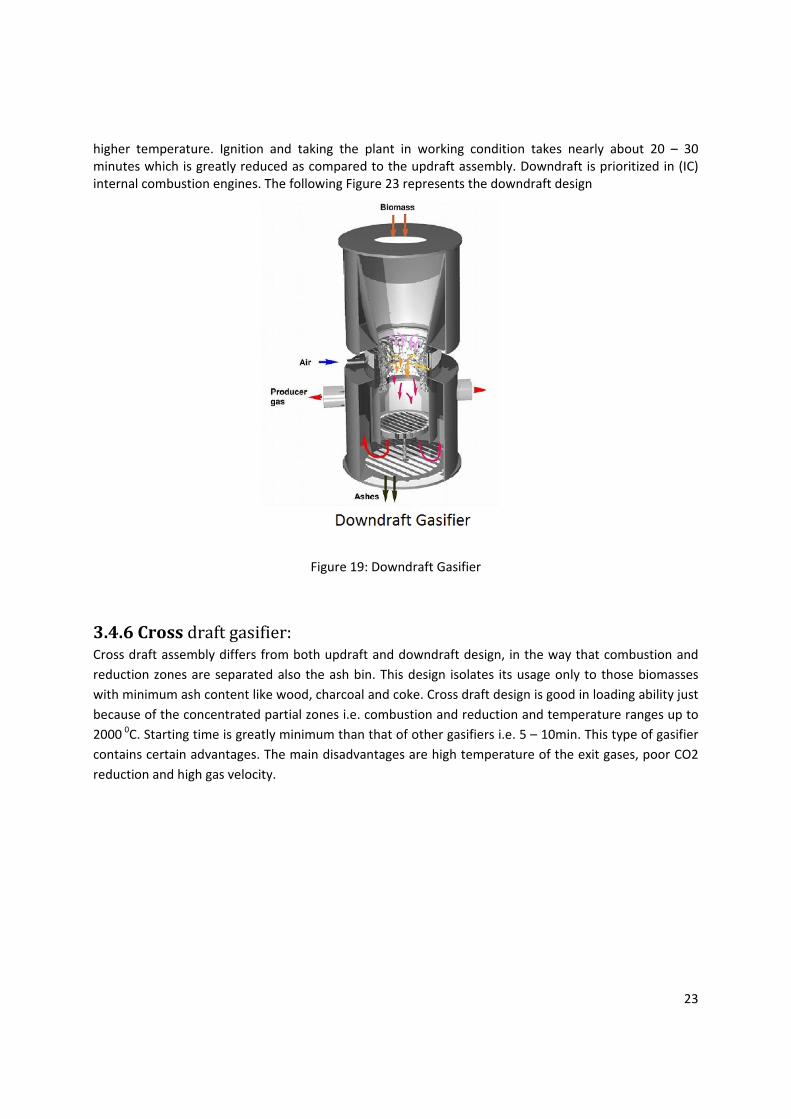
23
higher temperature. Ignition and taking the plant in working condition takes nearly about 20 – 30 minutes which is greatly reduced as compared to the updraft assembly. Downdraft is prioritized in (IC) internal combustion engines. The following Figure 23 represents the downdraft design
Figure 19: Downdraft Gasifier
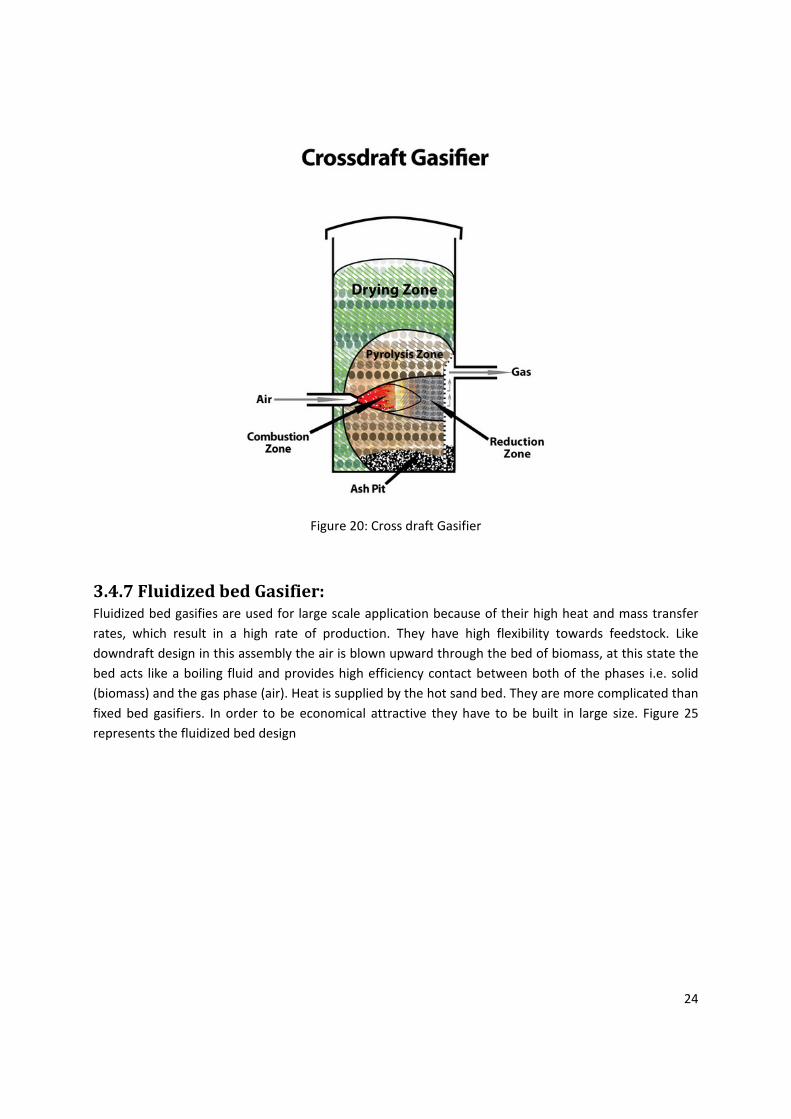
3.4.6 Cross draft gasifier: Cross draft assembly differs from both updraft and downdraft design, in the way that combustion and reduction zones are separated also the ash bin. This design isolates its usage only to those biomasses with minimum ash content like wood, charcoal and coke. Cross draft design is good in loading ability just because of the concentrated partial zones i.e. combustion and reduction and temperature ranges up to 2000 0C. Starting time is greatly minimum than that of other gasifiers i.e. 5 – 10min. This type of gasifier contains certain advantages. The main disadvantages are high temperature of the exit gases, poor CO2 reduction and high gas velocity.
24
Figure 20: Cross draft Gasifier
3.4.7 Fluidized bed Gasifier: Fluidized bed gasifies are used for large scale application because of their high heat and mass transfer rates, which result in a high rate of production. They have high flexibility towards feedstock. Like downdraft design in this assembly the air is blown upward through the bed of biomass, at this state the bed acts like a boiling fluid and provides high efficiency contact between both of the phases i.e. solid (biomass) and the gas phase (air). Heat is supplied by the hot sand bed. They are more complicated than fixed bed gasifiers. In order to be economical attractive they have to be built in large size. Figure 25 represents the fluidized bed design

25
Figure 21: Fluidized Bed Reactor
3.4.8 Choice of Gasifier: The choice of gasifier is the main issue arises before running any type of gasification plant. There is a variety of biomasses available in nature e.g. wood, wood waste including agricultural residues etc. These biomasses differ from each other widely in their properties like physical, chemical and morphological. The design and choice of the gasifier is influenced by the type of biomass to be used.
The following properties of the biomass have to taken in consideration in the selection of the gasifier:
Energy content
• Ash content • Volatile matter • Reactivity • Size • Bulk density
Energy content:
The heating value is the amount of heat produced by the complete combustion of the biomass. The biomass higher heating value (HHV) is experimentally determined in an adiabatic calorimetric bomb. In the apparatus the water vapor, if produced, is condensed and heat of condensation is included. It is assumes that the water is in liquid state at the end of combustion.
The lower heating value (LHV) doesn’t include the heat of condensation of the water produced during combustion. It is determined by subtracting the heat of vaporization of the water vapor from the higher heating value. It is assumed that the water is as vapor at the end of combustion.

26
Both HHV and LHV can be expressed as received, mf (moisture free) or maf (moisture ash free).
Moisture content:
The moisture content depends on the type of biomass. The moisture content can be calculated on wet or dry basis (relative to the wet or dry weight)
Moisture Content, M.CDry = wet weight – dry weight / dry weight * 100%
Moisture Content, M.CWet = wet weight – dry weight / wet weight * 100%
When these values are determined it is very much clear for the process engineers to optimize the process accordingly. High values of moisture content in the biomass greatly reduce the thermal efficiency of the gasifier as lot of energy is consumed initially to remove the water from the biomass. The resulting gas has low heating values. Moisture content under 15 % is desirable.
The updraft gasifier can use biomass with higher moisture content (up to 50%). The produced gas is normally used for the combustion where low heating values can be taken and the biomass containing 40‐ 50% moisture is compatible with the process. The downdraft gasifier handles biomass fuels with a moisture content of less than 20% [29].
Volatile matter:
During the heating process the biomass at 400‐500 0C in an oxygen free atmosphere decomposes into volatile gases and solid char. Biomass has higher volatile matter than coal. Fuel with higher volatile matter content produces more tar. The volatile matter content in the fuel determines the design of the gasifier for removal of tar. The volatile matter is determined pyrolyzing the biomass at 950 during 7 minutes. (ASTM D 3175).
Ash Content:
The ash (inorganic and uncombustible material) in the fuel can cause slagging in the gasifier. Slagging is caused by the agglomeration and the melting of the ashes. The slagging reduces the efficiency of the process also enhances the labor costs in cleaning of the gasifier. Slagging starts normally with ash content higher than 12%, but there is also risk of slagging in the case of biomasses having ash content between 6 and 12%. Ash slagging tendency is dominated by the ash melting temperature which is in connection with the trace elements presence which creates eutectic mixtures with low melting point.
Down draft and up draft designs can handle the slagging fuels but it needs modification like external pyrolysis. Cross draft gasifiers works at high temperature so it needs some safe guards for dealing with the ash content. Fluidized bed gasifiers have better capacity than fixed bed gasifiers to deal with high ash content materials because a better control of the temperature in this kind of gasifiers.
Reactivity:
This property of the concerned biomass determines the power of reducing the carbon dioxide to carbon mono oxide. It plays an important role in the designing of the gasifier as reactivity of the fuel determines the reduction zone’s height. Reactivity also depends upon the type of fuel. It has been observed that peat, wood and charcoal is more reactive as compared to coal. Researchers showed that geological age

27
and the morphological characteristics of the fuel are the key factors that influence the relation between active places on char surface and the fuel reactivity. The amount of trace elements like sodium, potassium and zinc present in the fuel influences the reactivity of fuel as these elements act in gasification as catalyst.
Particle size:
Particle size mainly concerns with the designing of the gasifier as it greatly affects the gasification process. Like in the case of down draft design as well in the updraft, these both contain some limitations in dealing with some particular size of the fuel. The use of large size particles of the fuels results in decreased reactivity of the fuel as well creating problems in the start up of the gasifier. In updraft design, gas channeling is observed when large size particles are used. Whereas, fuel of highly crushed can cause problems related to high pressure drop in the reduction zone. A larger value of pressure drop leads the process towards high tar production and low temperature of the reactor. Also the amount of particles in the produced gas increased. Normally permissible fuel size is different for different gasification units depending on the nature of fuel. Like in wood gasification it is permissible to use the wood in the form of blocks or pellets for sizes ranging between 8 x 4 x4 cm. and 1 x 0.5 x 0.5 cm. Fluidized bed design deals well with 0.1 and 20 mm.
Bulk density:
This property tells about the weight per unit loosely tipped fuel volume. Fuels with high bulk density have high energy for volume. Fuel with low bulk density have problem to flow by gravity. The use of fuel with low values of bulk density can lead to a low heating value in the produced gas. The char is burned in the reduction zone. Bulk densities of different fuels can be upgraded with the technique of pelletizing and briquetting. Some generally used fuels’ bulk densities are shown in table 7.
Table 7: Bulk densities of Wood, Charcoal & Peat.
Fuel Bulk density (kg/m3)
Wood 300 – 550
Charcoal 200 – 300
Peat 300 - 400
3.4.9 Synthesis Gas Production: The synthesis gas produced by gasification contains mainly carbon monoxide, hydrogen and carbon dioxide. The composition of the produced gas depends on the condition during the gasification as well as on the feedstock. Figure 8 shows the influence of the type of gasifier on the composition of the produced gas [3]. Figure 9 shows gasification conditions at some type of gasifier.

28
Table 8: influence of the type of gasifier on the composition of the produced gas.
Gas Component CFB Indirect Entrained Flow
H2 30‐40 17.5 21‐32
CO 20‐30 50 27‐47
CO2 15‐25 9.4 13‐31
CH4 8‐12 15.5 0‐0.5
C2H4 ‐ 1.1 ‐
C2H6 ‐ 6 ‐
N2 1‐5 ‐ 9‐17
Table 9: Gasification conditions at some type of gasifier
The synthesis gas can be used directly in gas engines or also can be converted to second generation biofuel. Second generation biofuels include biomethanol, bioDME (bio Dimethylether), BioSynthetic Natural Gas (BioSGN), Biohydrogen, Fischer‐Tropsch (FT) liquid, etc.
The conversion of the synthesis gas to second generation biofuels requires the gas conditioning in order to reach a determined H2/CO ratio. The water shift reaction is used for change the H2/CO ratio in the produced gas. The water shift reaction can take place in rectors at high temperature (HT), low temperature (LT) [30].
The produced syngas contains pollutants depending on the type of gasifier and on the type of feedstock. The pollutants can be particulate matters, tars, ammonia, metals, dioxins, furans, etc. The tar can be destroyed by thermal processes at high temperature (1200°C), by catalytic process or using aqueous scrubbers. Aqueous tar removal systems cold down the gas and remove the tar by condensation.
Fixed bed Fluidized Bed Entrained Flow
Input particle size,mm 10‐300 <50 <0.1
Outlet gas temperature, C 400‐1000 700‐1200 1200‐1500
Operating temperature From atmospheric pressure (1 bar) to 25 bar
Gasification medium Air, steam, oxygen, flue gas, syngas
Plant size: MWth input <50 10‐100 100‐1000

29
Because some problems with the aqueous tar removal, oil based tar systems, like OLGA, have been developed. In OLGA system the tars are removed by condensation and absorption.
Particulate matters can be removed by filters and cyclones. High temperature ceramic filters are commercially available. Wet scrubbing can also be used for particulates removal. Chlorides, ammonia, some hydrogen sulfide (H2S) and other trace contaminants from the syngas can also be removed by wet scrubbing.
3.5 Pyrolysis: Biomass Pyrolysis is decomposing the organic matrix thermally, in an‐aerobic atmosphere in solid, liquid as well as gaseous products.
This thermal technique is widely used in order to produce a variety of fuels, chemicals, solvents etc. Formal Pyrolysis technique deals with the slow, irreversible decomposition of the biomass, used for the production of charcoal. Fast Pyrolysis, flash Pyrolysis, rapid Pyrolysis and ultra‐Pyrolysis at low temperature, around 500°C, yield mainly liquid products. Fast Pyrolysis for liquid production includes also a rapid quenching of the liquid products in order to avoid further conversion. The produced liquid consists mainly of organic chemicals and specific amount of water. The produced liquid from biomass fast pyrolysis usually contains acids, aldehydes, alcohols, esters, ketones, and phenolic compounds. [31, 32]. The produced acids mainly comprise of water, 50% Methanol (CH3OH), acetone as well as phenols. The recovery of acetic acid from pyrolytic liquids is economically attractive [53]
The pyrolytic gas consists of CO, CO2, methane, hydrogen and with traces of water vapors.
Pyrolysis of a biomass particle converting into respective products may be studied as the heat transfer process occurs there in the biomass particle. Radiation and convection are the basic processes of heat transfer to the biomass particle; in some cases conduction is employed. But collectively these heat transfer phenomenon are combined as, first of all the conduction through the particle inside, then convection through the pores of particle and after then convection and radiation is done from the surface. Figure 22 shows the heat transfer during pyrolysis.
Figure 22: Pyrolysis of Biomass Particle
30
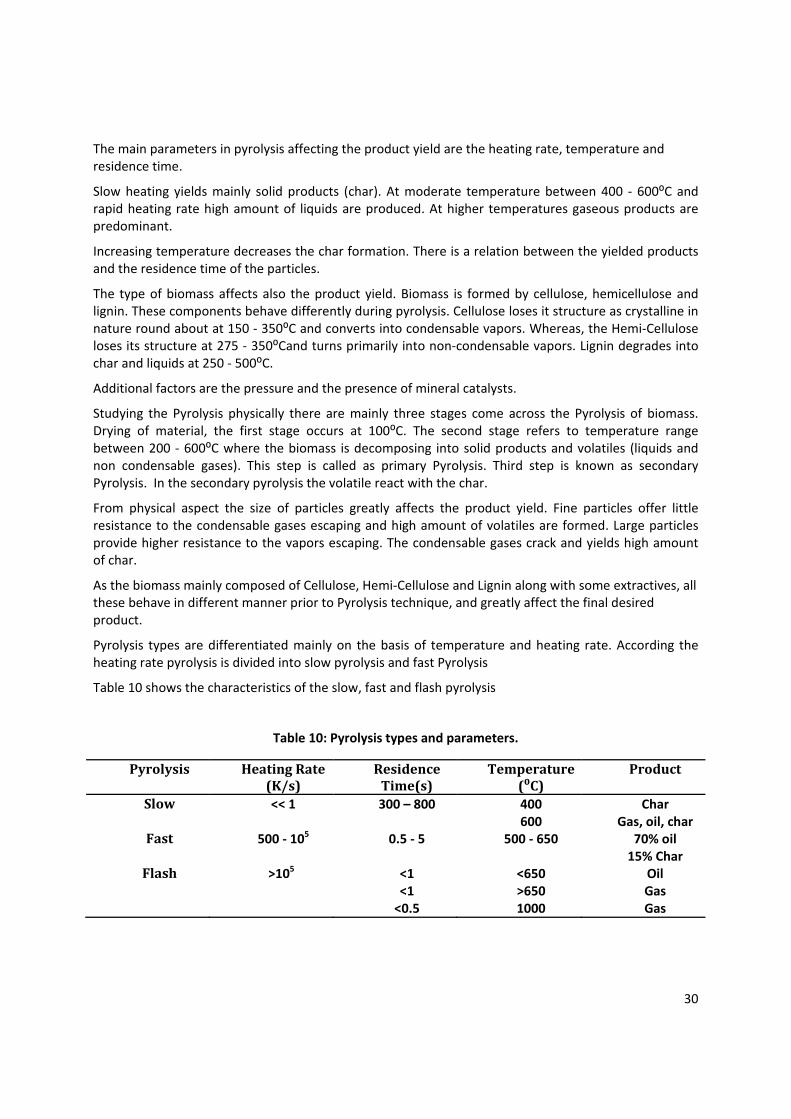
The main parameters in pyrolysis affecting the product yield are the heating rate, temperature and residence time.
Slow heating yields mainly solid products (char). At moderate temperature between 400 ‐ 600⁰C and rapid heating rate high amount of liquids are produced. At higher temperatures gaseous products are predominant.
Increasing temperature decreases the char formation. There is a relation between the yielded products and the residence time of the particles.
The type of biomass affects also the product yield. Biomass is formed by cellulose, hemicellulose and lignin. These components behave differently during pyrolysis. Cellulose loses it structure as crystalline in nature round about at 150 ‐ 350⁰C and converts into condensable vapors. Whereas, the Hemi‐Cellulose loses its structure at 275 ‐ 350⁰Cand turns primarily into non‐condensable vapors. Lignin degrades into char and liquids at 250 ‐ 500⁰C.
Additional factors are the pressure and the presence of mineral catalysts.
Studying the Pyrolysis physically there are mainly three stages come across the Pyrolysis of biomass. Drying of material, the first stage occurs at 100⁰C. The second stage refers to temperature range between 200 ‐ 600⁰C where the biomass is decomposing into solid products and volatiles (liquids and non condensable gases). This step is called as primary Pyrolysis. Third step is known as secondary Pyrolysis. In the secondary pyrolysis the volatile react with the char.
From physical aspect the size of particles greatly affects the product yield. Fine particles offer little resistance to the condensable gases escaping and high amount of volatiles are formed. Large particles provide higher resistance to the vapors escaping. The condensable gases crack and yields high amount of char.
As the biomass mainly composed of Cellulose, Hemi‐Cellulose and Lignin along with some extractives, all these behave in different manner prior to Pyrolysis technique, and greatly affect the final desired product.
Pyrolysis types are differentiated mainly on the basis of temperature and heating rate. According the heating rate pyrolysis is divided into slow pyrolysis and fast Pyrolysis
Table 10 shows the characteristics of the slow, fast and flash pyrolysis
Table 10: Pyrolysis types and parameters.
Pyrolysis Heating Rate (K/s)
Residence Time(s)
Temperature (⁰C)
Product
Slow << 1 300 – 800 400 600
Char Gas, oil, char
Fast 500 ‐ 105 0.5 ‐ 5 500 ‐ 650 70% oil 15% Char
Flash >105 <1 <1 <0.5
<650 >650 1000
Oil Gas Gas

31
3.5.1 Slow Pyrolysis: Slow Pyrolysis is the conventional and oldest known technique employed. It deals with low range of temperature i.e. around 400⁰C. It’s a batch process and takes long time to produce char. This technique is employed for charcoal production.
3.5.2 Fast Pyrolysis: Fast Pyrolysis deals with high heating rates. Reaction temperature is almost around 500⁰C in order to produce high amount of liquids. The residence time of the produced gases is very short, up to 6 s [34].
Basically it is used for the production of bio oil. The gases produced needs to be rapidly quenched in order to avoid secondary conversion. Figure 23 shows the fast pyrolysis process for production of bio oil [35].
Figure 23: Fast Pyrolysis System
Flash Pyrolysis is a type of fast Pyrolysis with very high heating rate. The main purpose to use flash Pyrolysis is to get liquid products from the selected biomass. Yields of bio‐oil higher than 70 % can be obtained (figure 24). The reactors which are currently being used for flash Pyrolysis are as follows;
• Fluidized bed reactors • Rotating cone reactor • Twin screw reactor • Ablative (blade or vortex) • Vacuum Pyrolysis

32
The problems related with flash pyrolysis concerns the high oxygen and water content in the pyrolysis liquids. Also the liquids are corrosive making the storage difficult. The pyrolysis liquid needs to be upgrade.
Figure 24: Flash Pyrolysis Study
During gasification in fluidized bed reactors the char is first produced by rapid pyrolysis at high temperature. The study of the rapid pyrolysis at temperatures above 700⁰C up to 950 ⁰C is important for the design and capacity of fluidized bed gasifier. The conditions under pyrolysis determine the reactivity of the char. The reaction between the char and the gasifying agent is the limiting step of the pyrolysis/gasification process.
4. Experimental The present work deals with the characterization of three Brazilian biomasses: Sewage Sludge, Peroba/ Garapeira (Fine wood dust) and Eucalyptus. The proximate analysis and thermogravimetric analysis were performed.
4.1 Proximate Analysis: The proximate includes the measurement of moisture content, volatile matter, fixed carbon and ash content of the biomass.
4.1.1 Moisture content: First of all the gross weight of the biomass sample was recorded. After then it was put in the drying oven to heat it up at a temperature of 110 ⁰C for nearly two hours and after then its weight was determined.

33
Then the sample was kept in the dessicator. After then it was heated again in the oven for 30 minutes. The measured weight loss was considered to be the moisture content present in the sample. The standard E871 describes the determination of moisture content for wood.
4.1.2 Fixed Carbon – Volatile Matter: Fixed carbon content was measured by putting the sample in a covered crucible in a vertical electrical tube furnace for a time of six minutes at a temperature of 950 ⁰C. The crucible was put into the dessicator. Then the measured weight was considered as fixed carbon. The weight loss is the volatile matter. The standard E872 describes the determination of fixed carbon/volatile matter for wood.
4.1.3 Ash Content: The sample was heated in the same vertical electrical tube furnace to a temperature of 750 ⁰C with some continuous increase in temperature for two hours. After all the carbon is burned the sample is cooled and weighted. The ASTM D‐1102 describes the determination of ash content for wood.
4.2 Thermo gravimetric Analysis (TGA): The thermal analysis techniques are employed to study the physical properties of a substance. The thermo gravimetric analysis measures the change in the weight of the sample as function of the temperature in controlled atmosphere.
This technique is also employed to determine the thermal stability of the samples when subjected to high range of temperature. It’s a good technique to study the effect of oxidation, dehydration and decomposition over weight gain or loss of the samples.
The equipment used for the TGA tests was a RB‐3000‐20. The heating rate was 10°C /min. Nitrogen has been used in order to ensure an inert atmosphere.
The pyrolysis is assumed to be a first order decomposition.
= k (y)
Where y is a characteristic of the progress of the reaction.
K (T) = A exp (‐E/RT)
Thus = A exp (‐E/RT) (y)
The temperature is changing during the time T = T0 + β T; β = dT/dt
β is the heating rate.
= A/ β exp (‐E/R(T) (y)
The kinetics parameter were determined according to Coatts and Redfern [38]

34
ln –
= ln
1 ‐
1 is close to 1.
Thus the plot ln (‐ln(1‐y) / T2) versus 1/T leads to a slope E/R. The y‐intercept is ln
From the slope, E can be determined and then A is determined by the y‐intercept.
4.3 Calorific value determination: It is the measure of energy content per Kg given by the particular fuel under consideration when it is burned.
The heat of combustion of a fuel is determined in a bomb calorimetric.
A schematic view of a calorimetric bomb is hereby from Figure 25 [36]. First of all a weighed amount of the biomass sample was sieved to uniform shape and then compressed. It was hanged into the sample container after fixing the wire connected to ignition circuit. Bomb was filled with pressurized oxygen. The metal container with the sample is placed in the water in an insulated container. The ignition was carried out via external electrical source and the initial and final temperature of the water was noted before and after the ignition.
A stirrer is used to homogenize the water temperature. The temperature of the water is noted after every minute until the temperature is constant. After ignition the increase of the water temperature is measured after every thirty seconds until it is stable during five minutes.
Both the bomb and the water in the calorimeter absorb heat. The heat absorbed by the water in the calorimeter is qwater = cwater ΔT. The heat absorbed by the bomb is qbomb = cbomb ΔT. The heat capacity of the bomb was given.
The heat absorbed by the bomb and water came from the combustion of the biomass. Assuming that there is no heat loss to the environment: qcalorimeter = qwater + qbomb = −qbiomass

35
Figure 25: Bomb Calorimeter
5. Results:
5.1 Calorific Value: The studied samples were Sewage Sludge, Peroba/ Garapeira (Fine wood dust) and Eucalyptus.
Because problems with the calorimetric bomb the calorific value of the samples was calculated using the ultimate analysis and proximate Analysis [37].
In this method the principle equations used are as follows;
For Ultimate Analysis: HHV = 0.2949(C) + 0.8250(H)
For Proximate Analysis: HHV = 0.1905(VM) + 0.2521(FC) VM: volatile matter; FC: Fixed carbon
The first correlation based on ultimate analysis has lower than 5% mean absolute error (MAE) and marginal mean bias error (MBE) is 0.57%. It has a good predictive quality. The second correlation based on proximate analysis has also a low MBE of 0.67% [37].
Table 11 shows the ultimate analysis of the studied samples and the calculated heating value using the ultimate analysis. Table 12 show the proximate analysis of the samples as well as the heating value calculated using the proximate analysis

36
Table 11: Ultimate Analysis and HHV
Biomass C% H% N% O% HHV
Sewage Sludge 29.8 4.19 1.42 64.49 12.24
Peroba/Garapeira 46.9 5.88 0.25 46.97 18.68
Eucalyptus 45.12 6.33 0.19 48.36 18.53
Table 12: Proximate Analysis and HHV
Biomass Ash Content (mf) Fixed Carbon % Volatiles % HHV
Sewage Sludge 34 6 60 12.94
Peroba /Garapeira 1 21.3 77.7 20.17
Eucalyptus 0.61 19 80.39 20.10
The wood samples (eucalyptus and Peroba/Garapeira) have higher heating value than the sewage sludge because the wood samples have higher amounts of carbon and hydrogen than the sewage sludge. In reference to the proximate analysis the sewage sludge has higher ash content and lower amount of volatiles and fixed carbon than the wood samples resulting in a lower heating value.
5.2 Thermogravimetric Analysis: The Figure 26 shows the thermogravimetric curves, weight loss (w = m/m0) as function of temperature.
Woody biomass and sewage sludge present different behavior.
In the case of eucalyptus and garapeira, in the first zone, up to 200 °C, the samples are less affected by the temperature rise and the pyrolysis has not yet started. In the second zone, between 225 °C ‐ 375 °C (for eucalyptus) and 225 °C ‐ 425 °C (for garapeira), the thermal decomposition of the biomass leads to significant weight loss. The pyrolysis reactions take place mainly in this zone. In the third zone from 375 °C – 425 °C up to 700 °C the samples have been in large extent already carbonized, thus the weight loss is low.
The weight loss for Eucalyptus between 265°C and 350°C is 0.48 % / °C and taking into account a heating rate of 10°C/min, the weight loss is 4.8 % /min. Garapeira has a similar behavior than eucalyptus. The

37
weight loss for garapeira between 265°C and 365°C is 0.4 % / °C and taking into account a heating rate of 10°C/min, the weight loss is 4 % /min.
In the third zone the weight loss for eucalyptus is 0.035%/°C (0.35%/min) and for garapeira is 0,046 %/°C (0,46%/min).
The behaviors of eucalyptus and garapeira in the thermogravimetric analysis are quite similar but the eucalyptus is little more reactive to pyrolysis than garapeira.
Figure 26: TGA of biomass samples
The behavior of the sewage sludge to the increase of temperature from 25°C to 700 °C in an inert atmosphere do not show such different zones as the behavior of the woody biomass. Between 150 °C and 235°C the weight loss of the sewage sludge was 0.07 %/°C (0.7 %/min). The highest weight loss takes place between 300 °C and 390 °C (0.15 %/°C or 1.5 %/min). In the third zone, between 500 °C and 600°C, the weight loss was 0.03 %/°C (0.3 %/min).
The pyrolysis is assumed to be a first order decomposition. According the model mentioned in 4.2, a plot
ln (‐ln(1‐y) / T2) versus 1/T is performed (figure 27). The slope is E/R. The y‐intercept is ln

38
From the slope, E can be determined. A is determined by the y‐intercept
Figure 27: Kinetic plot of the decomposition of the studied biomass
The activation energy (E) and the pre exponential factor (A) are calculated in table 12.
Table 13: Estimated parameters E and A
Sample material E [kJ/mol] A [1/s]Eucalyptus 64.93 1277 Peroba/Garapeira 51,51 37 Sewage Sludge 15.21 0.004
‐15,5
‐15
‐14,5
‐14
‐13,5
‐13
‐12,5
1,65 1,7 1,75 1,8 1,85 1,9 1,95
Sewage Sludge
Peroba/Garapeira
Eucalyptus
ln((‐ln
(1‐y)/T2)
1/T [1/K]

39
Figure 28: Proximate Analysis of Biomass
The proximate analysis shows differences between the woody biomass and the sewage sludge. The sewage sludge has higher ash content and lower fixed carbon and volatiles (figure 28). Eucalyptus has lower carbon fixed and higher volatiles than peroba‐garapeira.
6. Conclusions
The wood samples (Eucalyptus and Peroba/Garapeira) have higher heating value than the sewage sludge because the wood samples have higher amounts of carbon and hydrogen than the sewage sludge. The sewage sludge has higher ash content and lower amount of volatiles and fixed carbon than the wood samples resulting in a lower heating value.
The pyrolysis of eucalyptus, garapeira/peroba and sewage sludge has been studied in a thermobalance over a wide range of degradation temperatures. Between 225 °C ‐ 375 °C (for eucalyptus) and 225 °C ‐ 425 °C (for garapeira), the thermal decomposition of the biomass leads to significant weight loss.
The weight loss for Eucalyptus between 265°C and 350°C is 0.48 % / °C and taking into account a heating rate of 10°C/min, the weight loss is 4.8 % /min. Garapeira has a similar behavior than eucalyptus. The
0
10
20
30
40
50
60
70
80
90
Sewage Sludge Peroba/Garapeira Eucalyptus
Proximate Analysis
Ash Content%(mf)
Ash Content%(mf)
Fixed Carbon %
Fixed Carbon %
Volatiles %

40
weight loss for garapeira between 265°C and 365°C is 0.4 % / °C and taking into account a heating rate of 10°C/min, the weight loss is 4 % /min.
The behavior of the sewage sludge to the increase of temperature from 25°C to 700 °C in an inert atmosphere do not show such different zones as the behavior of the woody biomass. Between 150 °C and 235°C the weight loss of the sewage sludge was 0.07 %/°C (0.7 %/min). The highest weight loss takes place between 300 °C and 390 °C (0.15 %/°C or 1.5 %/min). In the third zone, between 500 °C and 600°C, the weight loss was 0.03 %/°C (0.3 %/min).
The pyrolysis is assumed to be a first order decomposition. The activation energy (E) and the pre exponential factor (A) are calculated for the studied samples.
The proximate analysis shows differences between the woody biomass and the sewage sludge. The sewage sludge has higher ash content and lower fixed carbon and volatiles. Eucalyptus has lower carbon fixed and higher volatiles than peroba‐garapeira.
The ash content is also quite case sensitive issue when talking about gasification fuels. Higher ash content leads to slagging and the clinker formation in the gasifiers as the ash contains some un‐burnt fuels which in heating process go into the agglomerates. Slagging and the clinker formation together lead the process of gasification towards high formation of tar and at last choking of the gasifier. Normal limits of ash content in the fuels takes as ideal as below 5%. In our lab results it can be seen that both eucalyptus and garapeira contain pretty low values of ash content i.e. 0.61 and 1 respectively. The Sewage Sludge contains high amount of ash content.
7. References:
[1] Scienzagiovane, Solar Energy and photovoltaic roofs, Glossary, http://www.scienzagiovane.unibo.it
[2] Sissine, F; Renewable Energy: Background and Issues for the 110th Congress, CRS Report for Congress, 2007¸ http://fpc.state.gov/documents/organization/92953.pdf
[3] Oil prices: www.ioga.com/Special/crudeoil_Hist.htm CPI‐U Inflation index www.bls.gov
[4] Biomass energy centre, What is Biomass, http://www.biomassenergycentre.org.uk/
[5] The Future of Bioenergy and Biomass Brazil, World of Energy, http://www.worldofbioenergy.com/bioenergy/the_future_of_bioenergy_and_biomass_brazil.html
[6] Brazil & the World’s crop production 2009, FAOSTAT, http://faostat.fao.org/
[7] Missagia, B, Ferreira Silva Correa, M, Krautz H‐J, Ay, P, Schluchter, W; Agricultural and forestry residues as an alternative energy resource for Brazil – the production of biomass pellets, Forum der Forschung, 22, 2009, p. 85‐90.
[8] Basto Oliveira, L., Pinguelli Rosa, L, Brazilian waste potential: energy, environmental, social and economic benefits, Energy Policy 31 (2003) 1481–1491
[9] Global Forest Resources , Assessment 2010, Brazil, Country report, FAO, Country Department, 2009. http://www.fao.org/forestry/20288‐0f6ee8584eea8bff0d20ad5cebcb071cf.pdf
41
[10] CENBIO, Report Project “Competence Platform on Energy Crop and Agroforestry System for Arid and Semi‐arid Ecosystems – Africa”, 2009, http://www.compete‐bioafrica.net/international/Annex4‐2‐2‐COMPETE‐032448‐2ndReport‐D4.1‐Brazil‐Final.pdf
[11] Brazil’s Energy Matrix and Prospects for Energy Integration with South America, 2010 Deloitte Touche Tohmatsu Limited, http://www.deloitte.com/assets/Dcom‐Brazil/Local%20Assets/Documents/Ind%C3%BAstrias/Petr%C3%B3leo%20e%20G%C3%A1s/Brazil's%20Energy%20Matrix.pdf
[12] Socco, VR, Vandenberghe, Medeiros AB, Bioethanol from lignocelluloses: Status and perspectives in Brazil, Bioresour Technol. 2010 Jul;101(13):4820‐5.
[13] Lora, E.S., Andrade, R.V.Biomass as energy source in Brazil, Renewable and Sustainable Energy Reviews, 13, 4, May 2009, 777–788
[14]News Mongabay.com; http://news.mongabay.com/2008/0513‐brazil.html
[15] Pettersen, R., The Chemical Composition of Wood, in Rowell, Roger M., ed. The chemistry of solid wood. Advances in chemistry series 207. Washington, DC: American Chemical society; 1984: Chapter 2.
[16] Foelkel, Celso, Eucaplytus in Brazil, lecture. http://www.celso‐foelkel.com.br/artigos/Palestras/Eucalyptus%20in%20Brazil.%201999.pdf
[17] GARA PEIRA at http://www.madeiras.cc/garapeira.html
[18] Xie L., Li T., Gao J., Fei X., Wu X., Jian Y., Effect of moisture content in sewage sludge on air gasification, J Fuel Chem Technol, 2010, 38(5), 615‐620
[19] Clarke MA. Sugar processing raw and refined sugar manufacture. In: Clarke MA, Godshall MA, editors. Chemistry and processing of sugarbeet and sugarcane, Amsterdam: Elsevier Science, 1988
[20] Hellwig G. Basic of the combustion of wood and straw. In: Palz W, Coombs J, Hall DO, editors. Energy from Biomass, 3rd E.C. Conference, London: Elsevier Applied science, 1985. P. 793‐8
[21] [Saastamionen JJ. Fundamentals of biomass drying, Pyrolysis and combustion. IEA, Biomass Combustion Conference, AII, Cambridge, 1994.]
[22] Meschgbiz A, Krumbeck M. Combined combustion of biomass and brown coal in a pulverized fuel and fluidized bed of combustion plant. In: Bemtgen JM, Hein KRG, Minchener AJ, editors. Combined combustion of Biomass/Sewage Sludge and Coals, Final Reports, EC‐Research Project, APAS‐contract COAL‐CT92‐0002, 1995.
[23] Bapat DW, Kulkarni SV, Bhandarkar VP. Design and operating experience on fluidized bed boiler burning biomass fuels with high alkali ash. In: Preto FDS, editor. Proceedings of the 14th International. Conference on Fluidized Bed Combustion, Vancouver, New York, NY : ASME, 1997 . p. 165‐74
[24] Wilen C, Ståhlberg P, Sipilä K, Ahokas J. Pelletization and combustion of straw. In: Klass DL, editor. Energy from biomass and wastes, X. London: Elsevier Applied science, 1987. p. 469‐83
[25] Brendörfer M. Joint enterprise and utilization of a briquetting plant for straw. In: Palz W, Coombs J, Hall DO, editors. Energy from Biomass, 3rd E.C. Conference, London: Elsevier Applied Science, 1985.p. 773‐7
[26] Rousset, P., Caldeira‐Pires, A., Sablowski, A., Rodrigues, T., LCA of eucalyptus wood charcoal briquettes, Journal of Cleaner Production 19 (2011) 1647‐1653

42
[27] Mani, S., Sokhansanj, S., Bi, X., Turhollow, A., Economics of producing fuel pellets from biomass, Applied Engineering in Agriculture Vol. 22(3), 2006, 421‐426
[28]Rajvanshi, A. K., Biomass gasification, in book “Alternative Energy in Agriculture”, Vol. II, Ed. D. Yogi Goswami, CRC Press, 1986, 83‐102..
[29]Chopra, S. , Anil K Jain A.K., A Review of Fixed Bed Gasification Systems for Biomass, Agricultural Engineering International: CIGR Journal, ISSN 1682‐1130, vol. IX, 2007,
[30] ] Tunå, Per, Substitute Natural Gas from Biomass Gasification, Synopsis of Master Thesis, March 2008, Department of Chemical Engineering, Lund University, P. O. Box, 124, SE‐221 00 Lund, Sweden
[31] Klass, Donald L. (1998). Biomass for Renewable Energy, Fuels, and Chemicals. Elsevier. Online version available at: http://www.knovel.com/web/portal/browse/display?_EXT_KNOVEL_DISPLAY_bookid=2245&VerticalID=0
[32] Meier D, Faix O. State of the art of applied fast pyrolysis of lignocellulosic materials––a review. BiosourceTechnol 1999;68(1):71–7.
[33] Gullu D, Demirbas A. Biomass to methanol via pyrolysis process. Energy Conv Manage 2001;42:1349–56.
[34] Bridgwate , A.V., Principles and practice of biomass fast pyrolysis processes for liquid . Journal of Analytical and Applied Pyrolysis 51 (1999) 3–22.
[35] Brown, R., Schematic diagram of fast Pyrolysis. http://biocharfarms.org/biochar_production_energy/
[36] François G. Amar. Bomb Calorimetry http://chemistry.umeche.maine.edu/~amar/spring2011/bomb.html
[37]Prediction of higher heating values of biomass from proximate and ultimate analyses, Chun‐Yang Yin, Fuel 90 (2011) 1128–1132
[38] A.W. coats, J.P. Redfern, nature, 201 (1964), p. 68.


![Methodology and assumptions for the Brazil Energy [R ... fileMethodology and assumptions for the Brazil Energy [R]evolution: Scenarios for a future energy supply . Sonja Simon, Hans](https://static.fdocuments.us/doc/165x107/5c64ff6f09d3f2a36e8c231b/methodology-and-assumptions-for-the-brazil-energy-r-and-assumptions-for-the.jpg)