and Pulverized Mineral Processing From: John Richards … · and Pulverized Mineral Processing...
50
1 Date: May 12, 2003 Subject: Background Information for Revised AP-42 Section 11.19.2, Crushed Stone Processing and Pulverized Mineral Processing From: John Richards Air Control Techniques, P.C. To: William Kuykendal, EPA/EIB/EFMS (MD-14) U. S. Environmental Protection Agency Research Triangle Park, NC 27711 I. INTRODUCTION This memorandum presents the background information that was used to develop the revised AP-42 Section 11.19.2 on crushed stone processing and pulverized mineral processing. Emission data from nine emission tests conducted at stone (granite and limestone) processing plants were used to develop emission factors for various crushing, screening, and conveying operations. Descriptions of these test reports are provided in Section II of this memorandum. In addition, the references from the previous version of AP-42 Section 11.19.2 were reviewed. Tables 1 and 2 present PM-10 emission data and the new PM-10 emission factors developed for inclusion in the revised AP-42 section. Tables 3 and 4 present PM emission data and the new PM emission factors developed for inclusion in the revised AP-42 section. Tables 5 and 6 present PM-2.5 emissions data and the new PM-2.5 emission factors developed for inclusion in the revised AP-42 section. The AP-42 section narrative also was revised to include current terminology and industry practices. Emissions data for pulverized mineral processing operations have been added to AP-42 Section 11.19.2. Previously, information concerning this segment of the crushed stone industry has not been available in AP-42. Data concerning pulverized mineral processing operations are a logical extension of stone crushing plant data because (1) the quarry, initial crushing, and screening operations are identical to those in stone crushing plants and (2) the specific processes used to produce pulverized minerals are quite different than those used in other industrial categories, such as sand and gravel operations. Emissions data from seven emission tests at four pulverized mineral processing plants have been included. Tables 7 and 8 present PM-10 data and the new emission factors for four categories of pulverized mineral processing operations. Tables 9 and 10 present PM emission data and the new PM emission factors developed for inclusion in the revised AP-42 section. Tables 11 and 12 present PM-2.5 emissions data and the new PM- 2.5 emission factors developed for inclusion in the revised AP-42 section
-
Upload
truonghuong -
Category
Documents
-
view
216 -
download
1
Transcript of and Pulverized Mineral Processing From: John Richards … · and Pulverized Mineral Processing...

1
Date: May 12, 2003 Subject: Background Information for Revised AP-42 Section 11.19.2, Crushed Stone Processing
and Pulverized Mineral Processing From: John Richards Air Control Techniques, P.C. To: William Kuykendal, EPA/EIB/EFMS (MD-14) U. S. Environmental Protection Agency Research Triangle Park, NC 27711 I. INTRODUCTION
This memorandum presents the background information that was used to develop the revised AP-42 Section 11.19.2 on crushed stone processing and pulverized mineral processing. Emission data from nine emission tests conducted at stone (granite and limestone) processing plants were used to develop emission factors for various crushing, screening, and conveying operations. Descriptions of these test reports are provided in Section II of this memorandum. In addition, the references from the previous version of AP-42 Section 11.19.2 were reviewed. Tables 1 and 2 present PM-10 emission data and the new PM-10 emission factors developed for inclusion in the revised AP-42 section. Tables 3 and 4 present PM emission data and the new PM emission factors developed for inclusion in the revised AP-42 section. Tables 5 and 6 present PM-2.5 emissions data and the new PM-2.5 emission factors developed for inclusion in the revised AP-42 section. The AP-42 section narrative also was revised to include current terminology and industry practices. Emissions data for pulverized mineral processing operations have been added to AP-42 Section 11.19.2. Previously, information concerning this segment of the crushed stone industry has not been available in AP-42. Data concerning pulverized mineral processing operations are a logical extension of stone crushing plant data because (1) the quarry, initial crushing, and screening operations are identical to those in stone crushing plants and (2) the specific processes used to produce pulverized minerals are quite different than those used in other industrial categories, such as sand and gravel operations. Emissions data from seven emission tests at four pulverized mineral processing plants have been included. Tables 7 and 8 present PM-10 data and the new emission factors for four categories of pulverized mineral processing operations. Tables 9 and 10 present PM emission data and the new PM emission factors developed for inclusion in the revised AP-42 section. Tables 11 and 12 present PM-2.5 emissions data and the new PM-2.5 emission factors developed for inclusion in the revised AP-42 section

2
II. DESCRIPTION OF REFERENCES A. Reference 1 This test report documents an emission test conducted at a Martin Marietta stone crushing plant in Raleigh, North Carolina. The test was conducted for the Emission Inventory Branch (EIB) of the U. S. Environmental Protection Agency (EPA) as part of an emission test program undertaken to provide emission data on stone crushing for AP-42 emission factor development. Uncontrolled and controlled particulate matter less than 10 micrometers in diameter (PM-10) emissions from a vibrating screen were measured using EPA Method 201A in conjunction with a track-mounted hood system that was used to capture fugitive emissions from the screen. The vibrating screen consisted of three vertically stacked decks. The upper deck had a mesh opening of 2.86 centimeters (cm) square (1.125 inches [in.] square) for the first 3.66 meters (m) (12 feet [ft]) and 2.54 cm square (1 in. square) for the last 2.44 m (8 ft). The middle deck had a mesh opening of 1.47 cm square (0.58 in. square), and the lower deck had slot openings of 0.30 cm (0.118 in.) by 2.54 cm (1 in.). Ambient levels of PM-10 were quantified using PM-10 HiVol samplers, and the ambient concentrations were subtracted from the Method 201A PM-10 concentrations to determine the actual emissions from the screen. Wet suppression was used to control emissions from the screen. Water spray nozzles were located on the conveyor underneath the tertiary crusher, at one conveyor transfer point, at the top of the stream conveyor above the vibrating screen, and on the inlet chute to the vibrating screen. The targeted moisture contents of the raw material (granite) during the uncontrolled and controlled runs were <1.5 percent and ≥1.5 percent, respectively. Average material moisture contents are shown in Table 1. In addition, sieve analyses were performed on stone samples taken from the conveyor that feeds the screen. Silt content of the stone as sampled (wet) was negligible, and the average silt content of the sample after drying was 3.35 percent. The relatively small amount of silt particles (<75 µm) present in the raw material suggests that the potential for PM-10 emissions from the material processing operations was low.
Uncontrolled and controlled PM-10 emission factors were developed from the emission data and the material processing rates that were measured during the testing. These emission factors are shown in Table 1. The emission factors presented differ slightly from the emission factors reported in the test report because average production rates were used in the test report, whereas actual run-by-run production rates were used in the data analyses presented in this memorandum. The data are assigned an A rating. The report provided adequate detail, the test methodology was sound, and no problems were reported. B. Reference 2
This test report documents an emission test conducted at a Martin Marietta stone crushing plant in Garner, North Carolina. The test was conducted for EIB as part of an emission test program undertaken to provide emission data on stone crushing for AP-42 emission factor development. Uncontrolled and controlled PM-10 emissions from a Model 1560 Omnicone conical-type tertiary crusher were measured using EPA Method 201A in conjunction with a quasi-stack system, which was used to capture fugitive emissions from the crusher. The crusher reduces 8.9- to 10.2-cm (3.5- to 4-in.) stone to 2.5 cm (1 in.) and smaller. The crusher inlet and outlet were enclosed and tested separately. Wet suppression was used to control emissions from the crusher. Water spray nozzles were located on the conveyor underneath the tertiary crusher, at one conveyor transfer point, and at the entrance to the surge bin and vibrating feeder.

3
The targeted moisture contents of the raw material (granite) during the uncontrolled and controlled runs were <1.5 percent and ≥ 1.5 percent, respectively. Average material moisture contents are presented in Table 1. In addition, sieve analyses were performed on stone samples taken from the conveyor that fed the surge bin prior to the crusher. The results of the sieve analyses are not documented in the test report.
Uncontrolled and controlled PM-10 emission factors were developed from the emission data and the material processing rates that were measured during the test. These emission factors are shown in Table 1. The PM-10 data are assigned an A rating. The report provided adequate detail, the test methodology was sound, and no problems were reported. C. Reference 3
This test report documents an emission test conducted at a Vulcan Materials Company stone crushing plant in Skippers, Virginia. The test was conducted for the National Stone, Sand and Gravel Association to determine emission factors for various stone crushing process operations. Uncontrolled and controlled PM-10 emissions from a cone crusher (tertiary crusher) and a vibrating screen were measured using EPA Method 201A in conjunction with a quasi-stack and a track-mounted hood system, which were used to capture fugitive emissions from the crusher and screen, respectively. The crusher produces stone that is 7.6 cm (3 in.) and smaller in size. The vibrating screen consisted of three vertically stacked decks. The upper deck had a mesh opening of 2.86 cm square (1.125 in. square) for the first 3.66 m (12 ft) and 2.54 cm square (1.0 in.) for the last 2.44 m (8 ft). The middle deck had a mesh opening of 1.47 cm square (0.58 in square), and the lower deck had slot openings of 0.30 cm (0.118 in.) by 2.54 cm (1.0 in.). Wet suppression was used to control emissions from both processes. Water spray nozzles were located on the vibrating feeder to the crusher, on the conveyor below the crusher, and on the inlet chute to the Deister screens. The targeted moisture contents of the raw materials (granite) during the uncontrolled and controlled runs were < 1.5 percent and ≥1.5 percent, respectively. Average material moisture contents are shown in Table 1. In addition, sieve analyses were performed on stone samples taken from a process conveyor. The average silt content of the stone as sampled (wet) was 3.3 percent, and the average silt content of the sample after drying was 4.0 percent. The relatively small amount of silt particles (<75 µm) present in the raw material suggests that the potential for PM-10 emissions from the material processing operations was low.
Uncontrolled and controlled PM-10 emission factors were developed from the emission data
gathered and the material processing rates that were measured during the test. These emission factors are shown in Table 1. The PM-10 data are assigned an A rating. The report provided adequate detail, the test methodology was sound, and no problems were reported.
The PM data were not reported by the testing contractor, were not subject to quality assurance review during the testing project, and were not anticipated in the test program protocol prepared prior to the tests. The PM data have been calculated by Midwest Research Institute (MRI) from laboratory sample catch weight data included in the test report. Although Method 201A is not the reference method for quantifying PM emissions, the preseparator and filter catch for the method should provide an indication of PM emissions. The PM data have been assigned a C rating. The report provided adequate detail, the test methodology was sound, and no problems were reported. D. Reference 4
4
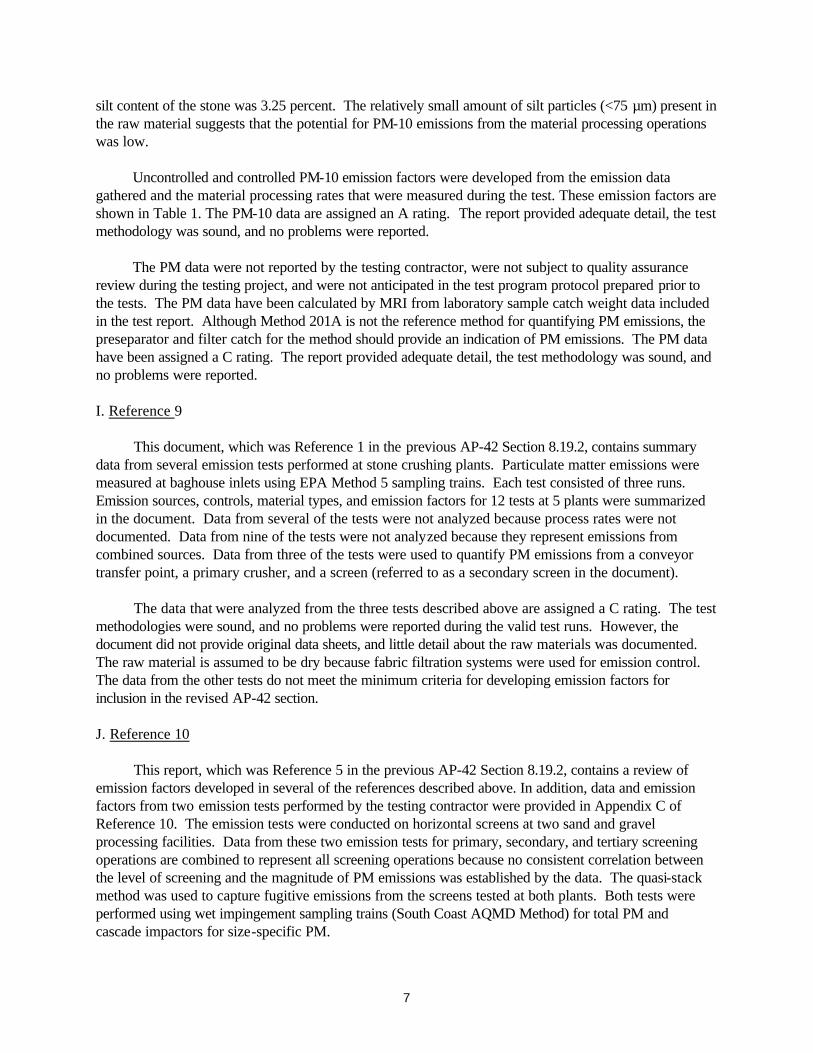
This test report documents an emission test conducted at a Nello L. Teer stone crushing plant in Raleigh, North Carolina. The test was conducted for EIB as part of an emission test program undertaken to provide emission data on stone crushing for AP-42 emission factor development. Uncontrolled and controlled PM-10 emissions from a Model 1560 Omnicone conical-type crusher (fines crusher) and a TD Seco vibrating screen (fines screen) were measured using EPA Method 201A in conjunction with a quasi-stack and a track-mounted hood system, which were used to capture fugitive emissions from the crusher and screen, respectively. The crushers reduced 2.5- to 1.9-cm (1- and 0.75-in.) stone to 0.476 cm (0.188 in.) and smaller. The screen consisted of three decks. The top and middle decks were 2.22 and 1.43 cm square (0.875 and 0.563 in. square), respectively. The bottom deck had slots of 0.476 by 2.54 cm. (0188 by 1 in.) The crusher inlet and outlet were each enclosed and tested separately. Wet suppression was used to control emissions from both processes. Water spray nozzles were located at the crusher inlet, midway through the crusher body, at the crusher outlet, and at the conveyor transfer point to the screen. The targeted moisture contents of the raw material (granite) during the uncontrolled and controlled runs were < 1.5 percent and ≥ 1.5 percent, respectively. Average material moisture contents are presented in Table 1. In addition, sieve analyses were performed on stone samples taken from the conveyor that fed the screen and the conveyor that carried the crusher product. The results of the sieve analyses are not documented in the test report.
Uncontrolled and controlled PM-10 emission factors were developed from the emissions data and
the material processing rates that were measured during the test. These emission factors are shown in Table 1. The PM-10 data are assigned an A rating. The report provided adequate detail, the test methodology was sound, and no problems were reported during the valid test runs.
The PM data were not reported by the testing contractor, were not subject to quality assurance review during the testing project, and were not anticipated in the test program protocol prepared prior to the tests. The PM data have been calculated by MRI from laboratory sample catch weight data included in the test report. Although Method 201A is not the reference method for quantifying PM emissions, the preseparator and filter catch for the method should provide an indication of PM emissions. The PM data have been assigned a C rating. The report provided adequate detail, the test methodology was sound, and no problems were reported. E. Reference 5
This test report documents an emission test at a Wake Stone Corporation stone crushing plant in Knightdale, North Carolina. The test was conducted for EIB as part of an emission test program undertaken to provide emission data on stone crushing for AP-42 emission factor development. Uncontrolled and controlled PM-10 emissions from two separate conveyor transfer points were measured using EPA Method 201A in conjunction with quasi-stack systems, which were used to capture fugitive emissions from the two transfer points. Wet suppression was used to control transfer point emissions. Water spray nozzles were located on the exit conveyor underneath each transfer point and at numerous other locations throughout the process. The targeted moisture contents of the raw materia l (granite) during the uncontrolled and controlled runs were <1.5 percent and ≥ 1.5 percent, respectively. Average material moisture contents are presented in Table 1. In addition, sieve analyses were performed on stone samples taken from each of the conveyor lines. The average silt content of the samples after drying was 1.4 percent for the first transfer point and 2.4 percent for the second transfer point. The relatively small amount of silt particles (<75 µm) present in the raw material suggests that the potential for PM-10 emissions from the material processing operations was low.

5
Uncontrolled and controlled PM-10 emission factors were developed from the emission data and the
material processing rates that were measured during the test. These emission factors are shown in Table 1. The PM-10 data are assigned an A rating. The report provided adequate detail, the test methodology was sound, and no problems were reported during valid test runs.
The PM data were not reported by the testing contractor, were not subject to quality assurance review during the testing project, and were not anticipated in the test program protocol prepared prior to the tests. The PM data have been calculated by MRI from laboratory sample catch weight data included in the test report. Although Method 201A is not the reference method for quantifying PM emissions, the preseparator and filter catch for the method should provide an indication of PM emissions. The PM data have been assigned a C rating. The report provided adequate detail, the test methodology was sound, and no problems were reported. F. Reference 6
This test report documents an emission test at a Martin Marietta stone crushing plant in Raleigh, North Carolina. The test was conducted for the National Stone, Sand and Gravel Association as part of an emission test program undertaken to provide emission data on stone crushing for AP-42 emission factor development. Uncontrolled and controlled PM-10 and PM emissions from a conveyor transfer point were measured using EPA Method 201A and EPA Method 5, respectively in conjunction with a quasi-stack system, which was used to capture fugitive emissions from the transfer point. Wet suppression was used to control transfer point emissions. Water spray nozzles are located on the exit conveyor underneath the transfer point and at numerous other locations throughout the process. The targeted moisture contents of the raw material (granite) during the uncontrolled and controlled runs were <1.5 percent and ≥ 1.5 percent, respectively. Average material moisture contents are presented in Table 1. In addition, sieve analyses were performed on stone samples taken from the conveyor. The average silt content of the dried stone was 2.2 percent. The relatively small amount of silt particles (<75 µm) present in the raw material suggests that the potential for PM-10 emissions from the material processing operations was low.
Uncontrolled and controlled PM-10 and PM emission factors were developed from the emission data and the material processing rates that were measured during the test. These emission factors are shown in Table 1. The PM-10 data and the PM (Method 5) data are assigned an A rating. The report provided adequate detail, the test methodology was sound, and no problems were reported during valid test runs.
The Method 201A derived PM data were not reported by the testing contractor, were not subject to quality assurance review during the testing project, and were not anticipated in the test program protocol prepared prior to the tests. The PM data have been calculated by MRI from laboratory sample catch weight data included in the test report. Although Method 201A is not the reference method for quantifying PM emissions, the preseparator and filter catch for the method should provide an indication of PM emissions. The Method 201A derived PM data have been assigned a C rating. The report provided adequate detail, the test methodology was sound, and no problems were reported. G. Reference 7

6
This test report documents an emission test conducted at a Vulcan Materials Company stone crushing plant in Bristol, Tennessee. The test was conducted for EIB as part of an emission test program undertaken to provide emission data on stone crushing for AP-42 emission factor development. Uncontrolled and controlled PM-10 emissions from a cone crusher (tertiary crusher) and a triple -deck vibrating screen were measured using EPA Method 201A in conjunction with a quasi-stack and a track-mounted hood system, which were used to capture fugitive emissions from the crusher and screen, respectively. The crusher produced stone 7.6 cm (3 in.) and smaller in size. The screen consisted of three vertically stacked decks. The upper deck had a mesh opening of 3.175 cm square (1.25 in. square). The middle deck had a mesh opening of 1.59 cm square (0.625 in. square), and the lower deck had a mesh opening of 0.635 cm square (0.25 in. square). Wet suppression was used to control emissions from both processes. Water spray nozzles were located in the feed hopper to the crusher and on the conveyor below the crusher. The targeted moisture contents of the raw material (limestone) during the uncontrolled and controlled runs were <l.0 percent and ≥ l.0 percent, respectively. Average material moisture contents are shown in Table 1. In addition, sieve analyses were performed on stone samples taken from a process conveyor. The average silt content of the stone was 1.8 percent. The relatively small amount of silt particles (<75 µm) present in the raw material suggests that the potential for PM-10 emissions from the material processing operations was low.
Uncontrolled and controlled PM-10 emission factors were developed from the emission data gathered and the material processing rates that were measured during the test. These emission factors are shown in Table 1. The PM-10 data are assigned an A rating. The report provided adequate detail, the test methodology was sound, and no problems were reported.
The PM data were not reported by the testing contractor, were not subject to quality assurance review during the testing project, and were not anticipated in the test program protocol prepared prior to the tests. The PM data have been calculated by MRI from laboratory sample catch weight data included in the test report. Although Method 201A is not the reference method for quantifying PM emissions, the preseparator and filter catch for the method should provide an indication of PM emissions. The PM data have been assigned a C rating. The report provided adequate detail, the test methodology was sound, and no problems were reported. H. Reference 8
This test report documents an emission test conducted at a Vulcan Materials Company stone crushing plant in Maryville, Tennessee. The test was conducted for EIB as part of an emission test program undertaken to provide emission data on stone crushing for AP-42 emission factor development. Uncontrolled and controlled PM-10 emissions from a cone crusher (tertiary crusher) and a triple -deck vibrating screen were measured using EPA Method 201A in conjunction with a quasi-stack and a track-mounted hood system, which were used to capture fugitive emissions from the crusher and screen, respectively. The crusher produced stone 7.6 cm (3 in.) and smaller in size. The screen consisted of three vertically stacked decks. The upper deck had a mesh opening of 3.175 cm square (1.25 in. square). The middle deck had a mesh opening of 1.59 cm square (0.625 in. square), and the lower deck had a mesh opening of 0.635 cm square (0.25 in. square). Wet suppression was used to control emissions from both processes. Water spray nozzles were located on the vibrating feeder to the crusher. The targeted moisture contents of the raw material (limestone) during the uncontrolled and controlled runs were < 1.0 percent and ≥ 1.0 percent, respectively. Average material moisture contents are shown in Table 1. In addition, sieve analyses were performed on stone samples taken from a process conveyor. The average
7
silt content of the stone was 3.25 percent. The relatively small amount of silt particles (<75 µm) present in the raw material suggests that the potential for PM-10 emissions from the material processing operations was low.
Uncontrolled and controlled PM-10 emission factors were developed from the emission data gathered and the material processing rates that were measured during the test. These emission factors are shown in Table 1. The PM-10 data are assigned an A rating. The report provided adequate detail, the test methodology was sound, and no problems were reported.
The PM data were not reported by the testing contractor, were not subject to quality assurance review during the testing project, and were not anticipated in the test program protocol prepared prior to the tests. The PM data have been calculated by MRI from laboratory sample catch weight data included in the test report. Although Method 201A is not the reference method for quantifying PM emissions, the preseparator and filter catch for the method should provide an indication of PM emissions. The PM data have been assigned a C rating. The report provided adequate detail, the test methodology was sound, and no problems were reported. I. Reference 9
This document, which was Reference 1 in the previous AP-42 Section 8.19.2, contains summary data from several emission tests performed at stone crushing plants. Particulate matter emissions were measured at baghouse inlets using EPA Method 5 sampling trains. Each test consisted of three runs. Emission sources, controls, material types, and emission factors for 12 tests at 5 plants were summarized in the document. Data from several of the tests were not analyzed because process rates were not documented. Data from nine of the tests were not analyzed because they represent emissions from combined sources. Data from three of the tests were used to quantify PM emissions from a conveyor transfer point, a primary crusher, and a screen (referred to as a secondary screen in the document).
The data that were analyzed from the three tests described above are assigned a C rating. The test methodologies were sound, and no problems were reported during the valid test runs. However, the document did not provide original data sheets, and little detail about the raw materials was documented. The raw material is assumed to be dry because fabric filtration systems were used for emission control. The data from the other tests do not meet the minimum criteria for developing emission factors for inclusion in the revised AP-42 section. J. Reference 10
This report, which was Reference 5 in the previous AP-42 Section 8.19.2, contains a review of emission factors developed in several of the references described above. In addition, data and emission factors from two emission tests performed by the testing contractor were provided in Appendix C of Reference 10. The emission tests were conducted on horizontal screens at two sand and gravel processing facilities. Data from these two emission tests for primary, secondary, and tertiary screening operations are combined to represent all screening operations because no consistent correlation between the level of screening and the magnitude of PM emissions was established by the data. The quasi-stack method was used to capture fugitive emissions from the screens tested at both plants. Both tests were performed using wet impingement sampling trains (South Coast AQMD Method) for total PM and cascade impactors for size-specific PM.
8
The PM data are assigned a C rating. The test methodology appeared to be sound, and no
problems were reported during the valid test runs. However, the report is a secondary reference and does not provide sufficient detail to warrant a B rating. The total particulate matter data are outliers in the emission factor data for screening operations. The PM-10 data are not rated because only single -run particle-size data are provided in the report. These data were not used in developing PM-10 and PM emission factors due to the lack of sufficient test runs and due to the lack of supporting test method and process data. K. Reference 11
This document, which was Reference 2 in the previous AP-42 Section 8.19.2, examines the granite crushing industry and the potential environmental impacts of industry emissions. Topics addressed include a source description, emissions, control technology, and growth and nature of the industry.
Emission factors for several granite crushing processes were developed using data from two granite processing facilities. Only summary information is provided in the document, although details on the processes and test methodology are provided. A GCA Model RDM 101-4 respirable dust monitor was used to sample PM-10 emissions, and emission rates were calculated using dispersion models. Emissions were sampled from several processes including dumping to the primary crusher and secondary crushing and screening. The monitor was placed about 100 feet from the source being sampled. No emission controls (for the plants tested) were specified, and the silt and moisture contents of the raw materials were not recorded.
The data do not meet the minimum criteria for developing emission factors for inclusion in the AP-42 section. The test methodology was not acceptable because only one monitor was used, and the monitor was too far from the source during testing. In addition, no details about the moisture and silt contents of the raw material were provided. L. Refrence 12
This document, which was Reference 3 in the previous AP-42 Section 8.19.2, examines the stone crushing industry and the potential environmental impacts of industry emissions. Topics addressed include a source description, emissions, control technology, and growth and nature of the industry.
Emission factors for several stone crushing processes were developed using data from two traprock processing facilities. Only summary information is provided in the document although details on the processes and test methodology are provided. A GCA Model RDM 101-4 respirable dust monitor was used to sample PM-10 emissions, and emission rates were calculated using dispersion models. Emissions were sampled from several processes including primary crushing and unloading, secondary crushing and screening, tertiary crushing and screening, fines crushing and screening, and conveying. The monitor was placed about 100 feet from the source being sampled. No emission controls were specified, and the silt and moisture contents of the raw materials were not recorded.
The data do not meet the minimum criteria for developing emission factors for inclusion in the AP-42 section. The test methodology was not acceptable because only one monitor was used, and the monitor was too far from the source during testing. In addition, no details about the moisture and silt contents of the raw material were provided.

9
M. Reference 13 This document is divided into four sections, which are addressed separately in the following discussion.
Section I discusses the emission study (sponsored by the construction aggregate industry) that was
performed by Monsanto Research Corporation (MRC) and The Research Corporation of New England (TRC). In addition, several conclusions about the control of fugitive dust emissions from construction aggregate processing facilities were drawn from a comparison of AP-42, MRC's source assessment studies, and the MRC-TRC study. These conclusions are that (1) AP-42 emission factors are from 10 to 10,000 times higher than the latest (1979) measurements of uncontrolled emissions; (2) baghouse emissions from aggregate crushing operations are often higher than uncontrolled emissions (apparently due to the suspension of fine particles, which are normally associated with larger particles and are not normally released to the atmosphere); (3) the emission factors developed by MRC in the source assessment program sponsored by EPA are within one order of magnitude of the emission factors developed in the MRC-TRC study, indicating that both data sets are highly reliable; (4) wet suppression can achieve between 80 and 90 percent control of the emissions from crushers; and (5) wet suppression is more efficient than fabric filters for controlling PM-10 emissions from crushers. To conclude Section I, an ambient air quality study performed at a sand and gravel production facility in Colorado is summarized. The study concluded that the sand and gravel processing operations did not have a detectable impact on air quality.
Section II documents the MRC study that included a compilation of emission data from tests at seven stone crushing plants that processed a variety of aggregates. Tests were conducted on four primary crushers, seven secondary crushers, three tertiary crushers, and two fines crushers. Aggregate types included granite (one plant), sand and gravel (two plants), traprock (one plant), and limestone (three plants). One of the limestone processing plants used wet suppression to control PM emissions. Emission factors for PM-10 and PM<50 µm were developed for all of the processes tested and were presented by process, aggregate type, and control methods.
A GCA Model RDM 101-4 dust monitor was used to detect fugitive PM emissions downwind of the process operations. The monitor was placed approximately 30 feet from the source during each test. The "tracer gas method" was used to determine the percentage of PM-10 measured with the GCA instrument that was emitted from the source being tested. The silt and moisture contents of the raw materials were not specified.
The data from this testing program do not meet the minimum criteria for developing emission factors for the revised AP-42 section because an adequate number of downwind monitors was not used during testing.
Section III documents the TRC study that included a compilation of emission data from tests at six stone crushing plants that processed a variety of aggregates. Tests were conducted on four primary crushers, six secondary crushers, three tertiary crushers, and one fines crusher. Aggregate types included granite (one plant), sand and gravel (two plants), traprock (one plant), and limestone (two plants). The granite processing plant and both limestone processing plants used wet suppression to control PM
10
emissions. Emission factors for PM-10 and PM<50 µm were developed for all of the processes tested and were presented by process, aggregate type, and control methods.
A GCA Model RDM 101-4 dust monitor was used to detect fugitive PM emissions downwind of the process operations. The monitor was placed approximately 30 feet from the source during each test. The tracer gas method was used to determine the percentage of PM-10 measured with the GCA instrument that was emitted from the source being tested. The silt and moisture contents of the raw materials were not specified.
The data from this testing program do not meet the minimum criteria for developing emission factors for the revised AP-42 section because an adequate number of downwind monitors was not used during testing.
Section IV, entitled "Semi-annual Report: Ambient Air Monitoring Program, Cannon-ERTL Site," contains no data that can be used for emission factor development. N. Reference 14
This report, which was Reference 4 in the previous AP-42 Section 8.19.2, is a compilation of emission factors from 16 test reports. The emission factors from all of the reports were rated and combined by process in order to develop a single emission factor for each process tested. Data quantifying PM-10 emissions from primary and secondary crushing operations (from NSPS Subpart OOO test reports) were not used for emission factor development because adequate details about the test methodology were not provided, and problems have been reported with cascade impactor tests performed before about 1981. The other data presented in this document are presented in several of the other references described in this review. O. Reference 15
This test report documents an emission test conducted at a Vulcan Materials Company stone crushing plant in Pineville, North Carolina. The test was conducted for the National Stone, Sand and Gravel Association as part of an emission factor test program undertaken to provide emission data on stone crushing for AP-42 emission factor development.
Controlled PM-10 and PM-2.5 emissions from a Model 1560 Omnicone conical-type tertiary
crusher and a 48-inch grya-disc fines crusher were measured using preliminary EPA Method 201B in conjunction with a quasi-stack system that was used to capture fugitive emissions from the crushers. The inlet and outlet of the crushers were each enclosed and tested simultaneously. Wet suppression was used to control emissions from the crushers.
Controlled PM-10 and PM-2.5 emissions from a conveyor transfer point were measured using
preliminary EPA Method 201B in conjunction with a quasi-stack system that was used to capture fugitive emissions from the transfer points. The inlet and outlet of the conveyor transfer point were each enclosed and tested simultaneously. Wet suppression was used to control emissions from the conveyor transfer point.
Controlled PM-10 and PM-2.5 emissions from a triple-deck vibrating screen were measured using
preliminary EPA Method 201B in conjunction with a track-mounted hood system that was used to capture

11
fugitive emissions from the screen. The screen consists of three vertically stacked decks. Wet suppression was used to control emissions. Ambient PM-10 and PM-2.5 concentrations were measured during the period of each test run. The ambient air concentrations were subtracted from the observed PM-10 and PM-2.5 concentrations measured in the hood exhaust system.
Average material moisture content data (wet suppression controls in operation) are shown in Table
5. In addition, sieve analyses were performed on stone samples taken from the process conveyor. The average silt content of the stone was 2.18 percent. The relatively small amount of silt particles (<75 µm) present in the raw material suggests that the potential for PM-l0 emissions from the material processing operations was low.
Controlled PM-10 and PM-2.5 emission factors were developed from the emission data and the
material processing rates that were measured during the test. These emission factors are shown in Table 6. The data are assigned an A rating. The report provided adequate detail, the test methodology was sound, and no problems were reported.
P. Reference 16. This report summarizes a set of seven emission tests conducted at four separate pulverized mineral processing plants. The sources tested included four grinding operations, one classifier, one flash dryer, and one product silo. All of the sources tested were controlled by pulse jet or envelope type fabric filters. These tests were conducted for the National Stone, Sand and Gravel Association as part of an emission test program undertaken to provide emission data on pulverized mineral processing operations for AP-42 emission factor development.
Controlled PM, PM-10, and PM-2.5 emissions from two roller mills, a horizontal ball mill, and a
vertical ball mill were measured using preliminary EPA Method 201B. The mass median diameters of the products from these grinding operations ranged from 2 micrometers to 65 micrometers. Production rates varied from a low of 0.5 tons per hour to more than 20 tons per hour. The materials processed in these grinding operations included calcium carbonate, talc, and barite. The emission data for the vertical ball mill are considered an outlier for pulverized mineral industry grinding operations. The particulate matter concentration data for this source are more than a factor of twenty above the levels associated with similar processes tested as part of this overall project. A comparison of the PM emissions data obtained during this test with previous data from the same source indicates that the emissions are also more than a factor of twenty above baseline levels. This level of difference is well beyond the routine variability in emissions associated with a fabric filter controlled source. A t-test of the run means for the tests with previous test run data indicates that there is a difference in means that is significant at more than the 99% confidence level. For this reason, the emissions data from this test have been listed as an excluded outlier.
Controlled PM, PM-10, and PM-2.5 emissions were measured from a classifier using preliminary EPA Method 201B. The mass median diameter of the product being handled in this process was 6 micrometers, and the production rate was 1.8 tons per hour. Calcium carbonate was being processed in the classifier tested.
Controlled PM, PM-10, and PM-2.5 emissions were measured from a flash dryer classifier using
preliminary EPA Method 201B. The mass median diameter of the product being handled in this process
12
was 6 micrometers, and the production rate was 11.1 tons per hour. Calcium carbonate was being processed in the flash dryer tested.
Controlled PM, PM-10, and PM-2.5 emissions were measured from a product storage silo using
preliminary EPA Method 201B. The mass median diameter of the product being handled in this process was 3.5 micrometers, and the production rate was 2 tons per hour. Calcium carbonate was being handled in the product storage silo.
Controlled emission factors were developed from the emission data and the material processing rates that were measured during the test. These emission factors are shown in Tables 7 through 12. The PM-10 and PM-2.5 data are assigned an A rating. The PM data are assigned a B rating. The data were obtained using full quality assurance procedures; however, Method 201A is not a reference method for PM. The report provided adequate detail, the test methodology was sound, and no problems were reported. Q. Reference 17
This test program was conducted to determine the PM emissions from a 66 inch Roller Mill grinding system at the Franklin Industrial Minerals plant at Sherwood, Tennessee. Limestone rock of approximately 1.125 inches is reduced to a size of which 82% is passing 200 mesh in the grinding system. A closed loop classifier with a flash dryer for inlet air is used as part of the grinding system. Dry, undersized limestone particles are entrained from the grinding system and are transported to a conventional pulse jet fabric filter system. The tests were conducted in a two foot diameter stack located downstream of the system induced draft fan. The grinding system production rate during the Method 5 test program was at or near the maximum rated production level.
The PM data are assigned an A rating. The test methodology appeared to be sound, and no
problems were reported during the test runs. The three test runs were conducted in full accordance with all Method 5 testing requirements and quality assurance procedures. The report included adequate documentation of all testing procedures and process operating conditions. R. Reference 18
Reference Method 5 tests for PM were conducted at the stack serving Baghouse 37 at the Franklin Industrial Minerals plant in Dalton, Georgia. The system tested serves a pulverized limestone product storage silo and truck loadout system. During the test program, the system operated at or near the maximum rated throughput capacity. The baghouse operated at a tubesheet static pressure drop ranging from 3 to 4 inches water gauge.
The PM data are assigned an A rating. The test methodology appeared to be sound, and no
problems were reported during the test runs. The three test runs were conducted in full accordance with all Method 5 testing requirements and quality assurance procedures. The report included adequate documentation of all testing procedures and process operating conditions.
S. Reference 19
Reference Method 5 tests for PM were conducted at the stack serving Baghouse BH-750 at the Franklin Industrial Minerals plant in Alabaster, Alabama. The system tested serves a pulverized limestone
13
grinding operation and truck loadout operation. During the test program, the system operated at or near the maximum rated throughput capacity. The baghouse operated at a tubesheet static pressure drop of 1.5 inches water gauge.
The PM data are assigned an A rating. The test methodology appeared to be sound, and no
problems were reported during the test runs. The three test runs were conducted in full accordance with all Method 5 testing requirements and quality assurance procedures. The report included adequate documentation of all testing procedures and process operating conditions.
T. Reference 20
The test program concerned Flash Dryer #1 used for drying wet ground pulverized limestone material at the Omya, Inc. plant in Florence, Vermont. The effluent gas stream from the dryer is controlled by a fabric filter system. During the test program, Flash Dryer #1 operated at or near its maximum rated capacity. Product characteristics were typical of normal operations. Emission tests were conducted in a stack located downstream of the induced draft fan for the flash drying system.
The PM data are assigned an A rating. The test methodology appeared to be sound, and no
problems were reported during the test runs. The three test runs were conducted in full accordance with all Method 5 testing requirements and quality assurance procedures. The report included adequate documentation of all testing procedures and process operating conditions. U. Reference 21
The test program concerned Flash Dryer #2 used for drying wet ground pulverized limestone material at the Omya, Inc. plant in Florence, Vermont. The effluent gas stream from the dryer is controlled by a fabric filter system. During the test program, Flash Dryer #2 operated at or near its maximum rated capacity. Product characteristics were typical of normal operations. Emission tests were conducted in a stack located downstream of the induced draft fan for the flash drying system.
The PM data are assigned an A rating. The test methodology appeared to be sound, and no
problems were reported during the test runs. The three test runs were conducted in full accordance with all Method 5 testing requirements and quality assurance procedures. The report included adequate documentation of all testing procedures and process operating conditions. V. References 22 and 23
The test program concerned Flash Dryer #3 used for drying wet ground pulverized limestone material at the Omya, Inc. plant in Florence, Vermont. The effluent gas stream from the dryer is controlled by a fabric filter system. During the test program, Flash Dryer #3 operated at or near its maximum rated capacity. Product characteristics were typical of normal operations. Emission tests were conducted in a stack located downstream of the induced draft fan for the flash drying system. The test program included one run conducted in August 2000 and two additional test runs conducted in September 2000. Process and fabric filter operating conditions were similar during all three test runs conducted over the August through September 2000 time period.
The PM data are assigned an A rating. The test methodology appeared to be sound, and no
problems were reported during the test runs. The three test runs were conducted in full accordance with

14
all Method 5 testing requirements and quality assurance procedures. The report included adequate documentation of all testing procedures and process operating conditions. III. RESULTS OF DATA ANALYSIS
Emission factors were developed for conveyor transfer points, screening, tertiary crushing, fines crushing, and fines screening operations. The only data available for secondary crushing were of questionable quality and were not consistent with the emission tests included in this review. Therefore, the revised AP-42 section does not include emission factors for primary and secondary crushing of stone. However, the emission factors for tertiary stone crushing can be used as an upper limit to primary and secondary crushing.
Emissions generally were considered uncontrolled if the raw material moisture content was less than 1.5 percent and controlled if the raw material moisture content was greater than or equal to 1.5 percent. The material moisture contents in the Reference 5 and Reference 8 emission tests did not reach the targeted 1.5 percent for the controlled runs. However, data from these tests are consistent with data from other controlled tests and are treated as controlled. Table 2 presents the PM-l0 emission factors, and Table 4 presents the PM emission factors developed using the data from References 1 through 10. The PM-10 emission factors for screening and tertiary crushing were assigned a C rating because A-rated data from four tests (which is considered a sufficient number of tests to warrant a C rating) conducted at typical facilities were used. The PM-10 emission factors for fines screening and crushing were assigned an E rating because data from a single A-rated test were used. The PM-10 emission factors for conveyor transfer points were assigned a D rating because data from only three tests (conducted at two typical facilities) were used.
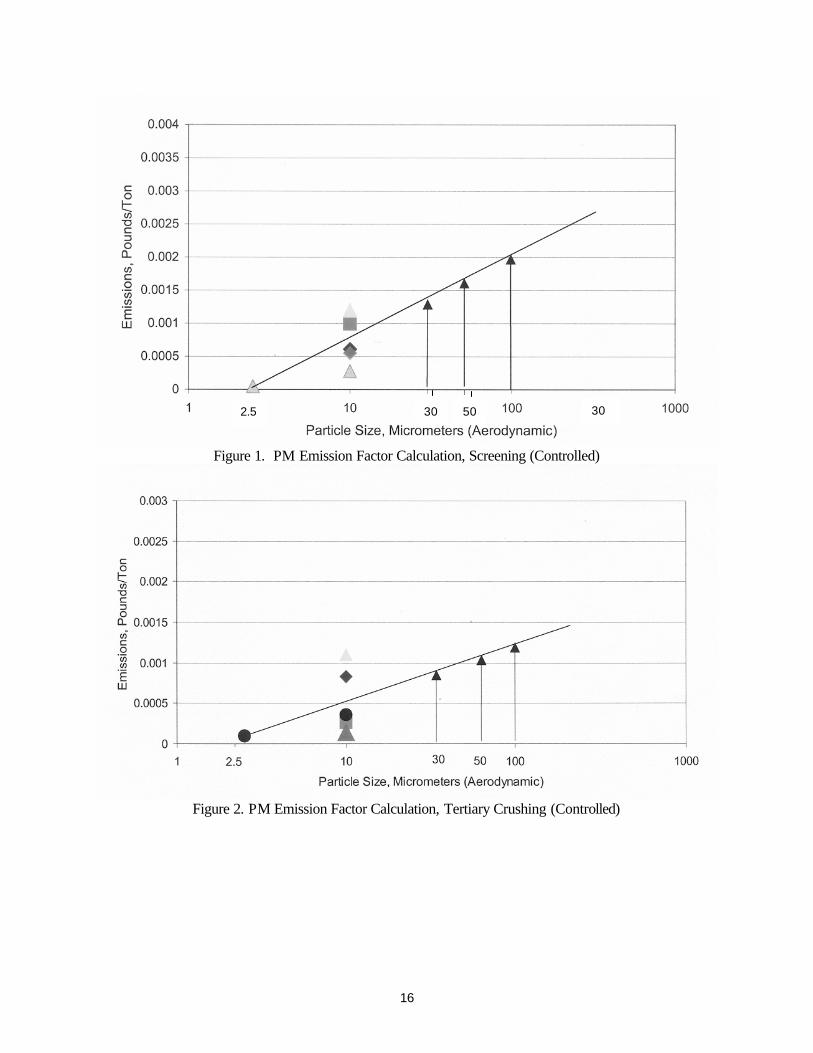
The controlled PM emission factors were calculated based on graphical extrapolation of emission
factor data provided in Table 2 for PM-10 and Table 6 for PM-2.5 for screening, tertiary crushing, fines crushing, and conveyor transfer points.
The data used in the preparation of the controlled PM calculations were derived from the individual A-rated tests for PM-2.5 and PM-10 summarized in Tables 2 and 6, respectively. For conveyor transfer points, the controlled PM value was derived from A-rated PM-2.5, PM-10, and PM data summarized in Tables 2, 4, and 6.
The extrapolation line was drawn through the PM-2.5 value and the mean of the PM-10 values. PM emission factors were calculated for PM-30, PM-50, and PM-100. Each of these particle size limits is used by one or more regulatory agencies as the definition of total particulate matter. The graphical extrapolations used in calculating the emission factors are presented in Figures 1, 2, 3, and 4.
The PM emission factors calculated in Figures 1 through 4 were checked by plotting the PM-2.5, PM-10, and PM emission factors for each type of source on log probability paper to confirm that the distribution is log normal as expected for particulate matter generated by an attrition process. The resulting emission factor distributions for tertiary crushers, screening operations, fine crushers, and conveyor transfer points are log normal as shown in Figure 5. The calculated emission factors were also checked by comparison with the C-rated non-reference method data for References 3 through 8 summarized in Table 3. With the exception of a few data points, the C-rated emission factors for References 3 through 8 are reasonably consistent with the calculated PM emission factors.

15
The uncontrolled PM emission factors shown in Table 4 have been calculated from the controlled PM emission factors calculated in accordance with Figures 1 through 4. The PM-10 control efficiencies derived from Table 2 for PM-10 emissions (summarized below) have been applied to the controlled emission factor data to calculate the uncontrolled PM emission rates.
• Screening PM-10 Controlled = 0.00073 Lbs./Ton. Uncontrolled = 0.00865 Lbs./Ton. Efficiency = 91.6%
• Tertiary Crushing PM-10 Controlled = 0.00054 Lbs./Ton Uncontrolled = 0.00243 Lbs./Ton Efficiency = 77.7%
• Fines Crushing PM-10 Controlled = 0.0012 Lbs./Ton Uncontrolled = 0.015 Lbs./Ton Efficiency = 92.0%
• Conveyor Transfer Points PM-10 Controlled = 0.000045 Lbs./Ton Uncontrolled = 0.0011 Lbs./Ton Efficiency = 95.9%
16
Figure 1. PM Emission Factor Calculation, Screening (Controlled)
Figure 2. PM Emission Factor Calculation, Tertiary Crushing (Controlled)
30 50 300
2.5

17
Figure 3. PM Emission Factor Calculation, Fines Crushing (Controlled)
Figure 4. PM Emission Factor Calculation, Conveyor Transfer Points (Controlled)

18
Figure 5. Log Probability Plot Used to Check Estimated PM Emission Factors
The uncontrolled total particulate matter emission factor was calculated from the controlled total
particulate matter using Equation 1.
Uncontrolled emission factor = Controlled total particulate emission factor (100% – PM-10 Eff.%)/100% Equation 1

19
All of the PM emission factors have been rated as E due to the limited test data and the need to estimate emission factors using extrapolations of the PM-2.5 and PM-10 data.
The PM-2.5 emission factors for tertiary crushing, screening, conveyor transfer, and fines crushing (all controlled using wet suppression) were assigned an E rating because data from a single A-rated test were used for each source.
The PM-10 and PM-2.5 emission factors for pulverized mineral grinding operations have been assigned a B rating because the factor is based on three A-rated tests, and the three tests represent a large fraction of the total number of operating units. The PM-10 and PM-2.5 emission factors for flash dryers have been assigned a C rating because the emission factors are based on a single test, and the unit tested represents a major fraction of the total number of operating units. The PM-10 and PM-2.5 emission factors for pulverized mineral classifying and product storage have been rated E because the emission factors are based on a single A-rated test.
The pulverized mineral PM emission factor for grinding was assigned a D rating because the factor
is based on two A-rated tests using Method 5 and one A-rated test using Method 201A. Method 201A is not the reference test method for PM. The pulverized mineral flash dryer PM emission factor was assigned a C rating because it is based on three A-rated tests, and this unit represents a major fraction of the operating units. The pulverized mineral emission factors for classifying were rated E because the emission factor is based on a single A-rated test using Method 201A. The emission factor for pulverized mineral product storage was rated E because it is based on one A-rated Method 5 test and one A-rated Method 201A test.
In addition to the emission factors described above, the revised AP-42 section includes emission factors for wet drilling and truck unloading and loading that were retained from the previous version of AP-42 Section 8.19.2. Although the quality of the data upon which these emission factors was based is questionable, no other data on those sources were located during this review.
IV. REFERENCESa 1. J. Richards, T. Brozell, and W. Kirk, PM-10 Emission Factors for a Stone Crushing Plant Deister
Vibrating Screen, EPA Contract No. 68-Dl-0055, Task 2.84, U. S. Environmental Protection Agency, Research Triangle Park, NC, February 1992.
2. J. Richards, T. Brozell, and W. Kirk, PM-10 Emission Factors for a Stone Crushing Plant Tertiary
Crusher, EPA Contract No. 68-D1-0055, Task 2.84, U. S. Environmental Protection Agency, Research Triangle Park, NC, February 1992.
3. W. Kirk, T. Brozell, and J. Richards, PM-10 Emission Factors for a Stone Crushing Plant Deister
Vibrating Screen and Crusher, National Stone Association, Washington DC, December 1992. 4. T. Brozell, J. Richards, and W. Kirk, PM-10 Emission Factors for a Stone Crushing Plant Tertiary
Crusher and Vibrating Screen, EPA Contract No. 68-DO-0122, U. S. Environmental Protection Agency, Research Triangle Park, NC, December 1992.
5. T. Brozell, PM-10 Emission Factors for Two Transfer Points at a Granite Stone Crushing Plant,
EPA Contract No. 68-DO-0122, U. S. Environmental Protection Agency, Research Triangle Park, NC, January 1994.

20
6. T. Brozell, PM-10 Emission Factors for a Stone Crushing Plant Transfer Point, EPA Contract No.
68-DO-0122, U. S. Environmental Protection Agency, Research Triangle Park, NC, February 1993. 7. T. Brozell and J. Richards, PM-10 Emission Factors for a Limestone Crushing Plant Vibrating
Screen and Crusher for Bristol, Tennessee, EPA Contract No. 68-D2-0163, U. S. Environmental Protection Agency, Research Triangle Park, NC, July 1993.
8. T. Brozell and J. Richards, PM-10 Emission Factors for a Limestone Crushing Plant Vibrating
Screen and Crusher for Marysville, Tennessee, EPA Contract No. 68-D2-0163, U. S. Environmental Protection Agency, Research Triangle Park, NC, July 1993.
9. Air Pollution Control Techniques for Nonmetallic Minerals Industry, EPA-450/3-82-014, U. S.
Environmental Protection Agency, Research Triangle Park, NC, August 1982. 10. Review Emission Data Base and Develop Emission Factors for the Construction Aggregate
Industry, Engineering-Science, Inc., Arcadia, CA, September 1984. 11. P. K. Chalekode et al., Emissions from the Crushed Granite Industry: State of the Art, EPA-
600/2-78-021, U. S. Environmental Protection Agency, Washington, DC, February 1978. 12. T. R. Blackwood et al., Source Assessment: Crushed Stone, EPA-600/2-78-004L, U. S.
Environmental Protection Agency, Washington, DC, May 1978. 13. An Investigation of Particulate Emissions from Construction Aggregate Crushing Operations
and Related New Source Performance Standards, National Crushed Stone Association, Washington, DC, December 1979.
14. F. Record and W. T. Harnett, Particulate Emission Factors for the Construction Aggregate
Industry, Draft Report, GCA-TR-CH-83-02, EPA Contract No. 68-02-3510, GCA Corporation, Chapel Hill, NC, February 1983.
15. T. Brozell, T. Holder, and J. Richards, Measurement of PM-10 and PM2.5 Emission Factors at a Stone Crushing Plant, National Stone Association, December 1996.
16. T. Brozell, and J. Richards, PM10/PM2.5 Emission Factor Testing for the Pulverized Mineral Division of the National Stone, Sand and Gravel Association. Report to the National Stone, Sand and Gravel Association; October 2001.
17. Frank Ward & Company, A Report of Particulate Source Sampling Performed for Franklin Industrial Minerals Located in Sherwood, Tennessee, Report to Franklin Industrial Minerals, August 1994.
18. Advanced Industrial Resources, LLC. Performance Test Report of Baghouse No. 37 at Franklin Industrial Minerals, Report to Franklin Industrial Minerals, November 1999.
19. Advanced Industrial Resources, LLC. Performance Test Report of BH-750Limestone System at Franklin Industrial Minerals, Report to Franklin Industrial Minerals, May 2000.

21
20. Air Quality Technical Services, Performance Testing for Flash Dryer #1, Omya, Inc. Plant in Florence, Vermont. June 1997.
21. Air Quality Technical Services, Performance Testing for Flash Dryer #2, Omya, Inc. Plant in Florence, Vermont, March 1998.
22. Air Quality Technical Services. Performance Testing for Flash Dryer #3, Omya, Inc. Plant in Florence, Vermont, August 2000.
23. Air Quality Technical Services. Performance Testing for Flash Dryer #3, Omya, Inc. Plant in Florence, Vermont, September 2000.
a. Note: These references are identical to references 1 through 23 in AP-42, Section 11.19.2

22
TABLE 1. SUMMARY OF EMISSION DATA FOR PM-10 EMISSIONS FROM CRUSHED STONE PROCESSING TEST REPORTSa
Data Rating: A
Source (material) Average material moisture content b
No. of test runs
Emission factor range, kg/Mg (lb/ton)
Average emission factor, kg/Mg (lb/ton)
Ref No.
Screening (granite)
0.48% 3 0.0010-0.0075 (0.0020-0.015)
0.0035 (0.0070)
1
Screening (granite) 1.57% 3 0.00028-0.00037 (0.00056-0.00073)
0.00031 (0.00061)
1
Tertiary crushing (granite)
0.44% 3 0.00075-0.0010 (0.0015-0.0020)
0.00090 (0.0018)
2
Tertiary crushing (granite)
1.77% 3 0.00017-0.00055 (0.00034-0.0011)
0.00042 (0.00083)
2
Tertiary crushing (granite)
0.70% 3 0.0011-0.0031 (0.0021-0.0062)
0.0020 (0.0040)
3
Tertiary crushing (granite)
1.78% 3 0.000075-0.00019 (0.00015-0.00037)
0.00013 (0.00026)
3
Screening (granite) 0.70% 3 0.012-0.015 (0.024-0.030)
0.014 (0.027)
3
Screening (granite) 1.78% 3 0.00049-0.00055) (0.00097-0.0011)
0.00050 (0.0010)
3
Fines crushing (granite) 0.97% 3 0.017-0.013 (0.0034-0.026)
0.0075 (0.015)
4
Fines crushing (granite) 1.92% 3 0.00055-0.0013 (0.0011-0.0026)
0.0010 (0.0020)
4
Fines screening (granite) <1.5% 3 0.021-0.050 (0.042-0.10)
0.036 (0.071)
4
Fines screening (granite) 1.68% 3 0.0060-0.015 (0.0012-0.0030)
0.011 (0.0021)
4
Conveyor transfer point (granite)d
0.27% 3 0.00010-0.00021 (0.00020-0.00042)
0.00014 (0.00028)
5
Conveyor transfer point (granite)c
0.66% 3 3.1x10⁻⁵-5.9x10⁻⁵ (6.1x10⁻⁵-1.2x10⁻⁴)
4.6x10⁻⁵ (9.2x10⁻⁵)
5
Conveyor transfer point (granite)d
0.33% 3 0.00037-0.00081 (0.00074-0.0016)
0.00053 (0.0011)
5

23
TABLE 1. (continued)
Source (material) Average material moisture content b
No. of test runs
Emission factor range, kg/Mg (lb/ton)
Average emission factor, kg/Mg (lb/ton)
Ref No.
Conveyor transfer point (granite)c
1.11% 3 9.0x10⁻⁶-2.6x10⁻⁵ (1.8x10⁻⁵-5.1x10⁻⁵)
1.5x10⁻⁵ (3.0x10⁻⁵)
5
Conveyor transfer point (granite)d
0.29% 3 0.0013-0.0016 (0.0025-0.0033)
0.0015 (0.0029)
6
Conveyor transfer point (granite)c
2.62% 3 6.0x10⁻⁶-9.5x10⁻⁶ (1.2x10⁻⁵-1.9x10⁻⁵)
0.75x10⁻⁵ (1.5x10⁻⁵)
6
Tertiary crushing (limestone)
0.88% 3 0.00092-0.0020 (0.0018-0.0041)
0.0015 (0.0029)
7
Tertiary crushing (limestone)
2.07% 3 0.00033-0.00083 (0.00066-0.0017)
0.00053 (0.0011)
7
Screening (limestone) 0.88% 3 0.0033-0.017 (0.0067-0.033)
0.0092 (0.018)
7
Screening (limestone) 2.07% 3 0.00032-0.0011 (0.00064-0.0023)
0.00061 (0.0012)
7
Tertiary crushing (limestone)
0.67% 3 0.00039-0.00065 (0.00079-0.0013)
0.00052 (0.0010)
8
Tertiary crushing (limestone)
1.44% 3 0.000053-0.000095 (0.00011-0.00019)
0.000074 (0.00015)
8
Screening (limestone) 0.67% 3 0.0033-0.0036 (0.0067-0.0073)
0.0035 (0.0069)
8
Screening (limestone) 1.44% 3 0.00024-0.00030 (0.00049-0.00059)
0.00027 (0.00055)
8
Tertiary crushing (granite)c
1.02% 3 0.00014-0.00022 (0.00028-0.00044)
0.00018 (0.00036)
15
Screening (granite)c 0.45% 3 0.00010-0.00022 (0.00020-0.00043)
0.00014 (0.00028)
15
Conveyor transfer point (granite)c
0.72% 3 0.000016-0.000026 0.000032-0.000052)
0.000021 (0.000042)
15
Fines crushingc 0.72% 3 0.00010-0.00021 (0.00020-0.00041)
0.00016 (0.00031)
15
aEmission factors are in units of material throughput (process) unless noted. bMoisture content <1.5% indicates uncontrolled and ≥ 1.5% indicates controlled emissions unless otherwise indicated. c Moisture controlled tests d Moisture uncontrolled tests
24
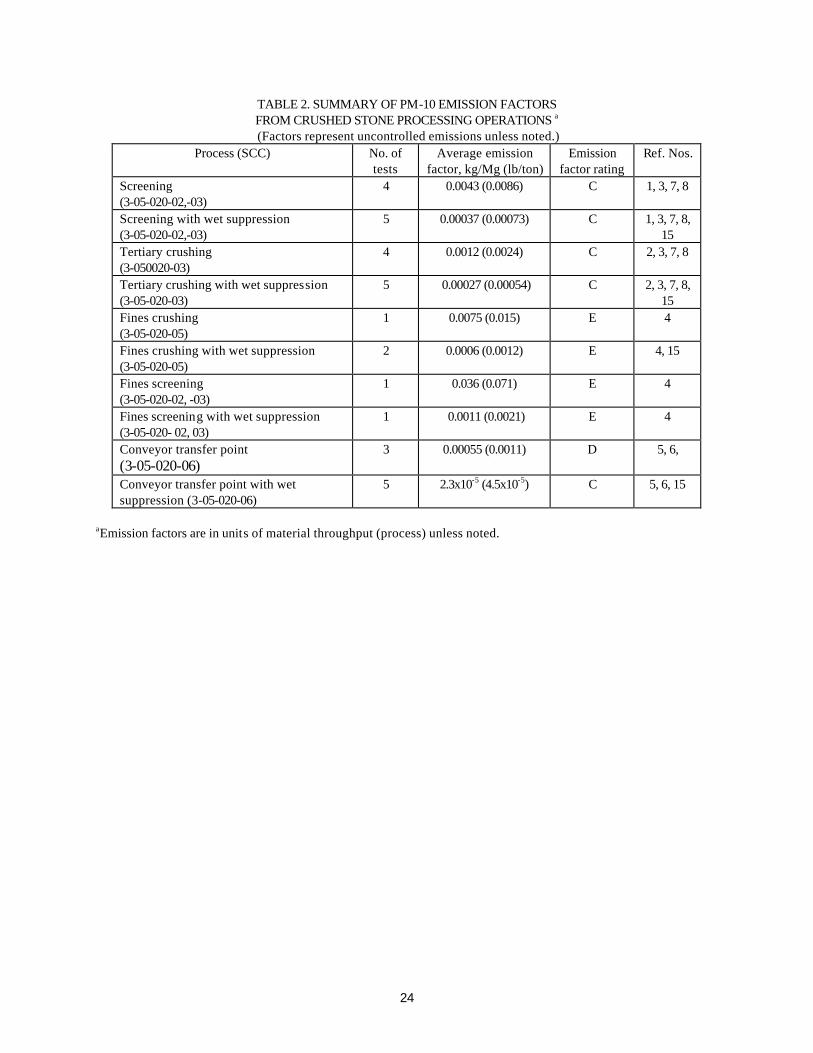
TABLE 2. SUMMARY OF PM-10 EMISSION FACTORS FROM CRUSHED STONE PROCESSING OPERATIONS a (Factors represent uncontrolled emissions unless noted.)
Process (SCC) No. of tests
Average emission factor, kg/Mg (lb/ton)
Emission factor rating
Ref. Nos.
Screening (3-05-020-02,-03)
4 0.0043 (0.0086) C 1, 3, 7, 8
Screening with wet suppression (3-05-020-02,-03)
5 0.00037 (0.00073) C 1, 3, 7, 8, 15
Tertiary crushing (3-050020-03)
4 0.0012 (0.0024) C 2, 3, 7, 8
Tertiary crushing with wet suppression (3-05-020-03)
5 0.00027 (0.00054) C 2, 3, 7, 8, 15
Fines crushing (3-05-020-05)
1 0.0075 (0.015) E 4
Fines crushing with wet suppression (3-05-020-05)
2 0.0006 (0.0012) E 4, 15
Fines screening (3-05-020-02, -03)
1 0.036 (0.071) E 4
Fines screening with wet suppression (3-05-020- 02, 03)
1 0.0011 (0.0021) E 4
Conveyor transfer point (3-05-020-06)
3 0.00055 (0.0011) D 5, 6,
Conveyor transfer point with wet suppression (3-05-020-06)
5 2.3x10⁻⁵ (4.5x10⁻⁵) C 5, 6, 15
aEmission factors are in units of material throughput (process) unless noted.

25
TABLE 3. SUMMARY OF EMISSION DATA FOR PM EMISSIONS FROM CRUSHED STONE PROCESSING TEST REPORTSa
Data Rating: C (unless otherwise noted)
Source (material) Average material moisture content b
No. of test runs
Emission factor range, kg/Mg (lb/ton)
Average emission factor, kg/Mg
(lb/ton)d
Ref No.
Tertiary crushing (granite)
0.79% 3 0.021-0.045 (0.043-0.091)
0.037 (0.074)
3
Tertiary crushing (granite)
1.78% 3 0.00016-0.00071 (0.00032-0.0014)
0.00044 (0.00087)
3
Screening (granite) 0.70% 3 0.062-0.16 (0.12-0.31) 0.097 (0.19) 3 Screening (granite) 1.78% 3 0.00096-0.0018
(0.0019-0.0035) 0.0015
(0.0029) 3
Fines crushing (granite) 0.97% 3 0.13-0.58 (0.26 – 1.2) 0.36 (0.72) 4 Fines crushing (granite) 1.92% 3 0.065-0.11 (0.13-0.23) 0.067 (0.13) 4 Fines screening (granite) <1.5% 3 0.11-0.18 (0.22-0.37) 0.15 (0.30) 4 Fines screening (granite) 1.68% 3 0.00096-0.0027
(0.0019-0.0054) 0.0018
(0.0036) 4
Conveyor transfer point (granite)
0.27% 3 0.0012-0.0023 (0.0023-0.0046)
0.0015 (0.0031)
5
Conveyor transfer point (granite)
0.66% 3 0.000093-0.00019 (0.00019-0.00037)
0.00014 (0.00028)
5
Conveyor transfer point (granite)
0.33% 3 0.0054-0.0087 (0.011-0.017)
0.0078 (0.014)
5
Conveyor transfer point (granite)
1.11% 3 0.000023-0.000065 (0.000046-0.00013)
0.000038 (0.000076)
5
Conveyor transfer point (granite)
0.29% 3 0.033-0.036 (0.066-0.071)
0.034 (0.069)
6
Conveyor transfer point (granite)
2.62% 3 0.000013-0.000025 (0.000026-0.000050)
0.000019 (0.000038)
6
Conveyor transfer point (granite)c
0.29% 3 0.014-0.035 (0.029-0.069)
0.028 (0.055)
6
Conveyor transfer point (granite)
2.62% 3 0.000011-0.000081 (0.000023-0.00016)
0.00004 (0.00008)
6
Tertiary crushing (limestone)
0.88% 3 0.0032-0.012 (0.0064-0.023)
0.0073 (0.015)
7
Tertiary crushing (limestone)
2.07% 3 0.00067-0.0022 (0.0013-0.0043)
0.0013 (0.0025)
7
Screening (limestone) 0.88% 3 0.016-0.10 (0.032-0.21)
0.073 (0.15)
7
Screening (limestone) 2.07% 3 0.0020-0.014 (0.0040-0.029)
0.0062 (0.012)
7
Tertiary crushing (limestone)
0.67% 3 0.00064-0.014 (0.0013-0.027)
0.0096 (0.0190)
8

26
Tertiary crushing (limestone)
1.44% 3 0.00042-0.00074 (0.00083-0.0015)
0.0064 (0.0013)
8
Screening (limestone) 0.67% 3 0.012-0.052 (0.025-0.10)
0.037 (0.074)
8
Screening (limestone) 1.44% 3 0.0016-0.0021 (0.0031-0.0043)
0.0019 (0.0037)
8
Conveyor transfer point (limestone) d, j
e 3 1.0x10⁻⁵-2.0x10⁻⁵ (2.0x10⁻⁵-4.0x10⁻⁵)
1.5x10⁻⁵ (3.0x10⁻⁵)
9
Primary crushing d
(limestone)
e 3 0.00010-0.00065 (0.00020-0.0013)
0.00035 (0.00070)
9
Screening d (limestone) e 3 1.0x10⁻⁵-0.001 (2.0x10⁻⁵-0.002)
0.00037 (0.00074)
9
Screening f e 9 0.013-0.17 (0.025-0.33)
0.059 (0.118)
10
Screening f 1.5% 9 0.0011-0.037 (0.0022-0.073)
0.0031 (0.0061)
10
Screening f 1.5% 9 0.0007-0.0009 (0.0014-0.0018)
0.0008 (0.0016)
10
aEmission factors are in units of material throughput (process) unless noted. bMoisture content <1.5% indicates uncontrolled and >1.5% indicates controlled emissions unless otherwise indicated. cData are A-rated. dData are C-rated unless otherwise indicated. eMaterial moisture content is assumed to be low because wet suppression was not used. fData include emissions from three different types of screens. g Moisture controlled hMoisture uncontrolled, jTest data were not used in calculation of emission factors.

27
TABLE 4. SUMMARY OF PM EMISSION FACTORS FROM CRUSHED STONE PROCESSING OPERATIONS a (Factors represent uncontrolled emissions unless noted.)
Process (SCC) No. of tests
Average emission factor, kg/Mg (lb/ton) Emission factor rating
Ref. Nos.
Screening b,c (3-05-020-02,-03)
4 PM-30 = 0.0083 (0.0166) PM-50 = 0.0101 (0.0202) PM-100 = 0.0125 (0.0250)
E 1, 3, 7, 8 (Fig. 1)
Screening with wet suppression b,c (3-05-020-02,-03)
6 PM-30 = 0.0007 (0.0014) PM-50 = 0.0009 (0.0017) PM-100 = 0.0011 (0.0021)
E 1, 3, 7, 8 (Fig. 1)
Tertiary crushing d (3-05-0020-03)
3 PM-30 = 0.0018 (0.0036) PM-50 = 0.0025 (0.0049) PM-100 = 0.0027 (0.0054)
E 3, 7, 8 (Fig. 2)
Tertiary crushing with wet suppression d (3-05-020-03)
4 PM-30 = 0.0004 (0.0008) PM-50 = 0.0006 (0.0011) PM-100 = 0.0006 (0.0012)
E 3, 7, 8 (Fig. 2)
Fines crushing e (3-05-020-05)
1 PM-30 = 0.0130 (0.0260) PM-50 = 0.0163 (0.0325) PM-100 = 0.0195 (0.0390)
E 4 (Fig. 3)
Fines crushing with wet suppression e (3-05-020-05)
2 PM-30 = 0.0011 (0.0020) PM-50 = 0.0013 (0.0025) PM-100 = 0.0015 (0.0030)
E 4 (Fig. 3)
Fines screening (3-05-020-02, -03)
1 0.15 (0.30) E 4 (Table 3)
Fines screening with wet suppression (3-05-020-02, -03)
1 0.0018 (0.0036) E 4 (Table 3)
Conveyor transfer point f (3-05-020-06)
3 PM-30 = 0.0010 (0.0020) PM-50 = 0.0014 (0.0027) PM-100 = 0.0015 (0.0029)
E 5, 6, 15 (Fig. 4)
Conveyor transfer point with wet suppressionf (3-05-020-06)
4 PM-30 = 0.00004 (0.00008) PM-50 = 0.00005 (0.00011) PM-100 = 0.00006 (0.00013)
E 5, 6, 15 (Fig. 4)
a.Emission factors are in units of material throughput (process) unless noted. bData from references 9 and 10 not included. c.PM emission factors (controlled) calculated using Figure 1. Uncontrolled emission factors calculated based on wet suppression efficiency of 91.6% derived from PM-10 data d.PM emission factors (controlled) calculated using Figure 2. Uncontrolled emission factors calculated based on wet suppression efficiency of 77.7% derived from PM-10 data ePM emission factors (controlled) calculated using Figure 3. Uncontrolled emission factors calculated based on wet suppression efficiency of 92.3% derived from PM-10 data fPM emission factors (controlled) calculated using Figure 4. Uncontrolled emission factors calculated based on wet suppression efficiency of 95.9% derived from PM-10 data

28
TABLE 5. SUMMARY OF EMISSION DATA FOR PM-2.5 EMISSIONS FROM
CRUSHED STONE PROCESSING REPORTS a Data Rating: A (unless otherwise noted)
Source (material) Average
material moisture content
No. of test runs
Emission factor range, kg/Mg (lb/ton)
Average emission factor, kg/Mg (lb/ton)
Ref No.
Tertiary crusher (granite)b
1.02 3 0.00005-0.00006 (0.00009-0.00011)
0.00005 (0.00010)
15
Fines crusher (granite)b
0.73 3 0.000025-0.000040 (0.00005-0.00008)
0.000035) (0.00007)
15
Conveyor transfer point (granite)b
1.02 3 4.5x10⁻⁶-7.5x10⁻⁵ (0.000009-0.000015)
6.5x10⁻⁶ (1.3x10⁻⁵)
15
Screening (granite)b 0.49 3 (0.00002-0.00004) (0.00004-0.00008)
2.5x10⁻⁵ (0.00005)
15
aEmission factors are in units of material throughput (process) unless noted. bMoisture was controlled by wet suppression.

29
TABLE 6. SUMMARY OF PM-2.5 EMISSION FACTORS FOR CRUSHED STONE PROCESSING OPERATIONS a
(Factors represent controlled emissions unless noted.) Process (SCC) No. of
tests Average emission
factor, kg/Mg (lb/ton)
Emission factor rating
Ref. Nos.
Tertiary crushing with wet suppression b (3-05-020-03)
1 0.00005 (0.00010)
E 15
Screening with wet suppression b (3-05-020-02-03)
1 2.5x10⁻⁵ (0.00005)
E 15
Conveyor transfer point with wet suppression b
1 6.5x10⁻⁶ (1.3x10⁻⁵)
E 15
Fines crushing with wet suppression b (3-05-020-05)
1 0.000035 (0.00007)
E 15
aEmission factors are in units of material throughput (process) unless noted. b Moisture was controlled by wet suppression
30
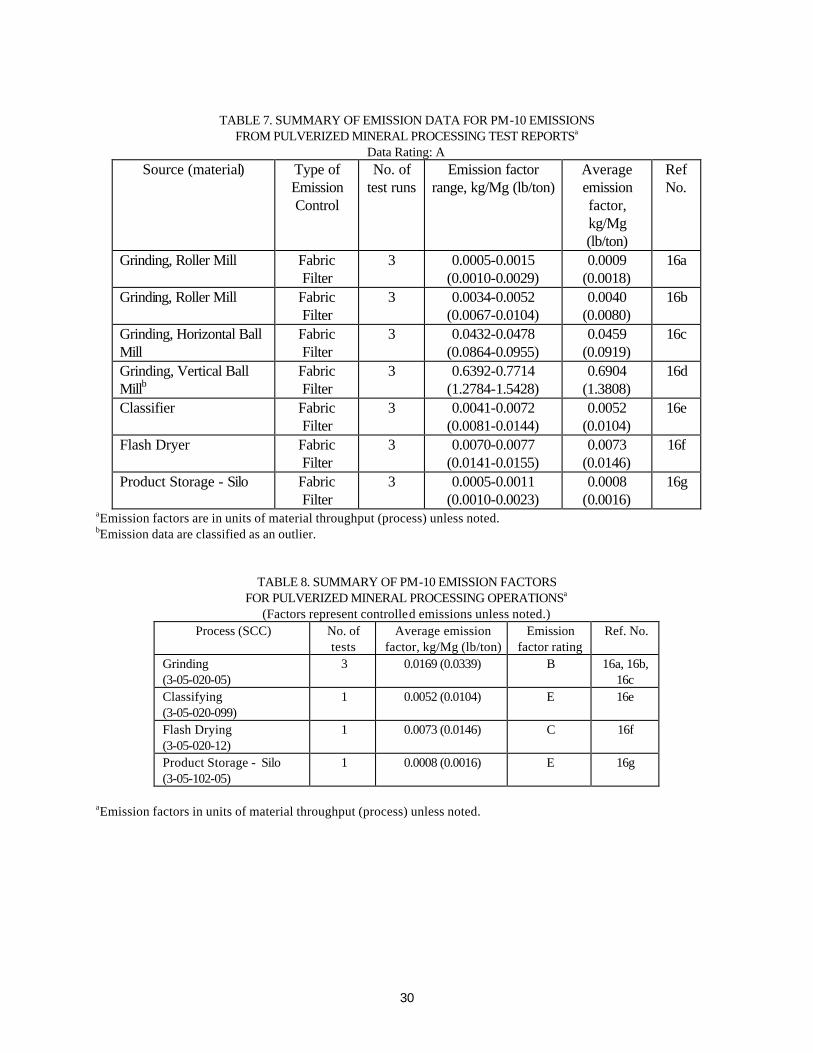
TABLE 7. SUMMARY OF EMISSION DATA FOR PM-10 EMISSIONS
FROM PULVERIZED MINERAL PROCESSING TEST REPORTSa Data Rating: A
Source (material) Type of Emission Control
No. of test runs
Emission factor range, kg/Mg (lb/ton)
Average emission factor, kg/Mg (lb/ton)
Ref No.
Grinding, Roller Mill
Fabric Filter
3 0.0005-0.0015 (0.0010-0.0029)
0.0009 (0.0018)
16a
Grinding, Roller Mill Fabric Filter
3 0.0034-0.0052 (0.0067-0.0104)
0.0040 (0.0080)
16b
Grinding, Horizontal Ball Mill
Fabric Filter
3 0.0432-0.0478 (0.0864-0.0955)
0.0459 (0.0919)
16c
Grinding, Vertical Ball Millb
Fabric Filter
3 0.6392-0.7714 (1.2784-1.5428)
0.6904 (1.3808)
16d
Classifier Fabric Filter
3 0.0041-0.0072 (0.0081-0.0144)
0.0052 (0.0104)
16e
Flash Dryer Fabric Filter
3 0.0070-0.0077 (0.0141-0.0155)
0.0073 (0.0146)
16f
Product Storage - Silo Fabric Filter
3 0.0005-0.0011 (0.0010-0.0023)
0.0008 (0.0016)
16g
aEmission factors are in units of material throughput (process) unless noted. bEmission data are classified as an outlier.
TABLE 8. SUMMARY OF PM-10 EMISSION FACTORS FOR PULVERIZED MINERAL PROCESSING OPERATIONSa
(Factors represent controlled emissions unless noted.) Process (SCC) No. of
tests Average emission
factor, kg/Mg (lb/ton) Emission
factor rating Ref. No.
Grinding (3-05-020-05)
3 0.0169 (0.0339) B 16a, 16b, 16c
Classifying (3-05-020-099)
1 0.0052 (0.0104) E 16e
Flash Drying (3-05-020-12)
1 0.0073 (0.0146) C 16f
Product Storage - Silo (3-05-102-05)
1 0.0008 (0.0016) E 16g
aEmission factors in units of material throughput (process) unless noted.

31
TABLE 9. SUMMARY OF EMISSION DATA FOR PM EMISSIONS FROM PULVERIZED MINERAL PROCESSING TEST REPORTSa
Data Rating: B (unless otherwise noted) Source (material) Type of
Emission Control
No. of test runs
Emission factor range, kg/Mg (lb/ton)
Average emission
factor, kg/Mg (lb/ton)
Ref No.
Grinding, Roller Mill
Fabric Filter
3 0.0012-0.0030 (0.0023-0.0060)
0.0018 (0.0035)
16ad
Grinding, Roller Mill Fabric Filter
3 0.0075-0.0102 (0.0150-0.0204)
0.0088 (0.0176)
16bd
Grinding, Horizontal Ball Mill
Fabric Filter
3 0.0731-0.0776 (0.1463-0.1552)
0.0760 (0.1519)
16cd
Grinding, Vertical Ball Millb
Fabric Filter
3 0.7458-0.8970 (1.4915-1.7940)
0.7976 (1.5952)
16dd
Classifier Fabric Filter
3 0.0084-0.0163 (0.0168-0.0325)
0.0112 (0.0225)
16ed
Flash Dryer Fabric Filter
3 0.0116-0.0182 (0.0232-0.0364)
0.0153 (0.0307)
16fd
Product Storage - Silo Fabric Filter
3 0.0010-0.0057 (0.0020-0.0114)
0.0032 (0.0063)
16gd
Grinding, Roller Mill Fabric Filter
3 0.0052-0.0089 (0.0104-0.0178)
0.0068 (0.0136)
17c
Product Storage - Bin Vent
Fabric Filter
3 0.0049-0.0089 (0.0098-0.0195)
0.0078 (0.0135)
18c
Grinding, Roller Mill Fabric Filter
3 0.0057-0.0092 (0.0113-0.0184)
0.0078 (0.0156)
19c
Flash Dryer Fabric Filter
3 0.0083-0.0145 (0.0167-0.0290)
0.0109 (0.0217)
20c
Flash Dryer Fabric Filter
3 0.0059-0.0149 (0.0117-0.0298)
0.0101 (0.0202)
21c
Flash Dryer Fabric Filter
3 0.0134-0.0246 (0.0267-0.0493)
0.0173 (0.0345)
22c and 23c
aEmission factors are in units of material throughput (process) unless noted. bEmission data from the Grinding, Vertical Ball Mill classified as an outlier. cEmission test data are rated A. dEmission test data are rated B due to the use of Method 201A to measure particulate matter.

32
TABLE 10. SUMMARY OF PARTICULATE MATTER EMISSION FACTORS FOR PULVERIZED MINERAL PROCESSING OPERATIONS a
(Factors represent controlled emissions unless noted.) Process (SCC) No. of
tests Average emission
factor, kg/Mg (lb/ton) Emission
factor rating Ref. No.
Grinding (3-05-020-05)
5 0.0202 (0.0404) D 16a, 16b, 16c, 17, 19
Classifying (3-05-020-099)
1 0.0112 (0.0225) E 16e
Flash Drying (3-05-020-12)
4 0.0134 (0.0268) C 16f, 20, 21, 22, 23
Product Storage (3-05-102-05)
2 0.0055 (0.0099) E 16g
aEmission factors are in units of material throughput (process) unless noted*

33
TABLE 11. SUMMARY OF EMISSION DATA FOR PM-2.5 EMISSIONS FROM
PULVERIZED MINERAL PROCESSING TEST REPORTSa Data Rating: A (unless otherwise noted)
Source (material) Type of Emission Control
No. of test runs
Emission factor range, kg/Mg (lb/ton)
Average emission factor, kg/Mg (lb/ton)
Ref No.
Grinding, Roller Mill
Fabric Filter
3 0.0004-0.0007 (0.0008-0.0013)
0.0005 (0.0011)
16a
Grinding, Roller Mill Fabric Filter
3 0.0006-0.0007 (0.0012-0.0014)
0.0007 (0.0013)
16b
Grinding, Horizontal Ball Mill
Fabric Filter
3 0.0160-0.0176 (0.0319-0.0352)
0.0169 (0.0338)
16c
Grinding, Vertical Ball Mill
Fabric Filter
3 0.3211-0.3296 (0.6422-0.6593)
0.3250 (0.6501)
16d
Classifier Fabric Filter
3 0.0017-0.0024 (0.0035-0.0049)
0.0020 (0.0041)
16e
Flash Dryer Fabric Filter
3 0.0035-0.0045 (0.0070-0.0091)
0.0042 (0.0083)
16f
Product Storage Fabric Filter
3 0.0002-0.0004 (0.0005-0.0008)
0.0003 (0.0006)
16g
aEmission factors are in units of material throughput (process) unless noted
TABLE 12. SUMMARY OF PM-2.5 EMISSION FACTORS FOR PULVERIZED MINERAL PROCESSING OPERATIONSa
(Factors represent controlled emissions unless noted.) Process (SCC) No. of
tests Average emission
factor, kg/Mg (lb/ton) Emission
factor rating Ref. Nos.
Grinding (3-05-020-05)
3 0.0060 (0.0121) B 16a, 16b, 16c
Classifying (3-05-020-099)
1 0.0020 (0.0041) E 16e
Flash Drying (3-05-020-012)
1 0.0042 (0.0083) C 16f
Product Storage (3-05-102-05)
1 0.0003 (0.0006) E 16g
aEmission factors are in units of material throughput (process) unless noted
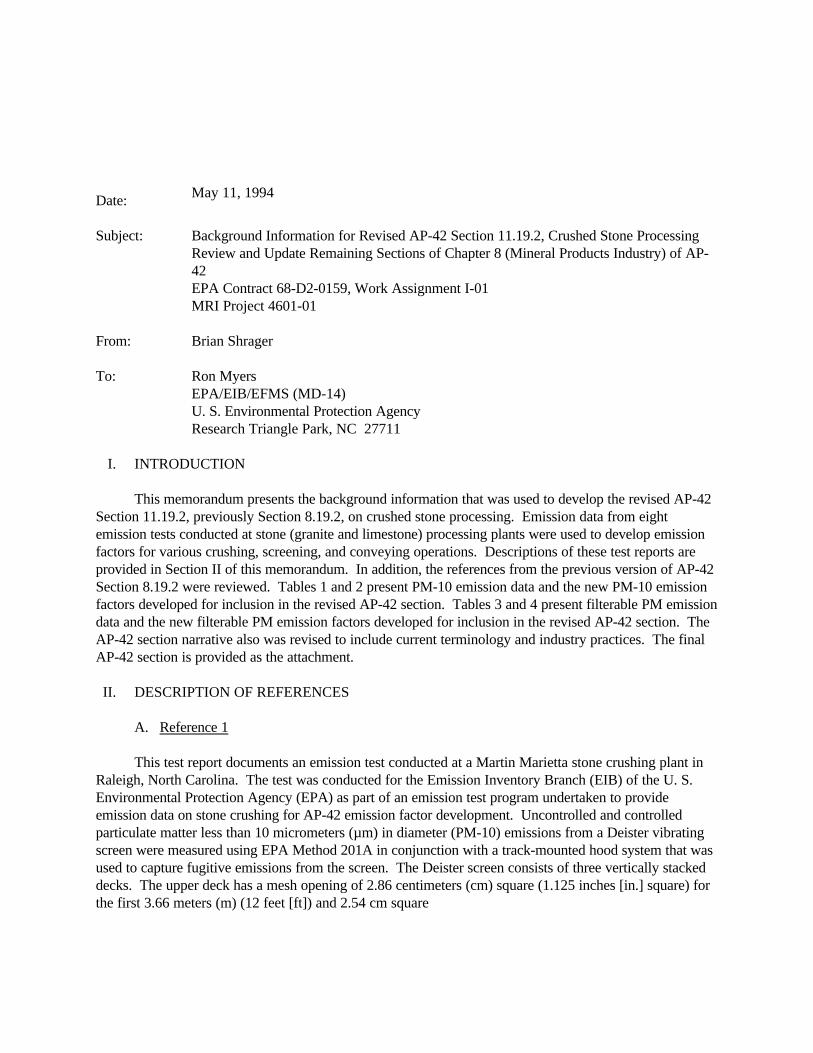
Date: May 11, 1994
Subject: Background Information for Revised AP-42 Section 11.19.2, Crushed Stone Processing
Review and Update Remaining Sections of Chapter 8 (Mineral Products Industry) of AP-42EPA Contract 68-D2-0159, Work Assignment I-01MRI Project 4601-01
From: Brian Shrager
To: Ron MyersEPA/EIB/EFMS (MD-14)U. S. Environmental Protection AgencyResearch Triangle Park, NC 27711
I. INTRODUCTION
This memorandum presents the background information that was used to develop the revised AP-42Section 11.19.2, previously Section 8.19.2, on crushed stone processing. Emission data from eightemission tests conducted at stone (granite and limestone) processing plants were used to develop emissionfactors for various crushing, screening, and conveying operations. Descriptions of these test reports areprovided in Section II of this memorandum. In addition, the references from the previous version of AP-42Section 8.19.2 were reviewed. Tables 1 and 2 present PM-10 emission data and the new PM-10 emissionfactors developed for inclusion in the revised AP-42 section. Tables 3 and 4 present filterable PM emissiondata and the new filterable PM emission factors developed for inclusion in the revised AP-42 section. TheAP-42 section narrative also was revised to include current terminology and industry practices. The finalAP-42 section is provided as the attachment.
II. DESCRIPTION OF REFERENCES
A. Reference 1
This test report documents an emission test conducted at a Martin Marietta stone crushing plant inRaleigh, North Carolina. The test was conducted for the Emission Inventory Branch (EIB) of the U. S.Environmental Protection Agency (EPA) as part of an emission test program undertaken to provideemission data on stone crushing for AP-42 emission factor development. Uncontrolled and controlledparticulate matter less than 10 micrometers (µm) in diameter (PM-10) emissions from a Deister vibratingscreen were measured using EPA Method 201A in conjunction with a track-mounted hood system that wasused to capture fugitive emissions from the screen. The Deister screen consists of three vertically stackeddecks. The upper deck has a mesh opening of 2.86 centimeters (cm) square (1.125 inches [in.] square) forthe first 3.66 meters (m) (12 feet [ft]) and 2.54 cm square

2
TABLE 1. SUMMARY OF EMISSION DATA FOR PM-10 EMISSIONS FROM CRUSHEDSTONE PROCESSING TEST REPORTSa
Data Rating: A
Source (material)
Averagematerialmoisturecontentb
No. oftestruns
Emissionfactor range,
kg/Mg (lb/ton)
Averageemissionfactor,
kg/Mg (lb/ton)RefNo.
Screening (granite) 0.48% 3 0.0010-0.0075(0.0020-0.015)
0.0035(0.0070)
1
Screening (granite) 1.57% 3 0.00028-0.00037(0.00056-0.00073)
0.00031(0.00061)
1
Tertiary crushing (granite) 0.44% 3 0.00075-0.0010(0.0015-0.0020)
0.00090(0.0018)
2
Tertiary crushing (granite) 1.77% 3 0.00017-0.00055(0.00034-0.0011)
0.00042(0.00083)
2
Tertiary crushing (granite) 0.70% 3 0.0011-0.0031(0.0021-0.0062)
0.0020(0.0040)
3
Tertiary crushing (granite) 1.78% 3 0.000075-0.00019(0.00015-0.00037)
0.00013(0.00026)
3
Screening (granite) 0.70% 3 0.012-0.015(0.024-0.030)
0.014(0.027)
3
Screening (granite) 1.78% 3 0.00049-0.00055(0.00097-0.0011)
0.00050(0.0010)
3
Fines crushing (granite) 0.97% 3 0.0017-0.013(0.0034-0.026)
0.0075(0.015)
4
Fines crushing (granite) 1.92% 3 0.00055-0.0013(0.0011-0.0026)
0.0010(0.0020)
4
Fines screening (granite) < 1.5% 3 0.021-0.050(0.042-0.10)
0.036(0.071)
4
Fines screening (granite) 1.68% 3 0.00060-0.0015(0.0012-0.0030)
0.0011(0.0021)
4
Conveyor transfer point (granite)
0.27% 3 0.00010-0.00021(0.00020-0.00042)
0.00014(0.00028)
5
Conveyor transfer point (granite)
0.66% 3 3.1x10⁻⁵-5.9x10⁻⁵
(6.1x10⁻⁵-1.2x10⁻⁴)4.6x10⁻⁵
(9.2x10⁻⁵)5
Conveyor transfer point (granite)
0.33% 3 0.00037-0.00081(0.00074-0.0016)
0.00053(0.0011)
5
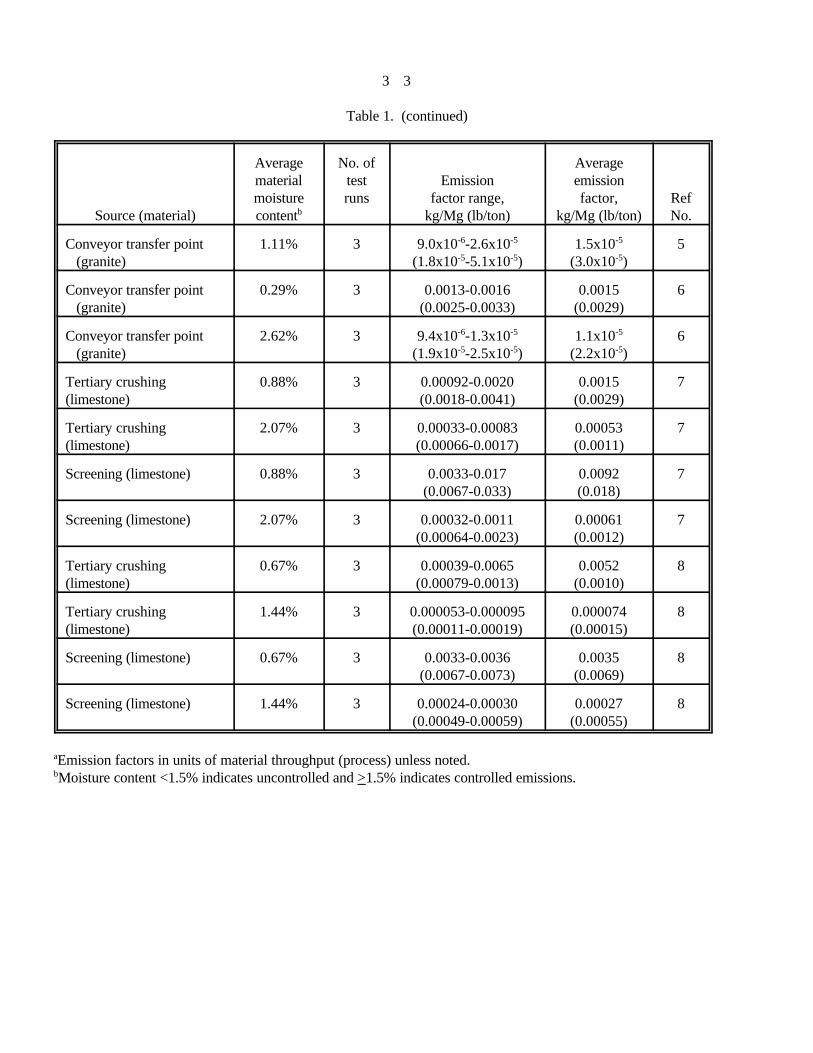
3
Table 1. (continued)
3
Source (material)
Averagematerialmoisturecontentb
No. oftestruns
Emissionfactor range,
kg/Mg (lb/ton)
Averageemissionfactor,
kg/Mg (lb/ton)RefNo.
Conveyor transfer point (granite)
1.11% 3 9.0x10⁻⁶-2.6x10⁻⁵
(1.8x10⁻⁵-5.1x10⁻⁵)1.5x10⁻⁵
(3.0x10⁻⁵)5
Conveyor transfer point (granite)
0.29% 3 0.0013-0.0016(0.0025-0.0033)
0.0015(0.0029)
6
Conveyor transfer point (granite)
2.62% 3 9.4x10⁻⁶-1.3x10⁻⁵
(1.9x10⁻⁵-2.5x10⁻⁵)1.1x10⁻⁵
(2.2x10⁻⁵)6
Tertiary crushing(limestone)
0.88% 3 0.00092-0.0020(0.0018-0.0041)
0.0015(0.0029)
7
Tertiary crushing(limestone)
2.07% 3 0.00033-0.00083(0.00066-0.0017)
0.00053(0.0011)
7
Screening (limestone) 0.88% 3 0.0033-0.017(0.0067-0.033)
0.0092(0.018)
7
Screening (limestone) 2.07% 3 0.00032-0.0011(0.00064-0.0023)
0.00061(0.0012)
7
Tertiary crushing(limestone)
0.67% 3 0.00039-0.0065(0.00079-0.0013)
0.0052(0.0010)
8
Tertiary crushing(limestone)
1.44% 3 0.000053-0.000095(0.00011-0.00019)
0.000074(0.00015)
8
Screening (limestone) 0.67% 3 0.0033-0.0036(0.0067-0.0073)
0.0035(0.0069)
8
Screening (limestone) 1.44% 3 0.00024-0.00030(0.00049-0.00059)
0.00027(0.00055)
8
aEmission factors in units of material throughput (process) unless noted.bMoisture content <1.5% indicates uncontrolled and >1.5% indicates controlled emissions.

4
TABLE 2. SUMMARY OF PM-10 EMISSION FACTORSa
(Factors represent uncontrolled emissions unless noted)
Process (SCC)No. oftests
Average emissionfactor, kg/Mg (lb/ton)
Emissionfactor rating Ref. Nos.
Screening (3-05-020-02,-03)
4 0.0076 (0.015) C 1, 3, 7, 8
Screening with wet suppression(3-05-020-02,-03)
4 0.00042 (0.00084) C 1, 3, 7, 8
Tertiary crushing(3-05-020-03)
4 0.0012 (0.0024) C 2, 3, 7, 8
Tertiary crushing with wet suppression(3-05-020-03)
4 0.00029 (0.00059) C 2, 3, 7, 8
Fines crushing(3-05-020-05)
1 0.0075 (0.015) E 4
Fines crushing with wet suppression (3-05-020-05)
1 0.0010 (0.0020) E 4
Fines screening(3-05-020- )
1 0.036 (0.071) E 4
Fines screening with wet suppression(3-05-020- )
1 0.0011 (0.0021) E 4
Conveyor transfer point(3-05-020-06)
3 0.00072 (0.0014) D 5, 6
Conveyor transfer point with wet suppression(3-05-020-06)
3 2.4x10⁻⁵ (4.8x10⁻⁵) D 5, 6
aEmission factors in units of material throughput (process) unless noted.

5
TABLE 3. SUMMARY OF EMISSION DATA FOR FILTERABLE PM EMISSIONS FROMCRUSHED STONE PROCESSING TEST REPORTSa
Data Rating: B (unless otherwise noted)
Source (material)
Averagematerialmoisturecontentb
No.of
testruns
Emissionfactor range,
kg/Mg (lb/ton)
Averageemission factor,kg/Mg (lb/ton) Ref
No.
Tertiary crushing (granite)
0.70% 3 0.021-0.045 (0.043-0.091)
0.037(0.074)
3
Tertiary crushing (granite)
1.78% 3 0.00016-0.00071(0.00032-0.0014)
0.00044(0.00087)
3
Screening (granite) 0.70% 3 0.062-0.16 (0.12-0.31) 0.097 (0.19) 3
Screening (granite) 1.78% 3 0.00096-0.0018(0.0019-0.0035)
0.0015(0.0029)
3
Fines crushing (granite) 0.97% 3 0.13-0.58 (0.26-1.2) 0.36 (0.72) 4
Fines crushing (granite) 1.92% 3 0.065-0.11 (0.13-0.23) 0.067 (0.13) 4
Fines screening (granite) < 1.5% 3 0.11-0.18 (0.22-0.37) 0.15 (0.30) 4
Fines screening (granite) 1.68% 3 0.00096-0.0027(0.0019-0.0054)
0.0018(0.0036)
4
Conveyor transfer point (granite)
0.27% 3 0.0012-0.0023(0.0023-0.0046)
0.0015(0.0031)
5
Conveyor transfer point (granite)
0.66% 3 9.3x10⁻⁵-0.00019(0.00019-0.00037)
0.00014(0.00028)
5
Conveyor transfer point (granite)
0.33% 3 0.0054-0.0087(0.011-0.017)
0.0078(0.014)
5
Conveyor transfer point (granite)
1.11% 3 2.3x10⁻⁵-6.5x10⁻⁵
(4.6x10⁻⁵-1.3x10⁻⁴)3.8x10⁻⁵
(7.6x10⁻⁵)5
Conveyor transfer point (granite)
0.29% 3 0.033-0.036 (0.066-0.071)
0.034 (0.069)
6
Conveyor transfer point (granite)
2.62% 3 1.3x10⁻⁵-2.5x10⁻⁵
(2.6x10⁻⁵-5.0x10⁻⁵)1.9x10⁻⁵
(3.8x10⁻⁵)6
Conveyor transfer pointc (granite)
0.29% 3 0.014-0.035(0.029-0.069)
0.028(0.055)
6
Conveyor transfer pointc (granite)
2.62% 3 1.1x10⁻⁵-8.1x10⁻⁵
(2.3x10⁻⁵-1.6x10⁻⁴)4.0x10⁻⁵
(8.0x10⁻⁵)6

6
Table 3. (continued)
6
Source (material)
Averagematerialmoisturecontentb
No.of
testruns
Emissionfactor range,
kg/Mg (lb/ton)
Averageemission factor,kg/Mg (lb/ton) Ref
No.
Tertiary crushing (limestone)
0.88% 3 0.0032-0.012(0.0064-0.023)
0.0073(0.015)
7
Tertiary crushing (limestone)
2.07% 3 0.00067-0.0022(0.0013-0.0043)
0.0013(0.0025)
7
Screening (limestone) 0.88% 3 0.016-0.10 (0.032-0.21) 0.073 (0.15) 7
Screening (limestone) 2.07% 3 0.0020-0.014(0.0040-0.029)
0.0062(0.012)
7
Tertiary crushing (limestone)
0.67% 3 0.00064-0.014(0.0013-0.027)
0.0096(0.019)
8
Tertiary crushing (limestone)
1.44% 3 0.00042-0.00074(0.00083-0.0015)
0.00064(0.0013)
8
Screening (limestone) 0.67% 3 0.012-0.052(0.025-0.10)
0.037(0.074)
8
Screening (limestone) 1.44% 3 0.0016-0.0021(0.0031-0.0043)
0.0019(0.0037)
8
Conveyor transfer pointd (limestone)
e3 1.0x10⁻⁵-2.0x10⁻⁵
(2.0x10⁻⁵-4.0x10⁻⁵)1.5x10⁻⁵
(3.0x10⁻⁵)9
Primary crushingd (limestone)
e3 0.00010-0.00065
(0.00020-0.0013)0.00035
(0.00070)9
Screeningd (limestone)e
3 1.0x10⁻⁵-0.001(2.0x10⁻⁵-0.002)
0.00037(0.00074)
9
Screeningf e9 0.013-0.16 (0.025-0.33) 0.083 (0.17) 10
Screeningf 1.5% 9 0.0011-0.011(0.0021-0.023)
0.0038(0.0076)
10
Screeningf 1.5% 9 0.00070-0.021(0.0014-0.042)
0.0082(0.016)
10
aEmission factors in units of material throughput (process) unless noted.bMoisture content <1.5% indicates uncontrolled and >1.5% indicates controlled emissions.cData are A-rated.dData are C-rated.eMaterial moisture content is assumed to be low because wet suppression was not used.

6
Table 3. (continued)
7
fData include emissions from three different types of screens.

8
TABLE 4. SUMMARY OF FILTERABLE PM EMISSION FACTORSa
(Factors represent uncontrolled emissions unless noted)
Process (SCC)No. oftests
Average emissionfactor, kg/Mg (lb/ton)
Emissionfactor rating
Ref.Nos.
Screening (3-05-020-02,-03)
4 0.073 (0.15) E 3, 7, 8,10
Screening with wet suppression(3-05-020-02,-03)
5 0.0042 (0.0084) E 3, 7, 8,10
Tertiary crushing(3-05-020-03)
3 0.018 (0.036) E 3, 7, 8
Tertiary crushing with wet suppression(3-05-020-03)
3 0.00079 (0.0016) E 3, 7, 8
Fines crushing(3-05-020-05)
1 0.36 (0.72) E 4
Fines crushing with wet suppression(3-05-020-05)
1 0.067 (0.13) E 4
Fines screening(3-05-020- )
1 0.15 (0.30) E 4
Fines screening with wet suppression(3-05-020- )
1 0.0018 (0.0036) E 4
Conveyor transfer point(3-05-020-06)
3 0.013 (0.026) E 5, 6
Conveyor transfer point with wet suppression(3-05-020-06)
3 0.000069 (0.00014) E 5, 6
Primary crushing(3-05-020-01)
1 0.00035 (0.00070) E 9
aEmission factors in units of material throughput (process) unless noted.

9
(1 in. square) for the last 2.44 m (8 ft). The middle deck has a mesh opening of 1.47 cm square (0.58 in. square),and the lower deck has slot openings of 0.30 cm (0.118 in.) by 2.54 cm (1 in.). Ambient levels of PM-10 werequantified using HiVol samplers, and the ambient concentrations were subtracted from the Method 201Aconcentrations to determine the actual emissions from the screen. Wet suppression was used to control emissionsfrom the screen. Water spray nozzles are located on the conveyor underneath the tertiary crusher, at one conveyortransfer point, at the top of the stream conveyor above the Deister screen, and on the inlet chute to the Deisterscreen. The targeted moisture contents of the raw material (granite) during the uncontrolled and controlled runswere <1.5 percent and >1.5 percent, respectively. Average material moisture contents are shown in Table 1. Inaddition, sieve analyses were performed on stone samples taken from the conveyor that feeds the screen. Siltcontent of the stone as sampled (wet) was negligible, and the average silt content of the sample after drying was3.35 percent. The relatively small amount of silt particles (<75 µm) present in the raw material suggests that thepotential for PM-10 emissions from the material processing operations is low.
Uncontrolled and controlled PM-10 emission factors were developed from the emission data and thematerial processing rates that were measured during the testing. These emission factors are shown in Table 1. The emission factors presented differ slightly from the emission factors reported in the test report because averageproduction rates were used in the test report, whereas actual run-by-run production rates were used in the dataanalyses presented in this memorandum. The data are assigned an A rating. The report provided adequate detail,the test methodology was sound, and no problems were reported.
B. Reference 2
This test report documents an emission test conducted at a Martin Marietta stone crushing plant in Garner,North Carolina. The test was conducted for EIB as part of an emission test program undertaken to provideemission data on stone crushing for AP-42 emission factor development. Uncontrolled and controlled PM-10emissions from a Model 1560 Omnicone conical-type tertiary crusher were measured using EPA Method 201A inconjunction with a quasi-stack system, which was used to capture fugitive emissions from the crusher. Thecrusher reduces 8.9- to 10.2-cm (3.5- to 4-in.) stone to 2.5 cm (1 in.) and smaller. The crusher inlet and outleteach were enclosed and tested separately. Wet suppression was used to control emissions from the crusher. Waterspray nozzles are located on the conveyor underneath the tertiary crusher, at one conveyor transfer point, and atthe entrance to the surge bin and vibrating feeder. The targeted moisture contents of the raw material (granite)during the uncontrolled and controlled runs were <1.5 percent and $1.5 percent, respectively. Average materialmoisture contents are presented in Table 1. In addition, sieve analyses were performed on stone samples takenfrom the conveyor that feeds the surge bin prior to the crusher. The results of the sieve analyses are notdocumented in the test report.
Uncontrolled and controlled PM-10 emission factors were developed from the emission data and thematerial processing rates that were measured during the test. These emission factors are shown in Table 1. Thedata are assigned an A rating. The report provided adequate detail, the test methodology was sound, and noproblems were reported.
C. Reference 3
This test report documents an emission test conducted at Vulcan Materials Company stone crushing plant inSkippers, Virginia. The test was conducted for the National Stone Association to determine emission factors forvarious stone crushing process operations. Uncontrolled and controlled PM-10 and filterable PM emissions froma cone crusher (tertiary crusher) and a Deister vibrating screen were measured using EPA Method 201A inconjunction with a quasi-stack and a track-mounted hood system, which were used to capture fugitive emissions
10
from the crusher and screen, respectively. The crusher produces stone that is 7.6 cm (3 in.) and smaller in size. The Deister screen consists of three vertically stacked decks. The upper deck has a mesh opening of2.86 cm square (1.125 in. square) for the first 3.66 m (12 ft) and 2.54 cm square (1.0 in.) for the last 2.44 m (8ft). The middle deck has a mesh opening of 1.47 cm square (0.58 in. square), and the lower deck has slot openingsof 0.30 cm (0.118 in.) by 2.54 cm (1.0 in.). Wet suppression was used to control emissions from both processes. Water spray nozzles are located on the vibrating feeder to the crusher, on the conveyor below the crusher, and onthe inlet chute to the Deister screens. The targeted moisture contents of the raw material (granite) during theuncontrolled and controlled runs were <1.5 percent and $1.5 percent, respectively. Average material moisturecontents are shown in Table 1. In addition, sieve analyses were performed on stone samples taken from a processconveyor. The average silt content of the stone as sampled (wet) was 3.3 percent, and the average silt content ofthe sample after drying was 4.0 percent. The relatively small amount of silt particles (<75 µm) present in the rawmaterial suggests that the potential for PM-10 emissions from the material processing operations is low.
Uncontrolled and controlled PM-10 and filterable PM emission factors were developed from the emissiondata gathered and the material processing rates that were measured during the test. These emission factors areshown in Table 1. The PM-10 data are assigned an A rating. The filterable PM data are assigned a B rating. Although Method 201A is not the reference test method for quantifying filterable PM emissions, the preseparatorand filter catch for the method should provide representative results for filterable PM. The report providedadequate detail, the test methodology was sound, and no problems were reported.
D. Reference 4
This test report documents an emission test at Nello L. Teer stone crushing plant in Raleigh, NorthCarolina. The test was conducted for EIB as part of an emission test program undertaken to provide emission dataon stone crushing for AP-42 emission factor development. Uncontrolled and controlled PM-10 and filterable PMemissions from a Model 1560 Omnicone conical-type crusher (fines crusher) and a TD Seco vibrating screen(fines screen) were measured using EPA Method 201A in conjunction with a quasi-stack and a track-mountedhood system, which were used to capture fugitive emissions from the crusher and screen, respectively. Thecrusher reduces 2.5- to 1.9-cm (1- to 0.75-in.) stone to 0.476 cm (0.188 in.) and smaller. The screen consisted ofthree decks. The top and middle decks were 2.22 and 1.43 cm square (0.875 and 0.563 in. square), respectively. The bottom deck had slots 0.476 by 2.54 cm (0.188 by 1 in.). The crusher inlet and outlet were each enclosed andtested separately. Wet suppression was used to control emissions from both processes. Water spray nozzles arelocated at the crusher inlet, midway through the crusher body, at the crusher outlet, and at the conveyor transferpoint to the screen. The targeted moisture contents of the raw material (granite) during the uncontrolled andcontrolled runs were <1.5 percent and $1.5 percent, respectively. Average material moisture contents arepresented in Table 1. In addition, sieve analyses were performed on stone samples taken from the conveyor thatfeeds the screen and the conveyor that carries the crusher product. The results of the sieve analyses are notdocumented in the test report.
Uncontrolled and controlled PM-10 and filterable PM emission factors were developed from the emissiondata and the material processing rates that were measured during the test. These emission factors are shown inTable 1. The PM-10 data are assigned an A rating. The filterable PM data are assigned a B rating. AlthoughMethod 201A is not the reference test method for quantifying filterable PM emissions, the preseparator and filtercatch for the method should provide representative results for filterable PM. The report provided adequate detail,the test methodology was sound, and no problems were reported during the valid test runs.
11
E. Reference 5
This test report documents an emission test at Wake Stone Corporation stone crushing plant in Knightdale,North Carolina. The test was conducted for EIB as part of an emission test program undertaken to provideemission data on stone crushing for AP-42 emission factor development. Uncontrolled and controlled PM-10 andfilterable PM emissions from two separate conveyor transfer points were measured using EPA Method 201A inconjunction with quasi-stack systems, which were used to capture fugitive emissions from the two transfer points. Wet suppression was used to control transfer point emissions. Water spray nozzles are located on the exitconveyor underneath each transfer point, and at numerous other locations throughout the process. The targetedmoisture contents of the raw material (granite) during the uncontrolled and controlled runs were <1.5 percent and$1.5 percent, respectively. Average material moisture contents are presented in Table 1. In addition, sieveanalyses were performed on stone samples taken from each of the conveyor lines. The average silt content of thesamples after drying was 1.4 percent for the first transfer point and 2.4 percent for the second transfer point. Therelatively small amount of silt particles (<75 µm) present in the raw material suggests that the potential for PM-10emissions from the material processing operations is low.
Uncontrolled and controlled PM-10 and filterable PM emission factors were developed from the emissiondata and the material processing rates that were measured during the test. These emission factors are shown inTable 1. The PM-10 data are assigned an A rating. The filterable PM data are assigned a B rating. AlthoughMethod 201A is not the reference test method for quantifying filterable PM emissions, the preseparator and filtercatch for the method should provide representative results for filterable PM. The report provided adequate detail,the test methodology was sound, and no problems were reported during the valid test runs.
F. Reference 6
This test report documents an emission test at a Martin Marietta stone crushing plant in Raleigh, NorthCarolina. The test was conducted for the National Stone Association as part of an emission test programundertaken to provide emission data on stone crushing for AP-42 emission factor development. Uncontrolled andcontrolled PM-10 and filterable PM emissions from a conveyor transfer point were measured using EPA Method201A and EPA Method 5, respectively, in conjunction with a quasi-stack system, which was used to capturefugitive emissions from the transfer point. Wet suppression was used to control transfer point emissions. Waterspray nozzles are located on the exit conveyor underneath the transfer point, and at numerous other locationsthroughout the process. The targeted moisture contents of the raw material (granite) during the uncontrolled andcontrolled runs were <1.5 percent and $1.5 percent, respectively. Average material moisture contents arepresented in Table 1. In addition, sieve analyses were performed on stone samples taken from the conveyor. Theaverage silt content of the dried stone was 2.2 percent. The relatively small amount of silt particles (<75 µm)present in the raw material suggests that the potential for PM-10 emissions from the material processingoperations is low.
Uncontrolled and controlled PM-10 and filterable PM emission factors were developed from the emissiondata and the material processing rates that were measured during the test. These emission factors are shown inTable 1. The PM-10 data and the filterable PM (Method 5) data are assigned an A rating. The filterable PM datafrom the Method 201A tests are assigned a B rating. Although Method 201A is not the reference test method forquantifying filterable PM emissions, the preseparator and filter catches for the method should provide results thatare representative for filterable PM. In addition, the emission factors developed from the Method 201A data aresimilar to the emission factors developed using the Method 5 data. The report provided adequate detail, the testmethodology was sound, and no problems were reported during the valid test runs.

12
G. Reference 7
This test report documents an emission test conducted at Vulcan Materials Company stone crushing plant inBristol, Tennessee. The test was conducted for EIB as part of an emission test program undertaken to provideemission data on stone crushing for AP-42 emission factor development. Uncontrolled and controlled PM-10 andfilterable PM emissions from a cone crusher (tertiary crusher) and a triple-deck vibrating screen were measuredusing EPA Method 201A in conjunction with a quasi-stack and a track-mounted hood system, which were used tocapture fugitive emissions from the crusher and screen, respectively. The crusher produces stone 7.6 cm (3 in.)and smaller in size. The screen consists of three vertically stacked decks. The upper deck has a mesh opening of3.175 cm square (1.25 in. square). The middle deck has a mesh opening of 1.59 cm square (0.625 in. square), andthe lower deck has a mesh opening of 0.635 cm square (0.25 in. square). Wet suppression was used to controlemissions from both processes. Water spray nozzles are located in the feed hopper to the crusher and on theconveyor below the crusher. The targeted moisture contents of the raw material (limestone) during theuncontrolled and controlled runs were <1.0 percent and $1.0 percent, respectively. Average material moisturecontents are shown in Table 1. In addition, sieve analyses were performed on stone samples taken from a processconveyor. The average silt content of the stone was 1.8 percent. The relatively small amount of silt particles(<75 µm) present in the raw material suggests that the potential for PM-10 emissions from the material processingoperations is low.
Uncontrolled and controlled PM-10 and filterable PM emission factors were developed from the emissiondata gathered and the material processing rates that were measured during the test. These emission factors areshown in Table 1. The PM-10 data are assigned an A rating. The filterable PM data are assigned a B rating. Although Method 201A is not the reference test method for quantifying filterable PM emissions, the preseparatorand filter catch for the method should provide representative results for filterable PM. The report providedadequate detail, the test methodology was sound, and no problems were reported.
H. Reference 8
This test report documents an emission test conducted at Vulcan Materials Company stone crushing plant inMarysville, Tennessee. The test was conducted for EIB as part of an emission test program undertaken to provideemission data on stone crushing for AP-42 emission factor development. Uncontrolled and controlled PM-10 andfilterable PM emissions from a cone crusher (tertiary crusher) and a triple-deck vibrating screen were measuredusing EPA Method 201A in conjunction with a quasi-stack and a track-mounted hood system, which were used tocapture fugitive emissions from the crusher and screen, respectively. The crusher produces stone 7.6 cm (3 in.)and smaller in size. The screen consists of three vertically stacked decks. The upper deck has a mesh opening of3.175 cm square (1.25 in. square). The middle deck has a mesh opening of 1.59 cm square (0.625 in. square), andthe lower deck has a mesh opening of 0.635 cm square (0.25 in. square). Wet suppression was used to controlemissions from both processes. Water spray nozzles are located on the vibrating feeder to the crusher. Thetargeted moisture contents of the raw material (limestone) during the uncontrolled and controlled runs were < 1.0percent and $1.0 percent, respectively. Average material moisture contents are shown in Table 1. In addition,sieve analyses were performed on stone samples taken from a process conveyor. The average silt content of thestone was 3.25 percent. The relatively small amount of silt particles (<75 µm) present in the raw materialsuggests that the potential for PM-10 emissions from the material processing operations is low.
Uncontrolled and controlled PM-10 and filterable PM emission factors were developed from the emissiondata gathered and the material processing rates that were measured during the test. These emission factors areshown in Table 1. The PM-10 data are assigned an A rating. The filterable PM data are assigned a B rating. Although Method 201A is not the reference test method for quantifying filterable PM emissions, the preseparator

13
and filter catch for the method should provide representative results for filterable PM. The report providedadequate detail, the test methodology was sound, and no problems were reported.
I. Reference 9
This document, which was Reference 1 in the previous AP-42 Section 8.19.2, contains summary data fromseveral emission tests performed at stone crushing plants. Particulate matter emissions were measured atbaghouse inlets using EPA Method 5 sampling trains, and each test consisted of three runs. Emission sources,controls, material types, and emission factors for 12 tests at 5 plants were summarized in the document. Datafrom several of the tests were not analyzed because process rates were not documented. Data from nine of thetests were not analyzed because they represent emissions from combined sources. Data from three of the testswere used to quantify filterable PM emissions from a conveyor transfer point, a primary crusher, and a screen(referred to as a secondary screen in the document).
The data that were analyzed from the three tests described above are assigned a C rating. The testmethodologies were sound, and no problems were reported during the valid test runs. However, the document didnot provide original data sheets, and little detail about the raw materials was documented. The raw material isassumed to be dry because fabric filtration systems were used for emission control. The data from the other testsdo not meet the minimum criteria for developing emission factors for inclusion in the revised AP-42 section.
J. Reference 10
This report, which was Reference 5 in the previous AP-42 Section 8.19.2, contains a review of emissionfactors developed in several of the references described above. In addition, data and emission factors from twoemission tests performed by Engineering-Science are provided in Appendix C. The emission tests were conductedat two sand and gravel processing facilities, and the screens that were tested were horizontal screens. Data fromthese two emission tests for primary, secondary, and tertiary screening operations are combined to represent allscreening operations, because no consistent correlation between the level of screening and the magnitude of PMemissions was established by the data. The quasi-stack method was used to capture fugitive emissions from thescreens tested at both plants. Both tests were performed using wet impingement sampling trains (South CoastAQMD Method) for total PM, and cascade impactors for size-specific PM.
The PM data are assigned a B rating. The test methodology appeared to be sound and no problems werereported during the valid test runs. However, the report is a secondary reference, and does not provide sufficientdetail to warrant an A rating. The PM-10 data are not rated because only single-run particle-size data areprovided in the report.
K. Reference 11
This document, which was Reference 2 in the previous AP-42 Section 8.19.2, examines the granite crushingindustry and the potential environmental impacts of industry emissions. Topics addressed include a sourcedescription, emissions, control technology, and growth and nature of the industry.
Emission factors for several granite crushing processes were developed using data from two graniteprocessing facilities. Only summary information is provided in the document, although details on the processesand test methodology are provided. A GCA respirable dust monitor was used to sample PM-10 emissions, andemission rates were calculated using dispersion models. Emissions were sampled from several processes,including dumping to the primary crusher, and secondary crushing and screening. The monitor was placed about

14
100 feet from the source being sampled. No emission controls (for the plants tested) were specified, and the siltand moisture contents of the raw materials were not recorded.
The data do not meet the minimum criteria for developing emission factors for inclusion in the AP-42section. The test methodology was not acceptable because only one monitor was used, and the monitor was too farfrom the source during testing. In addition, no detail about the moisture and silt contents of the raw material wasprovided.
L. Reference 12
This document, which was Reference 3 in the previous AP-42 Section 8.19.2, examines the stone crushingindustry and the potential environmental impacts of industry emissions. Topics addressed include a sourcedescription, emissions, control technology, and growth and nature of the industry.
Emission factors for several stone crushing processes were developed using data from two traprockprocessing facilities. Only summary information is provided in the document, although details on the processesand test methodology are provided. A GCA Model RDM 101-4 respirable dust monitor was used to samplePM-10 emissions, and emission rates were calculated using dispersion models. Emissions were sampled fromseveral processes, including primary crushing and unloading, secondary crushing and screening, tertiary crushingand screening, fines crushing and screening, and conveying. The monitor was placed about 100 feet from thesource being sampled. No emission controls were specified, and the silt and moisture contents of the raw materialswere not recorded.
The data do not meet the minimum criteria for developing emission factors for inclusion in the AP-42section. The test methodology not acceptable because only one monitor was used, and the monitor was too farfrom the source during testing. In addition, no detail about the moisture and silt contents of the raw material wasprovided.
M. Reference 13
This document is divided into four sections, which are addressed separately in the following discussion.
Section I discusses the emission study (sponsored by the construction aggregate industry) that wasperformed by Monsanto Research Corporation (MRC) and The Research Corporation of New England (TRC). Inaddition, several conclusions about the control of fugitive dust emissions from construction aggregate processingfacilities were drawn from a comparison of AP-42, MRC's source assessment studies, and the MRC-TRC study. These conclusions are: (1) AP-42 emission factors are from 10 to 10,000 times higher than the latest (1979)measurements of uncontrolled emissions; (2) baghouse emissions from aggregate crushing operations are oftenhigher than uncontrolled emissions (apparently due to the suspension of fine particles, which are normallyassociated with larger particles and are not normally released to the atmosphere); (3) the emission factorsdeveloped by MRC in the source assessment program sponsored by EPA are within one order of magnitude of theemission factors developed in the MRC-TRC study, indicating that both data sets are highly reliable; (4) wetsuppression can achieve between 80 and 90 percent control of the emissions from crushers; and (5) wetsuppression is more efficient than fabric filters for controlling PM-10 emissions from crushers. To concludeSection I, an ambient air quality study performed at a sand and gravel production facility in Colorado issummarized. The study concluded that the sand and gravel processing operations did not have a detectable impacton air quality.

15
Section II documents the MRC study that included a compilation of emission data from tests at seven stonecrushing plants that processed a variety of aggregates. Tests were conducted on four primary crushers, sevensecondary crushers, three tertiary crushers, and two fines crushers. Aggregate types included granite (one plant),sand and gravel (two plants), traprock (one plant), and limestone (three plants). One of the limestone processingplants used wet suppression to control PM emissions. Emission factors for PM-10 and PM<50 µm weredeveloped for all of the processes tested and were presented by process, aggregate type, and control methods.
A GCA Model RDM 101-4 dust monitor was used to detect fugitive PM emissions downwind of theprocess operations. The monitor was placed approximately 30 feet from the source during each tests. The "tracergas method" was used to determine the percentage of PM-10 measured with the GCA instrument that was emittedfrom the source being tested. The silt and moisture contents of the raw materials were not specified.
The data from this testing program do not meet the minimum criteria for developing emission factors for therevised AP-42 section because an adequate number of downwind monitors were not used during testing. Theupwind-downwind test method, specifies a minimum of five downwind samplers for a valid test.
Section III documents the TRC study that included a compilation of emission data from tests at six stonecrushing plants that processed a variety of aggregates. Tests were conducted on four primary crushers, sixsecondary crushers, three tertiary crushers, and one fines crusher. Aggregate types included granite (one plant),sand and gravel (two plants), traprock (one plant), and limestone (two plants). The granite processing plant andboth limestone processing plants used wet suppression to control PM emissions. Emission factors for PM-10 andPM<50 µm were developed for all of the processes tested, and were presented by process, aggregate type, andcontrol methods.
A GCA Model RDM 101-4 dust monitor was used to detect fugitive PM emissions downwind of theprocess operations. The monitor was placed approximately 30 feet from the source during each test. The tracergas method was used to determine the percentage of PM-10 measured with the GCA instrument that was emittedfrom the source being tested. The silt and moisture contents of the raw materials were not specified.
The data from this testing program do not meet the minimum criteria for developing emission factors for therevised AP-42 section because an adequate number of downwind monitors were not used during testing. Theupwind-downwind test method, specifies a minimum of five downwind samplers for a valid test.
Section IV, entitled "Semi-annual Report: Ambient Air Monitoring Program, Cannon-ERTL Site," containsno data that can be used for emission factor development.
N. Reference 14
This report, which was Reference 4 in the previous AP-42 Section 8.19.2, is a compilation of emissionfactors from 16 test reports. The emission factors from all of the reports were rated and combined by process inorder to develop a single emission factor for each process tested. Data quantifying PM-10 emissions from primaryand secondary crushing operations (from NSPS test reports) were not used for emission factor developmentbecause adequate details about the test methodology are not provided, and problems with cascade impactor testsperformed before about 1981 have been reported. The other data presented in this document are presented inseveral of the other references described in this review.
III. RESULTS OF DATA ANALYSIS

16
Emission factors were developed for conveyor transfer points, screening, primary crushing, tertiarycrushing, fines crushing, and fines screening operations. The only data available for secondary crushing were ofquestionable quality and were not consistent with the emission tests included in this review. Therefore, the revisedAP-42 section does not include emission factors for primary and secondary crushing of stone. However, theemission factors for tertiary stone crushing can be used as an upper limit to primary and secondary crushing.
Emissions generally were considered uncontrolled if the raw material moisture content was less than1.5 percent and controlled if the raw material moisture content was greater than or equal to 1.5 percent. Thematerial moisture contents in the Reference 5 and Reference 8 emission tests did not reach the targeted 1.5 percentfor the controlled runs. However, data from these tests are consistent with data from other controlled tests and aretreated as controlled. Table 2 presents the PM-10 emission factors and Table 4 presents the filterable PMemission factors developed using the data from References 1 through 10. The PM-10 emission factors forscreening and tertiary crushing were assigned a C rating because A-rated data from four tests (which is considereda sufficient number of tests to warrant a C rating) conducted at "typical" facilities were used. The PM-10emission factors for fines screening and crushing were assigned an E rating because data from a single A-rated testwere used. The PM-10 emission factors for conveyor transfer points were assigned a D rating because data fromonly three tests (conducted at two typical facilities) were used. All of the filterable PM emission factors, with theexception of the primary crushing emission factor, were assigned an E rating because Method 201A, which is notthe reference test method for filterable PM, was used to quantify emissions (Reference 6 included a Method 5 test). The primary crushing emission factor was assigned an E rating because it is based on a single C-rated test.
In addition to the emission factors described above, the revised AP-42 section includes emission factors forwet drilling, and truck unloading and loading that were retained from the previous version of AP-42Section 8.19.2. Although the quality of the data upon which these emission factors was based is questionable, noother data on those sources were located during this review.
IV. REFERENCES
1. J. Richards, T. Brozell, and W. Kirk, PM-10 Emission Factors for a Stone Crushing Plant Deister VibratingScreen, EPA Contract No. 68-D1-0055, Task 2.84, U. S. Environmental Protection Agency, ResearchTriangle Park, NC, February 1992.
2. J. Richards, T. Brozell, and W. Kirk, PM-10 Emission Factors for a Stone Crushing Plant Tertiary Crusher,EPA Contract No. 68-D1-0055, Task 2.84, U. S. Environmental Protection Agency, Research Triangle Park,NC, February 1992.
3. W. Kirk, T. Brozell, and J. Richards, PM-10 Emission Factors for a Stone Crushing Plant Deister VibratingScreen and Crusher, National Stone Association, Washington DC, December 1992.
4. T. Brozell, J. Richards, and W. Kirk, PM-10 Emission Factors for a Stone Crushing Plant Tertiary Crusherand Vibrating Screen, EPA Contract No. 68-D0-0122, U. S. Environmental Protection Agency, ResearchTriangle Park, NC, December 1992.
5. T. Brozell, PM-10 Emission Factors for Two Transfer Points at a Granite Stone Crushing Plant, EPAContract No. 68-D0-0122, U. S. Environmental Protection Agency, Research Triangle Park, NC, January1994.

17
6. T. Brozell, PM-10 Emission Factors for a Stone Crushing Plant Transfer Point, EPA Contract No.68-D0-0122, U. S. Environmental Protection Agency, Research Triangle Park, NC, February 1993.
7. T. Brozell and J. Richards, PM-10 Emission Factors for a Limestone Crushing Plant Vibrating Screen andCrusher for Bristol, Tennessee, EPA Contract No. 68-D2-0163, U. S. Environmental Protection Agency,Research Triangle Park, NC, July 1993.
8. T. Brozell and J. Richards, PM-10 Emission Factors for a Limestone Crushing Plant Vibrating Screen andCrusher for Marysville, Tennessee, EPA Contract No. 68-D2-0163, U. S. Environmental Protection Agency,Research Triangle Park, NC, July 1993.
9. Air Pollution Control Techniques for Nonmetallic Minerals Industry, EPA-450/3-82-014, U. S.Environmental Protection Agency, Research Triangle Park, NC, August 1982.
10. Review Emission Data Base and Develop Emission Factors for the Construction Aggregate Industry,Engineering-Science, Inc., Arcadia, CA, September 1984.
11. P. K. Chalekode et al., Emissions from the Crushed Granite Industry: State of the Art, EPA-600/2-78-021,U. S. Environmental Protection Agency, Washington, DC, February 1978.
12. T. R. Blackwood et al., Source Assessment: Crushed Stone, EPA-600/2-78-004L, U. S. EnvironmentalProtection Agency, Washington, DC, May 1978.
13. An Investigation of Particulate Emissions from Construction Aggregate Crushing Operations and RelatedNew Source Performance Standards, National Crushed Stone Association, Washington, DC, December1979.
14. F. Record and W. T. Harnett, Particulate Emission Factors for the Construction Aggregate Industry, DraftReport, GCA-TR-CH-83-02, EPA Contract No. 68-02-3510, GCA Corporation, Chapel Hill, NC, February1983.
Attachment: See current AP-42 section 11.19.2