AND OBSERVATKONAL ASSESSMENT OF DEMANDS · Chapter2 LITERATUREREVIEW ... Table E7 Table ES Table E9...
91
LOST TIME INJURIES: DEMOGRAPEIC VARIABLES, SELF-REPORTS, AND OBSERVATKONAL ASSESSMENT OF OCCUPATIONAL DEMANDS by Victoria R Martin Submitted in partial fulfillment of the requirements for the degree of Master of Science Dalhousie University Halifax, Nova Scotia June 2000 O Copyright by Victoria R Martin, 2000
Transcript of AND OBSERVATKONAL ASSESSMENT OF DEMANDS · Chapter2 LITERATUREREVIEW ... Table E7 Table ES Table E9...

LOST TIME INJURIES: DEMOGRAPEIC VARIABLES, SELF-REPORTS, AND OBSERVATKONAL ASSESSMENT OF OCCUPATIONAL DEMANDS
by
Victoria R Martin
Submitted in partial fulfillment of the requirements for the degree of Master of Science
Dalhousie University Halifax, Nova Scotia
June 2000
O Copyright by Victoria R Martin, 2000

National Library l*l of Canada Bibliothèque nationale du Canada
Acquisitions and Acquisitions et Bibliographic Services services bibliographiques 395 Wellington SSfeet 395. nie Wellington Ottawa ON K1A ON4 Ottawa ON KI A ON4 Canada Canada
The author has ganted a non- exclusive licence allowing the National Library of Canada to reproduce, loan, distn'bute or sell copies of this thesis in microform, paper or electronic formats.
The author retains ownership of the copyright in this thesis. Neither the thesis nor substantial extracts fkom it may be printed or otherwise reproduced without the author's permission.
L'auteur a accordé une licence non exclusive permettant à la Bibliothèque nationale du Canada de reproduire, prêter, distribuer ou vendre des copies de cette thèse sous la forme de microfiche/fh., de reproduction sur papier ou sur format électronique.
L'auteur conserve la propriété du droit d'auteur qui protège cette thèse. Ni la thèse ni des extraits substantiels de celle-ci ne doivent être imprimés ou autrement reproduits sans son autorisation.

TABLE OF CONTENTS
Chapter 1 INTRODUCTION ........................................................ 1
Purpose ..................................................................... 5
Chapter2 LITERATUREREVIEW ............................................... 6
........................................ Feasibüity Accuracy TradeOff 6 ................................... Quantification of Physicaï Demands 8
................................................... Psychophysical Models 9 ... .................... Applications of Questionnaires .... .. .... 10
............................................... Validity of Questionnaires 11 ............................................ Reliabiüty of Questionnaires 14
Job Site Analysis ........................................................... 16 .............................................. Occupational Risk Factors 18
............................... Worker Traits and Individual Factors 21 Age .......................................................... 21
............................. Durution of Ernployment 2 2 Gender .................................................... 22
............................... PhysicaLDKedicaL Factors 23 ................................ Psychosocial Influences 23
Chapter 3 METHODOLOGY ........ .................. ..................... 2 6
Subjects ...................................................................... 26 Questionnaire .............................................................. 31 Job Site Analysis .......................................................... 33
....................................................... Statistical Analysis 34

Chapter 4 RESULTS ................................................................... 36
............................... Questionnaire Versus Job Site Analysis 36 ............................... Assessrnent of Occupational Exposures 38
Gender ....................................................................... 40 Age ........................................................................... 40 Occupation .................................................................. 40
.............................................. Rate of Perceived Exertion 40
................................................................ Chapter 5 DISCUSSION 42
................................................... Validity of Self Reports 42 ........................................ Frequency of Physical Demands 42
................................. OccupationaI Exposures .......... .... 44 Demographics ....... ................................................... 46
Gender ......................... ...... ...................... 46 ................ Age .................................... 46
Physical Factors ........... ... .......................... 46 Limitations .................................................................. 47
.......................... MethodoIogicaI Issues ............. ... ... ... 48 .............................. Interobserver ReliabiCity 4 8
.................................. Observation Procedure 48 ................................................................... Conclusion 50

APPENDIX A .............................................................................. 51
APPENDIX B .............................................................................. 53
APPENDIX C . ............................................................................. 57
APPENDIX Dl. ............................................................................ 59
A . P E m I X E .............................................................................. 61
...................................................................... APPENDIX F 65
APPENDIX G .............................................................................. 69
WmRENCES ..................................... 73

LIST OF FIGURES
Figure 1 An Illustration of the pertinent differences between seif reports, observational and direct measurements of occupational demands..J
vii

LIST OF TABLES
Table 1
Table 2
Table 3
Table 4
Table 5
Table 6
Table 7
Table 8
Table 9
Table 10
Table 11
Hidden Costs Associated with Work Injury. .. .. . . . . . ... .. ... ... . ... 2
Age and Gender Distribution Among Study Participants.. . .... . .27
Occupational Distribution Among Study Participants.. ..... ..... .28
Distribution of Occupational Categories Among Study Participants ........... ..-...-. ....-. ................................ 28
Duration of Employment ....... ..*........*............................. 29
Disability Claim History Distribution Among Study Participants ..................... o.......,..................................... 30
Frequency Category Definitions.. . . . . . . . . . . . . . .. . . . . .. . .. ... . .... . .... . -32
Interobserver Agreement. .. .. . . . ..... .. . -. . . . . . . -. . . . . . .. . . .... ..... .... .. 33
Distribution of Percent Agreement between Self-Reported and Obsewed Task Frequency, Claim History and Corresponding Chi Square Values ..........,... . ...... ..L.-.............................. 38
Distribution of Percent Observed Frequency, Claim History and Corresponding Chi Square Values Utilized in the Determination of Occupational Risk Factors ........................ ............... . ........ 39
Distribution of Percent of Perceived Exertion Ratings, Claim History and Corresponding Chi Square Values Corresponding Chi Square Values... ................. .................... ............................. 41

Table E l
Table E2
Table E3
Table E4
Table E5
Table E6
Table E7
Table ES
Table E9
Table El0
Table El1
Table El2
Table El3
Table El4
Table El5
Table El6
Table El7
Table El8
Table El9
Table E t 0
Table FI
Stand .......................................................................... 62
............................................................................... Sit 62
Kneel ........................................................................... 62
Vertical Reach ............................................................... 62
Horizontal Reach ........................................................... 62
Hand Movements ......................................................... 63
Upper Extremity Pull ............. ................................... . 63
...................................... Upper Extremity Push ......... ..... -63
............................................................ Whole Body Pull 63
.......................................................... Whole Body Push 63
.............................................................. Unilateral Lif t.. 63
Bilateral Lift ............................................................... 63
Unilateral Carry ............................................................. 64
.............................................................. Bilateral Carry 64
Stair Climb ................................................................... 64
........................................ Ladder Climb ......... 64
Trnnk Flexion .............................................................. 64
Trunk Rotation .............................................................. 64
Stand .......................................................................... 66
ix

Table F2
Table F3
Table F4
Table F5
Table F6
TabIe F7
TabIe FS
Table F9
Table FI0
Table FI1
Table FI2
Table F13
Table F14
Table F15
Table FI6
Table F17
Table F18
Table F19
Table F20
Table G1
Table G2
.......................................................................... Walk 66
Sit ............................................................................ 66
KneeI .................................................................*...... 66
Crouch ........................................................................ 66
Vertical Reach ............................................................... 66
Horizontal Reach ........................................................... 66
Hand Movements ........................................................... 67
Upper Extremity Pull ...................................................... 67
..................................................... Upper Extremity Push 67
............................................................. m o l e Body Pull 67
......................................................... Whole Body Push -67
............................................................... Unilateral Lif t. 67
Bilaferal Lift ........................................................ 67
UnilateraI Carry ...................... .... ..................... ..... ........ -68
.............................................................. Bilateral Carry 68
Stair Climb ................................................................... 68
Ladder CLimb ............................................................... 68
Trunk Flexion ............................................................... 68
Trunk Rotation .............................................................. 68
Stand ............. .... .......... ................. 70
Walk ........................................................................... 70

Table G3
Table G4
Table G5
Table G6
Table G7
Table G8
Table G9
Table G10
Table G11
Table Gl2
Table G13
Table Cl4
Table G15
Table G16
Table G17
Table G18
Table G19
Table G20
Sit ............................................................................... 70
Kneel .................*.....................*..... .... 70
Crouch ....................................................................... 70
....................... Vertical Reach .... ....... , . 70
Horizontal Reach ............... ..... ....................................... 70
Hand Movements ........................................................... 71
...................................................... Upper Extremity Pu11 71
Upper Extremity Push ..................................................... 71
Whole Body Pull .................. ...... ................................. 71
Whole Body Push ........................................................ 7 1
.............................................................. Unilateral Li% -71
................................................................. Bilateral Lift 71
............................................................. Uniiateral Carry 72
................................... .............. Bilateral Carry .. . ..... 72
Stair Climb .................................................................. 72
Ladder Climb ............. ................. ............................. 72
Trunk Flexion ............. ......... ........................................ 72
............................................. ........... Trunk Rotation ...... 72

ABSTRACT
The purpose of this study is to determine if a relationship exists between disability daims records, age, gender, duration of employment, rates of perceived exertion, and the accuracy of self-reports of physical work dernands. The participants comprised 108 part- time and Ml-time employees 48 women (44.4%) and 60 men (55.6%). The occupational groups represented in the participant sample included cashiers and shelf stockers (grocery store, 70%) and madacturing line workers (plastic textiles, 29.6%). The mean age of the subjects was 31 years (range 16 to 57 years) with an average service time in theu respective occupations of 4.5 years (range 0.16 to 23 -75 years), Seventy-two (67%) of the participants had less than 5 years experience in their occupation. To obtain self- reports of physical work demands participants were provided with a "Physical Demands Questionnaire'' wbich consisted of 20 physical tasks. For each task they were required to indicate the percentage of a normal work day they performed the task. The participants also identified the tune, position or weight required at any one tirne. Job site analyses were subsequently performed by the researcher, the results of which were considered the "standard" for cornparison. The vdidity of the self-reports was determined on the basis of the discrepancies between the results of the participant's responses to the questionnaire and the correspondhg results of the job site analyses. It was found that the average percent agreement between the responses to the questionnaire and the exposure data obtained via job site analyses was 49%. Supplementary results that are of particular interest indicate that tnink flexion, working at heights, walking, horizontal reaching as well as upper extremity pulling were fiequently performed by those iadividuals who had a disability claims history. The results of this study support the need for M e r epidemiological research that examines not oniy the possible associations between perceptions of physical work demands and disability, but also the associations between workplace exposures and adverse human health outcomes.
xii

ACKNOWLEDGEMENTS
My sincerest appreciation goes to my supervisor, Dr. John McCabe for the advice, guidance, feedback, and lcnowledge he has provided me over the past four years. You provided me hours of thought provoking discussion and dways accommodated my schedule. Your passion for teaching and the subject area was prominent and you provided me an excellent leaming experience.
I would also like to express gratitude to my cornmittee, Dr. Carol Putnam, Dr. John Kozey, and Dr. Biman Das. Your insights and experiences have guided me towards hîshing my Master of Science Degree. 1 m u t recognize and sincerely thank Heather Butler and Scott Grandy for aI1 of their thoughts, îime and effort spent assisting me with this project-
Finally, 1 would like to thank the Company representatives who assisted me in recniiting participants eom the? employee population for this study. Your support in this process was paramount in initiating this project. Furthemore, thank you for proving me the opportunity to leam about your unique workplaces and aid in the development of new policies and procedures in improving workplace safety.
Thank you dl,
Victoria

Chapter 1 INTRODUCTION
Work injury prevention and management have reached a level of interest and funding that
could not have been easily predicted. In effect, the human dilemma associated with
injury has created an ethicd need for efficient and effective prevention and management.
Thus, there appears to be recognition of humanitarian mords and values that press for
safer and more effective integrahon of the worker and the workplace (Isernhagen, 1995).
However, the costs associated with work related injuries is also a driving force in this
renewed interest in the health and safety of workers (Isenihagen 1995). The costs of
workers' compensation and insurance premiums are directly related to the fiequency and
duration of disability and as a consequence these factors have the potential to
significantly affect profit margins. Table 1 addresses the hidden costs associated with
disabilities that result in Iost time.
With the growing recognition that job titles and/or an individual's perception of their
physical work demands may be poor indicators for occupational exposure, there have
been attempts to utilize alternative methods to obtain this information (Fritschi,
Sierniatycki, & Richardson, 1996). At one extreme are studies in which individu& are
asked whether they perform specific physical tasks in the workplace, and the
correspondhg responses are utilized as the dependent variables for analysis. This is a
relatively simple and inexpensive method by which to obtain this data (Fritschi et al.
1996).

Table 1. Hidden Costs Associated with Work Iniurv Direct Effects on Production
- Reduced output, damage to workplace and mater&, product defects, etc. - leading to inability to meet production deadlines, poor customer service, etc.
Loss of profit
Sickness Absence Costs
- Benefit payments (i.e. long-tem disability insurance, workers' compensation) - Overmanning - Training of replacement workers or retraining of injured workers
Labour Turnover Costs
- Recruitment - Training
Litigation costs
Insurance premiums Note. Adapted 6orn Ergonomies Work and Healtii (p. 19)' by S. Pheasant, 1991, Gaithersberg, Maryland: Aspen Publishers, Inc.
In another approach, experts in biomechanical analysis rnay conduct a three dimensional
video analysis to identiQ and evaluate the physical demands of a job. This method is
obviously going to provide more comprehensive information but is also more costly. In
general, the decision about which method to use in research and rehabilitative planning is
determined by many factors. However, self-reports are particularly attractive because
they are the least expensive method.

Previous work by this researcher has demonstrated that self-reported physical work
demands made by individuals participating in a work re-entry program lacked accuracy
(Martin, 1997). These results suggest that there is the potential for some data to
negatively affect the outcomes of rehabilitation programs where the prünary goal is to
return individuals to work as quickly and sdely as possible. Therefore, if the
rehabilitation tearn does not have an accurate report of the physical work demands of an
individual's job, that individual rnay return to work before they are physically able to do
so, or not return to work.
Returning an individual to work prematurely has the potential to compromise health and
safety and places an employee as well as their CO-workers at nsk of injury or re-injury. If
it is identified that an individual is oot functionally able to return to work in a timely
manner, the cost of continued benefit payrnents escalates which in tuni increases
premiums unnecessarily.
It is not clear what factors influence a worker's perception of the physical work demands
of their work-related tasks. There are many factors that may be influential such as
physical characteristics (eyesight, muscular strength, endurance, etc.), experience with the
tasks and potential outcomes (Le. how the perceived physical work demands will be
utilized).

Despite this obvious need for the development of effective solutions, dlsability
management has been hindered by factors such as limited idonnation regarding
occupational risk factors and worker traits that predispose an individual to injury (Krause,
Ragland, Fisher, & Syme, 1998).
Correct assesment and classification of work related exposures is essentiai in studies of
occupations as it is in other fields of epiderniology (Ahlborg, 1990). However, it is not
currently understood what factors are responsible for cornpensable work-related injuries
(Krause et al., 1998). What is known is that the risk factors that are associated with
occupational injuries include physical work demands such as heavy manud labour,
fiequent lifting, prolonged sitting or standing, and pushing/pulling (Pope, 2 989 as cited in
Knibbe and Fnele, 1996). These demands become especially important when they
exceed the physical capacity of the injured worker (Krause et al., 1998).
In a study conducted by Punnet and KeyserIing in 1987, it was indicated that the
experimental data did not demonstrate conclusively whether specific occupational
exposures or other stressors actually cause cumulative trauma disorders. As a
consequence, they identified a need for epidemiologic research to evaluate the possible
associations between workplace exposures and adverse health outcornes. This remains an
issue not for just cumulative trauma disorders but for al1 work reIated injuries and
disabilities. In a study conducted by Melamed, Yekuttieli, Froom, Kristal-Boneh, and
Ribak (1999), it is maintained that this need to determine the independent predictive

value of adverse objective occupational factors for work related injuries still exists. In
general, the literature demonstrates that we are unable to discriminate well between jobs
that place workers at high or low risk of disability (Marras, Lavender, Leurgans, Rajdu,
Allread, Fathallah, and Ferguson, 1993).
This study examines the potential relationship that occupational demands, worker traits,
and workload perceptions have in predisposing an individual to disability and the
subsequent management of same. It is expected that this information may be utilized in
the development of efficient and effective preventative protocols as well as the early
detection of work related disabilities.
Purpose
The purpose of this study is to determine if a relationship exists between disability claims
records, age, gender, duration of employment, rates of perceived exertion, and the
accuracy of self-reports of physical work demands. The occupational groups represented
in the target sample include grocery store employees, specifically cashiers, and shelf
stockers, as well as individuals employed in a manufactwring facifity. The results of this
study wili contribute to the development of effective and efficient disability prevention
and management protocoIs-
Chapter 2 LITERATURE REVIEW
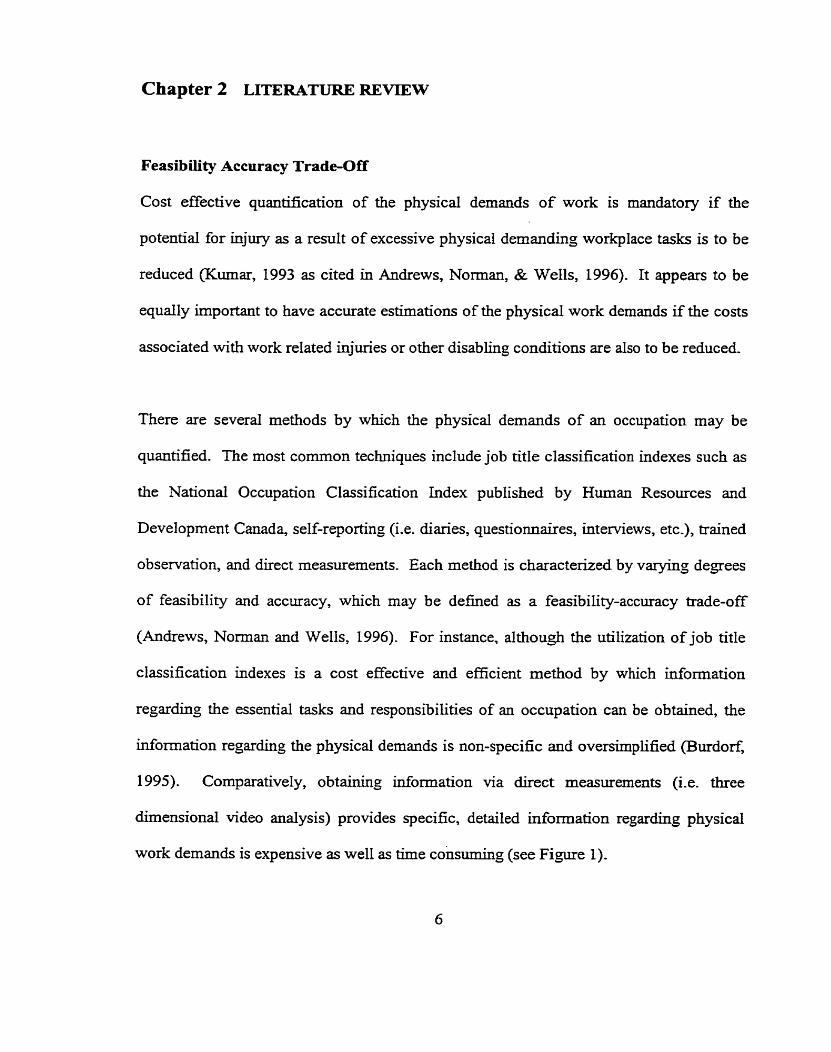
Feasibility Accuracy Trade-Off
Cost effective quantification of the physical demands of work is mandatory if the
potential for injury as a result of excessive physical dernanding workplace tasks is to be
reduced (Kumar, 1993 as cited in Andrews, Norman, & Wells, 1996). It appears to be
equaily important to have accurate estimations of the physical work demands if the costs
associated with work related injuries or other disabling conditions are also to be reduced.
There are several methods by which the physical demands of an occupation may be
quantified. The most common techniques include job titk classification indexes such as
the National Occupation Classification Index published by Human Resources and
Development Canada, self-reporting (Le. diaries, questionnaires, interviews, etc.), trained
observation, and direct measurements. Each method is characterized by varyin3 degrees
of feasibility and accuracy, which may be defined as a feasibiliv-accuracy trade-off
(Andrews, Norman and Wells, 1996). For instance, although the utilization of job title
classification indexes is a cost effective and efficient method by which information
regarding the essential tasks and responsibilities of an occupation can be obtained, the
information regarding the physical demands is non-specific and oversimplified (Burdorf,
1 995). Comparatively, obtaining information via direct measurements (i. e. three
dimensional video analysis) provides specific, detailed information regarding physical
work demands is expensive as well as time consuming (see Figure 1).

Self report Observation Direct methods measurements
Cost
Capacity
Versatility
Generality
Exactness
Figure 1. An illustration of the pertinent differences between seIf reports, observational and direct measurements of occupational demands.
Note. From "Assessrnent of physical work in epidemiologic studies," by J. WinkeI and

Despite the obvious drawbacks of diaries and questionnaires, they are of assistance in
identi*g important detennuiants of physical load, which subsequently can be
quantified by more objective strategies (Burdorf and van der Beek, 1999). These tools
also help in the identification of general trends over time which c m be monitored by
repeated analysis (Burdorf and van der Beek, 1999).
This trade-off between precision in a single analysis and ease and speed of application of
questionnaires demonstrates that it would be more feasible to undertake studies of large
numbers of workers and jobs utilizing the Iatter (Purinett, L. and Keyserling, 1987). As
also indicated by Burdorf and van der Beek (1999), the application of questionnaires is
feasible in every study design and is often the only opportunity to describe the
distribution of physical load in the population under study. However, m e r
development of the validity and reliability of these techniques and their utilization is
required to enhance the ability of epidemiologists to investigate more precisely the
relationships between occupational stressors and a variety of health outcomes (Punnett, L.
and Keyserling, 1 98 7).
Quantification of Physical Demands
The quantification of the physical demands of an occupation encornpasses biomechanical,
physiological and psychological principles. Biomechanical rnodels are comrnonly used
to estimate the forces and moments acting on a point of interest whiIe an individual is
performing a physical work task (Burdorf, 1995). In regard to physiological models, a .

individual's ability to perform physical work is assessed in relation to central factors
associated with the puhonary, circulatory and metabolic systems as well as local factors
concerning muscular strength, joint structure and the spinal coIumn (Gambede,
Ljungberg, Annwall, & Kilbom, 1987). The psychophysical approach examines the
reIationships between the measured intensity of a task and the worker's perceived
exertion, as well as the effects of these relationships on work performance (Gamberale et
al., 1987).
Psychophysical Models
There are three primary applications of psychophysical methodologies in obtaining
information regarding physical work demands: (a) magnitude estimations which require
the subject to estimate the intensity of a stimulus (i.e. weight of the object) in relation to a
standardized reference weight (Gambede, 1990) (b) ratings of perceived exertion which
are seif reported reactions to physical work that are correIated with actual mesures of
work intensity (Borg, 1990), and (c) the selection of a maximum acceptable weight that
requires the subject to choose a maximal physical workload while avoiding over exertion
(Gamberale, 1990).
As these descriptions demonstrate, psychophysical methodologies are reliant on an
individual's ability to self assess and report occupational exposures. Of primary concem,
is the subjectivity of questionnaires and the validity and reliability of the data collected.
It is assumed that subjects can accurately estimate their perceived exertion while

performing physical work, as well as many other factors such as comprehension, literacy,
etc. (Ljungberg, Gamberale, & Kilbom, 1 982) -
Application of Questionnaires
It has been reported that questionnaire research is the most fiequently used data collection
methodology in occupational epidemiological research. In a review conducted by Winkel
& Mathiassen, 1994, it was reported that of 72 studies assessing physical exposure in the
workplace approximately 80% utilized self-administered questionnaires to obtain data,
This finding is also supported by Burdorf (1992), who found in a review of
epidemiological studies on back disorders that assessed postural loads, the questionnaire
approach was the most common. 'This concurs with his previous finding that the self-
adrninistered questionnaire technique was used most frequently to collect information on
exposure to risk factors in the workplace (Burdorf, 1992). It is apparent that this
continues to be the trend as Pope, Silman, Cherry, Pritchard, and Macfarlane (1998) later
noted that self-administered questionnaires are the most widety utilized method of
measuring physical work demands.
Considering the fiequency with which this methodology is implemented, the previously
mentioned stssumptions regarding individual's ability to self-assess and report
occupational exposures should be of concern in evaluating the validity and reliability of
the information gathered through self-assessment.

Validity of Questionnaires
In the field of occupational health, safety, and disability management, questionnaires play
a vital role in classirng jobs, as well as selecting the workers to fil1 these positions.
However, many researchers have found that questionnaires have not generally compared
well against objective estimates of physical exposure in field settings (Wiktorin,
Karlqvist, and Winkel, 2993). For example, Andrews et al. (1996) found there was
significant dîscrepancy in the related occupational exposure (occupational exposure
represents the physical demands of the employee's job) when comparing subjective
estimates of physical demands of the worker with direct measures of the tasks (video
analy sis). Viikari-Juntura, Rausa, Martikainen, Kuosma, Riihimaki, Takala, and
Saarenmaa (1996) support this hd ing by concluding that the accuracy of self-
administered questionnaires is not appropriate for studying quantitative exposure-effect
relationships and cannot validly replace more direct measurements in the assessrnent of
the duration of occupational exposures. This low accuracy as well as the lack of
published literature concemulg the validity of quantitative data collected using self-
administrated questionnaires has also been noted by Pope et al. (1998) as well as van der
Beek and Frings-Dresen (1998).
Therefore, the validity of the data collected using self-adrninistered questionnaires must
be scrutinized when interpreting the results of studies that utilize these methodologies, as
misinterpretation of these results may have sipïficant implications in the development of

programs in rehabilitation, and ergonomies, as well as general implications for health and
safeîy.
On the contrary, a study conducted by Ahlborg (1990) found that seif-administered
questionnaires rnight provide exposure information of acceptable validity when compared
with data from clinical interviews or to objective information fiom an externd observer.
ïhis perspective was also supported in the results of a literature review conducted by
Burdorf (1992) in which he supported this notion that the application of observational
methods increases the quality of exposure assessment. In light of this fïnding, it was
m e r recommended that whenever objective rneasurement of exposure is not possible in
an epidemiological study, the validity of the questionnaire developed should be studied
prior to implementation.
Based on these findings, it is possible, even though a slight discrepancy exists between
questionnaire data and data acquired through direct measures, that questionnaires are the
most appropriate tool for certain settings. For example, questionnaires can be used to
obtain sensitive information that might not be obtained through interviews or other
methods of analysis. However, the question of validity still exists and it is necessary to
consider the tradeoff between accuracy and specific information when using
questionnaires. Therefore, in al1 likelihood it would be most beneficial to utilize
questionnaires in combination with some other measures.

To quantifi mechanical exposure (physical work demands) via self-reported
questionnaires it may require the direct analysis of three main dimensions: level
(amplitude), repetitiveness (eequency), and duration (Winkel and Mathiassen, 1994).
In regard to the validity of an individual's ability to assess amplitude, Wiktorin, et al.
(1993) indicated that the responses were more valid for large amplitudes than for srnaIl
amplitudes. More specifically, it was indicated that the agreement was higher for
questions conceming postures, or manual matenal handling tasks of a large amplitude of
load versus smaller amplitudes.
The results of this study also suggested that the proportion of tirne may be more difficult
for subjects to estirnate than a more direct measure of minutes or hows- It was concluded
that the ability to discriminate between being exposed and unexposed to certain postures
or manual materials handling occuning during an ordinary workday or part of a day
seemed to be acceptable. The ability to quanti@ these exposures in more detail seems to
be reduced if more detaiIed information is required. Pope et al. (1998) also indicated that
that the validity of self-reported physical demands is satisfactory at a dichotomous level
(ever, never), and that quantimg the amplitude of the load is more problematic. Further
to this, the results of a study conducted by Lindstrom, Ohlund, and Nachemson (1 994)
indicated that there was a low agreement between reported and observed work postures
for those postures with a less frequent occurrence.

Reliability of Questionnaires
As indicated, validity is not the only conceni when utilinng questionnaires to obtain
information regarding occupational exposures. It is also very important to examine the
reliability or reproducibility of the results. W i k t o ~ , Hjelm, Winkel, Koster, and the
Stockholm MUSIC 1 Study Group (1996) examined the reproducibility of responses to
questionnaires regarding mechanical expusure. Their results indicated that there was
higher reproducibility in response to questions regarding occupational physical activity
and exertion, vibrations, and working postures involving the whole body postures, than in
questions concerning working postures involving only parts of the body, and in manual
materials handling tasks and especially those invofving low forces. It was also found that
subjects participating in the study could consistently quanti@ t h e spent in sitting
positions or at visual display unit work, whereas they could not estimate tune spent with
t d flexion or fiequency scales, such as scales graded in proportions of a day or times
per hour. It is also important to note that the reproducibility decreased as perceived
exertion or fkequency increased, which indicates that it is more difficult to consistently
estimate long durations than short ones, especiaIIy in regard to awkward postures.
Nevertheless, the primary weakness of this survey seems to be that the response scales
may have required excessive detail in relation to the subjects' rating capacity. In regard
to the phrasing of the questions concerning manual materials handling, they may also
have required excessive detail in regard to weight and time intervals. For example, a
worker may be able to successfiilly rate duration of exposure on a categorical scale (low,

medium, high), whereas it would more probIematic to rate exposure using a continuous
numerical scale (one to hventy). In the case of the numerical scale, the worker often lacks
the sensitivity to -reliably differentiate between two successive points in reference to the
question. Furthexmore, the reproducibility of the responses may have been improved if
the weight intervals were pooled into broader categories. However, there is a trade-off in
regard to th is because broader categories b i t the sensitivity of the information obtained
and would thus compromise the ability to make specific recommendations in regard to
determining rehabilitative go&.
Wiktorin et al. (1996) found education level to be a contributing factor to decreased
reproducibility of the results. Specifically, subjects with a grade schoo 1 education
answered questions less consistently than those with higher education levels. From this
result it may be inferred that reading and comprehension skills may not be as well
developed in those individuals with lower levels of education- This study also indicated
that the influence of educational level on the reliability may be related to the type of
information required in the question. Therefore, answering questionnaires may be quite
difficult for some individuals and it may be more appropnate to use an alternate strategy
for acquirùig the information, such as an interview procedure.

Job Site Andysis
As previously indicated, job title aione will poorly define the occupational exposures of a
specific job (Pope et al., 1998). This supports the need for job analyses that measure the
cognitive and physical demands of a job in order to provide detailed descriptions of
exp osure-
A job analysis is an objective and systematic procedure used to identi@ the demands of a
particdar job (Key, 2994). The ixiformation obtained from a job analysis may be utilized
to make definitive statements about that job; its risks, its requirements, and its
productivity, in order to facilitate administrative planning (Isernhagen, 1995)-
The job analysis process involves a review of the job description or workings of the
facility, collection of the necessary equipment and documents, observation of the job,
data collection, interviews, and a written report (Reynolds, 2997). The information
provided in a written report will depend on the purpose of the job analysis. For exarnple,
if it were conducted for the purpose of developing of a functionaI job description, the
demands of a job would be identified and explained.
Obsewational techniques are extensively being used in ergonomie studies to id&@
particularly strenuous tasks and awkward postures and to evaluate workplace
improvements. In a literature review conducted by Burdorf (l992), he noted that it was

apparent that such observational techniques have rare1 y been emp Io yed in occupation
epidemiology, as well as with regard to direct measurement methodologies.
The vdidity of a measurement technique can be derived eom a cornparison with an
instrument that mesures accurately and precisely, like a "goId standard" that measwes
the true exposure value, with a random error sficiently small considering its purpose
(Burd06 1995). In light of this, it should be noted that job site analyses by a -ed
observer is not considered to be a "gold standard'', as this methodology is subject to
observer error, as well as error associated with the measurement tools (i-e. scales,
dynamometers, etc.).
In two of the studies reviewed by Burdorf (1992), it was reported that the agreement
between self adrninistered questionnaires by employees and direct obsenration by
investigators was poor for bending and twisting the trunk. Further to this, Burdorf
reviewed that Ragberg and his CO-authors (1988) fomd that information obtained via
questionnaire and observationai data on lifting activities were consistent for ody 10% of
the workers studied in regard to both the weight and fiequency of material handled. It is
concluded that expert judgements and self-reports give only limited insight into the
occurrence of tasks and activities (van der Beek and Frings-Dresen, 1998).

Occupational Risk Factors
Physical factors causing work-related musculoskeletal diseases are presumed to exert
their effects through physical forces which may in tum initiate or contribute to
pathophysiological changes (Wuikel and Mathiassen, 1 994). Considering that the
lifetime prevalence of low back pain in western countries exceeds 70%, musculoskeletal
epidemiological research may be considered to be of the utmost importance in addressing
the social costs related to musculoskeletal disease (van der Beek and Frings-Dresen,
1998)-
There are fiequent observations of the need for more and better interdisciplinary work on
the etiology of musculoskeletal diseases (Hoiimann, Klimmer, Schmidt, and Kylian,
1999) the primary reason being the development of preventative measures (Hughes,
Silverstein, and Evanoff, 1997). This notion is alsc supported by Viikari-Juntura et al.
(1 996) who indicated that effective preventative measures are dependent on detailed
information regarding quantitative exposure-e ffect relationships.
Quantitative assessment of physical load in the workplace is also an essential component
of musculoskeletal epidemiology (Burdorf and van der Beek, 1 999). However,
occupational exposure assessment remains a huge challenge as researchers are faced with
a large array of variables that need to be quantified (i-e. physical, social, psychological,
individual) (Burdorf and van der Beek, 1999). It is also worth noting that this area of

study is additionally confounded since there is no universally accepted standardized
exposure measmernent rating for rnuscuIoskeletal disorders (Nordstrorn, Vierkant, Layde,
and Smith, 1998). In addition, the literature on diseases of the musculoskeletal systern
primady relies on muscuioskefetal symptoms and subjective cornplaints (Hollman et al.
1999).
Despite the obvious difficulties obtaining valid and reliable data regarding occupational
exposures, encouraging progress is currently being made in understanding the demands of
physical load which are associated with the risk of developing specific musculoskeletal
disorders (Burdorf and van der Beek, 1999).
For example, Johansson and Rubenowitz (1994) reported that risk indicators for neck and
shoulder symptorns are related to long exposure with the arms raised above shoulder level
and the neck bent, a high working Pace and an ergonomically unsuitable workplace.
Fransson-Hall, Bystrom, and Kilbom (1995) found that auto assembly line workers
reported more symptoms &om the forearm to the hand and higher exposure to repetitive
movements, precision movements, and manual material handling (I 25Kg) than a control
group. Hughes et al. (1997) reported findings supporting this, as they found that years of
foreaxm twisting was found to be a significant positive predictor for hand wrist, elbow
forearm, and shoulder disorders.

Johansson and Rubenowitz (1994) also reported that heavy physical work, heavy or
fiequent manuai operations, repeated rotation of the tnrnk and prolonged sitting are likely
to be risk indicators for low back pain. Further to this, there is also evidence of a strong
association with manual material handling, fiequent bending and twisting, physically
heavy work, and whole body vibration (Burdorf and Sorock, 1997)- It has also been
found that ergonomie factors such as extended periods of sitting and f?equent bending
and twisting while lifting heavy objects have been shown to be associated with andor to
predict back-related disability (Marras et al., 1993).
Recently, it fias becorne increasingly obvious that the occupational factors that contribute
to the development of musculoskeletal disorders are both physical and psychological in
nature (Holhan et al., 1999). This view is shared by van der Beek and Frings-Dresen
(1998) who reported that most musculoskeltai disorders are characterized as
multifactorial as physical, psychologica1, and individual factors al1 contribute to the
development and aggravation of these disorders. Winkel and Mathiassen (1994) reported
that there has been a shift fiom an epidemioIogica1 emphasis on physical factors in the
1980s to a concurrent consideration of the psychosocial domain.
Despite this knowledge, it remains difficult to quanti@ the exact levels of physical load at
which an increase in rnusculoskeletal risk occurs (Burdorf and van der Beek, 1999).
Therefore, it has been suggested that epidemiological research hypotheses should not
only be fomulated to examine whether relations exist between mechanical exposures and

adverse health effects, but also to detennine the relative importance of social,
organizationd, and individual risk factors (van der Beek and Frings-Dresen, 1998).
Worker Traits and Individual Factors
A recent study, of the United States Arrny identified that musculoskeletal disorders are
the p h a r y source of disabiiity among soldiers (Feuerstein and Bercowitz, 1997).
Having the ability to predict the fiequency and duration of these occurrences would
enable this employer, and thousands of others, the ability to develop effective means of
prevention. The factors associated with the prediction of prolonged functional recovery,
retum to work d e r an injury, or long term work disability can be categorized as
demographic (e-g. age, gender, and duration of employment), physicalhedical,
ergonornic, and psychosocial (Feuerstein, Berkowitz, and Huang, 1999).
Age. In a study conducted by Feuerstein et al. (1999) it was found that age is a
significant predictor for low back pain. The researchers noted that this effect was modest,
but that it was consistent with past studies that indicated that older age is a risk factor for
disability in general (Cheadle, Franklin, Wolfhagen, Savarino, Liu, Sdley, and Weaver,
1994).
Contrary to this, Fransson, Hall, Bystrom, and Kilbom (1995) found that there was no age
effect among the population studied, indicating that older workers with pain or otber

symptoms leave the assembly h e and the remaining older workers tend to be
excep tionally robust They subsequently identi fied this trend as the 'liealthy worker7'
effect.
Duration of Employment. In regard to duration of employment, it has been found that
firms with a large number of employees having fewer that 2 years experience on the job
had higher rates of disability (Habeck, Lahey, Hunt, Chan, and Welch, 1991 as cited in
Feuerstein et al., 1999). These findings are supported by Feuerstein et al., 1999 who
generally found that those employees who had less time on the on the job were more
likely to file a claim. The reasoning for these findings may include factors or issues
related to training, skill acquisition, age, self confidence, cornpetence, supe~s ion , etc.
and M e r investigation may provide valuable ïnsight, specifically for the purposes of
the developrnent of preventative measures.
Gender. ReIatively few of the papers examuled for the purposes of this review
specifically addressed the effect of gender on disability. However, in a study conducted
by Fransson Hall, Bystrom, and Kilbom (1995) it was found that female assernbly line
workers reported more symptoms and higher exposure to known nsk factors for work-
related forearm-hand disorders than their male colleagues. This conclusion was
supported by the suggestion that the gender effect may be related to social and self
reporting differences, biomechanics, and physiological considerations. In support of the
findings of Fransson et al., 1995 it was also found by OIeinick, Gluck, and Guire (1996)

found that gender dong with age, number of dependents, and occupation predicted
continued work disability. Contradictory results were noted by Winkel and Mathiassen
(1994) who reported that individual factors, specifically age and gender, have received
the most scientific attention but that the predictive value is low (Battie 1989 and
Armstrong et ai., 1993 as cited in Winkel and Mathiassen 1994).
Physical/lMedical Factors. The findings relating to the p hysical/medical realm of
prediction may be described as contraclictory at best. However, it appears that the
majority of research has found that musculoskeletal complaints do not appear to infiuence
the accuracy of self reports (Burdorf and Laan, 1991, Wiktorh et al., 1996, Nordstrom et
al., 1998, and Wiktorin, Vingard, Mortimer, Pemold, Wigaeus-Hjelm, Rilbom,
Alfredsson, and MUSIC Norrtalje Study Group, 1999).
Contrary to this, Wiktorin et ai. (1993) found that people with low back complaints may
have overestimated lifting compared to those without back pain. Further to this, Viikari-
Juntura et al. (1998) reported that the accuracy of the estunations was better for those
with no low-back pain than for those with severe pain.
Psychosociaf Injlirences. Scientific documentation of the role of psychological and
social work factors in disability is not prolific, despite hdings that there is a significant
association between low overall job satisfaction in several studies (Dehlin arid Berg,
1977). Further investigations of psychosocial factors have found that additional variables

that contribute to work disability include workplace psychosocial stress, employer
practices, coping abiIitieç, (Lancourt and Kettlehut, 1992) lack of recognition (Wickstrom
and Pentti, 1998) and negative beliefs of and/or attitudes toward the consequences of
having "low back trouble" (Symonds, Burton, TiZlotson, and Main, 1996 as cited in
Feurstein et al-, 1999). En addition to this, Hughes et al., 1997 found that low decision
latitude was a nsk factor for the development of upper extremity disorders and Feurstein
et al., 1999, found that lower military rank, higher work stress, worries, and lower social
support were significant predictors of low back pain. Hughes, Silverstein, and Evanoff
(1997) presented conflicting results as they found that high job satisfaction was
associated with reports of low back pain.
Overview
As demonstrated in this literature review, M e r epidemiological research is required to
m e r evaluate the factors influencing work and disability. The validity of
questionnaires in epidemiological research has not been consistently evaluated despite the
fiequent use of this tool. It is therefore difficult to make definitive conclusions regarding
the data obtained utilizing this method of data collection.
This literature review M e r demonstrated that in addition to the inherent limitations of
questionnaires it has been found that there are dernographic, physical, ergonornic, and
psychosocial factors that should to be addressed when performing epidemiological
research in this realm of study.

Based on this information, this study has been developed to determine if a relationship
exists between disability history; age, gender, duration of employment, rates of perceived
exertion, and the self-reports of physical work demands. The results of this study may be
usefül in developing concepts that will aid in the prevention, early identification, and
management of disability.

Chapter 3 METHODOLOGY
Subjects
This study was designed to examine the physical demands of jobs that workers perform
in a variety of occupational settings as weI1 as the demographics and perceptions of the
workers. Employees fiom two workplaces in Nova Scotia were targeted for participation
in this project. It was estimated that there were 450 potential participants empfoyed at
these facilities. The researcher was unable to ensure al1 of the potential subjects
completed the questionnaire for reasons related to geography and shift schedules and
therefore the return rate was only 26%. Of this percentage there were seven incomplete
questionnaires that were not considered in the data analysis.
The subjects cornprised 108 part-tirne and full-the employees who volunteered and
provided infomed consent to participate (refer to Appendix A). Complete anonymity
was ensured d u h g this study and al1 subjects were fiee to withdraw at any time.
In regard to gender, 48 of the participants were women (44%) and 60 were men (56%).
The mean age of the subjects was 41 years (range 16 to 57 years). Thirty (50%) of the
male participants and 16 (33%) of the fernale participants were between the ages of 20
and 29 years which is equivalent to 46 (43%) of the total population.

Table 2. Age and Gender Distribution Among Study Participants Men Women Total
The occupational groups represented in the participant sample included 53 cashiers
(grocery store, 49%) and 23 sheif stockers (grocery store, 21%) as well as 32
manufactunng Line workers (plastic textiles, 30%) who were employed in 16 different
positions. Table 3 provides the occupations represented in the participant sample.

Table 3. Occupational Distribution Among Study Participants Employer Department Job Title Participants
(n=i 08) n %
Grocery Retaîler Grocery S helf stocker 23 21 Front end Cashier 53 49
Plastics Manufacturer WeaMng Lead operator 1 0-9 Utility operator A I 0.9 Fixer 1 0.9 Do ffer 1 0-9 Weaver 2 1.9
Shrink Film Finishing Slitter folder 3 2.8 operator
Shrink Film Extrusion Shrink film line 3 2.8 operator
Beaming Creeler 2 1.9 Manual material 1 0.9 handler Beamer operator 3 2.8 Operator 2 1.9 Core Stripper 3 2.8 Assistant operator 3 2.8 Manual material 3 2.8 handler
Coating Assistant operator 1 0.9 Convertins Lead operator 1 0.9 Repro Repro operator 1 0.9
Tape
As demonstrated in Table 4, foriy-three of the cashiers were women (81%) and al1 of the
shelf stockers were men. Men also dominated the group of participants who represented
plastics manufacturing as there were 27 male participants (84%) represented in this
Table 4. Distribution of Occupational Categories Among Study Participants Cashier Shelf Stocker Manufacturing Total
Gender n % N % n %- n '%O
Male 10 19 23 1 O0 27 84 60 56 Female 43 81 O O 5 16 48 44

The average duration of employment for the entire population was four and a half years
(range 0.1 6 to 23.75 years) which may be indicative of an inexperienced workforce
which is perhaps due to a relatively high staff turnover. As indicated in Table 5, 4 1 men
(68%) and 31 women (65%) had less than five years experience in their respective
occupations. Overall, 72 participants (67%) had less than five years experience.
Table 5. Duration of Employment Men Women Total
(n=60) (1148) (n=108) Years n YO n '?40 n %
( 5 41 68 3 1 65 72 67 5-9 11 18 8 17 19 17
10-14 6 10 6 12 12 11 15-19 1 2 2 4 3 3 20-24 1 2 1 2 2 2
In regard to disability histories, it was found that 2 1 men (41%) and two women (40%)
emp Io yed in plastics manu facturing had previousl y experienced a disability which
resulted in lost time from work. It was also found that six (26%) of those participants
employed as shelf stockers had previously experienced a disability resulting in lost time
fiom work. Table 6 provides a detailed perspective of the disability daims histones of
the participant population.


Questionnaire
The participants were surveyed by means of a self-administered questionnaire. The
questionnaire utilized in this study was developed by the researcher and was evaluated for
comprehensiveness and clarity (Appendix B). As a result of these investigations, it was
identified that figure-based images of each individual task would improve the clarïty of
the questions and were included in the questionnaire.
The questionnaire ascertained the following uIformation: gender, age, height, weight, job
title, duration of employment, work shift duration, total weekly hours, fiequency of
breaks, and disability claims history. It also consisted of questions regarding 20 physical
tasks and the participants where asked to estimate thefi-equency, werght, and duration or
postzu-e as well as their rate ofperceived exertion (RPE) for each. A copy of Borg's Rate
of Perceived Exertion Scale (1 982) was provided with every questionnaire (Appendix C).
The reference period for the questionnaire was the duration of one recent work shift
which ranged in duration between four to twelve hours depending on the occupational
group.
The participants were provided four frequency caregories to utilize in defining the
ffequency of exposure to a task during a work shift- Percentage categories are widely
utilized and based on an accumulative percentage of a work shift as defined in Table 6 .

Table 7. Freauencv Cateeow Definitions * 4 Y d
Frequency Category Percentage of Work Shift
Never Occasional Frequent Constant
The first stage of questionnaire distribution was providing an introductory ietter
(Appendix D) to the target population, which explained the purpose of the project and the
level of participation required. A response to this letter was requested to preliminarily
determine the level of cooperation.
The researcher subsequently distributed informed consent forms and questionnaires to
those individuals who had expressed interest. During the distribution phase of the
project, the researcher informed the participants that they were to complete the
questionnaire independently of their CO-workers. A self-addressed envelope was
provided and the participants were instnicted to complete the questionnaire, seal it in the
envelope, and place it in a designated mailbox within 24 hours of receiving it. Although
the researcher availed herself to address questions regarding the questionnaire, no
assistance was requested or provided to the participants in completing the foms.

Job Site Analysis
Job site analyses were performed of each unique position represented by the participant
population, which consisted of 18 different positions. The researcher carried out al1 of
the job site analyses and a second observer performed a second analyses of three
randomIy selected positions for the purpose of detennining interobserver reliabiliiy. The
researcher and the second observer were both educated as kinesiologists and are graduate
students in the School of Health and Human Performance at Dalhousie University. The
researcher has participated in job site analyses workshops and perfoms these analyses
professionally. The second observer had relatively little field expenence. The average
percentage of interobserver agreement regarding the fiequency of a task was 35% (range
20 to 60 percent) and 97% (range 90 to 100 percent) within one category. Table 8
provides a sumrnary of this infornation.
Table 8. Interobserver Agreement Position 1 Position 2 Position 3
Y0 Y0 % Agreement 20 25 60 k 1 fiequency category 90 100 1 O0 + 2 fie~uencv cateeones 100 - -
The job site analyses consisted of approximately one hour of observation during which
the observer(s) completed a questionnaire identical to that provided to the participants.
Measurements were obtained utilizing an industrial scale, a Jamar hand grip

dynamometer (i.e. force gauge), measuring tape, and a stopwatch. The Jarnac hand
dynamometer was utilized in the determination of the force required to initiate movement
of an object for push/pull tasks such as pulling a manual pallet jack. The analyses were
performed within 12 weeks of the participant completion of the questionnaire.
Statistical Analysis
The accuracy of self-reported occupational physical demands was assessed using a
comparative analysis. Estimated fiequency was compared to observed fiequency, the
percentage of full agreement being calculated as the proportion of a workers' estimates of
fiequency in the same category as the observed fiequency. Subsequent to this, Chi
Square analyses were completed with Minitab, version 9.2.
The relationships between disability claims history and gender, age, occupation, physical
job dernands, perceptions of physical job demands, and rate of perceived of exertion were
evaluated wîth contingency table methods. Once patterns were detected they were
analyzed for statisticai significance by Chi Square analysis. Significance level
corresponded top c 0-05.
An alternative method of analysis could involve logistical regression techniques to
predict membership in the 2 claims history groups (previous claims and no previous
claims histories). This method was not adopted priniarily because of the large number of

potential predictor variables and the correspondhg obstacles with interpreting the results.
Regression malysis cannot utilize the relationslip behveen two sets of scores (self-report
and observation) to predict membership in one of t h e two groups (claims and no claim
history). However, regression techniques c m be used if the audyses are carried out
separately on the self-report and the observational data. In summary, the Chi Square
analysis was selected as a test for group differences; because of its relative sirentath for
fiequency level data and ease in interpreting the resulns of this initial study.

Chapter 4 RESULTS
Questionnaire versus job site analysis
The data utilized in this analysis was the reported fiequency of each of the 20 tasks Eom
the individuals who participated in the study. This information was compared to the
eequency data produced via job site analysis. AU of the physical demands detailed in the
questiomaire were observed to take place in at least one of the occupations represented in
the study population.
The individual's ability to discriminate between levels of fkequency according to a four
point categorized scale was moderate (Table 9). The average percentage of full
agreement between self-reported and observed fiequency was 49% for the 20 physical
tasks on the questionnaire. That is, of al1 the physical tasks assessed, an average of 49%
of the total number were designated the same Eequency category by the participants and
observer. The range of agreement was 29% to 64%. It should be reiterated that the self-
reported values were obtained via questionnaire and the observed values were a product
of job site analyses.
The data presented in Table 9 is the result of an analysis regarding the fiequency of
agreement between the reported and observed performance for each physical task. It

should be noted that this analysis also considered the individuals' claims history or
absence of same. It was found that agreement did not differ between those individuals
who had a claims history and those who did not (Appendix D). The Chi Square values
for the frequency of each of the physical tasks presented in the questionnaire ranged
between (XZ,=O.OO, p0.05) and (X2,=2.58, p>O.O5).
This data demonstrates that the agreement between the self-reported exposures and the
observers' fmdings was not particularly hi&. Further to this, it is also demonstrated that
this level of agreement between the participants' self-reports and the observers' findings
did not significantly dif5er between the two groups, those individuals who had a claims
history and those who did not.

Table 9. Distribution of Percent Agreement between Self-Reported and Observeci Task Frequency. Claim History and Corresponding Chi Square Values
Task # Task Agreement X2 Significant (rcponcd & observed) atp = 0.05
(n=108) % Total Sample
No Claim Claim History History
1 Stand 20 9 2.53 No 2 Walk 42 9 1 .O6 No 3 Sit 29 10 O -63 No 4 Kneel 37 9 0.27 No 5 Crouch 52 11 2.22 No 6 Vertical reach 34 12 0.96 No 7 Horizontal reach 35 11 0.27 No 8 Hand movements 50 12 0.8 1 No 9 Upper extremity pull 27 6 O .24 No 10 Upper extrernity push 3 7 7 1.54 No 11 Whole body push 42 11 0.27 No 12 Whole body pull 41 11 0.04 No 13 Unilateral lift 26 7 0.00 No 14 Bilateral lift 33 9 0.0 1 No 15 Unilateral carry 42 11 O- 1 O No 16 Bilateral carry 35 10 0.00 No 17 Stair climb 46 13 0.22 No 18 Ladder cIimb 53 11 2.58 No 19 Trunk flexion 37 9 0.27 No 20 Trunk rotation 30 7 0.82 No
Assessrnent of Occupational Exposures
Based on the observations obtained via job site analyses and the corresponding Chi
Square analyses it was found that there were five physical tasks that were signincantly
associated with reported claims history. These tasks included walking, horizontal
reaching, upper extremity pulling, ladder climbing, and tnink flexion. In regard to hunk
flexion it was found that al1 of the individuals who had reported a claims

history were required to perform this taçk frequently or constantly (x2,=1 08-00, p<0-00 1).
The data utiiized in Chi Square analyses are presented in Appe~dix E.
Table 10. Distribution of Percent Observed Frequency, Clairn History and Correspondhg Chi Square Values Utiiized in the Determination of Occupational Risk Factors Task Task Observed Frequency Xz Significanf
# at p = 0.05 % T ~ I Sampie
No CIaim History Claim History
Never / Frequent 1 Never / Frequent / Occas. Constant Occas- Constant
1 Stand 22 56 8 14 0.1 1 No Walk Sit Kneel Crouch Vertical reach Horizontal reach Hand movements Upper extremity pull Upper extremity pus Whole body push Whole body pull Unilateral lift Bilateral lift Unilateral carry Bi lat eral cary Stair climb Ladder climb Trunk flexion
20 Trunk rotation 3 75 4 18
Yes
No No No No Yes No Yes No No No No No No No Na Yes Yes No

Gender
The prevalence rate of reported disability claims history was 22% for the study
population (17% men, 6% women). These prevalence rates were statistically
sipificantly different between men and women indicating that men had a higher reported
rate of disability (X2,=4.73, pc0.05).
Age
The prevalence rates of reported disability among two age categories was also considered.
Twelve percent of those individuals aged up to and including 35 years reported a
disability history. Ten percent of those individuals aged 36 years and older reported a
disability history. The reported disability rate among these two groups was not found to
be statistically significantly different (X2,=0.626, p>0.05).
Occupation
An andysis of the relationship between occupation and disability prevalence revealed
that disability rates were the highest among manufacturing occupations (X2,=11.49,
pco.00 1).
Rate of Perceived Exertion
It was generally found that for perceived exertion of hand movements (x2,=3.89, ~ 0 . 0 5 ) ~
whole body push (X2,=40.05, p<O.001), and whole body pull (*,=34.49, p<0.00 1) there
is a tendency for those subjects with a previous daim history to report higher rates of

exertion than those who do not have a history of disability. This result has to be
Ïnterpreted with some caution based on the relatively low fiequencies in some cells.
These results are demonstrated in Table 11. The data utilized in Chi Square analyses is
presented in Appendix F.
Table 11. Distribution of Percent of Perceived Exertion Ratings, Claim History and Correspondhg Chi Square Values Tas k Tas k Observed Frequency X2 Significant
# atp < 0.05 % Total Sample
No Claim History Claim History
RPEO-5 RPE6-IO+ RPEO-5 RPE6-10+
1 Stand 64 14 20 2 1.23 No 2 Waik 70 8 21 1 0.70 No
S it 77 Kneei 72 Crouch 70 Vertical reach 63 Horizontal reach 62 Hand movements 58 Upperextremitypull 61 Upper extremity push 6 3 Whole body push 53 Whole body pull 57 Unilateral lift 66 Bilateral lift 58 Unilateral cary 70 Bilateral carry 65 S tair climb 74 Ladder clirnb 76 Tnuik flexion 60
No No No No No Yes No No Yes Yes No No No No No No No
20 Trunk rotation 57 20 16 7 0.08 No

Chapter 5 DISCUSSION
Strength of Agreement Between Observed and Self-Reports
For al1 of the self-reported physical demands the degree of agreement regarding the
firequency of task performance was moderate ( ~ 4 9 % ) . This is an encouraging result,
however possibly intluenced by the utilization of relatively broad fiequency categones.
As previously mentioned, it has been fomd that at a dichotomous level of (i-e. whether an
activity was cmied out or not) the accuracy of recall was good (Pope et al., 1998).
The use of the term "validity" which is commonly utiIized to describe this level of
agreement should be challenged. It is valuable to point out that there is no tme "gold
standard" to measure occupational exposures therefore it would be inappropriate to
consider level of agreement utilizing two methods, which have not been scientifically
validated, as an accurate measure of Validity". Further to this, it would be impossible to
consider a strategy as being c'inaccurate" based on this comparison since there is no 'kold
standard" for comparison.
Frequency of Physical Demands
One limitation of the job site analysis approach utilized in this study is the possibility that
the kequency of the performance of tasks would be under or over estimated by the

observer. This potentid for inaccuracy rnay be due to error associated with the task
analysis procedure and interindividual differences in task performance. In these respects,
the observation method cannot be considered a valid standard. Therefore, data analysis
was restricted to a generaiized cornparison of self-reported frequency with an unrefhed
measure based on observation.
It is therefore, impossible to draw specific conclusions regarding the accuracy of the self
reports of fiequency for each of the 20 tasks represented in the questionnaire. Although
not statistically significant, the percentage of agreement was lowest for standing (29%)
and highest for climbing ladders (64%) (TabIe 9). It is difficult to compare the anaiysis
of the self-reported physical demands with that of other studies as the methodologies
differ substantially. However, as previously noted, it has been found that the proportion
of tirne (Le. fiequency categories) rnay be more difficult for subjects to estimate than a
more direct measurement (WiktoM et ai., 1993). Pope et al. (1998) found that the
validity of self-reported physical demands is satisfactory at a dichotomous level versus
quantiSing the details of the workioad. For example, asking an individual whether they
perfonn a task at dl was found to be a more valid approach to assessing occupational
exposures.

Occupational Exposures
The design of the current study was a cross-sectional survey via questionnaire in which
the statu of an individual worker conceming the presence or absence of exposure and
history of disability was concurrently assessed.
Aithough not being the focus of this study, the occupational exposure data collected is of
particular interest- Occupation was also found to be significantly associated with
reported disability rates. It was f o n d that with the sample studied, those individuds who
were emp lo yed in manufacturing occupations had significantly higher rates of reported
disability (X2,=1 1.49, p<0.001). The essential tasks of the positions represented among
this group were prirnarîly manual materials handling. It should be noted that it has been
previously found that there evidence of a strong association with manual material
handling tasks and reported Iow back pain and disability (Burdorf and van der Beek,
1999).
The essential tasks of the positions represented among this group were also noted to be
highly repetitive in nature. It has been reported by Johansson and Rubenowitz (1994) as
welI as Fransson-Hall et al. (1995) that risk indicators for the upper extremities were
higher exposures to repetitive rnovements. Johansson and Rubenowitz (1994) also found
that heavy or fiequent manual operations and repeated rotation of the t d are risk
factors for Iow back pain.

As noted in the results, it was found that there were five physical tasks that were
significantly associated with reported claims history which were walking, horizontal
reaching, upper extremity pulling, ladder climbing, and tnink flexion (Table 10). These
findings are consistent with results reported by Burdorf and Sorock (1997) who reported
that among other exposures, fiequent ûunk flexion is strongly associated with low back
pain. In regard to ladder climbing, the association with disability may be a result of f d s
fiom heights. These results should be interpreted with some caution as with the large
number of tasks analyzed (20)' some of the significant results may be due to chance.
However, as noted these findings are consistent with the literature and there is reason to
believe these results to be true.
During the data collection period the researcher made numerous visits to the work sites.
The work practices of the employees were observed on a regular basis and it was found
that the employees' work methods were not always in keeping with usual safe work
practices. For example. the shelf stockers frequently stood on kee moving and unstable
stock carts to gain access to the highest shelves which were 84"/210cm above the floor
level. Therefore, the results should be interpreted with the howledge that work practice
may be a contributhg factor to Ïnjury and disability.

Dernographics
Gender. Based on the resuits of an analysis of the characteristics of the study population
it was found that disability was significantly associated with gender, men having a higher
reported rate of disability (X2,=4.73, pC0.05). As noted in the literature review there are
relatively few studies that address gender specifically and there are confiicting resuIts
regarding same. The results of the current study conflict with those reported by Fransson
et al. (1995) who reported that female assernbly line workers reported more symptoms
than their male counterparts. (Oleinick et al., 1996). As previously indicated, this hd ing
is not supported by Winkel and Mathissen (1994) who reported that the predictive value
of gender is Iow.
Age. Contrary to findings reported by Cheadle et al. (1994) age was not found to be a
significant predictor of disability (X2,=0.626, pcO.05). However, this finding is
consistent with results reported by Fransson et al. (1995) as well as Winkel and
Mathiassen (1994) who indicated that age is not a predictor of disability. They atûibuted
this to what they temed a 'liealthy worker effect" rneaning that the older workers with
pain or other symptoms leave the more physically demanding jobs. This effect may also
be a factor in the current study as the average age of the population was 41 years.
Pïiysical Factors. As previously noted, there were no studies reviewed that were directly
comparable to the current methodology which confounds the researcher's ability to draw
direct cornparisons to the results of other studies. For example, the majority of the

methodologies compare the self reports of physical demands of a population who
reported pain or symptoms at the time of the study with a control group who were
reportedly asymptomatic at the t h e of data collection (Burdorf and Laun, 1992, Wiktorin
et al., 2996, Nordstrom et al., 1998, and Wilctorin et al., 1999)- Despite this, the results of
the current study indicate that there is no difference betw-een those reporhng a history of
lost time claims and those who do not, in regard to the degree of association between the
participant and observer reports.
Limitations
1. Reported daim history may not be associated to current work tasks and may have
occurred whïle performing the essential tasks in a previous occupation.
2. Many of the subjects were in an occupation category (cashiers) and had very few
reported disability claims relative to the other occupations represented in the study.
This may have reduced the power of the statisticd analysis.
3- The sample size was not sufficient to consider this project to be an epidemiological
study however, the studies identified in the literature that were comparable were
epiderniological in nature.

Methodological Issues
ln ter observer ReCinbility. The interobserver reliability regarding observed fiequency for
each of the 20 tasks was low for complete agreement (35%) and substantially higher for
agreement within one frequency category (96.7%). Based on these percentages it seems
fair to report that the observer fiequencies utilized for comparison to the participants self-
reports were moderately reliable.
Observutiun Procedure. As discussed in Chapter 4, task analysis and observation have
methodological limitations. There are Lingering questions regarding the validity and
reliability of these methods of data collection and whether they should be considered an
appropnate standard for comparison. Reasons for this include error associated with task
analysis, intrdinter individual variation in task performance, and other potential
observation errors-
Ideally, the use of direct measures could have provided a more accurate reference for
comparison, however, the cost and time required to utiIize these methodologies was not
feasible for the current study.
The presence of an observer is also known to have the potential to influence an
individual's performance (Pope et al., 1998). However, this is aiso an issue with direct
measurements (Le. video analysis) as the individual must be made aware- In addition to
this, confidentiality would also be a concern.

Future Research. Further epidemiological research is required to evduate the possible
associations between workplace exposures and adverse human heakh outcomes (Burdorf,
1992) as there is a need for data on occupation exposures and their associated health
effects that can be generalized both within and across industries (Punnet and Keyserling,
1987). As noted by Burdorf (lggî), the drawback of many epidemiological studies is the
Iimited quality of exposure data. It is hoped that this study has conûibuted to this void of
knowledge, however various future investigations are suggested to M e r develop the
howledge pertaining to work related injury and disability. Each of these is outlined
below:
1. Specific fiequency categories could be utilized in descniing each task in
questionnaire format. This would improve the specificity and sensitivity of the data
and provide more detaiIed information for cornparison.
2. Regression analyses could be performed separately on the observed data and the self-
report data to predict claim group membership.
3. The Chi Square analyses could be recalculated using a more Liberal method of
determining agreement (i.e. plus or minus one kequency category between the
observed and self-report data as being "agreement").

4. More resources be utilized in obtainüig uiformation directly fiom the participants, for
instance using an in depth interview protocol, increase nurnbers of observers and
subjects.
Conclusion
It was found that the average percent agreement between the questionnaire responses and
the observed exposure data obtained via job site analyses was 49%. The results of this
study suggest that walking, ho rizont al reaching, upper extremify pulling, Iadder clim bing,
and trunk flexion may predispose an individual to a work related disability. The results
also suggest that males and those individuds who are employed in manufacturing
facilities rnay also be predisposed to disability. In regard to rates of perceived exertion,
the results indicate that those individuds who report high rates of perceived exertion (6-
IO+) whife performing hand rnovements, whole body push and pull have a tendency to
report a past disability.

APPENDIX A
Informed Consent Form

INFORMED CONSENT FORM Evaluating Subjective Reported Physical Work Demands
Inves tigator:
Victoria Martin Tel. 466-1563 SchooI of Human HeaIth and Performance, Dalhousie University
Purpose:
The purpose of this study is to generate information regarding the factors that are potentialiy associated with work related injuries and the corresponding compensation. The results will be utilized to make recornrnendations about the procedures used to determine physical work demands.
Procedure:
You will be asked to complete an Employee Questionnaire, which consists prirnarily of questions regarding the physical dernands of your job as well as supplementary questions regarding age, gender, height, weight, Iength of emplo yment, workers ' compensation/disabili ty insurance claims history dunng the past five years, and time lost frorn work. You will be asked not to discuss your responses with your CO-workers.
After you have completed the questionnaire the investigator and an assistant, who are boîh trained in job site analysis, will evaluate the physical demands of your job. Subsequendy, the results of the job site assessrnent will be included with the results of the questionnaire and statistically analyzed.
The information gathered by the investigator will remain entirely confidential, and it will be kept in a secure place. Your participation in this project will have no effect, positive or negaiive, on your employment and job security. It shouId be noted that your employer has pennitted the researcher to conduct this project at their facility and has offered full cooperation.
If you have questions or queries conceming the procedures or your participation in study you are encouraged to contact the investigator prior to or following your participation. The investigator will be available throughout the study. if you are Literested in the results of this study a one-page summary wilI be made available to you upon request.
Signature of investigator:
1 , have read the above information and have been provided the opportunity to ask questions regarding my participation in thk shidy. 1 understand that my participation is strictiy voIuntary, and if at any time 1 find that 1 do not wish to continue, 1 may withdraw without penalty. Furthemore, 1 understand that aU of the data gathered from my participation in this shidy will be kept confidential.
Signature: Date:

APPENDIX B
Questionnaire

F m - -
Percehnd Exertion h&c.ttthedsgcwd

Physical Work Oema~ Perceived Gertior
RPE:
RPE:

Physical Work Oemar Rishing *th enlire boay 1

APPENDIX C
Rate of Perceived Exertion Scale

RATE OF PERCEIVED EXERTION SCALE (RPE) Evaluating Subjective Reports of Physical Work Demands
As indicated on the questionnaire, you are asked to rate your perceived exertion utilizing the following scale. Please indicate the level of exertion that best represents what you experience while completing the individual physical tasks that are required of you in your job and place the corresponding number where indicated on the questionnaire.
Rate of Perceived Exertion Scale (RPE) as developed by Borg (1 982).
Table 1. Adapted from Borg's CR-10 scale for ratings of perceived exertion
No exertion Just noticeable exertion
Light exertion Moderate exertion
Heavy exertion
Very heavy exertion
Almost maximal exertion Maximal exertion

APPENDIX D
Introductory Letter

To: Ail Employees
From: Victoria Martin
RE: Research Project, Factors Infiuencing Work and Disabiiity Dear Employee:
My name is Victoria Martin and 1 am a graduate student in the school of Health and Human Performance at Dalhousie University. PresentIy, 1 am in the process of conducting a research project, which is a requirement for the completion of my degree.
The purpose of my project is to gather information about the factors that are potentially associated with disabilities and the corresponding compensation. The results will be utilized to make recornmendations about the procedures used to determine the physical work demands of a job such as yours.
In order to complete my project, 1 require a minimum of 50 people who work in a facility such as the one where you are employed to complete a questionnaire regarding the physical demands of their jobs, The questionnaire also includes supplementary questions regarding age, gender, height, weight, and duration of empIoyment, workers' compensation/disability insurance cIaims history dwuig the past five years, as well as lost time fiom work. If you choose pt participate, you will be asked to cornplete the questionnaire while at work and you would have 24 hours to do so.
1 have obtained approval from your employer to conduct rny research at this facility. However, f would like to stress that although this letter may have been distributed to you by your shift supervisor your employer has no affiliation with the project. Therefore, your participation in the project wÏll have no effect on your employment status or job securïty, positive or negative. In addition, your responses will be kept confidential.
The purpose of this lerter is to introduce the project and myself to you- 1 intend to follow up with you in person should you have questions and concerns. At this time, 1 will also be providing a consent fonn for your review and consideration. As noted, 1 require a minimum of 50 individual to participate and your participation would be greatly appreciated. If you are interested in participating in this project please mark the circle below, fil1 in your name, seal your response in the envelope provided, and return your Ietcer to the box outside the cafeteria.
Thank you for your time and consideration. If you should have questions or concerns please contact me at (902) 469-0724 or (902) 466-1563.
Sincerely,
Victoria Martin
0 YES, I am interested in participating in the project as described above.

APPENDIX E
Chi Square Data Tables
Agreement B etween S elf-Reported and Observed Task Frequency

Table El. Srand Individuals with no Individuals with a Total
daims bistory daims history Agreement 21 1 O 31 Disagreement 63 14 77 Total 84 24 108
Table E2. Walk Individuals with no Individuals with a To ta1
daims history daims history Agreement 45 1 O 55 Disagreement 39 14 53 Total 84 24 108
Table E3. Sit Individuals with no Individuals with a Total
daims history clairns history Agreement 3 1 11 42 ~ i s a ~ r e e r n e n t 53 13 66 Total 84 24 108
Table E4. Kneel Individuals with no Individuals Mth a To ta1
daims history claims history Agreement 40 1 O 50 Disagreement 44 14 58 Total 84 24 108
Table ES. Crouch Individuafs with no Individuals with a Total
daims history daims history Agreement 56 12 68 Disagreement 28 12 40 Total 84 24 108
Table E6. VerticaI reach Individuals with no Individuals with a Total
daims history daims history Agreement 36 13 49 Disagreement 48 11 59 Total 84 24 108
Table E7. Horizontal reach Individuds with no lndividuals with a Total
daims history daims history Agreement 37 12 49 Disagreement 47 12 59 Total 84 24 108

Table ES. Hand movements Individuals with no Individuals with a Total
claims history daims history Agreement 54 13 67 Disagreemen t 30 11 41 Total 84 24 108
Table E9. Upper extremiw pull Individuals with no Indivïduals with a Total
claims history daims history Agreement 29 7 36 ~ i s a ~ r e e m e n t Total
Table El 0. Upper extremity push Individuals with nû Individuals with a Total
clairns history daims history Agreement 40 8 48 Disagreement 44 16 60 Total 84 24 108
Table El 1. Whole body ~ u l l . Individuais with no Individuals with a Total
claims history claims history Agreement 46 12 56 Disagreement 40 12 52 Total 84 24 1 08
TabIe E12. Whole body push Individuab with no Individuals with a Total
daims history daims history Agreement 44 12 56 Disagreement Total
Table E13. Unilateral 1 8 Individuals with no Individuals with a Total
daims history daims bistory Agreement 28 8 36 Disagreement 56 16 72 Total 84 24 1 08
Table E14. Bilateral Iift Individuals with no Individuals with a Total
claims history daims history Agreement 36 10 46 Disagreement 48 14 62 Total 84 24 108

Table E15. Unilaterd cary Individuals with no Individuals with a Total
daims history daims history Agreement 45 12 57 Disagreement 3 9 12 51 Total 84 24 108
Table E16. Bilateral carry Individuals with no Individuals with a Total
daims tistory daims history Agreement 38 11 49 Disagreement 46 13 59 To ta1 84 24 108
Table E17. Stair climb Individuals with no Individuals with a Total
daims history daims history Agreement 50 13 63 Disagreement 34 11 45 To ta1 84 24 108
Table E18. Ladder climb ~ndividuals with no Individuals with a Total
daims history daims history Agreement 57 12 69 Disagreement 27 12 39 Total 84 24 108
Table El 9. Trunk flexion Individuals with no Individuals with a Total
daims history daims history Agreement 40 1 O 50 Disagreement Total
Table E20. Trunk rotation Individuals with no Individuals with a Total
daims history daims history Agreement 3 3 7 50 Disagreement 51 17 58 Total 84 24 108

APPENDXX IF
Chi Square Data Tables
Observed Frequencies Utilized in the Determination of Occupational Risk Factors

Table FI. Stand Observed Frequency Individuals with no Individuals with a Total
claims history claims history Never / Occasional 24 9 33 Frequent / Constant 60 15 75 Total 84 24 108
Table F2. Wak Observed Frequency Individuals with no Individuals with a Total
daims history daims history Never 1 Occasional 52 6 58 Frequent / Constant 32 18 50 Total 84 24 108
Table F3. Sit Observed Frequency Individuals with no Individuals with a Total
claims history claims history Never / Occasional 82 21 103 Frequent / Constant 2 3 5 Total 84 24 108
Table F4. Kneel Observed Frequency Individuals with no Individuals with a Total
daims history claims history Never / Occasional 67 18 85 Frequent / Constant 17 6 23 Total 84 24 108
TabIe F5. Crouch Observed Frequency Individuals with no Individuals with a Total
daims history claims history Never / Occasional 84 24 1 OS Frequent / Constant O O O Total 84 24 108
Table F6. Vertical reach Observed Frequency Individuals with no Individuals with a To ta1
daims history claims history Never 1 Occasional 5 3 8 Frequent 1 Constant 79 21 100 Total 84 24 108
Table F7. Horizontal reach Observed Frequency Individuais with no Individuals with a Total
claims history claîms history Never / Occasional 81 3 84 Frequent / Constant 3 21 24 Total 84 24 108

Table F8. Hmd movements Observed Frequency Individuals with no Individuais with a Total
daims history claims history Never 1 Occasional 9 3 12 Frequent / Constant 75 2 1 96 To ta1 84 24 108
Table F9. Upper extremity pull Observed Frequency Individuals with no Individuals with a Total
claims history claims history Never / Occasional 3 3 16 49 Frequent 1 Constant 51 8 59 Total 84 24 108
Table F10. Upper extreniity push Observed Frequency Individuals with no Individuals with a Total
claims history claims history Never 1 Occasional 81 2 1 102 Frequent / Constant 3 3 6 Total 84 24 108
Table FI 1. Whole body pull Observed Frequency Individuals with no Individuats with a Total
daims history claims history Never / Occasional 81 23 1 04 Frequent / Constant 3 1 4 Total 84 24 108
Table F12. Whoie body pusb Observed Frequency Individuals with no Individuals with a Total
daims history claims histot-y Never 1 Occasional 81 23 104 Frequent / Constant 3 1 4 To ta1 84 24 108
Table F13. Unilateral lift Observed Frequency Individuals with no Individuals with a Total
daims history claims history Never 1 Occasional 7 5 12 Frequent / Constant 77 19 96 To ta1 84 24 108
Table F14. Bilaterai lift Observed Frequency Individuals with no Individuals with a Total
daims history daims history Never 1 Occasional 62 15 77 Frequent / Constant 22 9 31 To ta1 84 24 108

Table F15- Unilaterd carry Obsewed Frequency Individuais with no Individuals with a TotaI
daims history daims history Never / Occasional 73 17 90 Frequent 1 Constant 11 7 18 Total 84 24 108
Table F16. Bilaterai cary Observed Frequency Individuals with no Indivïduals with a To ta1
daim history daims history Never / Occasional 61 15 76 Frequent / Constant 23 9 32 Total 84 24 108
Table F17. Stair clirnb Observed Frequency Individuais with no Individuals with a Total
claims history claims history Never / Occasional 84 23 107 Frequent / Constant O 1 1 Total 84 24 108
Table F18. tadder climb Observed Frequency Individuals with no Individuals with a To ta1
claims history daims history Never 1 Occasional 67 24 91 Frequent / Constant 17 O 17 Total 84 24 IO8
Table F19. Trunk flexion Observed Frequency Individuals with no Individuals with a Total
daims history claims history Never / Occasional 84 O 84 Frequent 1 Constant O 24 24 To ta1 84 24 108
Table ]MO. Trunk rotation Observed Frequency Individuals with no Individuals with a Total
claims history daims history Never / Occasional 3 4 7 Frequent / Constant 8 1 20 101 To ta1 84 24 108

APPENDIX G
Chi Square Data Tables
Perceived Exertion Ratings

Table Gl. Stand Rate of Perceived Individuals with no Individuals with a Total
Exertion daims history claims history 0-5 69 22 9 1 6-10+ 14 2 17 Total 84 24 108
Table G2. Wak Rate of Perceived Individuals with no Individuals mith a Total
Exertion daims history clairns history 0-5 76 23 99 6-1 O+ Total
Table G3. Sit Rate of Perceived Individuals with no Individuals with a Total
Exertion daims history elaims history 0-5 83 24 107 1 Total
Table G4. Kneel Rate of Perceived Individuals with no Individuals with a Total
Exertion daims history clairns history 0-5 78 2 1 99 6-1 O+ Total
Table GS. Crouch Rate of Perceived Individuals with no Individuals with a Total
Exertion daims history daims history 0-5 76 20 96 6-1 O+ 8 4 12 Total 84 24 108
Table G6- Vertical reach Rate of Perceived Individuals with no Individuals with a Total
Exertion daims history daims history 0-5 63 19 87
Table G7. Horizontal reach Rate of Perceived Individuals with no Individuals with a Total
Exertion daims history claims history 0-5 67 18 85 610+ Total

Table G8. Hand movements Rate of Perceived Individuals with no Individuals with a To ta1
Exertioa claims history daims history 0-5 63 13 76 6-1 O+ 21 1 I 32 To ta1 84 24 108
Table G9. Upper extremity pull Rate of Perceived Individuals with no Individuals with a To ta1
Exertion daims history daims history 0-5 66 16 82 6-10+ 18 8 26 Total 84 24 108
Table GlO. Upper extremity push Rate of Perceived Individuals with no Individuais with a Total
Exertion daims history claims history 0-5 68 17 85
Table G11. Whole body pull Rate of Perceived Individuals with no Iadividuals with a Total
Exeïtion daims history claùns history 0-5 57 O 57 6-1 O+ 27 24 51 Total 84 24 1 08
Table Gl2- Whole body push Rate of Perceived IndividuaIs with no Individuals with a To ta1
Exertion daims history daims history 0-5 6-IO+ Total
Table G13. Unilateral lift Rate of Perceived Individuals with no Individuals with a Total
Esertion claims history clairns histo ry 0-5 71 18 89 6-10+ 13 6 19 Total 84 24 I O 8
Table G14. Biiateral lift Rate of Perceived Individuals with no Individuals with a Total
Exertion daims history daims history 0-5 62 13 75 6-1 O+ Total

Table GIS. Unifateral carry Rate of Perceived Individuals with no Individuals with a Total
Exertion daims history claims histow
Table G16. Bilateral carry Rate of Perceived Individuals with no Individuals with a Total
Exertion claims history daims history 0-5 70 18 88 6-lot- Total
Table 617. Stair climb Rate of Perceived Individuals with no Individuals with a Total
Exertion daims history daims history 0-5 80 21 101 6-10+ 4 3 7 Total 84 24 1 08
Table G18. Ladder climb Rate of Perceived Individuals with no Individuals with a Total
Exertion clairns history claims history 0-5 82 23 105 6-1 O+ - 7 1 3 Total 84 24 108
Table G19. TNnk flexion Rate of Perceived Individuals with no Individuals with a Total
Exertion daims history claims histow 0-5 65 19 84 6-1 O+ 19 5 24 Total 84 24 108
Table G20. Tntnk rotation Rate of Perceived Individuals with no Individuals with a Total
Exertion claims history daims history 0-5 62 17 79 6-10+ 22 7 29 Total 84 24 108

Ahlborg, A. (1990). Validity of exposure data obtained by questionnaire. Scandinavian Journal of Work and Environmental Health, 16,284-288.
Andrews, D.M., Norman, R.W-, & Wells, R.P. (1996). Accuracy and repeatability of low back spine compression force estimates fiom self-reports of body posture during load handling. International Journal of Induseid Ergonomics, 18, 25 1- 260.
Andrews, D.M., Norman, R.W., Wells, R.P., & Neumann, P. (1997). The accuracy of self-report and trained observer methods for obtaining e s b a t e s of peak load information during industrial work. International Jounial of Industrial Ergonomics, 19, 445-455.
Bigos, S.J., Battie, MC., Spengler, D.M., Fisher, L-D., Fordyce, W.E., Hansson, T.H., Nachernson, A.L., & Wortley, M.D. (1991). A Prospective Study of Work Perceptions and Psychological Factors Affecting the Report of Back Injury. Spine, l6(l), 1-5.
Borg, G. (1982). Psychophysical bases of perceived exertion. Medicine and Science in Sports and Exercise, 14(5), 377-3 8 1.
Borg, G. (1990). Psychophysical scaling with applications in physical work and the perception of exertion. Scandinavian Journal of Work and Environmental Health, ~ ~ ( S U P P ~ 1), 55-58.
Burdorf, A. & Sorock, G. (1 997). Positive and negative evidence of risk factors for back disorders. Scandinavian Joumal of Work and Environmental Health, 23, 243- 256.

Burdorf, A. & van der Beek, A.J. (1999). In muscdoskeletal epidemiology are we asking the unanswerable in questionnaires on physical Ioad? [Editorial] Scandinavian Journal of Work and Environmental Health, 25(2), 8 1 -83.
Burdorf, A. & Laan, J. (1991). Cornparison of methods for the assessment of postural load on the back. Scandinavian Journal of Work and Environmentai Health, 17, 425-9,
Burdorf, A, (1992). Exposure assessment of risk factors for disorders of the back in occupational epidemiology. Scandinavian Journal of Work and Environmental Health,
Burdorf, A. (1 995). Reducing random measurement error in assessing postural load o r the back in epidemiologic surveys. Scandinavian Journal of Work and Environmental Health, 2 1, 15-23.
Campbell, L., Pannett, B., Egger, P., Cooper, C., & Coggon, D. (1997). Vdidity of a Questionnaires for Assessing Occupational Activities- American Journal of Industrial Medicine, 3 1, 422-426.
Carlson, N.K., Dniry, C.G., & Webber, J.A. (1977). Discriminability of Large Weights. Ergonomies, 20(1), 8 7-90.
Cheadle, A., Franklin, G., WoUhagen, C., S a v a ~ o , J., Liu, P.Y., Salley, C., & Weaver, M. (1 994). Factors influencing the duration of work-related disability : a population-based study of Washington State workers' compensation. Amencan Journal of Public Health, 84(2), 190-1 96.
Dehlin, O. & Berg, S. (1977). Back symptoms and psychological perceptions of work. A study among nursing aides in a genatric hospital. Scandinavian Journal of Rehabilitative Medicine, 9,61-65,
Feuerstein, M., Berkowitz, SM., & Peck, C.A. (1997). Occupational musculoskeletal-related disability in US Army personnel: prevalence, gender, and

military occupational specialties. Journal of Occupational and Environmental Medicine, 39,68-78, -
Feurerstein, M., Berkowitz, S.M., & Huang, G.D. (1999). Predictors of Occupational Low Back Disability: Implications for Secondary Prevention. Journal of Occupational and Environmental Medicine, 41 (12), 1 024-1 O3 1.
Fransson-Hall, C-, Byskom, S., & Kilbom, A. (1995). Predictors of Occupational Low Back Disability: Implications for Secondary Prevention, Journal of Occupational and Environmental Medicine, 37(9), 1 136- 1 144.
Fntschi, L., Siemiatycki, J., & Richardson, L. (1996). Self-assessed Versus Expert-assessed Occupational Exposures. Amencan Journal of Epidemiology, 144(5), 52 1-527,
Gamberale, F. (1990). Perception of effort in manual materials handling. Scandinavian Journal of Work and Environmental Health, l6(suppl l), 59-66.
Gamberale, F., Ljungberg, AS., Annwail, G., & Kilbom, A. (1987). An experimental evaluation of psychophysical cntena for repetitive lifting work. Applied Ergonomies, 18,3 1 1-321.
Hagberg, M. (1992). Exposure Variables in Ergonomie Epidemiology. Arnerican Journal o f Industrial Medicine, 2 1,9 1-100.
Hollmann, S., Klimmer, F., Schmidt, K.H., & Kylian, H. (1999). Validation of a questionnaire for assessing physical workload. Scandinavian Journal of Work and Environmental Health, 16(2), 105-1 14.
Holmstrom, E. & Moritz, U. (1991). Low Back Pain-Correspondence Between Questionnaire, Interview and Clinical Examination. Scandinavian Journal of Rehabilitative Medicine, 23, 1 19-125.
Hughes, R.E., Silverstein, B.A., & Evanoff, B.A. (1997). Risk Factors for Work- Related Musculoskeletal Disorders in an AlUIIUIium Smelter. American Journal of Industrial Medicine, 32,66-75.

Human Resources Developrnent Canada (1 994). National OccupationaI Classification. Ottawa: Canada Communication Group.
Isernhagen, S. (1995). Job site Analysis. In S. Isernhagen, The Comprehensive Guide to Work Injury Management @p. 70-82). Gaithersberg, Maryland: Aspen Publishers, Inc.
Jackson, A S ., Borg, G., Zhang, J. J., Laughery, KR., & Chen, J. (1 997). Role of physical work capacity and load weight on psychophysical lift ratings. International Journal of Industrial Ergonomics, 20, 18 1-1 90.
Johansson, J.A. & Rubenowitz (1994)- Risk Indicators in the psychologicai and physical work environment for work-related neck, shoulder, and low back symptoms: A study among blue- and white-collar workers in eight companies. Scandinavian Journal of Rehabilitative Medicine, 26, 13 1-1 42.
Key, G. L. (1994). Industrial Therapy (1'' ed.). Mosby-Yearbook, hc.
King, P.M. (1993). Outcome Analysis of Work-Hardening Programs. - The American Journal of Occupational Therapy, 47(7), 696-603.
Knibbe, J.J. & Friele, R. D. (1996). Prevalence of back pain and characteristics of the physical workioad of comrnunity nurses. Ergonomics, 39(2), 186-198.
Krause, N., Ragland, D.R., Fisher, J.M., & Syme, S.L. (1998). Psychosocial job factors, physical workload, and incidence of work -related spinai injury: A 5-year prospective study of urban hansit operators. Spine, 23 (23), 2507-2516.
Kumar, S. (1 993). The accuracy of aunk posture perception among young male subjects. In R Nielsen & K. Jorgensen (Eds.), Advances Industrial Ergonomics and Safety V @p. 225-229). Taylor and Francis.
Lancourt, J. & Kettelhut, M. (1992). Predicting return to work for lower back pain patients receiving worker's compensation. Spine, 17,629-640.

Lechner, E.D. (1 994). Work Hardening and Work Conditioning Interventions: Do They Affect Disability? Physical Therapy, 74(6), 47 1-493.
Lindstrom, I., Ohlund, C., & Nachemson, A. (1994). Validity of Patient Reporting and Predicitve Value of Industrial Physical Work Demands. Spine, 19(8), 888- 893,
Ljungberg, AS., Gamberale, F., & Kilbom, A. (1982). HonzontaI lifting - Physiological and psychological responses. Ergonomics, 25(8), 741-757.
Marras, W.S., Lavender, S.A., Leurgans, S.E., Fathallah, F.A., Ferguson, S.A., Allread, W.G., & Rajulu, S.L. (1995). Biomechanical nsk factors for occupationally related low back disorders. Ergonomics, 3 8, 3 77-4 1 0.
Marras, WS., Lavender, S.A., Leurgans, S.E., Rajulu, S.L., Allread, W.G., Fathallah, F.A., & Ferguson, S.A. (1993). The role of dynarnic three-dimensional tnuik motion in occupationally related low back disorders. Spine, 18(5), 6 17-628.
Martin, V. (1 998). Evaluating Subjective Reports of Physical Work Demands (pilot study). Proceedings of the Human Factors Association of Canada, 30,201-205.
Matsui, H., Maeda, A., Tsuji, H., & Nanise, Y. (1997). Risk hdicators of Low Back Pain Among Workers in Japan. Association of Familial and Physical Factors with Low Back pain. Spine, 2211 1)- 1242-124.
Melarned, S., Yekutieli, D., Froom, P., Krîstal-Boneh, E., & Ribak, J. (1999). Adverse Work and Environmental Conditions Predict Occupational Injuries. Amencan Journal of Epiderniology, I 50(1), 1 8-26.
Niemeyer, L.O., Jacobs, K., Reynolds-Lynch, K., Bettencourt, C., & Lang, S. (1994). Work Hardening: Past, Present, and Future - The Work Prograrns Special Interest Section National Work-Hardening Outcome Study. The American Journal of Occupational Therapy, 48(4), 327-39.

Nordstrom, D.L., Vierkant, R.A., Layde, P.M., & Smith, M.J. (1 998). Cornpariscm of Self-Reported and Expert-Observed Physical Activities at Work in a General Population. American Journal of Industrial Medicine, 34,29-3 5.
OIeinick, A., Gluck, J.V., & Guire, K.E. (1996). Factors affecting fkst r e m to work following a cornpensable occupational back injury. American JournaI of Industrial Medicine, 30,540-555.
Pheasant, S. (199 1)- Ergonomics, Work and Health (pp. 19). Gaithersberg, Maryland: Aspen Publishers, Inc.
Pope, D.P., Silman, A.J., Cheny, N.M., Pritchard, C. P., & Macfarlane, G.J. (1998). Validity of a self-completed questionnaire measuring the physical demands of work. Scandinavian Journal of Work and Environmental Health, 24 (9,376-385.
P m e t t , L. & Keyserling, W. M. (1987). Exposure to ergonornic stressors in the garment indus- application and critique of job-site work analysis methods. Ergonornics, 30 (7), 1099-1 1 16.
Reynolds, J. (1997). Job Site AnaIysis. Roy Matheson and Associates Inc.
van der Beek, A. & Frings-Dresen, M.H.W. (1998). Assessrnent of mechanical exposure in ergonomic epidemiology, Occupational and Environmental Medicine, 55, 29 1-299.
Viikari-Juntura, E., Rausa, S., Martikainen, R., Kuosma, E., Rihimaki, H., Takala, E.P., & Saarenmaa, K. (1996). Validity of self-reported physical work load in epidemiologic studies on rnusculoskeletd disorders. ~candinavi& ~6urnal of Work and Environmental Health, 22,25 1-259.

Wickstrom, G.J- & Pentti, J. (1998). Occupational factors af3ecting sick leave attributed to low-back pain. Scandinavian Journal of Work and Environmental Health, 24, 145-152.
Wiklund, M.L. (1 996). Quality Outcornes in Work Rehabilitation. In S. Isemhagen, The Comprehensive Guide to Work Injury Management (pp.763-780). Gaithersberg, Maryland: Aspen Publishers, Inc.
Wiktorin, C., Hjelm, E.W., Winkel, J., & Koster, M. (1996). Reproducibility of a questionnaire for assesment of physical load during work and leisure time. Journal of Environmental Medicine, 3 8(2), 190-20 1.
Wiktorin, C., Karlqvist, L., & Winkel, J. (1993). Validity of self-report exposures to work postures and manual materials handling. Scandinavian Journal of Work and Environmental Health, 1 9,208-2 14.
Wiktorin, C., Vingard, E., Mortimer, M., Pernold, G., Wigaeus-Hjelrn, E., Kilbom, A., Alfiedsson, & MUSIC Norrtalje Study Group (1999). Interview Versus Questionnaire for Assessing Physical Loads in the Population-Based MUSIC-Norrtdje Study. Amencan Journal of Industnal Medicine, 35,441 -455.
Winkel, J. & Mathiassen, S.E. (1994). Assessrnent of physical work load in epidemiologic studies: concepts, issues, and operational considerations. Ergonomics, 37(6), 979-988.