AND INCORPORATED AREAS - Pima County, Arizona Wash Panels 12P-13P Anklam Wash Panel 14P Arcadia Wash...
110
VOLUME 1 OF 5 Federal Emergency Management Agency FLOOD INSURANCE STUDY NUMBER 04019CV001B PIMA COUNTY, ARIZONA AND INCORPORATED AREAS COMMUNITY NAME COMMUNITY NUMBER MARANA, TOWN OF 040118 ORO VALLEY, TOWN OF 040109 PIMA COUNTY (UNINCORPORATED AREAS) 040073 SAHUARITA, TOWN OF 040137 SOUTH TUCSON, CITY OF 040075 TUCSON, CITY OF 040076 REVISED: September 28, 2012 Pima County
Transcript of AND INCORPORATED AREAS - Pima County, Arizona Wash Panels 12P-13P Anklam Wash Panel 14P Arcadia Wash...

VOLUME 1 OF 5
Federal Emergency Management Agency
FLOOD INSURANCE STUDY NUMBER
04019CV001A
Federal Emergency Management Agency
FLOOD INSURANCE STUDY NUMBER
04019CV001B
PIMA COUNTY, ARIZONA AND INCORPORATED AREAS COMMUNITY NAME COMMUNITY NUMBER MARANA, TOWN OF 040118 ORO VALLEY, TOWN OF 040109 PIMA COUNTY (UNINCORPORATED AREAS) 040073 SAHUARITA, TOWN OF 040137 SOUTH TUCSON, CITY OF 040075 TUCSON, CITY OF 040076
REVISED:
September 28, 2012
Pima County
NOTICE TO FLOOD INSURANCE STUDY USERS Communities participating in the National Flood Insurance Program have established repositories of flood hazard data for floodplain management and flood insurance purposes. This Flood Insurance Study (FIS) may not contain all data available within the repository. It is advisable to contact the community repository for any additional data. Part or all of this FIS may be revised and republished at any time. In addition, part of this FIS may be revised by the Letter of Map Revision process, which does not involve republication or redistribution of the FIS. It is, therefore, the responsibility of the user to consult with community officials and to check the community repository to obtain the most current FIS components. This Preliminary revised Flood Insurance Study contains only profiles and floodway data tables added or revised as part of the restudy. These profiles are presented in a reduced scale to minimize reproduction costs. All profiles will be included and printed at full scale in the final published report. Initial Countywide FIS Effective Date: February 8, 1999 Revised Countywide FIS Date: June 16, 2011 – to update corporate limits, to change Base Flood
Elevations and Special Flood Hazard Areas, to update map format, to add roads and road names, and to incorporate previously issued Letters of Map Revision.
September 28, 2012 – to incorporate the Agua Caliente Wash Physical Map Revision case number 09-09-2642P

i
TABLE OF CONTENTS – Volume 1 – September 28, 2012
Page
1.0 INTRODUCTION 1
1.1 Purpose of Study 1
1.2 Authority and Acknowledgments 1
1.3 Coordination 7
2.0 AREA STUDIED 8
2.1 Scope of Study 8
2.2 Community Description 16
2.3 Principal Flood Problems 19
2.4 Flood Protection Measures 30
3.0 ENGINEERING METHODS 36
3.1 Hydrologic Analyses 36
3.2 Hydraulic Analyses 52
3.3 Vertical Datum 72
3.4 Behind-Levee Analysis 74
4.0 FLOODPLAIN MANAGEMENT APPLICATIONS 77
4.1 Floodplain Boundaries 77
4.2 Floodways 82
5.0 INSURANCE APPLICATIONS 86
6.0 FLOOD INSURANCE RATE MAP 88
7.0 OTHER STUDIES 88
8.0 LOCATION OF DATA 94
9.0 BIBLIOGRAPHY AND REFERENCES 94
10.0 REVISION SECTION 103
10.1 Revision (September 28, 2012) 103

ii
TABLE OF CONTENTS – Volume 1 – continued – September 28, 2012
Page FIGURES Figure 1 - Floodway Schematic 86 TABLES Table 1 - Initial and Final CCO Meetings 7-8 Table 2 – Flooding Sources Studied by Detailed Methods 9 Table 3 – Flooding Source Studied by Approximate Methods 10 Table 4 – Letters of Map Correction 10-16 Table 5 – History of Flooding 19-21 Table 6 - Summary of Discharges 43-52 Table 7 - Manning's "n" Values 70-71 Table 9 – Panel Number Changes 89-90 Table 10 - Community Map History 91-92
TABLE OF CONTENTS – Volume 2 – September 28, 2012
Table 8 - Floodway Data 1-55
TABLE OF CONTENTS – Volume 3 – September 28, 2012 EXHIBITS Exhibit 1 - Flood Profiles
"A" Wash Panel 01P Agua Caliente Wash Panels 02P-07P Airport Wash Panels 08P-10P Ajo Wash Panel 11P Alamo Wash Panels 12P-13P Anklam Wash Panel 14P Arcadia Wash Panels 15P-17P Arroyo Chico East Panels 18P Arroyo Chico Upstream Panels 19P-20P Big Wash Panels 21P-27P Blanco Wash Panels 28P-29P
iii
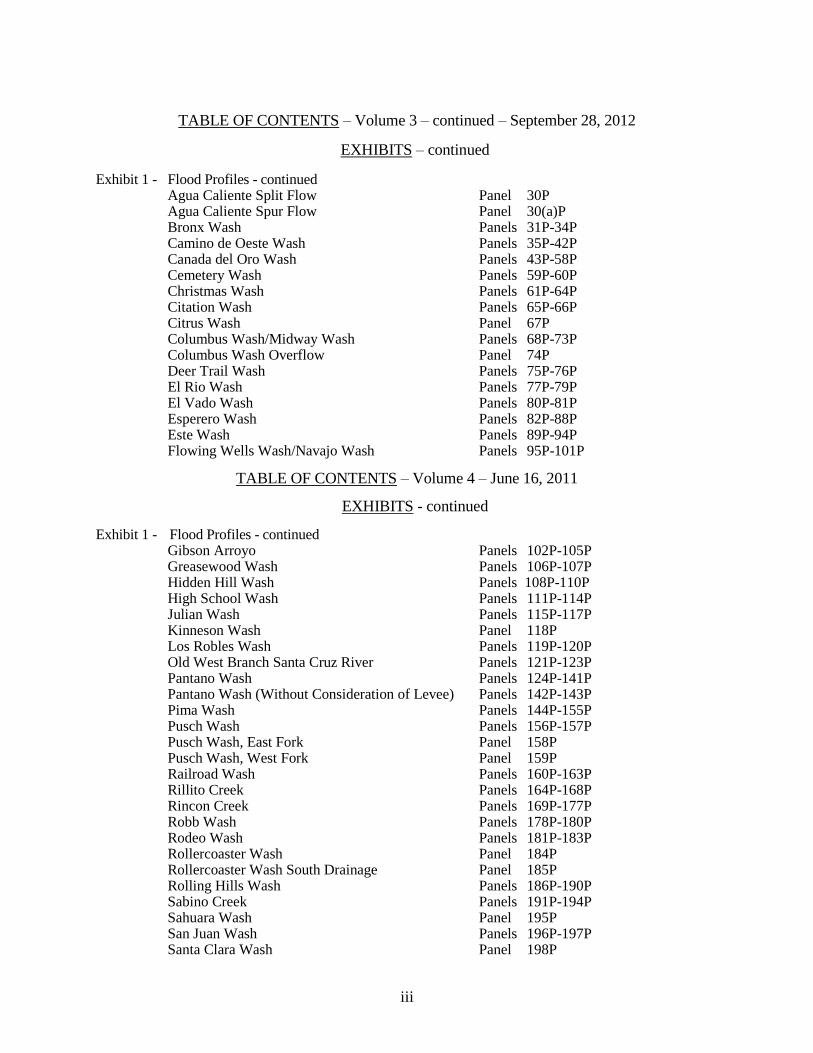
TABLE OF CONTENTS – Volume 3 – continued – September 28, 2012
EXHIBITS – continued Exhibit 1 - Flood Profiles - continued
Agua Caliente Split Flow Panel 30P Agua Caliente Spur Flow Panel 30(a)P Bronx Wash Panels 31P-34P Camino de Oeste Wash Panels 35P-42P Canada del Oro Wash Panels 43P-58P Cemetery Wash Panels 59P-60P Christmas Wash Panels 61P-64P Citation Wash Panels 65P-66P Citrus Wash Panel 67P Columbus Wash/Midway Wash Panels 68P-73P Columbus Wash Overflow Panel 74P Deer Trail Wash Panels 75P-76P El Rio Wash Panels 77P-79P El Vado Wash Panels 80P-81P Esperero Wash Panels 82P-88P Este Wash Panels 89P-94P Flowing Wells Wash/Navajo Wash Panels 95P-101P
TABLE OF CONTENTS – Volume 4 – June 16, 2011
EXHIBITS - continued Exhibit 1 - Flood Profiles - continued
Gibson Arroyo Panels 102P-105P Greasewood Wash Panels 106P-107P Hidden Hill Wash Panels 108P-110P High School Wash Panels 111P-114P Julian Wash Panels 115P-117P Kinneson Wash Panel 118P Los Robles Wash Panels 119P-120P Old West Branch Santa Cruz River Panels 121P-123P Pantano Wash Panels 124P-141P Pantano Wash (Without Consideration of Levee) Panels 142P-143P Pima Wash Panels 144P-155P Pusch Wash Panels 156P-157P Pusch Wash, East Fork Panel 158P Pusch Wash, West Fork Panel 159P Railroad Wash Panels 160P-163P Rillito Creek Panels 164P-168P Rincon Creek Panels 169P-177P Robb Wash Panels 178P-180P Rodeo Wash Panels 181P-183P Rollercoaster Wash Panel 184P Rollercoaster Wash South Drainage Panel 185P Rolling Hills Wash Panels 186P-190P Sabino Creek Panels 191P-194P Sahuara Wash Panel 195P San Juan Wash Panels 196P-197P Santa Clara Wash Panel 198P

iv
TABLE OF CONTENTS – Volume 5 – June 16, 2011
EXHIBITS - continued Exhibit 1 - Flood Profiles - continued
Santa Cruz River Panels 199P-216P Santa Cruz River Above Pima Mine Road Panels 217P-234P Santa Cruz River Tributary West Branch Panel 235P Silvercroft Wash Panels 236P-238P Tanque Verde Creek Panels 239P-249P Tucson Arroyo/Arroyo Chico Panels 250P-254P Unnamed Tributary to Rollercoaster Wash Panel 255P Unnamed Wash Panel 256P Van Buren Wash Panels 257P-258P Ventana Canyon Wash Panels 259P-272P West Branch Brawley Wash Panels 273P-274P Wild Burro Wash Panels 275P-276P Wilson Wash Panels 277P-280P
Exhibit 2 - Flood Insurance Rate Map Index Flood Insurance Rate Map

1
FLOOD INSURANCE STUDY PIMA COUNTY, ARIZONA AND INCORPORATED AREAS 1.0 INTRODUCTION
1.1 Purpose of Study This countywide Flood Insurance Study (FIS) investigates the existence and
severity of flood hazards in, or revises and updates previous FISs/Flood Insurance Rate Maps (FIRMs) for the geographic area of Pima County, Arizona, including: the Cities of South Tucson and Tucson, and the Towns of Marana, Oro Valley, and Sahuarita, and the unincorporated areas of Pima County (hereinafter referred to collectively as Pima County) and aids in the administration of the National Flood Insurance Act of 1968 and the Flood Disaster Protection Act of 1973. This FIS has developed flood risk data for various areas of the county that will be used to establish actuarial flood insurance rates. This information will also be used by Pima County to update existing floodplain regulations as part of the Regular Phase of the National Flood Insurance Program (NFIP), and will also be used by local and regional planners to further promote sound land use and floodplain development. Minimum floodplain management requirements for participation in the NFIP are set forth in the Code of Federal Regulations at 44 CFR, 60.3.
In some States or communities, floodplain management criteria or regulations may
exist that are more restrictive or comprehensive than the minimum Federal requirements. In such cases, the more restrictive criteria take precedence and the State (or other jurisdictional agency) will be able to explain them.
The Digital Flood Insurance Rate Map (DFIRM) and FIS report for this countywide study have been produced in digital format. Flood hazard information was converted to meet the Federal Emergency Management Agency (FEMA) DFIRM database specifications and Geographic Information System (GIS) format requirements. The flood hazard information was created and is provided in a digital format so that it can be incorporated into a local GIS and be accessed more easily by the community.
1.2 Authority and Acknowledgments
The sources of authority for this FIS are the National Flood Insurance Act of 1968
and the Flood Disaster Protection Act of 1973. This FIS was prepared to include the unincorporated areas of, and incorporated
communities within, Pima County in a countywide format. Information on the authority and acknowledgments for each jurisdiction included in this countywide FIS, as compiled from their previously printed FIS reports, is shown below.

2
Marana, Town of: the hydrologic and hydraulic analyses for the original study were performed by the U.S. Geological Survey (USGS), for FEMA, under Interagency Agreement No. IAA-H-8-76, Project Order No. 15, Amendment No. 1. The study was completed in 1979.
The hydrologic and hydraulic analyses for the 1983 revision were performed by Cella Barr Associates, for FEMA, under Contract No. EMW-83-C-1185. The study was completed in September 1985. The hydrologic and hydraulic analyses for Santa Cruz River and Tortolita Alluvial Flats were performed for the April 2, 1992, revision. The hydrologic and hydraulic analyses for Idle Hour Wash was performed for the October 16, 1996, revision.
Oro Valley, Town of: the hydrologic and hydraulic analyses for
the original FIS were performed by Cella Barr Associates, for FEMA, under Contract Nos. EMW-83-C-1185 and EMW-84-C-1641. This work was completed in September 1985.
Pima County (Unincorporated Areas): the hydrologic and hydraulic analyses for
the original study were performed by the USGS, for FEMA, under Interagency Agreement No. IAA-H-8-76, Project Order No. 15, Amendment No. 1. The study was completed in 1979.
The hydrologic and hydraulic analyses for the 1983 revision were performed by Cella Barr Associates, for FEMA, under Contract No. EMW-83-C-1185. The study was completed in September 1985. The hydrologic and hydraulic analyses for the 1985 revision were performed by Cella Barr Associates, for FEMA, under Contract
3
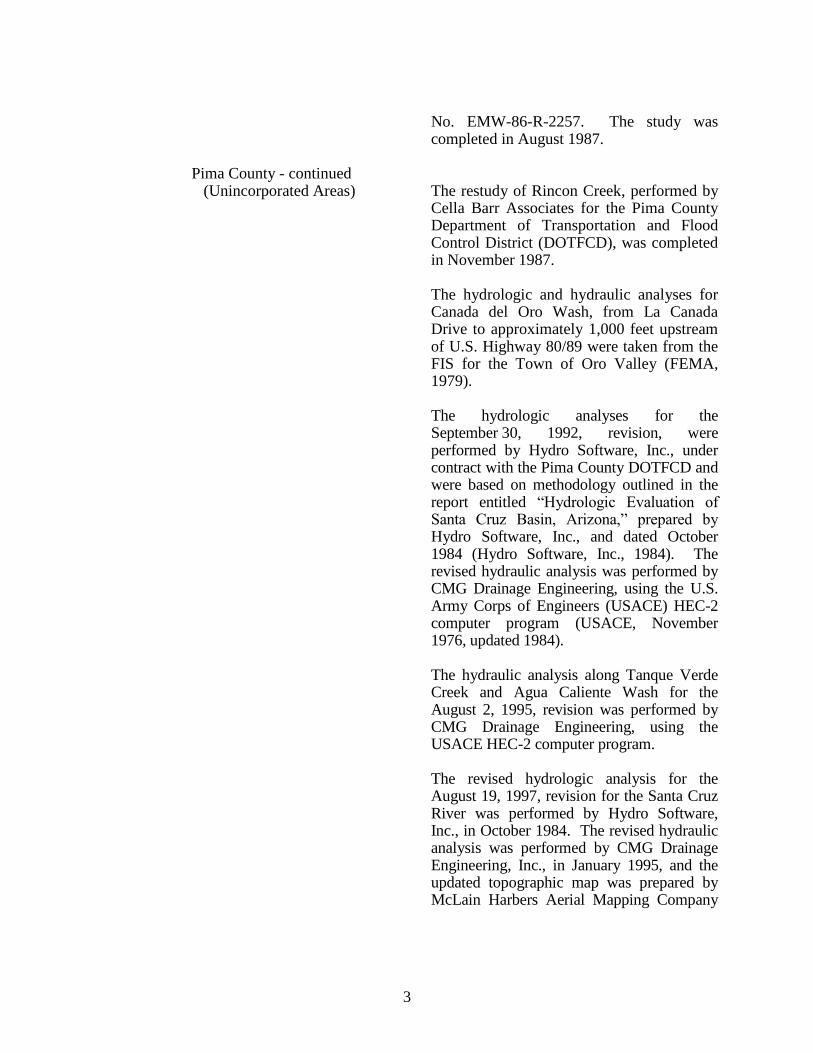
No. EMW-86-R-2257. The study was completed in August 1987.
Pima County - continued (Unincorporated Areas) The restudy of Rincon Creek, performed by
Cella Barr Associates for the Pima County Department of Transportation and Flood Control District (DOTFCD), was completed in November 1987. The hydrologic and hydraulic analyses for Canada del Oro Wash, from La Canada Drive to approximately 1,000 feet upstream of U.S. Highway 80/89 were taken from the FIS for the Town of Oro Valley (FEMA, 1979). The hydrologic analyses for the September 30, 1992, revision, were performed by Hydro Software, Inc., under contract with the Pima County DOTFCD and were based on methodology outlined in the report entitled “Hydrologic Evaluation of Santa Cruz Basin, Arizona,” prepared by Hydro Software, Inc., and dated October 1984 (Hydro Software, Inc., 1984). The revised hydraulic analysis was performed by CMG Drainage Engineering, using the U.S. Army Corps of Engineers (USACE) HEC-2 computer program (USACE, November 1976, updated 1984). The hydraulic analysis along Tanque Verde Creek and Agua Caliente Wash for the August 2, 1995, revision was performed by CMG Drainage Engineering, using the USACE HEC-2 computer program. The revised hydrologic analysis for the August 19, 1997, revision for the Santa Cruz River was performed by Hydro Software, Inc., in October 1984. The revised hydraulic analysis was performed by CMG Drainage Engineering, Inc., in January 1995, and the updated topographic map was prepared by McLain Harbers Aerial Mapping Company
4
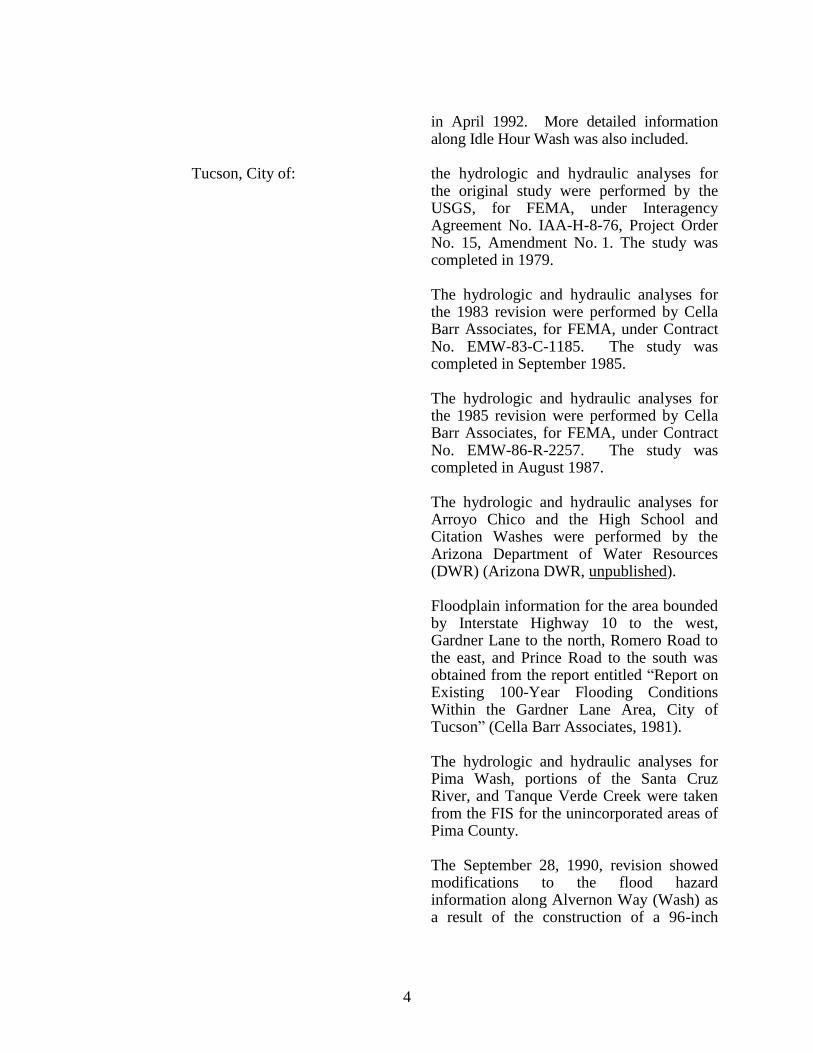
in April 1992. More detailed information along Idle Hour Wash was also included.
Tucson, City of: the hydrologic and hydraulic analyses for the original study were performed by the USGS, for FEMA, under Interagency Agreement No. IAA-H-8-76, Project Order No. 15, Amendment No. 1. The study was completed in 1979.
The hydrologic and hydraulic analyses for the 1983 revision were performed by Cella Barr Associates, for FEMA, under Contract No. EMW-83-C-1185. The study was completed in September 1985.
The hydrologic and hydraulic analyses for the 1985 revision were performed by Cella Barr Associates, for FEMA, under Contract No. EMW-86-R-2257. The study was completed in August 1987. The hydrologic and hydraulic analyses for Arroyo Chico and the High School and Citation Washes were performed by the Arizona Department of Water Resources (DWR) (Arizona DWR, unpublished).
Floodplain information for the area bounded by Interstate Highway 10 to the west, Gardner Lane to the north, Romero Road to the east, and Prince Road to the south was obtained from the report entitled “Report on Existing 100-Year Flooding Conditions Within the Gardner Lane Area, City of Tucson” (Cella Barr Associates, 1981).
The hydrologic and hydraulic analyses for Pima Wash, portions of the Santa Cruz River, and Tanque Verde Creek were taken from the FIS for the unincorporated areas of Pima County.
The September 28, 1990, revision showed modifications to the flood hazard information along Alvernon Way (Wash) as a result of the construction of a 96-inch

5
stormwater-sewer system from East Fort Lowell Road to East Grant Road and the widening of the road from 36 to 72 feet wide.
Tucson, City of – continued The hydrologic and hydraulic analyses were restudied as part of the September 30, 1992, revision for all or portions of Alamo, Arcadia, Christmas, Enchanted Hills, and Robb Washes; Rillito, Tanque Verde, and Sabino Creeks; and Santa Cruz River were revised. In addition, a Limited Map Maintenance Program (LMMP) project was performed for Railroad and Rodeo Washes. The hydraulic analysis for the revision of Hidden Hills and Robb Washes, tributaries to Tanque Verde Creek, were performed by Osborn, Petterson, Walbert and Associates. The hydraulic analysis for the revision of Arcadia and Enchanted Hills Wash was performed by the City of Tucson. The first hydrologic and hydraulic revision of Alamo Wash was prepared by Simons, Li & Associates, Inc., for the City of Tucson and the second revision were performed by the City of Tucson. The hydraulic analysis for Tanque Verde Creek was performed by Greiner Engineering in March 1990. The hydraulic analyses for Sabino and Rillito Creeks and a portion of Tanque Verde Creek were performed by CMG Drainage Engineering, Inc., in July 1991. Railroad and Rodeo Washes were studied by the USGS in accordance with the LMMP under Interagency Agreement No. EMW-88-E-2764. The hydraulic analysis along Tanque Verde Creek and Agua Caliente Wash for the August 2, 1995, revision was performed by CMG Drainage Engineering, using the USACE HEC-2 computer program (USACE, November 1976, updated 1984). The hydrologic and hydraulic analyses for the February 11, 1993, revision were performed by McGovern, MacVittie, Lodge

6
& Dean, Inc., for FEMA, under Contract No. EMW-90-C-3106. The study was completed in June 1992.
Tucson, City of – continued The hydraulic analysis along Tanque Verde Creek and Agua Caliente Wash for the August 2, 1995, revision was performed by CMG Drainage Engineering, using the USACE HEC-2 computer program. The June 4, 1996, revision included the incorporation of multiple LOMRs and a LOMA to the FIRMs. The hydrologic and hydraulic analyses along Anklam Wash and “A” Wash were performed during the August 5, 1997, revision.
A drainage study was performed for Lower Santa Cruz levee entitled "Lower Santa Cruz Levee (Continental Ranch to Sanders Road)" by PCFCD and Town of Marana, September 1998. A drainage study has performed for Santa Cruz Floodway entitled "Letter of Map Revision, Town of Marana and Pima County, AZ Lower Santa Cruz River RS 9.19 to RS 2.94", January 31, 2003, by Kimley Horn and Associates. The authority and acknowledgments for the Town of Sahuarita are not available because FIS reports were not published prior to the February 8, 1999, countywide FIRM. The authority and acknowledgments for the City of South Tucson are the same as the City of Tucson FIS. February 8, 1999, Countywide Revision The February 8, 1999, countywide revision was issued to combine the FIRMs and FIS reports for Pima County and its incorporated areas into a countywide format. June 16, 2011, Revised Analyses The hydrologic and hydraulic analyses were prepared for FEMA by CMG Drainage Engineering for the Town of Marana and were based on methodology outlined in the report entitled, "Marana Tortolita Alluvial Fan Study" (CMG#28004). The work was completed in April 2009.
On selected FIRM panels, planimetric base map information was provided in digital format by Pima County Department of Public Works. Base map information shown on this FIRM was derived from multiple sources. Base map
7
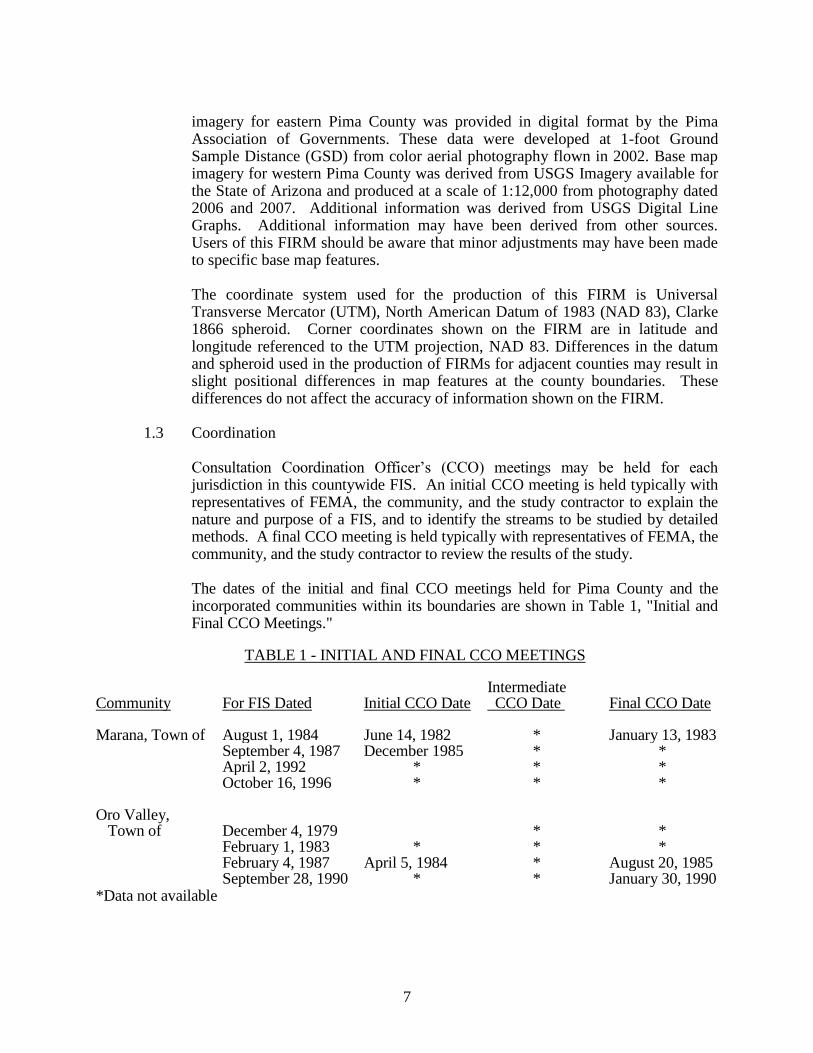
imagery for eastern Pima County was provided in digital format by the Pima Association of Governments. These data were developed at 1-foot Ground Sample Distance (GSD) from color aerial photography flown in 2002. Base map imagery for western Pima County was derived from USGS Imagery available for the State of Arizona and produced at a scale of 1:12,000 from photography dated 2006 and 2007. Additional information was derived from USGS Digital Line Graphs. Additional information may have been derived from other sources. Users of this FIRM should be aware that minor adjustments may have been made to specific base map features. The coordinate system used for the production of this FIRM is Universal Transverse Mercator (UTM), North American Datum of 1983 (NAD 83), Clarke 1866 spheroid. Corner coordinates shown on the FIRM are in latitude and longitude referenced to the UTM projection, NAD 83. Differences in the datum and spheroid used in the production of FIRMs for adjacent counties may result in slight positional differences in map features at the county boundaries. These differences do not affect the accuracy of information shown on the FIRM.
1.3 Coordination Consultation Coordination Officer’s (CCO) meetings may be held for each
jurisdiction in this countywide FIS. An initial CCO meeting is held typically with representatives of FEMA, the community, and the study contractor to explain the nature and purpose of a FIS, and to identify the streams to be studied by detailed methods. A final CCO meeting is held typically with representatives of FEMA, the community, and the study contractor to review the results of the study.
The dates of the initial and final CCO meetings held for Pima County and the
incorporated communities within its boundaries are shown in Table 1, "Initial and Final CCO Meetings."
TABLE 1 - INITIAL AND FINAL CCO MEETINGS
Community For FIS Dated Initial CCO Date Intermediate CCO Date Final CCO Date
Marana, Town of August 1, 1984 June 14, 1982 * January 13, 1983 September 4, 1987 December 1985 * * April 2, 1992 * * * October 16, 1996 * * * Oro Valley,
Town of December 4, 1979 * * February 1, 1983 * * * February 4, 1987 April 5, 1984 * August 20, 1985 September 28, 1990 * * January 30, 1990 *Data not available

8
TABLE 1 - INITIAL AND FINAL CCO MEETINGS - continued
Community For FIS Dated Initial CCO Date Intermediate CCO Date Final CCO Date
Pima County February 15, 1983 January 29, 1976 * January 14, 1982 (Unincorporated September 6, 1989 May 5, 1983 * August 20, 1985 Areas) January 1, 1985 May 20, 1987 * September 30, 1992 * * * August 2, 1995 * * * August 19, 1997 * * * Tucson, City of August 2, 1982 January 29, 1976
* October 26, 1981
January 6, 1988 May 5, 1983 * August 19, 1985 January 1, 1985 May 20, 1987 * August 3, 1989 * * * September 28, 1990 * * * September 30, 1992 * * * July 5, 1994 November 13, 1991 * * November 19, 1991 * * August 2, 1995 * * * June 4, 1996 * * * August 5, 1997 * * * *Data not available February 8, 1999, Countywide Revision
No initial, intermediate or final CCO information is available for this revision.
June 16, 2011, Revised Analyses For this countywide revision, final CCO meetings were held at June 29, 2009. These meetings were attended by representatives of the study contractors, Pima County, Towns of Marana and Oro Valley, City of Tucson, the State of Arizona, and FEMA.
2.0 AREA STUDIED
2.1 Scope of Study This FIS covers the geographic area of Pima County, Arizona. All or portions of the flooding sources listed in Table 2, "Flooding Sources Studied
by Detailed Methods," were studied by detailed methods. Limits of detailed study are indicated on the Flood Profiles (Exhibit 1) and on the FIRM (Exhibit 2).

9
TABLE 2 - FLOODING SOURCES STUDIED BY DETAILED METHODS
Detailed Study Streams “A” Wash Agua Caliente Wash Airport Wash Ajo Wash Alamo Wash Anklam Wash Arcadia Wash Arroyo Chico Big Wash Blanco Wash Brawley Wash Breakout from Agua Caliente Wash Bronx Wash Camino De Oeste Wash Canada del Oro Wash Cemetery Wash Christmas Wash Citation Wash Citrus Wash Columbus Wash/Midway
Wash Columbus Wash Overflow Deer Trail Wash
El Rio Wash El Vado Wash Esperero Wash Este Wash Flowing Wells
Wash/Navajo Wash Gibson Arroyo Greasewood Wsh Hidden Hill Wash High School Wash Julian Wash Kinneson Wash Los Robles Wash Navajo Wash Old West Branch Santa Cruz River Pantano Wash Pima Wash Pusch Wash Pusch Wash, East Fork Pusch Wash, West Fork Railroad Wash Rillito Creek
Rincon Creek Robb Wash Rodeo Wash Rollercoaster Wash Rollercoaster Wash South
Drainage Rolling Hills Wash Sabino Creek Sahuara Wash San Juan Wash Santa Cruz River Santa Cruz Tributary West
Branch Silvercroft Wash Tanque Verde Creek Tucson Arroyo
Chico/Arroyo Chico Unnamed Tributary to Rollercoaster Wash Van Buren Wash Ventana Canyon Wash Wild Burro Wash Wilson Wash
Detailed Shallow Flooding Streams
Alvernon Wash Arcadia Wash Arroyo Chico Black Wash Cemetery Wash Cholla Wash Christmas Wash Citation Wash Columbus Wash
Earp Wash East Embankment of the Union Pacific Railroad (UPRR) Enchanted Hills Wash Flowing Wells Wash Hidden Hills Wash High School Wash
Kennison Wash Naylor Wash Navajo Wash at North Oracle Wash Robb Wash Rose Hill Wash San Juan Wash Santa Clara Wash
Detailed Alluvial Fan Methods – Tortolita Alluvial Fan Area
Canada Aqua East Wash Canada Aqua West Wash Cottonwood Canyon Cochie Canyon
Derrio Wash Guild Wash Prospect Wash
Ruelas Canyon Unnamed Canyons Wild Burro Canyon

1
The areas studied by detailed methods were selected with priority given to all
known flood hazard areas and areas of projected development and proposed construction.
All or portions of the flooding sources listed in Table 3, "Flooding Sources Studied
by Approximate Methods," were studied by approximate methods. Limits of study are indicated on the FIRM (Exhibit 2).
TABLE 3 - FLOODING SOURCES STUDIED BY APPROXIMATE METHODS Alamo Wash Ajo Wash Arcadia Wash Atterbury Wash Black Wash Cemetery Wash East Branch Brawley Wash East Embankment of the SPRR El Vado Wash Gardner Lane Watershed Area
High School Wash Idle Hour Wsh Kennedy Wash Navajo Wash Naylor Wash Oro Valley Wash Old West Branch Santa Cruz River at San Marcos Boulevard Railroad Wash Robb Wash Rodeo Wash
Rooney Wash Rose Hill Wash San Juan Wash Santa Cruz River Soldier Canyon Wash Unnamed Wash (a tributary to Pusch Wash that flows through El Conquistador Resort)
Tributary to West Branch Santa Cruz River
Webb Wash All or portions of numerous flooding sources in the county were studied by approximate methods. Approximate analyses were used to study those areas having a low development potential or minimal flood hazards. The scope and methods of study were proposed to, and agreed upon by, FEMA and Pima County.
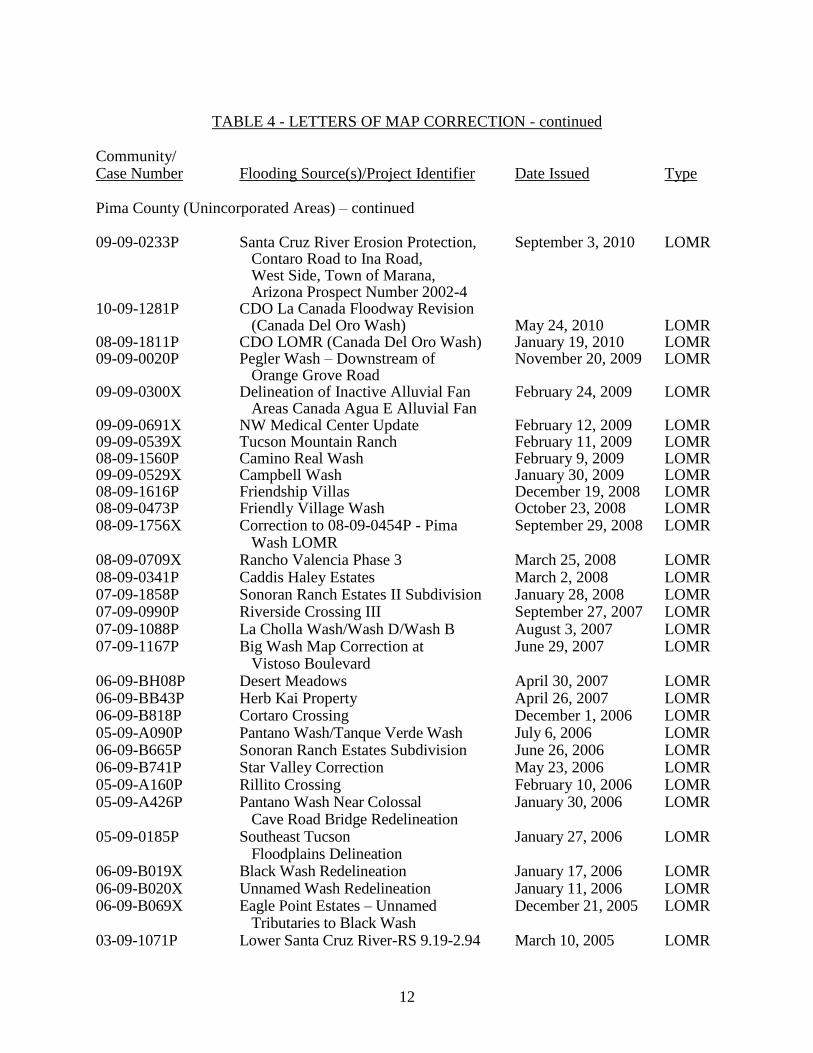
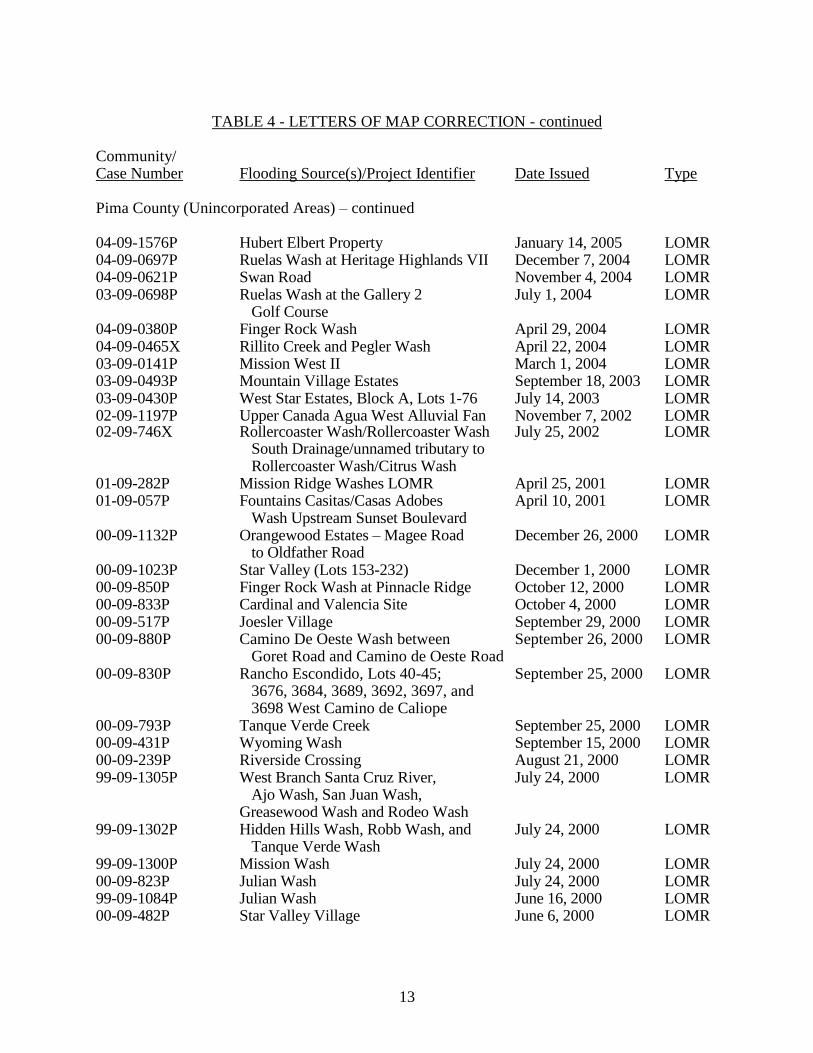
This FIS also incorporates the determinations of letters issued by FEMA resulting
in map changes (Letter of Map Revision [LOMR], Letter of Map Revision - based on Fill [LOMR-F], and Letter of Map Amendment [LOMA], as shown in Table 4, "Letters of Map Correction."
TABLE 4 - LETTERS OF MAP CORRECTION Community/ Case Number Flooding Source(s)/Project Identifier Date Issued Type Town of Marana 10-09-3129X Santa Cruz River Erosion Protection, September 7, 2010 LOMR 09-09-0233P Santa Cruz River Erosion Protection, September 3, 2010 LOMR Contaro Road to Ina Road, West Side, Town of Marana, Arizona Prospect No. 2002-4 09-09-0980P Wild Burro Wash/Gallery 5 January 26, 2010 LOMR 08-09-1811P CDO LOMR (Canada Del Oro Wash) January 19, 2010 LOMR

11
TABLE 4 - LETTERS OF MAP CORRECTION - continued Community/ Case Number Flooding Source(s)/Project Identifier Date Issued Type Town of Marana - continued 09-09-0300X Delineation of Inactive Alluvial Fan February 24, 2009 LOMR Areas Canada Agua E Alluvial Fan 06-09-BD84P Santa Cruz River-RS 6.34-RS 8.24 October 26, 2006 LOMR 04-09-0697P Ruelas Wash at Heritage Highlands VII March 23, 2005 LOMR 03-09-1071P Lower Santa Cruz River-RS 9.19-2.94 March 10, 2005 LOMR 02-09-1039P Lower Santa Cruz River Levee September 16, 2004 LOMR 04-09-0308P The Villages III August 12, 2004 LOMR 03-09-0698P Ruelas Wash at Gallery 2 Golf Course July 1, 2004 LOMR 04-09-0465X Rillito Creek and Pegler Wash April 22, 2004 LOMR 04-09-0750P Rillito Creek and Pegler Wash April 22, 2004 LOMR 04-09-0474P Bluffs at Dove Mountain April 19, 2004 LOMR 98-09-353P Santa Cruz River from Cortaro Farms August 31, 1999 LOMR Road to Ina Road Town of Oro Valley 10-09-3451P CDO LOMR (Canada Del Oro Wash) Revision September 30, 2010 LOMR 10-09-1281P CDO La Canada Floodway Revision (Canada Del Oro Wash) May 24, 2010 LOMR 10-09-1312P Unnamed Wash at El Conquistador Townhomes May 17, 2010 LOMR 08-09-1800P Big Wash/Rancho Vista/Neighborhood 4 April 24, 2010 LOMR 08-09-1811P CDO LOMR (Canada Del Oro Wash) January 19, 2010 LOMR 07-09-1088P Chaparral Heights, La Cholla Wash/ August 3, 2007 LOMR Wash D/Wash B 07-09-1167P Big Wash Map Correction at June 29, 2007 LOMR Vistoso Boulevard 07-09-0603P Sunset Canyon Estates, Unnamed Wash March 21, 2007 LOMR 04-09-0958P Big Wash at Rancho Vistoso, July 15, 2005 LOMR Neighborhoods 3 & 4, Phase 1 04-09-1576P Hubert Elbert Property January 14, 2005 LOMR 00-09-839P San Jose Plaza September 28, 2000 LOMR 99-09-783P Village 19 July 14, 1999 LOMR Pima County (Unincorporated Areas) 10-09-3453P CDO LOMR (Canada Del Oro Wash) Revision 2 September 30, 2010 LOMR 10-09-2406P Ventana Canyon Wash/Esperero Wash September 13, 2010 LOMR 10-09-2498P Trails End Wash September 9, 2010 LOMR 10-09-2567P West Speedway Wash September 8, 2010 LOMR
12
TABLE 4 - LETTERS OF MAP CORRECTION - continued Community/ Case Number Flooding Source(s)/Project Identifier Date Issued Type Pima County (Unincorporated Areas) – continued 09-09-0233P Santa Cruz River Erosion Protection, September 3, 2010 LOMR Contaro Road to Ina Road, West Side, Town of Marana, Arizona Prospect Number 2002-4 10-09-1281P CDO La Canada Floodway Revision (Canada Del Oro Wash) May 24, 2010 LOMR 08-09-1811P CDO LOMR (Canada Del Oro Wash) January 19, 2010 LOMR 09-09-0020P Pegler Wash – Downstream of November 20, 2009 LOMR Orange Grove Road 09-09-0300X Delineation of Inactive Alluvial Fan February 24, 2009 LOMR Areas Canada Agua E Alluvial Fan 09-09-0691X NW Medical Center Update February 12, 2009 LOMR 09-09-0539X Tucson Mountain Ranch February 11, 2009 LOMR 08-09-1560P Camino Real Wash February 9, 2009 LOMR 09-09-0529X Campbell Wash January 30, 2009 LOMR 08-09-1616P Friendship Villas December 19, 2008 LOMR 08-09-0473P Friendly Village Wash October 23, 2008 LOMR 08-09-1756X Correction to 08-09-0454P - Pima September 29, 2008 LOMR Wash LOMR 08-09-0709X Rancho Valencia Phase 3 March 25, 2008 LOMR 08-09-0341P Caddis Haley Estates March 2, 2008 LOMR 07-09-1858P Sonoran Ranch Estates II Subdivision January 28, 2008 LOMR 07-09-0990P Riverside Crossing III September 27, 2007 LOMR 07-09-1088P La Cholla Wash/Wash D/Wash B August 3, 2007 LOMR 07-09-1167P Big Wash Map Correction at June 29, 2007 LOMR Vistoso Boulevard 06-09-BH08P Desert Meadows April 30, 2007 LOMR 06-09-BB43P Herb Kai Property April 26, 2007 LOMR 06-09-B818P Cortaro Crossing December 1, 2006 LOMR 05-09-A090P Pantano Wash/Tanque Verde Wash July 6, 2006 LOMR 06-09-B665P Sonoran Ranch Estates Subdivision June 26, 2006 LOMR 06-09-B741P Star Valley Correction May 23, 2006 LOMR 05-09-A160P Rillito Crossing February 10, 2006 LOMR 05-09-A426P Pantano Wash Near Colossal January 30, 2006 LOMR Cave Road Bridge Redelineation 05-09-0185P Southeast Tucson January 27, 2006 LOMR Floodplains Delineation 06-09-B019X Black Wash Redelineation January 17, 2006 LOMR 06-09-B020X Unnamed Wash Redelineation January 11, 2006 LOMR 06-09-B069X Eagle Point Estates – Unnamed December 21, 2005 LOMR Tributaries to Black Wash 03-09-1071P Lower Santa Cruz River-RS 9.19-2.94 March 10, 2005 LOMR
13
TABLE 4 - LETTERS OF MAP CORRECTION - continued Community/ Case Number Flooding Source(s)/Project Identifier Date Issued Type Pima County (Unincorporated Areas) – continued 04-09-1576P Hubert Elbert Property January 14, 2005 LOMR 04-09-0697P Ruelas Wash at Heritage Highlands VII December 7, 2004 LOMR 04-09-0621P Swan Road November 4, 2004 LOMR 03-09-0698P Ruelas Wash at the Gallery 2 July 1, 2004 LOMR Golf Course 04-09-0380P Finger Rock Wash April 29, 2004 LOMR 04-09-0465X Rillito Creek and Pegler Wash April 22, 2004 LOMR 03-09-0141P Mission West II March 1, 2004 LOMR 03-09-0493P Mountain Village Estates September 18, 2003 LOMR 03-09-0430P West Star Estates, Block A, Lots 1-76 July 14, 2003 LOMR 02-09-1197P Upper Canada Agua West Alluvial Fan November 7, 2002 LOMR 02-09-746X Rollercoaster Wash/Rollercoaster Wash July 25, 2002 LOMR South Drainage/unnamed tributary to Rollercoaster Wash/Citrus Wash 01-09-282P Mission Ridge Washes LOMR April 25, 2001 LOMR 01-09-057P Fountains Casitas/Casas Adobes April 10, 2001 LOMR Wash Upstream Sunset Boulevard 00-09-1132P Orangewood Estates – Magee Road December 26, 2000 LOMR to Oldfather Road 00-09-1023P Star Valley (Lots 153-232) December 1, 2000 LOMR 00-09-850P Finger Rock Wash at Pinnacle Ridge October 12, 2000 LOMR 00-09-833P Cardinal and Valencia Site October 4, 2000 LOMR 00-09-517P Joesler Village September 29, 2000 LOMR 00-09-880P Camino De Oeste Wash between September 26, 2000 LOMR Goret Road and Camino de Oeste Road 00-09-830P Rancho Escondido, Lots 40-45; September 25, 2000 LOMR 3676, 3684, 3689, 3692, 3697, and 3698 West Camino de Caliope 00-09-793P Tanque Verde Creek September 25, 2000 LOMR 00-09-431P Wyoming Wash September 15, 2000 LOMR 00-09-239P Riverside Crossing August 21, 2000 LOMR 99-09-1305P West Branch Santa Cruz River, July 24, 2000 LOMR Ajo Wash, San Juan Wash, Greasewood Wash and Rodeo Wash 99-09-1302P Hidden Hills Wash, Robb Wash, and July 24, 2000 LOMR Tanque Verde Wash 99-09-1300P Mission Wash July 24, 2000 LOMR 00-09-823P Julian Wash July 24, 2000 LOMR 99-09-1084P Julian Wash June 16, 2000 LOMR 00-09-482P Star Valley Village June 6, 2000 LOMR

14
TABLE 4 - LETTERS OF MAP CORRECTION - continued Community/ Case Number Flooding Source(s)/Project Identifier Date Issued Type Pima County (Unincorporated Areas) – continued 99-09-434P Camino De Oeste Wash between April 26, 2000 LOMR Goret Road and Camino de Oeste Road 00-09-346P Countryside Master Plan April 26, 2000 LOMR 98-09-442P Madera Highlands October 1, 1999 LOMR 99-09-783P Village 19 July 14, 1999 LOMR 99-09-570P Overflow from Blanco Wash April 8, 1999 LOMR 98-09-709P Thornydale Acres March 8, 1999 LOMR 98-09-716P La Paloma Estates – Tributary to January 19, 1999 LOMR Campbell Avenue Wash (La Paloma Tributary) Town of Sahuarita 09-09-1217P Madera Highlands February 24, 2010 LOMR 98-09-442P Madera Highlands October 1, 1999 LOMR City of Tucson 10-09-2498P Trails End Wash September 9, 2010 LOMR 10-09-2567P West Speedway Wash September 8, 2010 LOMR 10-09-1751P Naylor Wash July 13, 2010 LOMR 09-09-2404P Rincon Vista Middle School January 14, 2010 LOMR 09-09-0020P Pegler Wash – Downstream of November 20, 2009 LOMR Orange Grove Road 08-09-1520P Senita Valley Elementary School March 2, 2009 LOMR 08-09-1560P Camino Real Wash February 9, 2009 LOMR 08-09-1317P Empire Heights January 23, 2009 LOMR 08-09-0473P Friendly Village Wash October 23, 2008 LOMR 08-09-1756X Correction to 08-09-0454P - September 29, 2008 LOMR Pima Wash 08-09-0001P Columbus Wash – Grant Road to May 23, 2008 LOMR Blacklidge Drive 07-09-1087P Alamo Wash May 4, 2008 LOMR 08-09-0442P La Estancia De Tucson March 25, 2008 LOMR 07-09-1857P Lakeside Ridge Subdivision January 15, 2008 LOMR 07-09-1305P Tres Pueblos August 22, 2007 LOMR 07-09-0707P Arroyo Chico – Alvernon Way to June 4, 2007 LOMR Swan Road 07-09-0551P Alvernon Wash February 28, 2007 LOMR 06-09-BA36P Kinneson Wash – Villa Escalante January 26, 2007 LOMR

15
TABLE 4 - LETTERS OF MAP CORRECTION - continued Community/ Case Number Flooding Source(s)/Project Identifier Date Issued Type City of Tucson - continued 07-09-0432X El Vado Wash – Missiondale Road December 13, 2006 LOMR to South 12
th Avenue
05-09-A090P Pantano Wash/Tanque Verde Wash March 16, 2006 LOMR 05-09-A160P Rillito Crossing February 10, 2006 LOMR 05-09-0185P Southeast Tucson Floodplain Delineation January 27, 2006 LOMR 04-09-0547P Columbus Wash/Midway Wash July 28, 2005 LOMR 04-09-0621P Swan Road November 4, 2004 LOMR 03-09-1711P City of Tucson Midtown Multi- Service July 15, 2004 LOMR Center 04-09-0465X Rillito Creek & Pegler Wash April 22, 2004 LOMR 04-09-0427P Players Club Drive March 18, 2004 LOMR 02-09-873P Pantano Wash October 23, 2003 LOMR 02-09-1252P Alvernon Wash LOMR (7/02), February 12, 2003 LOMR Grant Road to Flower Street 02-09-1050P Lots 27-62 & 74-90, Paraiso Subdivision September 11, 2002 LOMR 02-09-220P Aviation Point January 4, 2002 LOMR 00-09-051P Tucson Arroyo and Arroyo Chico November 2, 2001 LOMR 01-09-994P Mesquite Trails, Lots 1-88 October 4, 2001 LOMR 01-09-914P 1730 West Linden Street August 28, 2001 LOMR 01-09-400P Rio Nuevo, Lot 19, Floodway June 12, 2001 LOMR Amendment 01-09-423P Santa Cruz River North of Valencia Road June 8, 2001 LOMR 00-09-274P Randolph South Detention Basin March 29, 2001 LOMR 00-09-969P Kinneson Wash between Desert Springs Drive and Irvington Road March 5, 2001 LOMR 00-09-591P Pantano Wash and Atterbury Wash - November 8, 2000 LOMR 22
nd Street to Golf Links Road
00-09-517P Joesler Village September 29, 2000 LOMR 00-09-793P Tanque Verde Creek September 25, 2000 LOMR 00-09-431P Wyoming Wash September 15, 2000 LOMR 00-09-433P Earp Wash at Desert View August 23, 2000 LOMR 00-09-407P Greasewood Wash at Silvercroft Wash August 8, 2000 LOMR 00-09-616P Alamo Wash July 26, 2000 LOMR 99-09-1305P West Branch Santa Cruz River, July 24, 2000 LOMR Ajo Wash, San Juan Wash, Greasewood Wash and Rodeo Wash 99-09-1303P Elvado Wash & Santa Clara Wash July 24, 2000 LOMR 99-09-1302P Hidden Hills Wash, Robb Wash, July 24, 2000 LOMR and Tanque Verde Wash 99-09-1301P Arcadia Wash July 24, 2000 LOMR 00-09-279P Robb Ranch July 10, 2000 LOMR 00-09-263P Albertson’s at El Rio Plaza June 28, 2000 LOMR

16
TABLE 4 - LETTERS OF MAP CORRECTION - continued Community/ Case Number Flooding Source(s)/Project Identifier Date Issued Type City of Tucson - continued 99-09-1084P Julian Wash June 16, 2000 LOMR 99-09-719P Columbus Wash Drainage Relief Project May 31, 2000 LOMR 00-09-287P Bronx Wash along Linden Street January 20, 2000 LOMR 99-09-314P Arroyo Hills Subdivision, Phase II - September 2, 1999 LOMR Rolling Hills Wash and Deer Trail Wash 98-09-1060P Desert Vista Subdivision June 28, 1999 LOMR 99-09-799P Carriage Hills Drive, Tennyson Drive June 8, 1999 LOMR 99-09-200P Northwest Tucson Industrial Parts May 11, 1999 LOMR 99-09-589P Christmas Wash at Prince Road April 19, 1999 LOMR Box Culvert
2.2 Community Description
Pima County is located in south-central Arizona and covers an area of approximately 9,240 square miles. Pima County is bordered by Maricopa and Pinal Counties to the north, Graham and Cochise Counties to the east, Santa Cruz County and Mexico to the south, and Yuma County to the west.
The economy of the county is based largely on copper mining, manufacturing, and tourism. Approximately 75 percent of the population lives in the eastern part of the county; the population center is the City of Tucson. The 2000 population was estimated to be 843,746. The 2008 population was estimated to be 1,012,018. There was a 19.9-percent increase in population estimates from 2000 to 2008.
Pima County consists of valleys and mountains, with elevations that range from approximately 700 feet in the northwestern corner of the county to approximately 9,185 feet at Mt. Lemmon. The Santa Cruz River valley, which is surrounded by mountains, has a mean elevation of 2,400 feet. The Santa Catalina and Rincon Mountains rise to the north and east of the City of Tucson to elevations of over 8,000 feet. The Tucson Mountains rise to the west to elevations of over 4,000 feet, and the Santa Rita Mountains rise to the south of the City of Tucson to elevations of over 9,000 feet. The mountains contain some of the headwaters of the ephemeral streams that drain the valley.
The climate of the lower elevations of Pima County is characterized by dry winters and hot summers. Afternoon temperatures in the summer are near 100 degrees Fahrenheit ( F), and average winter temperatures are above 32 F (Sellers, W. D. and R. H. Hill, 1974). Temperatures are generally lower at the higher elevations. The average annual precipitation ranges from slightly more than 10 inches in the valleys to approximately 25 inches in the mountains.
17
Approximately half of the annual precipitation falls during the summer as thunderstorms originating in moist air that flows into Arizona from the Gulf of Mexico. Rainfall is normally most intense in the late afternoon or early evening. Convective storms, commonly affecting large areas, are associated with weak tropical disturbances moving northward from the Pacific Ocean and the Gulf of California (U.S. Department of the Interior, 1970).
Most of the remaining precipitation occurs during the winter and is caused by storms from the Pacific Ocean that move through Arizona. The precipitation associated with these disturbances usually falls in gentle, widespread rainshowers that may continue intermittently for several days. Although an average of 75 inches of snow falls annually at higher elevations in the Santa Catalina Mountains, amounts are negligible at the lower elevations.
Most of the streams in the study area are ephemeral and flow only in response to direct precipitation or snowmelt. The flow is extremely variable and of short duration. Major streams also carry intermittent snowmelt runoff during winter and early spring and some irrigation return flow during spring and summer. The smaller streams are dry approximately 95 percent of the year (U.S. Department of the Interior, 1970).
Vegetation in Pima County is mainly cactus, mesquite, and creosotebush. The foothills are covered with cactus and paloverde trees. In the mountains, the desert vegetation is replaced by chaparral. Above an elevation of approximately 6,000 feet, the mountains are covered with pine trees.
The Santa Cruz River, with headwaters in southern Arizona and northern Mexico, is the primary stream in the Santa Cruz River valley. The Santa Cruz River flows northwesterly along the western side of the City of Tucson. The Santa Cruz River flows northwesterly through the central portion of the Town of Marana and into Pinal County, where it is dispersed in what is known as the Santa Cruz Flats, an ancient delta. This water either returns to ground water or evaporates, rarely reaching the Gila River.
Floodplain development in the City of Tucson varies considerably with the size of the flooding source and type of channel. The Santa Cruz River and Pantano Wash have incised channels that will carry the 1-percent-annual-chance flood without overbank flow throughout most of their lengths within the city; however, the channels do have high erosion/migratory potential. Where development has occurred, the floodplains of these streams are moderately to densely developed, however, large parts of the floodplain remain undeveloped. Interstate Highways 10 and 19 generally follow the Santa Cruz River floodplain. This has attracted low-cost housing and commercial development to situate along the banks of the Santa Cruz River. Several trailer parks occupy the floodplain between the Santa Cruz and West Branch Santa Cruz Rivers. Numerous shopping centers, apartments, condominiums, and office buildings have been built in the Pantano Wash floodplain.
18
Canada del Oro Wash, which joins the Santa Cruz River northwest of the City of Tucson, and Enchanted Hills Wash, a major tributary to Canada del Oro Wash, drain areas north of the City of Tucson. Rillito Creek, located north of the City of Tucson, is a major tributary to the Santa Cruz River. Tanque Verde Creek, northeast of the City of Tucson, and Pantano Wash, located east of the City of Tucson near the foothills of the Rincon Mountains, join to form Rillito Creek. Ventana Canyon and Agua Caliente Washes and Sabino Creek are tributaries to Tanque Verde Creek. Rincon Creek is a tributary to Pantano Wash. Julian Wash drains a small area south of the City of Tucson. West Branch Santa Cruz River flows parallel to the Santa Cruz River through the City of Tucson and drains areas southwest of the City of Tucson. Black, Blanco, Brawley, and Los Robles Washes drain through Avra Valley, located approximately 15 miles west of the City of Tucson. These washes join the Santa Cruz River northwest of the City of Tucson. Gibson Arroyo is a small stream that flows through the Ajo in the western part of the county.
The Avra Valley Stream Group is approximately 15 miles west of the City of Tucson and drains to the north. The valley is approximately 50 to 80 miles wide and approximately 30 miles long. At the upstream end of the valley, Altar Wash becomes Brawley Wash, which flows along the eastern side of the valley. Black Wash flows into Brawley Wash from the southeast. Brawley Wash is called Los Robles Wash at the northern end of the valley and flows into the Santa Cruz River. Blanco Wash drains the mountains to the west, flows along the western side of the valley, and joins Los Robles Wash. These ephemeral washes are a series of small braided channels and are generally not well defined.
Brawley Wash drains the eastern portion of Avra Valley. East Branch Brawley Wash proceeds northerly and flows through the southwestern corner of the Town of Marana before rejoining West Branch Brawley Wash west of the town. Brawley Wash then flows northwesterly into Los Robles Wash, and eventually into the Santa Cruz River northwest of the Town of Marana. Rillito Creek has a more distinct floodplain. Most of the floodplain of Rillito Creek, from the Santa Cruz River to Pantano Wash within the City of Tucson is covered with residential and commercial developments.
Small internal streams within the county flow mostly in constructed channels that have no defined floodplain. Along most of these streams, development has occurred to the edges of the channel. In some places, the streams, such as High School and Citation Washes, are confined to long conduits under shopping centers and other commercial developments. A few streams, such as the West Branch Santa Cruz River, have very small or undefined channels. Development along these streams within the frequently flooded parts of the floodplain ranges from light residential to moderate residential and commercial.
The local drainage system consists of several well-defined streams such as Alamo, Arcadia, Arroyo Chico, Atterberry, Enchanted Hills, Este, Hidden Hills,
19
Kinneson, San Juan, Silvercroft, and Tucson Arroyo Washes. Many other streams are poorly defined (not deeply incised in the alluvial material), such as Earp and portions of Julian Washes, and floodwater will spread over large areas and coalesce as it moves northwesterly. Other washes, such as Cemetery, Columbus and Navajo Washes, are essentially City of Tucson streets for certain reaches and have minimal carrying capacity.
The Town of Oro Valley lies on an alluvial slope at the western foot of the Santa Catalina Mountains. A section of the southeastern slope of the Tortolita Alluvial Fans, which emanate from the Tortolita Mountains to the northwest, is also within the northwestern portion of the town. Elevations range from approximately 2,400 feet in the western section of town to approximately 3,670 feet along the northern corporate limits (U.S. Department of the Interior, 1981).
Approximately 1 square mile of the Town of Oro Valley was in the 0.5-mile-wide natural floodplain of Canada del Oro Wash prior to the construction of a flood-control levee. Local drainage is provided by several small washes and drainage channels that flow either northwesterly into Canada del Oro Wash or southwesterly and parallel to it.
2.3 Principal Flood Problems
Pima County has a long history of flood problems. Much of the flooding has resulted from intense local thunderstorms. The thunderstorms are generally of short duration, and the resulting runoff quickly fills streams and washes.
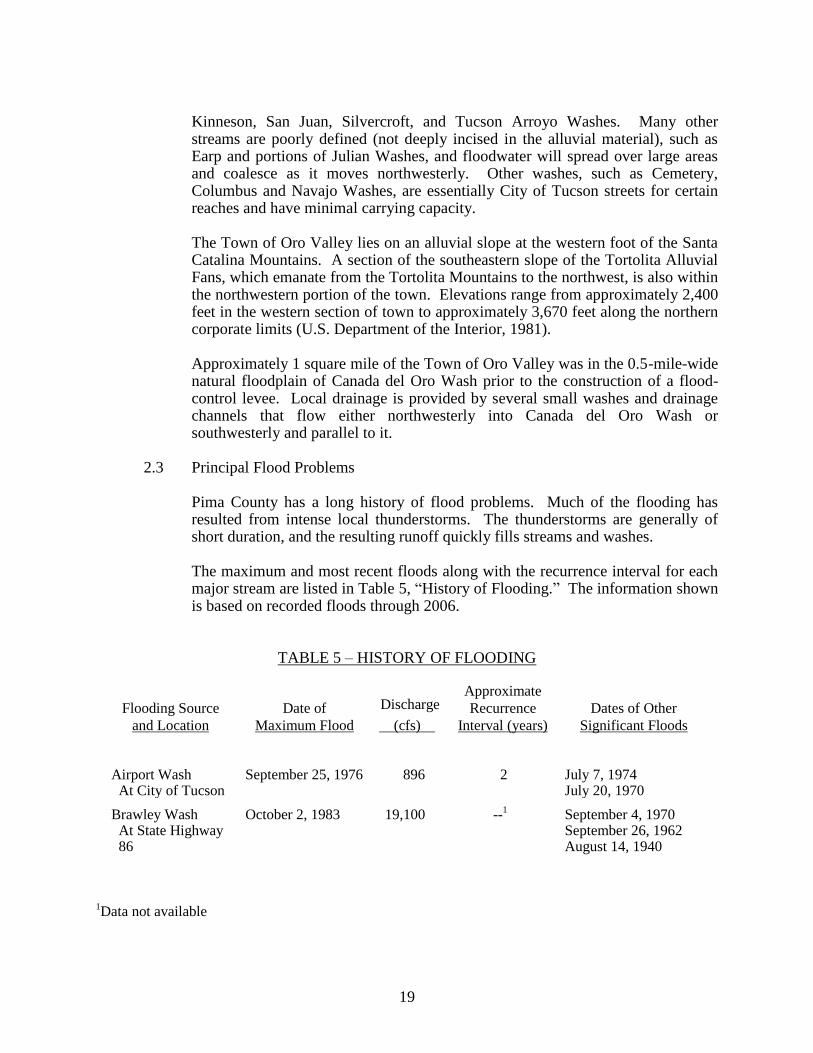
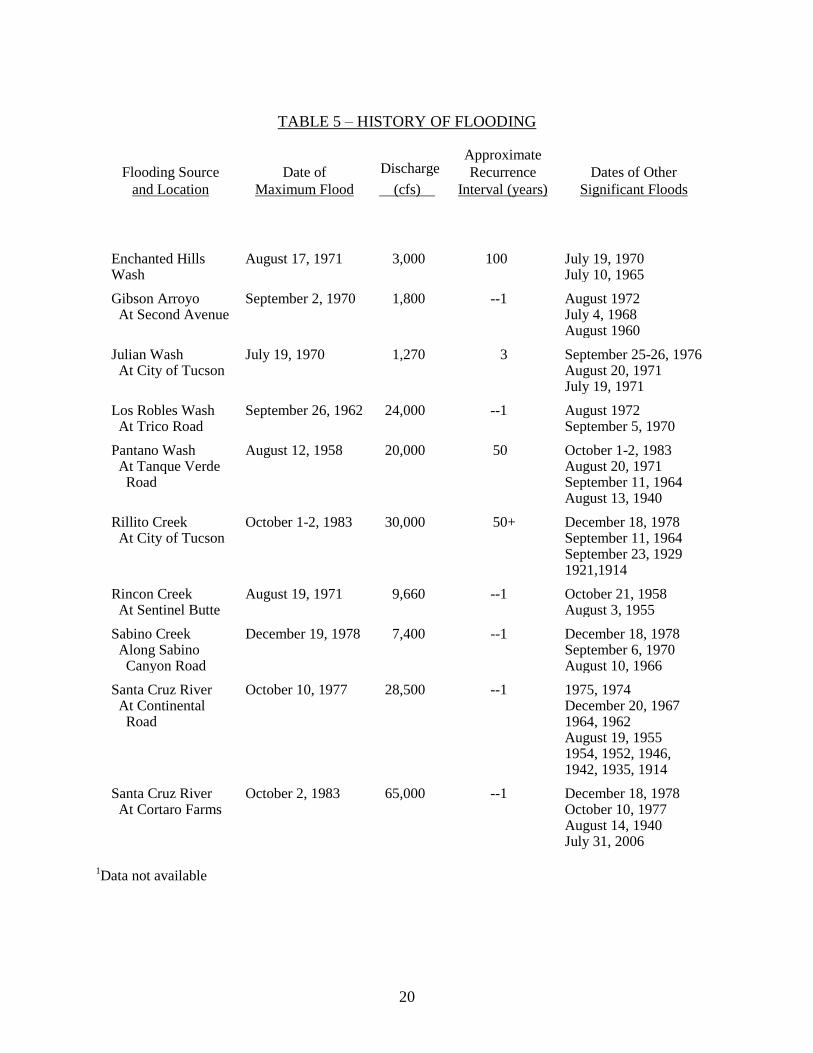
The maximum and most recent floods along with the recurrence interval for each major stream are listed in Table 5, “History of Flooding.” The information shown is based on recorded floods through 2006.
TABLE 5 – HISTORY OF FLOODING
Flooding Source
and Location
Date of
Maximum Flood
Discharge
(cfs)
Approximate
Recurrence
Interval (years)
Dates of Other
Significant Floods
Airport Wash At City of Tucson
September 25, 1976 896 2 July 7, 1974 July 20, 1970
Brawley Wash At State Highway 86
October 2, 1983 19,100 --1 September 4, 1970
September 26, 1962 August 14, 1940
1Data not available
20
TABLE 5 – HISTORY OF FLOODING
Flooding Source
and Location
Date of
Maximum Flood
Discharge
(cfs)
Approximate
Recurrence
Interval (years)
Dates of Other
Significant Floods
Enchanted Hills Wash
August 17, 1971 3,000 100 July 19, 1970 July 10, 1965
Gibson Arroyo At Second Avenue
September 2, 1970 1,800 --1 August 1972 July 4, 1968 August 1960
Julian Wash At City of Tucson
July 19, 1970 1,270 3 September 25-26, 1976 August 20, 1971 July 19, 1971
Los Robles Wash At Trico Road
September 26, 1962 24,000 --1 August 1972 September 5, 1970
Pantano Wash At Tanque Verde Road
August 12, 1958 20,000 50 October 1-2, 1983 August 20, 1971 September 11, 1964 August 13, 1940
Rillito Creek At City of Tucson
October 1-2, 1983 30,000 50+ December 18, 1978 September 11, 1964 September 23, 1929 1921,1914
Rincon Creek At Sentinel Butte
August 19, 1971 9,660 --1 October 21, 1958 August 3, 1955
Sabino Creek Along Sabino Canyon Road
December 19, 1978 7,400 --1 December 18, 1978 September 6, 1970 August 10, 1966
Santa Cruz River At Continental Road
October 10, 1977 28,500 --1 1975, 1974 December 20, 1967 1964, 1962 August 19, 1955 1954, 1952, 1946, 1942, 1935, 1914
Santa Cruz River At Cortaro Farms
October 2, 1983 65,000 --1 December 18, 1978 October 10, 1977 August 14, 1940 July 31, 2006
1Data not available

21
TABLE 5 – HISTORY OF FLOODING - continued
Flooding Source
and Location
Date of
Maximum Flood
Discharge
(cfs)
Approximate
Recurrence
Interval (years)
Dates of Other
Significant Floods
Silvercroft Wash At City of Tucson
July 20, 1970 1,500 25 August 17, 1971 August 1969
Tanque Verde Creek At Sabino Canyon Road
December 22, 1965 12,200 --1 October 2, 1983 December 28, 1978 September 6, 1970 December 30, 1940
Tanque Verde Creek At City of Tucson At City of Tucson
October 1-2, 1983 20,000 50 December 1978 September 6, 1970 December 22, 1965 December 30, 1940
Tucson Arroyo At City of Tucson
August 22, 1961 5,000 40 July 14, 1953 July 24, 1948
West Branch Santa Cruz River At Valencia Road
September 25, 1976 910 2 August 1988 September 25, 1976 August 17, 1971 August 10, 1968
1Data not available
Flow velocities are not hazardous in most of the wide floodplains, but high-velocity flows are common in the streams, washes, and low areas. These flows have caused severe damage to streets and roads and, occasionally, structures. Deaths and vehicle losses have occurred when people tried to use road dip crossings (fords) during these floodflows.
Deposition of sediment and debris on roads and in structures has been a major problem. The muddy floodwater deposits sediment in areas where velocities are generally low, such as large overflow areas or areas between streets.
Pima County has a limited storm-sewer system, and even small rainstorms often cause significant flooding of streets.
An additional flood problem exists because most of the streams in Pima County do not have stable channels. High-velocity or large flows have caused significant scouring of streambanks and streambeds. On larger streams, the channel can wander over the entire floodplain, cutting and filling as it changes course. As an example, flows of 28,500 cubic feet per second (cfs) and 65,000 cfs occurred on the Santa Cruz River in October 1977 and October 1983, respectively, and along Rillito Creek, flows of 16,400 cfs and 29,700 cfs occurred in December 1978 and
22
October 1983, respectively. These flows caused significant bank scouring, up to 500 feet wide, and caused extensive damage to several bridge approaches. Smaller streams with poorly defined or braided channels have flow patterns that can change during one flow event or between one event and the next. There is some danger from scour or deposition in all of the floodplains in Pima County.
In October 1983, the City of Tucson experienced its most devastating floods of record. The largest flood discharges measured included 52,700 cfs on the Santa Cruz River at Congress Street and 29,700 cfs on Rillito Creek near Interstate Highway 10. Other streams that experienced high water were Tanque Verde and Sabino Creeks and Pantano Wash. Erosion and washout of channel banks along these streams were prevalent and presented the predominant threat and damage-producing aspect of the flood to buildings and public improvements. Although this significant flood event was highly visible, its impact on runoff in local washes was nominal. Those streams that experienced the most flooding and erosion drained the larger watersheds, which were more susceptible to peak runoff production from the medium-intensity, regional-type rainfall event that occurred.
Low-lying areas adjacent to the Santa Cruz River along the western limit of the City of Tucson are subject to periodic flooding caused by the overflow of the Santa Cruz River and its tributaries. The flood of October 9 and 10, 1977, was the third largest flood since recording began in 1907. This flood was estimated at approximately a 1-percent-annual-chance flood, with a discharge of 30,000 cfs, at the upstream end of the study reach and attenuated to approximately a 2-percent annual chance flood, with a discharge of 24,000 cfs, at the downstream end. Large areas of floodplain were inundated along most of the study reach. The western approach of the Continental Road bridge and the bridge at El Camino del Cerro were washed out. Floodwater overtopped and eroded many small dikes along the channel and many irrigation canal embankments on the floodplain. Significant bank scour occurred at several channel bends. Overbank flow was separated from the main channel flow by embankments in several areas, such as in the vicinity of Ina Road, 3 miles upstream of Avra Valley Road, at a location 2 miles upstream of Sanders Road, and in the 5-mile reach upstream from Pima Mine Road.
There are many reaches along the Santa Cruz River where there has been scour along one or both banks. Some local improvements may not eliminate the flood problems. Channel changes occurring upstream from any planned development area may affect the distribution of floodflows, the area inundated, and the location of scour or deposition. The floodplain of the Santa Cruz River is subject to damage from inundation and erosion. The river overflows its banks approximately once every 10 years; bank erosion occurs during each flood as the channel of the Santa Cruz River continually changes size and shape in adjustment to the amount of water it carries (U.S. Department of the Interior, 1974). Flooding in Avra Valley can come from two sources. One source is the large contributing drainage area upstream of Avra Valley. Large flows and widespread flooding can result. The other source of flooding would be intense local
23
thunderstorms that could cause runoff from the mountains and foothills that surround the valley. Flooding would be localized and of short duration. During a 1-percent-annual-chance flood, much of the valley will be flooded; however, in the north end of the valley, depths of flooding in most areas will be less than 3 feet.
The Rillito Creek channel has been degrading during the last several years. As a result, water-surface profiles for a specified discharge are lower and overbank flooding is less than previously determined (USACE, 1973). However, during a 1-percent-annual-chance flood, significant overbank flooding will occur along some of Rillito Creek. More than 60 percent of Rillito Creek has been stabilized with soil-cement bank protection. An additional significant problem along Rillito Creek is bank scour, including possible damage to bridge approaches. High flows in December 1978 caused bank scour along Rillito Creek, except a few short reaches and where banks had been protected. Severe bank scour occurred along both banks approximately 4,900 feet downstream of Dodge Boulevard, along the northern bank approximately 4,400 feet upstream of La Canada Drive/Flowing Well Road and approximately 1,600 feet downstream of La Cholla Boulevard, and along the southern bank approximately 1,000 feet upstream of Southern Pacific Railroad.
The Pantano Wash channel, from its mouth to Stella Road, has been degrading. As a result, water-surface profiles are lower and overbank flooding is less for a selected discharge than previously determined (USACE, 1973). Near the mouth, overflow from Pantano Wash or Tanque Verde Creek will inundate a small area of land between the two channels. Upstream from Golf Links Road, gravel operations in and near the channel have changed natural conditions. Landfills on the southwestern bank above Golf Links Road have reduced the channel capacity. The high embankment of the roadway at the Houghton Road Bridge causes backwater that raises the 1-percent-annual-chance flood elevations as far as approximately 2,000 feet upstream.
The floodplain along the entire study reach of Tanque Verde Creek is subject to periodic flooding. As is the case with most of the streams in the area, high-velocity flow in the channel causes bed and bank scour and dangerous dip crossings. In areas of shallow depth or low-velocity flow, deposition of sediment and debris is a major problem.
Enchanted Hills Wash is generally an undeveloped, ephemeral, braided stream from its mouth at Canada del Oro Wash to the Pima-Pinal County limits. A 1-percent-annual-chance flood will virtually inundate the entire floodplain throughout the study reach with generally moderate depths of flow and flow velocities. Localized deep flooding with hazardous flow velocities will, however, occur in the larger channels.
Rincon Creek is generally an undeveloped, ephemeral, braided stream from its mouth at Pantano Wash to approximately 1,000 feet upstream of Old Spanish Trail and from approximately 1,800 feet downstream of Camino Loma Alta Road
24
to approximately 4,600 feet upstream of Old Madrona Canyon Road (X-9 Ranch Road). There is a constructed earthen channel surrounded by cultivated farmland from approximately 1,000 feet upstream of Old Spanish Trail to approximately 1,800 feet downstream of Camino Loma Alta Road. Except for an area along the northern bank of the stream, from approximately 3,640 feet upstream of Old Spanish Trail, a 1-percent-annual-chance flood will inundate the entire floodplain throughout the study reach. There is high ground on the northern bank just upstream of the area approximately 3,640 feet upstream of Old Spanish Trail. If the levee in the northern bank downstream of this area failed during a 1-percent-annual-chance flood, this protected reach would be flooded. During a 1-percent-annual-chance flood, the capacity of Sabino Creek will be exceeded, and flooding will occur along the entire study reach. Bank scour and cutting of new channels are possible during high flow.
The capacity of the West Branch Santa Cruz River channel south of Los Reales Road is less than one-fourth of the magnitude of the 1-percent-annual-chance flood. Most of the floodwater will overtop the eastern bank and will result in shallow flooding. Floodwater leaving the West Branch Santa Cruz River floodplain by spilling over the eastern bank could be replenished south of Los Reales Road by flow from tributary drainage to the Santa Cruz River. All unincorporated land, including the Los Reales Improvement District, between the West Branch Santa Cruz River and the Santa Cruz River, could be inundated by shallow water during a 1-percent-annual-chance flood.
During a large flood, such as a 1-percent-annual-chance flood, floodwater will spread over the entire Agua Caliente Wash floodplain south of Tanque Verde Road in Pima County. The channel will carry only a small percentage of the total discharge. Floodwater overflowing the eastern bank will continue southerly toward Tanque Verde Creek, east of Houghton Road.
The construction of the Kolb Road and Rita Ranch Regional Detention Basins, channel modifications along a tributary to Julian Wash just upstream of Valencia Road from its confluence with Julian Wash to just downstream of the Union Pacific Railroad (UPRR) reduced the discharge downstream. Downstream of Kolb Road, the 1-peercent-annual-chance flood is contained within the Julian Wash channel approximately 850 feet downstream to just downstream of South County Club Road and from approximately 1,600 feet downstream of Littletown Road to just upstream of Kolb Road.
Ventana Canyon and Esperero Canyon Washes are generally undeveloped, ephemeral, braided streams from River Road upstream to the Coronado National Forest boundary. From River Road to its confluence with Tanque Verde Creek, Ventana Canyon Wash is a deep, narrow channel bordered by residential development. A 1-percent-annual-chance flood will virtually inundate the entire floodplain upstream from River Road, although development is generally located outside of the floodplain. The 1-percent-annual-chance flood will be essentially confined to the channel downstream from River Road. Some areas of the

25
floodplain near the mouth are subject to sheet flooding from spillover along River Road. In addition, some areas near the mouth are subject to flooding from Tanque Verde Wash.
Pima Wash is an ephemeral stream that flows southerly from the Santa Catalina Mountains and joins Rillito Creek near Oracle Road. A 1-percent-annual-chance flood will inundate virtually the entire floodplain upstream from Oracle Road. The stream gradient is steep, and flow velocities would be high, making dip crossings dangerous during periods of flow.
The flood of August 1970 on Gibson Arroyo overtopped the north bank at Cedar Street and flooded houses along Arroyo Avenue and Palm Street. Floodwater also overtopped the railroad embankment between Cholla Avenue and Arroyo Avenue, causing shallow flooding east of the railroad embankment. The floodwater then flowed northerly along a swale that was the channel location prior to the railroad construction in 1917. The flood also destroyed the railroad bridge located approximately 900 feet north of Fourth Avenue. When the bridge was rebuilt, a new channel was constructed along the western side of the railroad that joins another small wash. This new channel, called Gibson Arroyo for this study, carries most of the flow. The old channel that flows under the railroad and to the northeast is called Old Gibson Channel for this study. The Airport Wash channel is generally large, and is crossed by 10 bridges. The smaller bridges will cause some backwater during flows as low as the 10-percent annual chance flood. All of the bridges will cause backwater during the 1-percent-annual-chance flood. The area most susceptible to flooding is between Nogales Highway and Park Avenue, south of Bilby Road.
Overflow from Silvercroft Wash caused flooding in several areas on August 18, 1971. There is significant tributary inflow along the middle of downstream portions of the study reach. Large areas of shallow flooding will occur during the 1-percent-annual-chance flood and hazardous velocities may occur along roadways and in low areas. North of Speedway Boulevard this wash is primarily channelized.
Floods occurred along Tucson Arroyo in 1940, 1943, 1948, 1953, 1961, and 1990. Where storm-drain capacities were exceeded, floodwater overtopped the banks of the low-flow channel above Park Avenue and flowed through the streets and around buildings from Park Avenue to St. Marys Road. The underpasses of North Stone, Sixth, and Fourth Avenues and East Broadway Boulevard fill up with water during floods.
Structural damage has been light because flow depths have seldom exceeded 4 feet in the streets; most depths have been less than 3 feet. Flow velocities are high in the streets, but are much lower around buildings. An intense thunderstorm on August 17, 1971, caused a flood in Enchanted Hills Wash, causing a peak discharge of 3,000 cfs (U.S. Department of the Interior,

26
1971). The flood peak was slightly higher than the 1-percent-annual-chance peak discharge used for Enchanted Hills Wash in this study. Upstream of Mission Road, virtually all of the floodwater stayed in the large, manmade channel. According to the Arizona Daily Star, floodwater overtopped Mission Road and damaged pavement as Enchanted Hills Wash flowed out of the channel and spread over land downstream and to the east of Mission Road.
Flowing Wells, Rose Hill, Arcadia, and Alamo Washes are fairly well-defined channels with site-specific channel improvements, ranging from natural channels to manmade, 1-percent-annual-chance capacity, bank-protected channels. In general, these washes and associated road crossings have capacities ranging from 10-percent- to 4-percent-annual-chance flows. Overbank sheet flooding, with depths of flow ranging from 1 to 3 feet, will occur over wide areas during the 1-percent-annual-chance flood.
Robb, Christmas, Hidden Hills, Este, Atterberry, and Kinneson Washes are natural, defined channels, with channel and crossing capacities approaching the 10-percent-annual-chance flood. The 1-percent-annual-chance floodplains are not as wide as for the previously mentioned washes, although flooding depths will range from 2 to 3 feet near the main channel.
Earp, Santa Clara, Naylor, and El Rio Washes are poorly defined and 1-percent-annual-chance floodwater will spread over large areas. Many adjacent areas are developed and experience sheet flooding during frequent flooding events.
Arroyo Chico, High School, and Citation Washes are low-capacity, defined washes that flow through a highly developed portion of the City of Tucson. Many portions of the washes are covered with low-capacity storm-sewer/culvert systems that have been installed to convey nuisance runoff. Resultant 1-percent-annual-chance floodplains are very wide; sheet flooding occurs in and around many residential, commercial, and public buildings.
Navajo, Cemetery, Columbus, and Alvernon Washes are essentially street flows, with minimal flow capacity. The 1-percent-annual-chance floodplains are very wide; in fact, they cross adjacent watershed boundaries. Flow depths range from 1 to 3 feet in the floodplain reach, which consists of residential, single-family developments.
Cholla, San Juan, and Enchanted Hills Washes are tributaries to the West Branch Santa Cruz River. The washes are generally well defined and fairly incised. The 1-percent-annual-chance floodplains are not very wide in most reaches, as overbank topography rises fairly rapidly to contain the flow.
The following are some of the newspaper accounts of floods in the City of Tucson area. Unless indicated otherwise, accounts were printed the day after the cited flood.

27
Flood of December 23, 1914: “About twenty acres of the city farms on the west side of the Santa Cruz River were washed away by recent flood. The land was all in alfalfa and was a very valuable piece of ground being worth at least $400 per acre. . . . At present it is a pile of sand and uprooted trees. . . . uprooted trees and overturned houses are floating downstream. The crest of the flood is expected to reach Tucson late this afternoon. The river had already overflowed its banks . . .” (Tucson Citizen).
Flood of August 11, 1917: “The arroyo north of the city flooded houses
along its banks and threatened to sweep out every bridge across the cut” (Arizona Daily Star).
Flood of September 23, 1929: “City Drenched by Hardest Rains in Recent
Years . . . Along Silverbell Rd. (Silvercroft Wash) cars were halted at the large wash which drains the area in the vicinity of the Tucson rifle range. The wash was 500 feet wide. The Silverbell Highway was covered with water in several places within a distance of 2 miles from St. Mary’s Hospital” (Tucson Citizen).
Flood of August 13, 1940: “Storm Cripples Tucson.” “Damage Runs
High as Electricity Quits and Mud Covers All City” (Tucson Citizen).
Flood of September 24, 1943: “Terrific Rains Leave Trail of Damage” (Tucson Citizen).
Flood of July 24, 1948: “City Mops Up After Flood. Tons of silt and
debris had to be shoveled and swept clear of Tucson’s downtown streets. Acres of land were covered with the muddy waters. Main streets at dips were impassable” (Tucson Citizen).
Flood of July 14, 1953: “Worst Storm in 13 years” (Tucson Citizen).
Flood of August 11, 1958: “Heavy rains to the southeast last night sent a
flash flood roaring down Pantano Wash on the east side” (Tucson Citizen). Flood of September 26, 1962: “Nearly a dozen cars were swept into
washes during the storm, . . . storm runoff closed roads temporarily and flooded yards and patios” (Tucson Citizen).
Flood of August 19, 1971: “Water undermines roads, bridges in Tucson
area.” “. . . runoff water caused extensive damage to county roads and city streets . . . and forced the movement of trailers back from the Rillito River edge” (Arizona Republic, August 19, 1971).
Flood of September 25, 1976: “Nearly a dozen cars were swept into
washes during the storm, . . . closed roads temporarily and flooded yards and patios” (Tucson Citizen, September 28, 1976).
28
Flood of September 28 through October 7, 1983: “Massive Floods Sweep
Area: We’ve Been Hit Everywhere” (Arizona Daily Star, October 2, 1983), “Roaring Rivers Eat Away Bridges” (Tucson Citizen, October 3, 1983).
The streams near the Town of Marana are ephemeral and flow only in response to direct or upstream precipitation and irrigation tailwater. The flow is extremely variable and of short duration. The Santa Cruz River, however, receives its water from the perennial flow of sewage effluent from the sewage-treatment plant near the City of Tucson. As a result, large amounts of brush and other vegetation now grow on what was formerly a clean sand bed. Vegetation has become well rooted in the channel, which can be expected to become overgrown with vegetation. Large amounts of deposition, accompanied by a dense growth of vegetation, may cause the channel to overflow more frequently, thus increasing the flood hazard (U.S. Department of the Interior, 1974). The southern portion of the Tortolita Alluvial Fan basin is sparsely developed, consisting of residential and commercial areas.
The East Embankment of the Union Pacific Railroad (UPRR), which borders the Tortolita Alluvial Fan Area along its western boundary, extends from near Ina Road northerly to the Pima County boundary. The area adjacent to the embankment experiences severe ponding during the 1-percent-annual-chance flood, with depths ranging from 2 to 5 feet, and floodplain widths ranging from approximately 200 to approximately 1,200 feet. Ponding is caused by minimal flow relief under the railroad embankment, as described in a detailed hydrology report (Cella Barr Associates, 1984). Along Julian Wash, approximately one-third of the peak flow for the 1-percent-annual-chance flood leaves the main channel at I-10, approximately 2 miles upstream of the corporate limits of the City of Tucson. This shallow floodwater will inundate an area approximately 600 to 1,400 feet wide north of I-10, until it enters the USACE developed channel.
Because the base flood no longer overtops the Julian Wash channel just upstream of I-10 and flows to the north across the UPRR, the SFHAs shown to north of the UPRR were removed from just upstream of the Tucson Diversion Canal to just downstream of South County Club Road. These areas, previously designated Zone AO, areas of sheet flow on sloping terrain with average depths ranging from 1 foot to 3 feet, now are designated Zone X (shaded)
Flow velocities are not hazardous in most of the wide floodplains, but high velocities have occurred in the streams and washes. Only the flows from the Santa Cruz River have caused significant damage to roads and flood-control structures. Muddy floodwater from the Santa Cruz River has deposited sediment under the Trico-Marana and Sanders Roads bridges, as well as in other areas
29
where floodwater has abruptly slowed as a result of a sudden change from a narrow to wide channel.
Major flooding on the Santa Cruz River in the Town of Marana occurred in October 1977, December 1978, and January 1979. The October 10, 1977, flood produced a discharge of 24,500 cfs at Cortaro Farms Road, as measured by USGS Gage No. 09486500. This discharge is estimated to have a recurrence interval of 35 years. Additional flooding occurred in the Town of Marana in October 1983 which caused changes in the channel geometry caused by bed and bank erosion. The magnitude of the 1983 flood was cause for local city and county flood control agencies to reevaluate the regulatory flood discharges.
Drainage from the Tortolita Mountains north of the Town of Marana flows northwesterly along an embankment constructed for I-10 and the UPRR. The flow continues through several box culverts along I-10 and the railroad embankment, causing shallow flooding into the study area at the point where the drainage joins the Santa Cruz River floodplain.
Flooding south of the Santa Cruz River is the result of runoff from the foothills to the south. Floodwater leaving the foothills collects south of the Santa Cruz River and flows toward Brawley Wash. Although the Brawley Wash channel is approximately 3 miles west of the Town of Marana, overflow during floods extends into the southwestern section of the Town of Marana. Numerous earthen dikes and drainage ditches have been constructed in this area to protect and drain the farmland, but severe floods may cause dike failures, channel overtopping, and shallow flooding over the entire area (U.S. Department of the Interior, 1974).
The major flood hazard to the Town of Oro Valley has been Canada del Oro Wash, which flows through the town following a general west-southwest direction. Canada del Oro Wash is an alluvial channel stream, draining approximately 250 square miles generally north and east of the Town of Oro Valley. The wash empties into the Santa Cruz River approximately 7 miles to the southwest. Upper Canada del Oro Wash drains an area of approximately 140 square miles on the southeastern side of the Santa Catalina Mountains. Its major tributary is Big Wash, which drains approximately 110 square miles on the southeastern side of the Tortolita Mountains. Both washes drain the alluvial plains between the two mountain ranges. Big Wash joins Canada del Oro Wash immediately downstream of U.S. Highway 89/90. All streams in the Town of Oro Valley are ephemeral. Flooding typically occurs after summer thunderstorms. For example, on September 6, 1964, a thunderstorm approximately 5 miles south of the Town of Oro Valley dropped from 3 to 5 inches of rain in 2 to 3 hours. The resulting flooding and waterborne mud and debris badly damaged a housing development and washed out several roads. A peak discharge in excess of 1,000 cfs per square mile of drainage area was measured at three locations (U.S. Department of the Interior, 1970). The remnants of hurricanes moving north from the Gulf of California can cause similar storms in autumn.

30
Flooding may also occur following prolonged, heavy winter rains from large storms moving east from the Pacific Ocean. For example, a storm on December 22 through 23, 1965, dropped from 1.5 to 2.0 inches of rain over a large area near the City of Tucson. Resulting runoff was increased as the result of several previous storms during the month. Accounts of the flooding were found in the Arizona Daily Star and Tucson Citizen. Flow in Rillito Creek, approximately 10 miles south of the Town of Oro Valley, caused over $1 million damage on December 22 through 24, 1965. Very little land was inundated; almost all damage resulted from lateral cutting of the channel. In places, the channel moved laterally 200 feet. The peak discharge in Rillito Creek was 12,400 cfs from a drainage area of approximately 918 square miles. This was not a rare flood, representing approximately a 10-percent-annual-chance recurrence interval event on Rillito Creek. The long duration of flow in this case increased erosion and damage. The same storm caused a peak discharge of 2,290 cfs in Canada del Oro Wash, near the Town of Oro Valley (U.S. Department of the Interior, 1970). No damage reports were available, in part because of the sparse area population at the time, but similar channel migration occurs during flow in Canada del Oro Wash.
At Overton Road approximately 1.75 miles downstream of the Town of Oro Valley, a crest gage recorded the water elevations during the floods of July 21, 1959, and December 20, 1967, on Canada del Oro Wash. These elevations correspond to discharges of 17,000 cfs and 13,900 cfs, respectively, which are both less than the 4-percent annual chance event.
From October 1 through 3, 1983, the City of Tucson area experienced the most devastating floods on record. Although the Santa Cruz River and Rillito Creek both experienced record flood discharges (53,000 cfs and 30,000 cfs, respectively), Canada del Oro Wash only attained a peak discharge of 6,600 cfs, perhaps because the storm that produced the flooding was regional in nature. The Santa Cruz River and Rillito Creek watersheds are substantially larger than the Canada del Oro Wash watershed. Most damage along Canada del Oro Wash during the flood of 1983 occurred approximately 1 to 2 miles downstream of La Canada Drive within the area of the Tucson National Country Club and associated residential developments. During the same flood, an automated gage located 1.5 miles upstream of Golden Dam recorded a discharge of 2,800 cfs (U.S. Department of the Interior, 1989).
2.4 Flood Protection Measures
Small dikes and irrigation canal embankments exist along the Santa Cruz River downstream from the City of Tucson . These irrigation canals have been stabilized with soil-cement embankment protection through Continental Road, the City of Tucson, and Green Valley. Near the unincorporated community of Rillito, the embankment of Tangerine Road and the adjacent irrigation canal provide flood protection to the area north of the channel during a 1-percent-annual-chance flood. The irrigation canal south and west of Rillito did protect the community from flooding during the flood of October 1977; however, flow east of the canal

31
upstream may cause shallow flooding. Provided they are maintained, irrigation canal embankments and small dikes between Cortaro Farms and Avra Valley Roads will protect some of the adjacent fields from shallow flooding.
Upstream from the City of Tucson, short reaches of levees along the channel and irrigation canal embankments provide protection from small floods, but these embankments were overtopped or eroded in several areas during the October 1977 flood. A loose-dirt levee extends along the eastern bank from approximately 300 feet upstream of Pima Mine Road to approximately 1.17 miles upstream of Southern Pacific Railroad. The levee will be breached during a 1-percent-annual-chance flood.
In several areas of the Avra Valley Stream Group, the Continental Road Bridge, and Torres Blanco’s Deviation, reaches have been channelized and earthen embankments have been constructed to protect agricultural land and some houses from flooding. Historically, manmade channels have been overtopped and embankments have failed during major flooding, and they will probably not protect against the 1-percent-annual-chance flood.
Bank stabilization measures using soil-cement bank protection have been constructed on several reaches of Rillito Creek. These include both banks in the vicinity of Swan Road and both banks upstream from Flowing Wells Road.
There is a manmade earthen embankment along the west bank of Rillito Creek, approximately 400 feet to the east of Country Club Road. The embankment was designed to provide 1-percent-annual-chance flood protection for land on the southern and western floodplains. However, this embankment was overtopped by the October 1983 flood, which exceeded the 1-percent-annual-chance recurrence interval. Since then, bank protection and flood walls have been added to this earthen embankment.
Earthen embankments reinforced with soil cement for bank stabilization have been constructed along both banks of Pantano Wash through most of the reach downstream from Golf Links Road to Speedway Boulevard. The embankments protect adjacent land from the 1-percent-annual-chance flood, except as noted in Section 2.3. Dikes or roads near gravel operations afford little protection during the 1-percent-annual-chance flood. There is a small levee on the south bank of Pantano Wash from just upstream of North Craycroft Road to approximately 200 feet downstream of North Craycroft Road. The levee is not sound and has 2 feet of freeboard for the 1-percent-annual-chance flood along the upstream reach. However, it is considered in the hydraulic analysis for the computation of flood elevations.
Along Tanque Verde Creek, a dike has been constructed on the southern bank from approximately 3,800 feet upstream of Sabino Canyon Road to downstream of Sabino Canyon Road. The dike protects an area south of the channel, except for a small area above Sabino Canyon Road.
32
A channel has been excavated in Tanque Verde Creek downstream of Wentworth Road to divert the northern bank overflow to the main channel. The northern bank downstream of Wentworth Road has been terraced and dikes have been constructed to prevent flooding of homes in the residential development. The flood-protection measures extend downstream of Forty-Niner Drive, where water may flow around the dike and cause ponding. The 1-percent-annual-chance flood elevations are computed to be very near the top of the dike, and debris lodging in trees or in channel constrictions may cause sufficient backwater to overtop the dike or cause flow to pass around the upstream end of the dike. A manmade earthen embankment on the northeastern bank of Enchanted Hills Wash just above River Mile (RM) 0.7 trends to the northeast across the floodplain and is nearly perpendicular to flow. The structure may protect land downstream during small floods, but a large flow event, such as the 1-percent-annual-chance flood, may erode or overtop the embankment.
A constructed channel on Rincon Creek from approximately 1,550 feet upstream of Old Spanish Trail to approximately 1,800 feet downstream of Camino Loma Alto Road will not prevent floodplain inundation from even a 10- percent-annual-chance flood, except along a levee on the northern bank from approximately approximately 1,550 feet upstream of Old Spanish Trail to approximately 3,660 feet upstream of Old Spanish Trail. However, the levee is constructed of bulldozed sand and is not considered stable. Along the downstream reach, the levee has 1.0 foot of freeboard.
The Julian Wash channel has been improved along the entire study reach. Downstream of Kolb Road, the base flood is contained within the Julian Wash channel approximately 850 feet downstream to just downstream of South County Club Road and from approximately 1,600 feet downstream of Littletown Road to just upstream of Kolb Road.
Several short sections of excavated channel along Pima Wash provide protection from small to moderate floods. South of River Road, an earthen embankment has been built to protect a housing development west of the Pima Wash. North of River Road and west of Oracle Road, the western bank of the Pima Wash is paved to protect from erosion at a curve. At Deone Lane, a large channel with concrete banks has been constructed along the western side of the floodplain. Near the upstream end, this channel has a right-angle bend. The outside concrete bank is sloped such that it may serve as a ramp to direct high-velocity flow over the bank into a housing development, even though the channel is capable of carrying the 1-percent-annual-chance flood both upstream and downstream of the bend.
On Gibson Arroyo, a rock dike has been constructed along the northern bank at the eastern end of Arroyo Avenue, and a floodwall has been constructed on the northern bank, at Cedar Avenue. Both measures will reduce the overflow on the northern bank east of Cedar Avenue during a 1-percent-annual-chance flood.

33
The railroad embankment at Arroyo Avenue was elevated and protected with rock; however, because of a low section of the railroad, the 1-percent-annual-chance floodwater will spill over the railroad embankment for a short distance downstream.
The Gibson Arroyo channel constructed west of the railroad embankment will carry most of the 1-percent-annual-chance flood and reduce flooding east of the railroad.
Some minor damage to the flood-protection measures discussed above was caused by the October 1983 flood; however, these improvements are still operative. Subsequent to the 1983 flood, several bank-protection and bridge improvements have been constructed along specific reaches of the major washes, such as the Santa Cruz River, Canada del Oro Wash, Rillito Creek, and Pantano Wash.
Some floodflows have been diverted from the West Branch Santa Cruz River east to the Santa Cruz River to prevent flooding via the Midvale Diversion Channel, which is within the City of Tucson. Some floodwater will also be diverted by the Wyoming Diversion Channel. A Pima County floodplain ordinance regulates new development along all streams and washes by requiring channel improvements, increasing channel capacity, limiting encroachments in the floodplain fringe area (limiting water-surface rises to a maximum of 0.1 foot or a velocity increase of 10 percent), and elevating finished first-floor elevations of buildings a minimum of 1.0 foot above the elevation of the regulatory flood. Most of Airport Wash within the City of Tucson has been enlarged and straightened. Channel materials are fairly resistant to erosion, and the increased flow velocity caused by channelization is not a serious problem. The channel is large enough to carry the 1-percent-annual-chance flood, but backwater at bridges will cause road overflow and inundate some areas.
The Silvercroft Wash channel has been improved along most of the study reach. The channel capacity upstream of West Speedway Boulevard is approximately equal to the 1-percent-annual-chance flood discharge. Because of bends in the channel and limited capacity of the culvert under St. Marys Road, some overflow, in the form of shallow flooding, will occur during the 1-percent-annual-chance flood. Downstream of West Speedway Boulevard, tributary inflows increase the 1-percent-annual-chance flood discharge significantly, and the Silvercroft Wash channel will not contain large flows.
Two storm drains were built along Tucson Arroyo before 1936 (City of Tucson Department of Transportation, 1943). The upper drain extends from the eastern side of Park Avenue to the western side of First Avenue and will convey a flow of approximately 2,100 cfs (King, H. W., 1954). The lower drain extends from the southern side of East Tenth Street to the western side of Perry Avenue and will convey a flow of approximately 2,500 cfs (King, H. W., 1954). Both drains have
34
capacities less than the magnitude of the 10-percent-annual-chance flood. Six floods have exceeded the capacities of the storm drains since 1940.
Substantial flood protection to homes between Mission Road and the upstream corporate limits of the City of Tucson is provided by an improved Enchanted Hills Wash channel that is large enough to contain a 1-percent-annual-chance flood. Concrete banks on the outside of two bends protect against bank erosion. East of Mission Road, earth embankments protect fields adjacent to the channel against small floods. During large floods, however, the embankments will be overtopped or eroded as they were during the large flood of August 17, 1971.
Floodflows have been diverted from the West Branch Santa Cruz River at the Irvington Road alignment east to the Santa Cruz River to prevent flooding via the constructed Midvale Diversion Channel. The Wyoming Wash Diversion also reduces floodflows on the West Branch Santa Cruz River Channel. However, the 1-percent-annual-chance flood on the West Branch Santa Cruz River is totally contained by the West Branch Santa Cruz River Channel, which is to be maintained by the Pima County DOTFCD under an agreement with the City of Tucson. A small reach of the West Branch Santa Cruz River located upstream of Ajo Way has been improved to convey the 1-percent-annual-chance floodflow. Some significant flood-protection measures have been completed along the remaining streams studied within the City of Tucson. Some residential and commercial properties located along Arcadia and Alamo Washes, and other streams are not protected from flooding by constructed improvements within portions of the channels that have been designed to convey the 1-percent-annual-chance flood. Concrete bank protection has been provided for some washes near newer developments. Although some portions of the studied stream channels are large enough to contain the 1-percent-annual-chance flood, sharp bends in the channels and limited capacity of culverts and bridges under almost all street crossings result in occasional overflow and overtopping of the channel banks. Therefore, shallow flooding in the overbank areas will occur during the 1-percent-annual-chance flood.
The City of Tucson floodplain ordinances regulate new development along major and minor streams by requiring that channel improvements be made and that the channel capacity be increased and/or that finished floors of buildings be elevated a minimum of 1 foot above the elevation of the 1-percent-annual-chance flood.
Banks have been stabilized south of Tangerine Road and east of Postvale Road along the Santa Cruz River in the Town of Marana to protect the Pima County Landfill, however, the degree of protection has not been determined.
Earthen dikes and drainage ditches used for irrigation have been constructed throughout the Town of Marana. These structures are not capable of providing protection from the 1-percent-annual-chance flood.

35
Lower Santa Cruz River Levee starts near Linda Vista Road alignment and extends downstream to Sanders Road alignment. It is a soil cement levee constructed by PCFCD and provides flood protection for a large portion of the Town of Marana.
Partial flood protection in the Town of Oro Valley is provided by channel improvements and dikes. Channels of many small washes have been straightened and graded into trapezoidal sections.
Canada del Oro Wash is braided and meandering upstream and downstream from the Town of Oro Valley. From La Canada Drive to U.S. Highway 89/80, the channel has been cleaned, straightened, and enlarged. In 1984, a soil-cement embankment was built along the southern bank of this reach as part of the Pima County DOTFCD flood-control project to reduce the risk of damage by large flows. Before construction of this embankment, the only bank protection along Canada del Oro Wash in the Town of Oro Valley consisted of dikes constructed with the gravelly sand removed from the bed. Low flows in the wash had begun to erode vertical cuts in the southern-bank dike. The works were sufficient to contain low flows, such as the 10-percent-annual-chance flood, within the banks, but a large flood would have overtopped the dikes, washed them out, or escaped around their upstream ends into the developed portion of the Town. The 1984 flood-control project included funding assistance and construction of several associated improvements by the State of Arizona and several private parties, as well as local jurisdictions. In general, the flood-control project included flow-collection structures upstream of U.S. Highway 89/80; a new bridge crossing at U.S. Highway 89/80; and the construction of a stabilized, soil-cement levee along the southern bank of Canada del Oro Wash from U.S. Highway 89/80 downstream to La Canada Drive. This stabilized levee meets minimum FEMA requirements with respect to design heights and stability and, thus, has effectively removed most the Town of Oro Valley development from the regulatory floodplain of Canada del Oro Wash. In addition, a bridge constructed at La Canada Drive, with associated upstream spur dikes, has been designed and constructed to convey the design 1-percent-annual-chance flood. The southern spur dike satisfies minimum FEMA levee requirements.
The newly constructed bank protection on the southern bank is sufficient to contain flows up to the 1-percent-annual-chance flood with at least 3 feet of freeboard. The 0.2-percent annual chance flood would also be contained along the southern bank based on the water-surface profiles obtained through this study. However, there is a good chance that a flow of this magnitude would overtop portions of the new southern bank because of the formation of antidunes and floodwaves, allowing some spillover into the developed portion of the Town of Oro Valley. Bank protection has also been constructed on the northern banks for a short distance upstream of La Canada Drive.
36
Bridges were constructed across Canada del Oro Wash at La Canada Drive, First Avenue, and U.S. Highway 89/80 between 1983 and 1985. All of these bridges will convey the 1-percent-annual-chance floodflow.
Flood-protection measures have also been taken on smaller washes within the Town of Oro Valley. Pusch Wash flows though a stabilized channel just east of U.S. Highway 89/80 in El Conquistador Resort. Rooney and Foothills Washes, located east of U.S. Highway 89/80, have been straightened and lined to collect and convey runoff under U.S. Highway 89/80 into Canada del Oro Wash. Small washes entering Canada del Oro Wash from the south are conveyed through the bank protection in lined channels. A soil cement levee has been constructed on Big Wash upstream of Tangerine Road.
3.0 ENGINEERING METHODS For the flooding sources studied in detail in the county, standard hydrologic and hydraulic
study methods were used to determine the flood hazard data required for this FIS. Flood events of a magnitude which are expected to be equaled or exceeded once on the average during any 10-, 50-, 100-, or 500-year period (recurrence interval) have been selected as having special significance for floodplain management and for flood insurance rates. These events, commonly termed the 10-, 50-, 100-, and 500-year floods, have a 10-, 2-, 1-, and 0.2-percent chance, respectively, of being equaled or exceeded during any year. Although the recurrence interval represents the long term average period between floods of a specific magnitude, rare floods could occur at short intervals or even within the same year. The risk of experiencing a rare flood increases when periods greater than 1 year are considered. For example, the risk of having a flood which equals or exceeds the 100-year flood (1-percent chance of annual exceedence) in any 50-year period is approximately 40 percent (4 in 10), and, for any 90-year period, the risk increases to approximately 60 percent (6 in 10). The analyses reported herein reflect flooding potentials based on conditions existing in the county at the time of completion of this FIS. Maps and flood elevations will be amended periodically to reflect future changes.
3.1 Hydrologic Analyses
Hydrologic analyses were carried out to establish the peak discharge-frequency
relationships for the flooding sources studied in detail affecting the county. Precountywide Analyses The hydrologic analyses described in those reports for the communities in Pima
County that had a previously issued FIS have been compiled and are summarized below.
Most of the gaging stations in Pima County have relatively short periods of record. The frequency analyses (U.S. Water Resources Council, 1976 and 1977; Arizona Department of Transportation, 1978) of individual gage records exhibit

37
high variability when selected recurrence interval flows are compared to drainage areas. Because of these factors, a regional analysis was used to determine discharges of the selected recurrence intervals for streams studied as part of the initial study for Pima County.
Floodflow frequency was analyzed at 59 gaged sites in the San Pedro and Santa Cruz River basins using recommended U.S. Water Resources Council methods (U.S. Water Resources Council, 1976 and 1977). Results of these analyses were combined through regional regression analysis. This regional analysis includes major flooding during October 1983, which produced the largest peaks ever recorded at several sites (Arizona Department of Transportation, 1978). By including such a major flood in the analysis, the floodflow-frequency curve for a gaged site may be significantly improved.
Floodflow-frequency data are available from previously published reports (USACE, 1973; USACE, 1975) for all streams except Ventana Canyon, Pima, and Black Washes; Gibson Arroyo; and the Avra Valley Stream Group. The accepted discharges were compared to the regional analysis, and no statistically significant differences were found. Gibson Arroyo is west of the regional analysis area. The analysis of 10 years of gage data using regional skew (U.S. Water Resources Council, 1976 and 1977) agreed well with the regional analysis; therefore, the gage-frequency analysis was used.
Discharges for Sopori Wash were taken from the previously published FIS for the unincorporated areas of Santa Cruz County (U.S. Department of Housing and Urban Development, 1980).
Two areas of high ground, one on each bank of Rillito Creek, divide the 1-percent-annual-chance flood discharge in the area from North Campbell Avenue to approximately 975 feet upstream of North Campbell Road. The North Overbank Diversion, a section of high ground located along the northern channel bank, diverts portions of the 1- and 0.2-percent-annual-chance flood discharges from the main channel. The 10- and 2-percent-annual-chance flood discharges are not large enough to be diverted and therefore were not analyzed for the North Overbank Diversion. The 1-percent-annual-chance flood discharge for the North Overbank Diversion was determined to be 3,000 cfs using the method of energy balance for discharges in the Rillito Creek main channel and the North Overbank Diversion. A section of high ground located along the southern channel bank diverts approximately 2,500 cfs of the 1-percent-annual-chance discharge, thereby inundating the southern overbank area. Two channel improvements help ease the flow.
For various streams studied as part of the FIS for Pima County, a flood-prediction method described in the Pima County DOTFCD publication entitled “Hydrology Manual for Engineering Design and Floodplain Management Within Pima County, Arizona” (Pima County Department of Transportation and Flood Control

38
District, 1979) was used to determine selected recurrence-interval peak discharges. The method essentially uses an empirical equation based on the Rational Formula (U.S. Water Resources Council, 1976 and 1977), incorporating localized streamflow characteristics and watershed parameters.
Ventana Canyon and Esperero Canyon Washes were studied for the initial FIS for Pima County. As part of the updated study for Pima County, upstream reaches of these washes were to be studied by detailed methods beyond the original study limits. However, after determining peak discharges by the local peak estimator method and discussing them with local officials, it was decided that the peak discharge estimates determined for the initial FIS were not acceptable for current conditions. Therefore, at the recommendation of the study contractor, the entire FIS reach of Ventana Canyon Wash was restudied to ensure compatibility and profile concurrence. This recommendation was accepted by Pima County officials and FEMA.
Floodflow-frequency analysis (Arizona Department of Transportation, 1978) of the gage record of Tucson Arroyo gave estimates higher than those from the rural regional regression analysis. Therefore, peak-discharge estimates along Tucson Arroyo were extrapolated from the gage values in proportion to the regional regression analysis. The 1985 restudy of Pima County of the flooding for Pantano and Agua Caliente Washes and Rincon Creek was performed because of the change of the physical characteristics of these streams (channel degradation and aggradation). The 1-percent-annual-chance discharges computed for these streams from the initial study of Pima County were used. The new hydrologic analysis as part of the August 19, 1997, revision for Pima County revised the peak discharge of the Santa Cruz River of the 1-percent-annual-chance flood along the Santa Cruz River above Pima Mine Road from 30,000 to 45,000 cfs. Because of this increase in the 1-percent-annual-chance flood peak discharge, the levee along the east bank of the Santa Cruz River from approximately 200 feet downstream of Pima Mine Road to approximately 1.17 miles upstream of Southern Pacific Railroad was no longer effective in containing the base flood. Therefore, the split-flow analysis for overflow along the east bank of the Santa Cruz River was no longer applicable in the revised hydraulic analysis. The 1-percent-annual-chance peak discharges used in the initial FISs for the City of Tucson and Pima County were developed and used by the USGS in preparing the revised FIS for Pima County dated November 14, 1986. The restudy uses the same 1-percent-annual-chance discharges for Pantano and Agua Caliente Washes. The 1-percent-annual-chance discharges used in this restudy were coordinated with the Pima County DOTFCD; City of Tucson, Floodplain Section; NRCS; Arizona DOT; USGS; USACE; and Arizona DWR. Several comments were received concerning the proposed 1-percent-annual-chance peak discharges from the USACE, NRCS, Pima County, and City of Tucson. After review of these comments, through close coordination with Pima County, and based on FEMA
39
Guidelines and Specifications, it was concluded that the existing 1-percent-annual-chance discharges for Pantano and Agua Caliente Washes are appropriate to be used in the 1986 restudy.
The USGS has operated recording streamflow gaging stations on several streams in the City of Tucson area. Most of these gaging stations have relatively short periods of record. A frequency analysis of these gage records (U.S. Department of the Interior, undated) yields highly variable results when selected-recurrence-interval flows are compared for similar drainage areas. Because of the relatively short periods of record and the high variability of discharge results, the regional analysis method was not used to determine peak discharges.
The City of Tucson has modified the Pima County DOTFCD method for application within the City of Tucson for streams with drainage areas of less than 2 square miles (City of Tucson Department of Transportation, 1982); the unmodified Pima County DOTFCD method was used for streams with watersheds greater than 2 square miles within the City of Tucson.
For the Santa Cruz River, Rillito and Tanque Verde Creeks, and Pantano and Julian Washes, floodflow-frequency data are available from previously published reports (U.S. Department of the Interior, 1970; USACE, 1973; USACE, 1975; USACE, 1962). These accepted discharges were compared to the regional regression analysis, and no statistically significant differences were found. Discharges along Silvercroft Wash were adjusted based on tributary drainage areas. A headwater elevation-discharge relationship was developed for the box culverts under St. Marys Road (U.S. Department of the Interior, Techniques of Water Resources Investigations; U.S. Department of Transportation, 1970).
A regional-frequency analysis was used to estimate 1-percent-annual-chance peak discharges for streams studied by approximate methods.
Flood discharges were statistically analyzed for relationships with basin characteristics such as drainage area, regional skew coefficients, and slope. Using these relationships for the region, selected recurrence-interval discharges were determined for the streams studied.
Discharge values for the Santa Cruz River and Brawley and East Branch Brawley Washes were developed from the regional analysis described earlier. Values along the main stem of the Santa Cruz River were adjusted on the basis of an analysis of gaging records using U.S. Water Resources Council Bulletin No. 17A, “Guidelines for Determining Flood Flow Frequency” (U.S. Water Resources Council, 1976 and 1977). Discharge values along the Santa Cruz River in the Town of Marana reflect estimates determined for a 1974 USGS report (U.S. Department of the Interior, 1974). The 1-percent-annual-chance flood discharge value for East Branch Brawley Wash was taken from a 1978 USGS report (U.S. Department of the Interior, 1978).
For the Tortolita Alluvial Fans and the East Embankment of the SPRR, a flood-prediction method described in “Hydrology Manual for Engineering Design and Floodplain Management Within Pima County, Arizona” (Pima County
40
Department of Transportation and Flood Control District, 1979), developed by the Pima County DOTFCD, was used to determine selected recurrence-interval peak discharges. The method essentially uses an empirical equation based on the Rational Formula (U.S. Department of Agriculture, 1973), which incorporates localized streamflow characteristics and watershed parameters.
The flood-frequency curves for the apices of the alluvial fans south of the Tortolita Mountains were derived in the following way. The 50-, 20-, 10-, 4-, 2-, and 1-percent-annual-chance flood discharges for Cochie Canyon at both the east and west apices and for Unnamed Canyon were determined using the Pima County flood-prediction method. Those flood-frequency data were then fit to a log-Pearson Type III distribution by the method of least squares. The 1-percent-annual-chance flood discharges for Cottonwood, Wild Burro, Ruelas, and Prospect Canyons and Canada Agua Canyon at both the east and west apices were determined using the Pima County flood-prediction method. The 50-, 10-, 4-, and 2-percent annual chance flood discharges for those canyons were taken to be 5, 30, 50, and 70 percent, respectively, of the 1-percent-annual-chance flood discharge. Those flood-frequency data were fit to a log-Pearson Type III distribution by the method of least squares. The 0.2-percent annual chance discharges for the Tortolita Alluvial Fans were determined by fitting lower frequency floods to a log-Pearson Type III distribution (U.S. Water Resources Council, 1976 and 1977).
The 1-percent-annual-chance flood discharges computed along the East Embankment of the SPRR were based on downstream alluvial fan peak discharges from the Tortolita Alluvial Fan Area. Hydrographs were developed for each canyon of the alluvial fan area (including fans both east and west of those studied by detailed methods) using local methods (Pima County Department of Transportation and Flood Control District, 1979) and were then manually routed downstream. Hydrograph timing and travel times were estimated, as well as weir flow over and culvert flow under the railroad embankment, as part of the peak-discharge computations. Since October 1965, the USGS has maintained a recording gage on Canada del Oro Wash at Overton Road 1.75 miles downstream from the Town of Oro Valley. Ten years of flood data were analyzed using a log-Pearson Type III distribution as recommended by the U.S. Water Resources Council (U.S. Water Resources Council, 1976 and 1977). As recommended, a regional skew coefficient of -0.2 was used in the analysis to reduce possible errors caused by the small sample. Discharge values derived using this method for the previous FIS for the Town of Oro Valley were tested and validated by the study contractor for this study using a computer model developed by the NRCS (U.S. Department of Agriculture, 1965). The results of the computer analyses are summarized in “Town of Oro Valley, Arizona, Flood Insurance Study -- Hydrologic Analysis” (Cella Barr Associates, 1985).
Several private firms have estimated the 1-percent-annual-chance flood discharge of Canada del Oro Wash using methods less directly related to its observed behavior. No single estimated value has been used consistently. Therefore, the values given in Table 6, “Summary of Discharges,” based on observed flood data, were used for Canada del Oro Wash in the Town of Oro Valley as represented in

41
a previous FIS and validated by a computer analysis. These values have been coordinated with and accepted by Pima County, the Town of Oro Valley, Federal and State agencies, and interested private firms.
Peak discharges for selected recurrence intervals on Pusch Wash were determined using methodology described in “Hydrology Manual for Engineering Design and Floodplain Management Within Pima County, Arizona” (Pima County Department of Transportation and Flood Control District, 1979), developed by the Pima County DOTFCD.
Floodflow-frequency data for Big Wash are available from previously published reports by the USACE. The accepted discharges were compared to the one determined in a regional analysis, and no statistically significant differences were found. Discharges for a 1-percent-annual-chance storm event for Railroad and Rodeo Washes in the September 30, 1992, revision, to the City of Tucson FIS were computed at concentration points within the Railroad Wash study reach using the Pima County method in conjunction with City of Tucson rainfall values for estimating flood peaks. Discharges for a 1-percent-annual-chance storm event were computed at concentration points within the Rodeo Wash study reach using the City of Tucson method of estimating flood peaks. This method was revised by the City of Tucson and adopted for use on November 1, 1988. As a result of the new hydrologic and hydraulic analyses in the September 30, 1992, revision of Pima County, the 1-percent-annual-chance flood is defined by four drainage paths designated Zone A. Modifications to the 1-percent-annual-chance floodplain boundaries have been made within the North Ranch Subbasin and are shown in the FIRM. The City of Tucson Flood Peak Estimator (City of Tucson Department of Transportation, 1982) revised in 1989 for watersheds up to 10 square miles, which was used to calculate all discharges as part of the February 11, 1993, revision for the City of Tucson. A more detailed, step-by-step discussion with examples can be found in Chapter IV of “Standards Manual for Drainage Design and Floodplain Management in Tucson, Arizona” (City of Tucson, 1990). All drainage areas restudied as part of the February 11, 1993, revision to the City of Tucson FIS were delineated based on 1:2,400-scale, 2-foot contour interval photographic coverage (Cooper Aerial Survey Company, 1982, et cetera). Aerial photos flown in March 1990 were used to incorporate all public and private improvements constructed since the original flight date. Furthermore, plans and reports for public and private flood-control projects were reviewed. Field reconnaissance was completed to verify the accuracy of this work. Hydrologic soil types were taken from a soil survey done by the NRCS. For portions of any watershed that did not fall within the boundaries of the most recent survey, a soil type of 80-percent B and 20-percent D was used.

42
June 16, 2011, Revised Analyses Information on the methods used to determine peak discharge-frequency
relationships for the streams restudied as part of this countywide FIS is shown below.
A detailed drainage study for the area of the Town of Marana affected by
stormwater runoff emanating from Tortolita Mountain Watersheds was conducted in 2009 (CMG, 2009). The total study area is approximately 165 square miles with the HEC-1 study area being approximately 90 square miles and the FLO-2D study area being approximately 75 square miles. The Tortolita Mountain watersheds located within the study limits include: Guild Canyon, Derrio Canyon, Cottonwood Canyon, Cochie Canyon, Wild Burro Canyon, Ruelas Canyon, Prospect Canyon, Canada Agua East, Canada Agua West, and the North Ranch Basin which includes Hardy Wash and Massingale Wash. Streamflow data is not available for any of the Tortolita Mountain watersheds, so historical flows cannot be used to determine or verify modeling results. A HEC-1 hydrologic model was developed for each watershed above the apexes of the alluvial fans, located on the piedmont between the Tortolita Mountain front and the valley floor. The Tortolita Mountain Watershed HEC-1 models are based on hypothetical storm events for the 1-percent-annual-chance recurrence interval, NRCS Type I temporal distribution, 24-hour storm duration. Point rainfall depths were derived from the rainfall intensity-duration-frequency data from NOAA Precipitation-Frequency Atlas 14 of the Western United States. The upper 90% confidence level was used. Aerial reduction factors were used to convert the point rainfall to an equivalent depth of rainfall over each watershed. Rainfall losses were computed using the Natural Resources Conservation Services curve number methodology.
There are four significant man-made features that affect the hydrology of the
watersheds at the top of alluvial fans or study washes. The first, and most significant, is an aqueduct constructed as a part of the Tucson reach of the Central Arizona Canal Project (CAP), which bisects the study watersheds east of I-10. The second feature is the UPRR right-of-way and attendant drainage structures, located immediately east of I-10. The third feature is I-10, which has two or three lanes on each of the west bound or east bound direction. I-10 frontage roads are typically one lane in each direction. The elevations of pavements on I-10 are typically higher than the elevations of their surrounding grounds in the east or west ranging from approximately 2 feet to 20 feet. Culverts and traffic underpasses at I-10 functions to convey runoff from east to west side of I-10. The fourth feature is the presence of agriculture land uses both surrounding and upstream of the project site. The existing topography of the land in the vicinity of the project site has been significantly altered in the past in association with agricultural practices and the construction of irrigation canal. As a result, the surrounding land is extremely flat (generally less than 0.5% slope).
A summary of the drainage area-peak discharge relationships for all the streams
studied by detailed methods is shown in Table 6, "Summary of Discharges."

43
TABLE 6- SUMMARY OF DISCHARGES
FLOODING SOURCE
AND LOCATION
DRAINAGE
AREA
(sq. miles)
PEAK DISCHARGES (cfs)
10-PERCENT 2-PERCENT 1-PERCENT 0.2-PERCENT
“A” WASH
At confluence with Anklam
Wash 0.05 * * 240 *
At Speedway Boulevard 0.1 * * 330 *
AGUA CALIENTE WASH1
Upstream of confluence
with Tanque Verde Creek 40.4 * 6,040 7,180 9,555
Downstream of the divergence * * 7,930 10,540 18,925
of Agua Caliente Spur Flow
Downstream of confluence with * * 9,200 13,000 26,000
Soldier Canyon Creek
Upstream of confluence
with Soldier Canyon Creek 28.6 3,400 8,400 12,000 24,000
AGUA CALIENTE
SPLIT FLOW
At divergence from Agua * * 1,890 3,360 7,080
Caliente Wash
At confluence with Tanque * * 3,160 5,820 16,445
Verde Creek
AGUA CALIENTE SPUR * * 1,270 2,460 7,075
FLOW
At confluence with Agua
Caliente Split Flow
AIRPORT WASH
At confluence with Santa
Cruz River 23.5 2,800 6,200 8,100 11,500
AJO WASH
At confluence with Tanque
Verde Creek 1.91 * * 3,465 *
ALAMO WASH
At Grant Road 5.6 * * 5,000 *
At Wilmot Road 2.9 * * 3,700 *
At Golf Links Road 0.9 * * 1,800 *
ALVERNON WASH
At confluence with Rillito River 3.3 * * 5,310 *
Downstream of Fort Lowell Road 2.97 * * 3,741 *
Upstream of confluence with
Columbus Wash 1.4 * * 2,225 *
At Grant Road 1.0 * * 2,260 *
*Data not available 1Flow reduced due to divergences to Split Flow and Spur Flow reaches

44
ANKLAM WASH
At Silverbell Road 3.0 1,360 3,450 4,500 *
ARCADIA WASH
At Speedway Boulevard 2.26 * * 2,450 *
At Pima Street 2.43 * * 2,566 *
At Grant Road 2.53 * * 2,617 *
At Rosemont Boulevard 1.94 * * 2,587 *
At Craycroft Road 1.39 * * 1,117 *
ARROYO CHICO
At Kino Boulevard 5.6 * * 3,605 *
At Tuscon Boulevard 5.52 * * 1,428 *
At Randolph Way 3.58 * * 312 *
At Alvernon Way 0.7 * * 986 *
ATTERBURY WASH
Upstream of confluence
with Pantano Wash N/A * * 4,200 *
BIG WASH
Upstream of confluence
with Canada del Oro Wash 110.0 5,700 13,500 18,300 31,000
Upstream of confluence
with Honey Bee Wash 89.9 5,200 12,400 16,900 28,000
BLACK WASH
At downstream limit of
detailed study (intersection
of Tucson-Ajo and Old Ajo
Highways, south of Tucson-
Ajo Highway) 48.8 * * 8,872 *
South of Tucson-Ajo
Highway, west of Vahalla
Road 26.4 * * 4,904 *
At the middle of Section 9,
north of Valencia Road and
east of Vahalla Road 24.2 * * 6,703 *
South of Valencia Road, near
Camino Rancho Road 16.8 * * 5,035 *
South of Tucson-Ajo Highway,
east of Vahalla Road 10.2 * * 3,484 *
South of Drexel Road extended,
west of Wade Road 5.1 * * 2,469 *
At intersection of Drexel and
Sheridan Roads 0.8 * * 1,319 *
South of Ajo Highway,
west of Camino Verde Road 2.0 * * 902 *
*Data not available
TABLE 6- SUMMARY OF DISCHARGES - continued
FLOODING SOURCE
AND LOCATION
DRAINAGE
AREA
(sq. miles)
PEAK DISCHARGES (cfs)
10-PERCENT 2-PERCENT 1-PERCENT 0.2-PERCENT
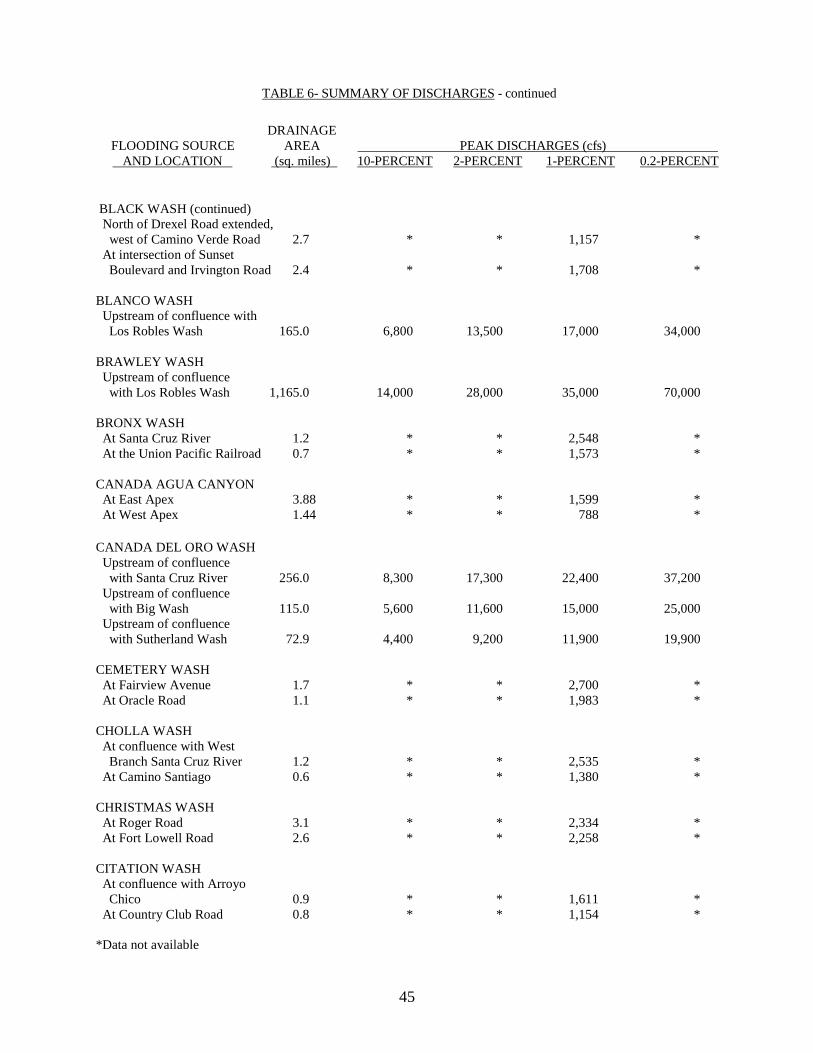
45
BLACK WASH (continued)
North of Drexel Road extended,
west of Camino Verde Road 2.7 * * 1,157 *
At intersection of Sunset
Boulevard and Irvington Road 2.4 * * 1,708 *
BLANCO WASH
Upstream of confluence with
Los Robles Wash 165.0 6,800 13,500 17,000 34,000
BRAWLEY WASH
Upstream of confluence
with Los Robles Wash 1,165.0 14,000 28,000 35,000 70,000
BRONX WASH
At Santa Cruz River 1.2 * * 2,548 *
At the Union Pacific Railroad 0.7 * * 1,573 *
CANADA AGUA CANYON
At East Apex 3.88 * * 1,599 *
At West Apex 1.44 * * 788 *
CANADA DEL ORO WASH
Upstream of confluence
with Santa Cruz River 256.0 8,300 17,300 22,400 37,200
Upstream of confluence
with Big Wash 115.0 5,600 11,600 15,000 25,000
Upstream of confluence
with Sutherland Wash 72.9 4,400 9,200 11,900 19,900
CEMETERY WASH
At Fairview Avenue 1.7 * * 2,700 *
At Oracle Road 1.1 * * 1,983 *
CHOLLA WASH
At confluence with West
Branch Santa Cruz River 1.2 * * 2,535 *
At Camino Santiago 0.6 * * 1,380 *
CHRISTMAS WASH
At Roger Road 3.1 * * 2,334 *
At Fort Lowell Road 2.6 * * 2,258 *
CITATION WASH
At confluence with Arroyo
Chico 0.9 * * 1,611 *
At Country Club Road 0.8 * * 1,154 *
*Data not available
TABLE 6- SUMMARY OF DISCHARGES - continued
FLOODING SOURCE
AND LOCATION
DRAINAGE
AREA
(sq. miles)
PEAK DISCHARGES (cfs)
10-PERCENT 2-PERCENT 1-PERCENT 0.2-PERCENT

46
COLUMBUS WASH
At confluence with 1.71 * * 2,500 *
Alvernon wash
At glenn street 1.55 * * 1,100 *
CITRUS WASH
Approximately 2,500 feet
upstream of Oracle Jaynes
Station Road 0.80 * * 1,562 *
At Oracle Jaynes Station Road 0.80 * * 1,152 *
COCHIE CANYON At East Apex 2.82 * * 1,777 *
COTTONWOOD CANYON At Pinal/Pima County Boundary 10.24 * * 4,225 *
DERRIO CANYON At Pinal/Pima County Boundary 15.98 * * 5,344 *
EARP WASH At confluence with Julian Wash 1.1 * * 1,360 * At Country Club Road 0.8 * * 1,220 *
EAST BRANCH BRAWLEY WASH At Avra Valley Road * * * 21,000 *
EASTERN LIMIT BASIN At upstream limit of detailed study 15.8 * * 4,084 *
EL RIO WASH At Riverview and Dragoon Avenues 1.1 * * 1,084 *
EL VADO WASH Approximately 1,000 feet upstream of 12th Avenue 3.2 * * 974 * At 12th Avenue 2.01 * * 1.174 * At confluence with Santa Cruz River 2.29 * * 1,557 *
ENCHANTED HILLS WASH At confluence with West Branch Santa Cruz River 3.2 * * 4,680 * Approximately 400 feet upstream of Mission Road 3.1 * * 4,775 * At La Cholla Boulevard 3.0 * * 5,045 * Approximately 1,100 feet upstream of Greasewood Road 2.8 * * 5,380 * *Data not available
TABLE 6- SUMMARY OF DISCHARGES - continued
FLOODING SOURCE
AND LOCATION
DRAINAGE
AREA
(sq. miles)
PEAK DISCHARGES (cfs)
10-PERCENT 2-PERCENT 1-PERCENT 0.2-PERCENT

47
TABLE 6- SUMMARY OF DISCHARGES – continued
FLOODING SOURCE
AND LOCATION
DRAINAGE
AREA
(sq. miles)
PEAK DISCHARGES (cfs)
10-PERCENT 2-PERCENT 1-PERCENT 0.2-PERCENT
ESTE WASH At confluence with Tanque Verde Creek 2.5 * * 4,490 * At Speedway Boulevard 1.7 * * 3,308 * At Broadway Boulevard 0.9 * * 1,974 *
FLOWING WELLS WASH At Higgins Lane 6.1 * * 3,013 * GIBSON ARROYO At West Second Avenue 2.2 920 1,850 2,400 4,750 At State Highway 85 1.7 1,560 3,140 3,990 4,200 GREASEWOOD WASH At confluence with Silvercroft Wash 2.12 * * 2,130 * At Ironwood Hills Drive 1.81 * * 2,900 * At Saddle Ranch Drive 0.71 * * 1,304 * GUILD WASH At Union Pacific Railroad and Pinal/Pima County Boundary 8.56 * * 2,100 * HARDY WASH At Hartman Lane 9.52 * * 2,152 * HIDDEN HILLS WASH At confluence with Tanque Verde Creek 2.05 * * 1,909 * Approximately 900 feet downstream of Wrightstown Road 1.24 * * 1,193 * At Broadway Boulevard 0.84 * * 2,850 * HIGH SCHOOL WASH At Second Avenue 1.8 * * 3,195 * At Highland Avenue 1.0 * * 2,098 * At Campbell Avenue 0.7 * * 1,785 * IDLE HOUR WASH
At confluence with Santa
Cruz River 6.6 * * 7,675 *
JULIAN WASH
Approximately 950 feet
upstream of Campbell Avenue 24.9 * * 3,360 *
Just downstream of Wilmot
Road 16.5 * * 2,270 * *Data not available

48
TABLE 6- SUMMARY OF DISCHARGES - continued
FLOODING SOURCE
AND LOCATION
DRAINAGE
AREA
(sq. miles)
PEAK DISCHARGES (cfs)
10-PERCENT 2-PERCENT 1-PERCENT 0.2-PERCENT
KENNISON WASH
At Escalante Road 4.43 * * 2,720 *
At Irvington Road 2.29 * * 1,575 *
LOS ROBLES WASH
Downstream of confluence
with Blanco Wash 1,340.0 14,500 30,000 37,000 74,000
At Trico Road 1,175.0 14,000 28,000 35,000 70,000
MASSINGALE WASH
At Massingale Road and
Union Pacific Railroad 2.51 * * 1,178 *
MIDWAY WASH
At Speedway Boulevard 0.9 * * 1,769 *
NAVAJO WASH
At Oracle Road 3.4 * * 2,1041 *
At Mountain Avenue 3.0 * * 3,081 *
NAYLOR WASH
At Reid Park 1.4 * * 1,806 *
At Belvedere Avenue 0.8 * * 1,150 *
OLD WEST BRANCH SANTA
CRUZ RIVER
At confluence with Ajo Wash 35.5 * * 1,657 *
At confluence with Enchanted
Hills Wash 35.5 * * 3,614 *
At confluence with San Juan
Wash 35.5 * * 5,722 *
OLD WEST BRANCH SANTA
CRUZ RIVER – continued
At confluence with Cholla
Wash 35.5 * * 6,220 *
At confluence with Santa
Cruz River 23.6 * * 6,621 *
PANTANO WASH
Near confluence with Rillito
Creek at Craycroft Road 604.0 8,400 20,000 32,000 64,000
At Houghton Road 570.0 8,100 19,500 31,000 62,000
Upstream of confluence
with Rincon Creek 475.0 7,400 17,500 29,000 58,000
1Flow reduced due to the existence of storm sewers that intercept a portion of the runoff
*Data not available
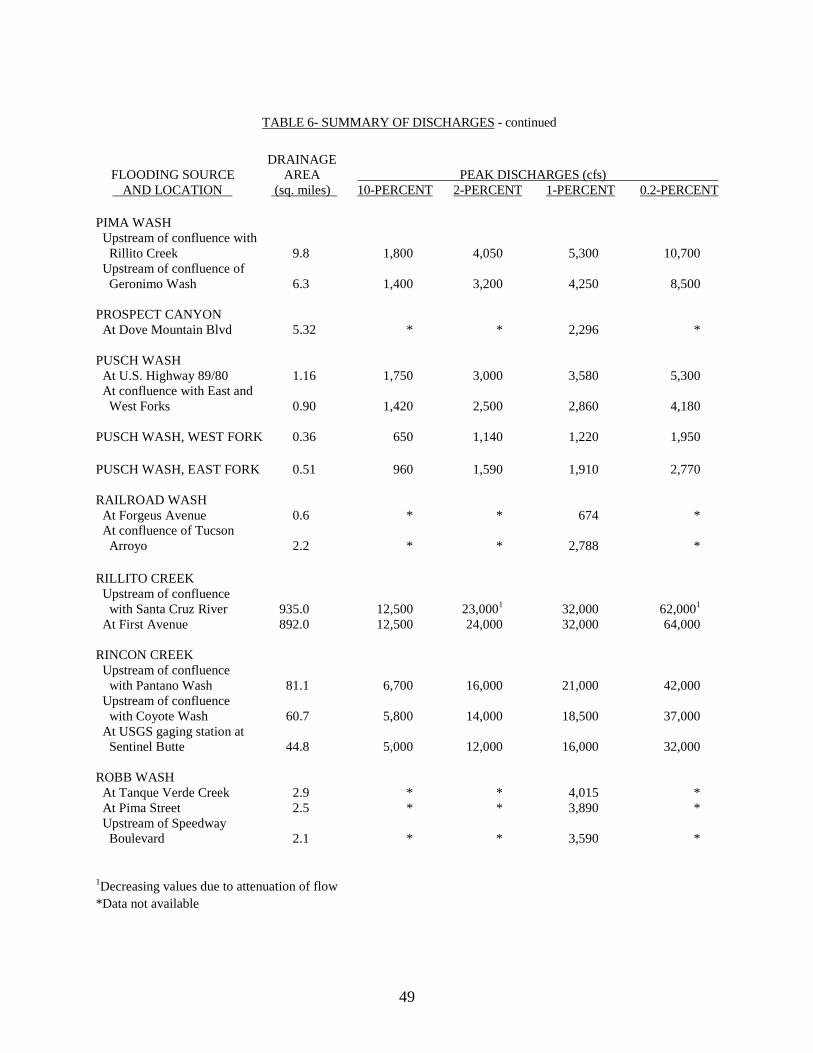
49
TABLE 6- SUMMARY OF DISCHARGES - continued
FLOODING SOURCE
AND LOCATION
DRAINAGE
AREA
(sq. miles)
PEAK DISCHARGES (cfs)
10-PERCENT 2-PERCENT 1-PERCENT 0.2-PERCENT
PIMA WASH
Upstream of confluence with
Rillito Creek 9.8 1,800 4,050 5,300 10,700
Upstream of confluence of
Geronimo Wash 6.3 1,400 3,200 4,250 8,500
PROSPECT CANYON
At Dove Mountain Blvd 5.32 * * 2,296 *
PUSCH WASH
At U.S. Highway 89/80 1.16 1,750 3,000 3,580 5,300
At confluence with East and
West Forks 0.90 1,420 2,500 2,860 4,180
PUSCH WASH, WEST FORK 0.36 650 1,140 1,220 1,950
PUSCH WASH, EAST FORK 0.51 960 1,590 1,910 2,770
RAILROAD WASH
At Forgeus Avenue 0.6 * * 674 *
At confluence of Tucson
Arroyo 2.2 * * 2,788 *
RILLITO CREEK
Upstream of confluence
with Santa Cruz River 935.0 12,500 23,0001 32,000 62,000
1
At First Avenue 892.0 12,500 24,000 32,000 64,000
RINCON CREEK
Upstream of confluence
with Pantano Wash 81.1 6,700 16,000 21,000 42,000
Upstream of confluence
with Coyote Wash 60.7 5,800 14,000 18,500 37,000
At USGS gaging station at
Sentinel Butte 44.8 5,000 12,000 16,000 32,000
ROBB WASH
At Tanque Verde Creek 2.9 * * 4,015 *
At Pima Street 2.5 * * 3,890 *
Upstream of Speedway
Boulevard 2.1 * * 3,590 *
1Decreasing values due to attenuation of flow
*Data not available
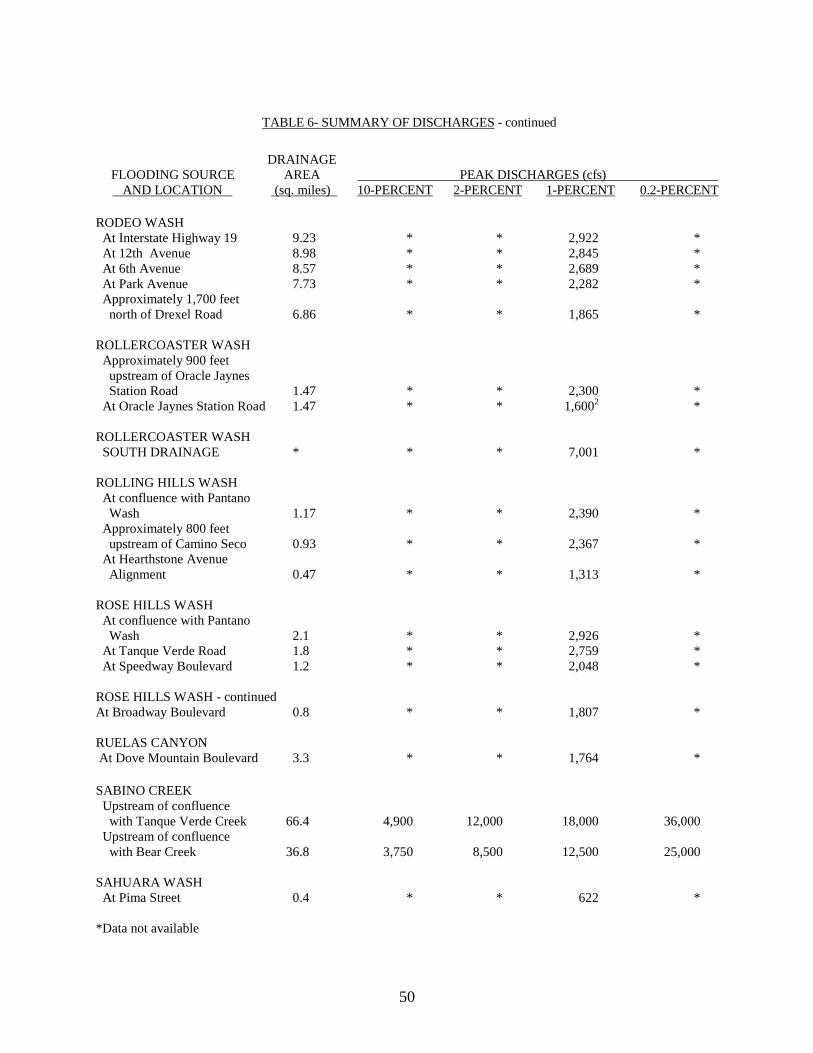
50
TABLE 6- SUMMARY OF DISCHARGES - continued
FLOODING SOURCE
AND LOCATION
DRAINAGE
AREA
(sq. miles)
PEAK DISCHARGES (cfs)
10-PERCENT 2-PERCENT 1-PERCENT 0.2-PERCENT
RODEO WASH
At Interstate Highway 19 9.23 * * 2,922 *
At 12th Avenue 8.98 * * 2,845 *
At 6th Avenue 8.57 * * 2,689 *
At Park Avenue 7.73 * * 2,282 *
Approximately 1,700 feet
north of Drexel Road 6.86 * * 1,865 *
ROLLERCOASTER WASH
Approximately 900 feet
upstream of Oracle Jaynes
Station Road 1.47 * * 2,300 *
At Oracle Jaynes Station Road 1.47 * * 1,6002 *
ROLLERCOASTER WASH
SOUTH DRAINAGE * * * 7,001 *
ROLLING HILLS WASH
At confluence with Pantano
Wash 1.17 * * 2,390 *
Approximately 800 feet
upstream of Camino Seco 0.93 * * 2,367 *
At Hearthstone Avenue
Alignment 0.47 * * 1,313 *
ROSE HILLS WASH
At confluence with Pantano
Wash 2.1 * * 2,926 *
At Tanque Verde Road 1.8 * * 2,759 *
At Speedway Boulevard 1.2 * * 2,048 *
ROSE HILLS WASH - continued
At Broadway Boulevard 0.8 * * 1,807 *
RUELAS CANYON
At Dove Mountain Boulevard 3.3 * * 1,764 *
SABINO CREEK
Upstream of confluence
with Tanque Verde Creek 66.4 4,900 12,000 18,000 36,000
Upstream of confluence
with Bear Creek 36.8 3,750 8,500 12,500 25,000
SAHUARA WASH
At Pima Street 0.4 * * 622 *
*Data not available

51
TABLE 6- SUMMARY OF DISCHARGES - continued
FLOODING SOURCE
AND LOCATION
DRAINAGE
AREA
(sq. miles)
PEAK DISCHARGES (cfs)
10-PERCENT 2-PERCENT 1-PERCENT 0.2-PERCENT
SAN JUAN WASH
At La Cholla Boulevard 0.82 * * 2,091 *
At confluence with West
Branch Santa Cruz River 1.14 * * 1,757 *
SANTA CLARA WASH
At 12th Avenue 0.20 * * 206 *
At Interstate Highway 19 0.39 * * 338 *
SANTA CRUZ RIVER
At Cortaro Road 3,503 21,800 48,000 70,000 107,400
Upstream of confluence
with Canada del Oro Wash 3,232 21,800 48,000 70,000 107,400
Upstream of confluence
with Rillito Creek 2,282 16,800 41,000 60,000 93,000
At Congress Street 2,222 16,800 41,000 60,000 93,000
At Drexel Road 2,101 16,800 41,000 60,000 93,000
At Continental Road 1,662 * * 45,000 *
SILVERCROFT WASH
At confluence with Santa
Cruz River 13.24 3,500 7,500 9,700 16,100
At Grant Road 8.70 1,700 3,800 5,200 10,000
At Speedway Boulevard 2.84 910 2,050 2,750 5,500
SOPORI WASH
At U.S. Highway 89 164.0 6,770 14,300 19,900 47,860
At upstream limit of
detailed study 110.0 6,120 12,960 18,000 43,200
TANQUE VERDE CREEK
Upstream of confluence
with Rillito Creek 241.0 10,500 24,000 34,000 68,000
Upstream of confluence of
Sabino Creek 149.0 8,700 20,000 28,000 56,000
Near confluence with Agua
Caliente Wash 99.6 7,300 17,500 23,000 46,000
Upstream of confluence of
Canyon del Salto Creek 43.1 5,000 12,500 16,000 32,000
TUCSON ARROYO
Near confluence with Santa
Cruz River, at I-10 11.35 2,896 5,398 6,773 15,900
At Perry Avenue (storm drain) 11.07 2,819 5,295 6,663 15,500
At Tenth Street 8.93 2,568 4,954 6,295 14,200
At Park Avenue 8.67 2,501 4,859 5,363 *
*Data not available
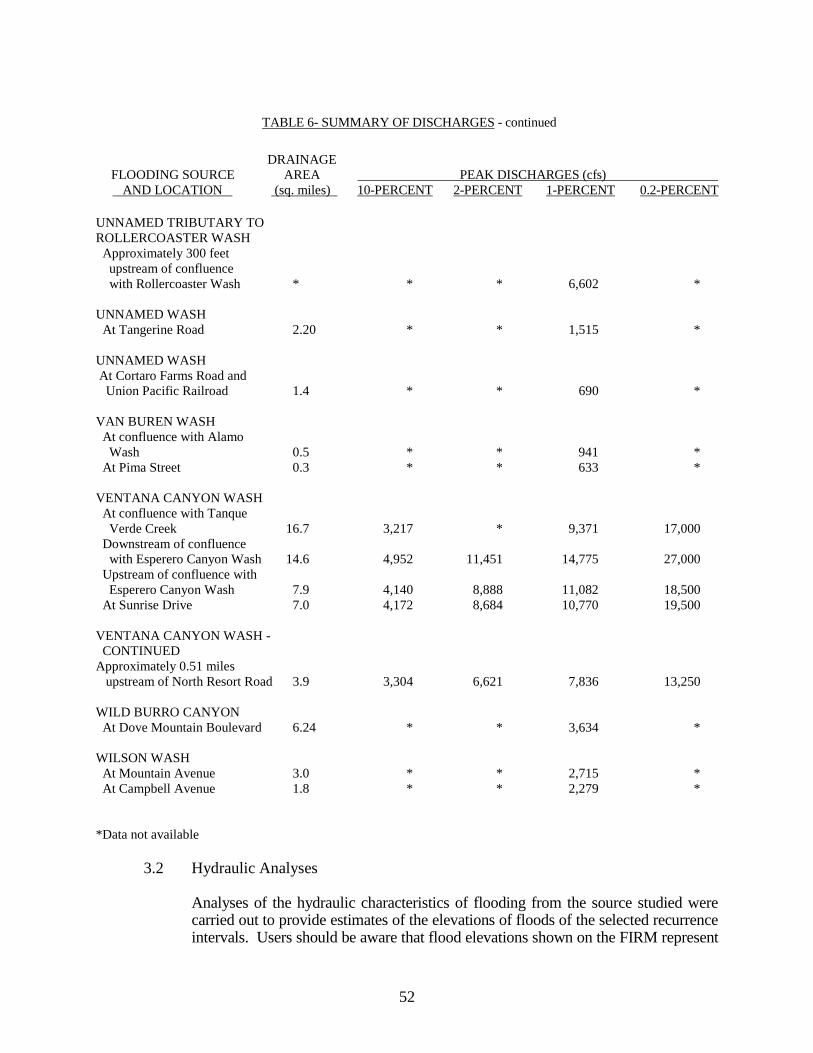
52
TABLE 6- SUMMARY OF DISCHARGES - continued
FLOODING SOURCE
AND LOCATION
DRAINAGE
AREA
(sq. miles)
PEAK DISCHARGES (cfs)
10-PERCENT 2-PERCENT 1-PERCENT 0.2-PERCENT
UNNAMED TRIBUTARY TO
ROLLERCOASTER WASH
Approximately 300 feet
upstream of confluence
with Rollercoaster Wash * * * 6,602 *
UNNAMED WASH
At Tangerine Road 2.20 * * 1,515 *
UNNAMED WASH
At Cortaro Farms Road and
Union Pacific Railroad 1.4 * * 690 *
VAN BUREN WASH
At confluence with Alamo
Wash 0.5 * * 941 *
At Pima Street 0.3 * * 633 *
VENTANA CANYON WASH
At confluence with Tanque
Verde Creek 16.7 3,217 * 9,371 17,000
Downstream of confluence
with Esperero Canyon Wash 14.6 4,952 11,451 14,775 27,000
Upstream of confluence with
Esperero Canyon Wash 7.9 4,140 8,888 11,082 18,500
At Sunrise Drive 7.0 4,172 8,684 10,770 19,500
VENTANA CANYON WASH -
CONTINUED
Approximately 0.51 miles
upstream of North Resort Road 3.9 3,304 6,621 7,836 13,250
WILD BURRO CANYON
At Dove Mountain Boulevard 6.24 * * 3,634 *
WILSON WASH
At Mountain Avenue 3.0 * * 2,715 *
At Campbell Avenue 1.8 * * 2,279 *
*Data not available
3.2 Hydraulic Analyses
Analyses of the hydraulic characteristics of flooding from the source studied were carried out to provide estimates of the elevations of floods of the selected recurrence intervals. Users should be aware that flood elevations shown on the FIRM represent
53
rounded whole-foot elevations and may not exactly reflect the elevations shown on the Flood Profiles or in the Floodway Data tables in the FIS report. For construction and/or floodplain management purposes, users are encouraged to use the flood elevation data presented in this FIS in conjunction with the data shown on the FIRM.
Cross sections were determined from topographic maps and field surveys. All
bridges, dams, and culverts were field surveyed to obtain elevation data and structural geometry. All topographic mapping used to determine cross sections is referenced in Section 4.1.
Locations of selected cross sections used in the hydraulic analyses are shown on the
Flood Profiles (Exhibit 1). For stream segments for which a floodway was computed (Section 4.2), selected cross section locations are also shown on the FIRM (Exhibit 2).
The hydraulic analyses for this FIS were based on unobstructed flow. The flood
elevations shown on the profiles are thus considered valid only if hydraulic structures remain unobstructed, operate properly, and do not fail.
Precountywide Analyses
The hydraulic analyses described in those reports for the communities in Pima
County that had a previously issued FIS, have been compiled and are summarized below.
Water-surface elevations for the following streams were determined using the USACE HEC-2 computer program (USACE, 1976) in the initial study of Piam County: the first 5.63 miles of Agua Caliente Wash; Canada del Oro Wash, from 4.8 miles upstream of its mouth to 10 miles upstream of its mouth; East Embankment of the SPRR; Esperero Wash; Pantano Wash, from its mouth to approximately 1.27 miles upstream of Colossal Cave Road; Pusch Wash; Rillito Creek; Rillito Creek North Overbank Diversion; the first 7.25 miles of Rincon Creek; Tanque Verde Creek; and Ventana Canyon Wash.
Water-surface elevations for most of the remaining streams studied by detailed methods in Pima County were determined using the USGS E-431 and J-635 computer programs (U.S. Department of the Interior, 1976).
Water-surface elevations for Sopori Wash and its divergent flow along U.S. Highway 89 were taken from the effective FIS for the unincorporated areas of Santa Cruz County (U.S. Department of Housing and Urban Development, 1980). Water-surface elevations for Alamo Wash were derived from previously published reports (Buchanan-Collins-Johnson and Associates, Inc., May 1981; Buchanan-Collins-Johnson and Associates, Inc., August 1981)). Weir-flow calculations were performed at selected cross sections to account for flow transfer from the main channel to the overbank; however, for the 1988 updated study,

54
water-surface elevations were based on calculations involving an additional weir-flow calculation not included in the original report.
For Robb, Alvernon, Christmas, Rose Hill, and Alamo Washes and the East Embankment of the UPRR in the Tortolita Fan Area, only 1-percent-annual-chance flood elevations were determined.
Only the 1-percent-annual-chance flood profiles were determined for Pantano and Agua Caliente Washes and Rincon Creek in the 1985 updated study of Pima County.
Many computed floodflow velocities were high because of fairly steep channel slopes and the low roughness coefficients for most of the streams. In some reaches, the velocities were high and the computed depths were low. This flow condition is hydraulically classified as supercritical. Supercritical flows have inherently unstable flow elevations. Small changes in channel geometry or other hydraulic conditions may cause the flow to abruptly change (through a hydraulic jump) to subcritical flow, with lower velocities and greater depths (equal energy). Flood elevations at cross sections where supercritical flow was indicated were adjusted to the corresponding elevations for subcritical flow.
Along several reaches on the Santa Cruz River, overflow was separated from the main channel flow and additional analyses were performed. Upstream of the City of Tucson, along an approximate 1-mile reach upstream of the SPRR bridge, a portion of the floodwater from floods greater than the 10-percent-annual-chance flood will separate from the channel and flow along the east floodplain. During the floods of October 1977 and October 1983, levees along the eastern bank were overtopped and eroded. The overflow on the eastern floodplain was separated from the main channel flow by embankments downstream of the SPRR bridge. Because of dynamic hydraulic conditions, there is uncertainty about whether flood events of the same magnitude would cause similar flooding patterns and water-surface elevations. Only 10-, 1-, and 0.2-percent-annual-chance elevations are shown in the flood profiles for Pima Mine Road upstream to approximately 1.17 miles upstream of SPRR. These profiles are for the main channel and west-bank-overflow areas. The 0.2-percent-annual-chance flood elevations for the east bank overflow are shown on a separate profile. Downstream from Pima Mine Road, the main channel is within the Papago Indian Reservation and shallow flooding designations were used for the east floodplain based on a field survey of the October 1977 flood. Because the levee along the Santa Cruz River between approximately 300 feet upstream of Pima Mine Road and approximately 1.17 miles upstream of SPRR will be breached during a 1-percent-annual-chance flood, an additional hydraulic analysis was performed to determine the 1-percent-annual-chance flood elevations. This analysis was performed with the levee removed. The flood elevations were determined using the USGS J-635 computer program (U.S. Department of the Interior, 1976). At the SPRR Spur embankment forces a flow of approximately 16,500 cfs to the east over Sahuarita Road. The conveyance

55
distribution for the full discharge at Cross Section CA (approximately 0.78 miles downstream of Aria Valley Road) was used to determine the amount of flow in the right overbank, all of which was assumed to flow around the railroad embankment. A rating curve was developed using the embankment section (east of the railroad crossing) at Sahuarita Road as a controlling weir. Elevations for the breakout analysis upstream of the control were determined using the USGS J-635 computer program (U.S. Department of the Interior, 1976), and the breakout discharge was adopted. The flood elevations obtained converged with those computed for the remaining flow in the main channel and west overbank, thereby confirming the assumption that the entire east-bank overflow at Cross Section CA (approximately 0.78 miles downstream of Aria Valley Road) will flow around the railroad embankment.
For the segment of the Santa Cruz River in which the hydraulic analysis did not include the levee, flood profiles were drawn showing the 1-percent-annual-chance elevation and have been labeled “without consideration of levee.” From approximately 1.17 miles upstream of SPRR to approximately 1,490 feet downstream of Continental Road, normal step-backwater computations were used. From approximately 1,490 feet downstream of Continental Road to approximately 2.12 miles upstream of Old Continental Road, floodflow is divided between the main channel and west overflow channel. The flow is separated, and some west-overflow-channel water spills to the floodplain between the two channels. Hydraulic conditions are similar to those just upstream of Pima Mine Road. Separate profiles for the 10- and 1-percent-annual-chance floods are shown for the west overflow channel. Flood profiles for the main channel also represent water-surface elevations to be different than those computed in the floodplain between the two channels. From approximately 2.12 miles upstream of Old Continental Road upstream to the Pima-Santa Cruz County line, a normal step-backwater analysis was made.
The hydraulic analyses for the 1985 restudy of Pantano Wash indicate that the 1-percent-annual-chance water-surface elevation for this wash is generally lower when compared with the previous FIS for Pima County, except at the Houghton Road Bridge. The lower water surface is due to channelization and bank protection of portions of Pantano Wash between Craycroft Road and Golf Links Road, and channel-bed degradation of the study reach. Accordingly, the new floodway for Pantano Wash was been revised and reduced in width in several areas. The rise in water-surface elevation at the Houghton Road Bridge is due to the construction of a new bridge over Pantano Wash. Backwater caused by the high road embankment raises the 1-percent-annual-chance flood elevation along an approximate 2,000-foot reach upstream. This rise in the 1-percent-annual-chance water-surface elevation is approximately 4 feet higher when compared with the previous FIS for Pima County.
The water-surface elevation for Pantano Wash for a reach of approximately 0.5-mile upstream of Craycroft Road was found to be controlled by the natural high ground on the right overbank between Pantano Wash and Tanque Verde Creek.

56
The high ground in the left channel bank just upstream of the Craycroft Road Bridge causes separation of the channel and left-overbank flow. This high ground was treated as a levee. An additional hydraulic analysis was performed to artificially remove the high ground. Separate 1-percent-annual-chance profiles were drawn for both conditions and are labeled on the profile sheets as “with and without consideration of levee.”
Several gravel pits are located adjacent to the Pantano Wash channel. These gravel pits are separated from the main channel by manmade dikes or natural high ground. In this analysis, it was assumed that these dikes may breach during the 1-percent-annual-chance storm event and cause flooding of the gravel pits. However, in this analysis these gravel pits have been assumed to be ineffective flow areas. These areas are labeled Zone A.
The hydraulic analysis for the restudy of Agua Caliente Wash during the 1985 restudy indicated that the 1-percent-annual-chance water-surface elevations are generally higher when compared with the previous FIS for Pima County. The higher water-surface elevation is primarily due to stream bed “aggradation.” The floodplain limits closely match the previous FIS; however, the new floodway of Agua Caliente Wash is generally wider than the previous floodway configuration. The high ground in the right channel bank of Rincon Creek upstream of Old Spanish Trail causes separation of the channel and right overbank flow. This high ground was treated as a levee. Because this levee is not stable, an additional hydraulic analysis was performed to include the levee in the natural 1-percent-annual-chance profile. A separate 1-percent-annual-chance profile was drawn and is labeled as “with consideration of levee.” The floodway analysis does not include the levee. To satisfy profile concurrence at the upstream end of the restudy, three cross sections from the original FIS were obtained and incorporated in this restudy.
The resultant 1-percent-annual-chance water-surface and channel-bed elevations were compared with the original FIS for Pima County for Rincon Creek. The comparison indicated that the 1-percent-annual-chance water-surface and channel-bed elevations do not match with the previous study, except at the dip section at Old Spanish Trail. The differences in the 1-percent-annual-chance water-surface and channel-bed elevations are not uniform along the study reach. In general, the 1-percent-annual-chance water-surface elevations of the restudy are lower when compared with the original study. The difference in channel-bed elevations between the two studies varies along the study reach. The lower reach (Pantano Wash to Old Spanish Trail) and the upper reach (upstream of Camino Loma Alta) of the 1985 restudy exhibit lower channel-bed elevations, while the middle reach (between Old Spanish Trail and Camino Loma Alta) exhibits higher channel-bed elevations when compared with the previous study. There is a difference of approximately 6 feet (maximum) in the 1-percent-annual-chance water-surface elevation and approximately 10 feet (maximum) in channel-bed elevation between the two studies. The cause is streambed degradation and aggradation revealed by the use of a more recent topographic map (Cooper Aerial
57
Survey Company, 1982, et cetera). Cross-section data for the backwater analyses were digitized by Cooper Aerial Survey Company in early 1987. Topographic mapping of the study area, at a scale of 1:2,400, with a contour interval of 2 feet, was generated for the 1987 restudy (Cooper Aerial Survey Company, 1982, et cetera).
There is a dike along the northwestern side of Canada del Oro Wash north of Magee Road. The 1-percent-annual-chance flood elevation is up to 1 foot above the top of the dike at the housing area along Magee Road. A continuous line of patio walls on the dike will block most overflow; therefore, the 1-percent-annual-chance floodplain limit was established along these walls. Gates and other openings in the wall will allow some flooding around homes, but it is estimated that depths will be less than 1 foot.
Data used for the detailed analysis of Tanque Verde and Sabino Creeks and Agua Caliente Wash were taken from a 1975 USACE Flood Plain Information report (USACE, 1975). The 1-percent-annual-chance flood profile is the same as presented in the earlier report, except for short reaches where channel changes have occurred. Cross-section data were updated in these areas.
Step-backwater computations were used to determine water-surface elevations of the main channel flow on Julian Wash from the upstream limit of detailed study to the Interstate Highway 10 bridge. Just upstream of the Interstate Highway 10 bridge, approximately one-third (2,500 cfs) of the 1-percent-annual-chance flood discharge overtops the northern bank and flows northwesterly as sheetflow. Water-surface elevations were then computed for the remaining discharge, 6,000 cfs, which passes under I-10. Water-surface elevations were computed for Julian Wash upstream from the flood-control channel. The 10-, 2-, 1- and 0.2-percent-annual-chance floods are contained within the banks of the flood-control channel; therefore, no profiles have been shown in this study. On Gibson Arroyo, the 1- and 0.2-percent annual chance floods will overtop the railroad embankment from Arroyo Avenue downstream to West Second Avenue. The overflow will cause shallow flooding in a residential area as it flows easterly and then northerly along a swale. Downstream of West Second Avenue, the 1- and 0.2-percent-annual-chance flood elevations are the same for the Gibson Arroyo channel. The 10- and 2-percent-annual-chance floods do not overtop the railroad embankment. Division of flow between the two channels at the bridge approximately 800 feet downstream from Fourth Avenue was based on elevation-discharge ratings developed for the two channels.
Ten bridges have a major influence on flood elevations on Airport Wash. Only the bridges at I-19 are adequate to carry the 1-percent-annual-chance flood. During the 1-percent-annual-chance flood, backwater at all other bridges is sufficient to overtop the road.
For all recurrence intervals on Silvercroft Wash, flooding up to approximately 0.88 miles downstream of West Grant Road is influenced by flooding from the

58
Santa Cruz River. From approximately 0.88 mile downstream of West Grant Road to approximately 0.79 mile downstream of West Grant Road, discharges are lost to the Santa Cruz River for all recurrence intervals.
Water-surface elevations for Tucson Arroyo were based on historic data. Historic flood-inundation maps, profiles, high-water elevations, and survey notes were obtained from the City of Tucson (City of Tucson, 1943).
To reflect urban development, cross-section modifications were determined from aerial photographs (Kucera and Associates, Inc., 1976; Cooper Aerial Survey Company, 1974; U.S. Department of Agriculture, 1936).
Downstream from Main Street, in the City of Tucson, profiles for Tucson Arroyo were not determined because floodflows become hydraulically separated. The capacities of the two storm drains were determined using pipe-flow formulas (King, H. W., 1954).
The 1-percent-annual-chance flood elevations for the streams studied by detailed shallow-flooding methods for this updated study were determined using the USACE HEC-2 computer program for the computation of water-surface profiles (USACE, 1976). To simulate the character of stream channels and their adjacent overbanks, cross sections were compiled using topographic maps at a scale of 1:2,400, with a contour interval of 2 feet (Cooper Aerial Survey Company, 1982, et cetera).
Cross-section data for Pima and Ventana Canyon Washes, Gibson Arroyo, and a portion of the Santa Cruz River were obtained from ground surveys and topographic maps (Kucera and Associates, Inc., 1976). Data for Rillito Creek, Rillito Creek North Overbank Diversion, and the first mile of Pantano Wash and Tanque Verde Creek were developed from topographic maps based on aerial photographs flown on August 17, 1979 (Kinney Aerial Survey, 1979). For the area of Rillito Creek approximately midway between the Dodge Boulevard and North Campbell Avenue bridges, cross-section geometry was developed using topographic maps (Dooley-Jones and Associates, Inc., 1981). Hydraulic data for bridges and culverts on all streams, except Rillito Creek, were obtained by ground surveys. Structural data for Rillito Creek were obtained from design specifications as supplied by Pima County.
Data for Rillito Creek were developed from topographic maps based on aerial photographs flown on August 17, 1979 (Kinney Aerial Survey, 1979). Cross-section data for Tucson Arroyo and part of Silvercroft Wash were obtained from ground surveys (Kucera and Associates, Inc., 1976) and topographic maps at a scale of 1:4,800 (City of Tucson Department of Transportation, Drainage and Contour Maps). For the restudy of Pantano and Agua Caliente Washes, cross-section data for the backwater analyses were digitized by Cooper Aerial Survey Company in early 1987. Topographic mapping of the study area, at a scale of 1:2,400, with a

59
contour interval of 2 feet, was generated for the 1987 restudy (Cooper Aerial Survey Company, 1982, et cetera).
Cross-section data for Canada del Oro Wash, from La Canada Drive to approximately 1,000 feet upstream of U.S. Highway 80/89; Ventana Canyon, Esperero, Robb, Alvernon, Christmas, and Rose Hill Washes; and the East Embankment of the SPRR, which were all studied as part of this updated study, were obtained from topographic maps (Cooper Aerial Survey Company, 1982, et cetera; Pima County Department of Transportation and Flood Control District, 1983; Kinney Aerial Mapping, 1984), with the exception of Ventana Canyon Wash from approximately 0.66 miles downstream of Tanque Verde Road to approximately 1,300 feet downstream of Speedway Boulevard. These cross sections were obtained from the initial study of Pima County.
Cross-section data for the Santa Cruz River through the Town of Marana were obtained from aerial photographs and topographic maps (Kucera and Associates, Inc., 1976; Kucera and Associates, 1976, respectively). Cross-section data for the East Embankment of the SPRR were obtained from topographic maps (Cooper Aerial Survey Company, 1982, et cetera).
Cross sections for the backwater analyses on Canada del Oro Wash through the Town of Oro Valley were obtained from topographic maps at a scale of 1:1,200, with a contour interval of 1 foot, which were provided by the Pima County DOTFCD (Pima County Department of Transportation and Flood Control District, 1983).
Cross sections along Pusch Wash were obtained from a topographic map developed from an aerial photograph at a scale of 1:2,400, with a contour interval of 2 feet (Cooper Aerial Survey Company, 1982, et cetera).
Cross-section data for all remaining streams studied by detailed methods were obtained from maps compiled from aerial photographs at a scale of 1:14,000 (Kucera and Associates, Inc., 1976).
Hydraulic results for Ventana Canyon Wash have been revised from the initial study for Pima County, based on revised hydrology and recent topographic mapping. For streams studied as part of the initial studies, profile computations generally were started at cross sections downstream of the study reaches. Several estimates of water-surface elevations were made for each discharge to obtain profile convergence and to assure valid water-surface elevations at the downstream limit of study or at the mouth of each stream. The elevation-discharge relationships at gaged sites were used as a check of the computed water-surface profiles.
Starting water-surface elevations for Rillito Creek and Sabino Creek were based on normal-depth calculations.
60
The starting water-surface elevation for the 1-percent-annual-chance flood for Rillito Creek North Overbank Diversion was taken at the confluence with Rillito Creek. The starting water-surface elevations for Tanque Verde Creek were also based on the upstream water-surface elevations for Rillito Creek. Profile computations for Airport Wash were started at critical-flow sections (a hydraulic condition for a given discharge, with minimum specific energy).
Cross-section data for the streams studied by detailed shallow flooding methods for this updated study were obtained from maps compiled from aerial photographs at a scale of 1:9,000, with final contour maps produced at a scale of 1:2,400, with a contour interval of 2 feet (Cooper Aerial Survey Company, 1982, et cetera). Information relating to the geometry and hydraulic characteristics of all bridges and culverts was obtained through field investigations and as-built plans.
For Flowing Wells, Cemetery, Kinnison, and Navajo Washes, flows that have been diverted from the watersheds were not included in the hydraulic analyses.
Starting water-surface elevations for all detailed and detailed shallow-flooding streams studied as part of the 1983 study for Pima County were estimated by the slope/area method. In the 1985 studies for Pantano and Agua Caliente Washes and Rincon Creek, only the 1-percent-annual-chance profiles were computed. Starting water-surface elevations were determined by the slope/area method.
Shallow-flooding elevations were determined by field inspection and aerial photograph interpretation, supplemented with cross-section data where available (Kucera and Associates, Inc., 1976).
The channel capacity of the West Branch Santa Cruz River south of Valencia Road is greatly exceeded by the 10-annual-chance-flood discharge. Floodflow in excess of the channel capacity will flow northeasterly as shallow flooding to the Santa Cruz River. Because of the probable discontinuity in flood discharge and the limited channel capacity, no profiles are shown. Instead, areas of flooding are shown on the maps as shallow flooding with the channel designated as an approximate zone. The analysis was based on cross-section data from aerial photography (Kucera and Associates, Inc., 1976), topographic maps (City of Tucson Department of Transportation, Drainage and Contour Maps), and a drainage study (Buck Lewis and Associates, Job 857).
Upstream on Los Robles, Blanco, and West Branch Brawley Washes, and along all of East Brawley and Black Washes, hydraulic conditions limit the accuracy of step-backwater computations. Most of the drainage system consists of small, braided channels bordered by narrow bands of dense vegetation that cause floodwater to spread over wide areas of shallow depths. Dikes and ditches also influence hydraulic conditions. Tributary drainage along Avra Valley can contribute large flows as a result of intense thunderstorm runoff. This runoff would be of short duration and would not flood large areas of the valley, but would cause local flooding. Profiles are not shown because sources of flooding
61
and flow patterns are uncertain. Shallow-flooding designations were used in areas where depths of flooding were estimated. Along larger channels and where depths exceeded 4 feet, approximate zone designations were used.
As part of the August 1997 study for Pima County, flood-hazard areas were identified for additional areas subject to flooding from Black Wash. Detailed topographic mapping (Kinney Aerial Mapping, 1984 and 1985; Cooper Aerial Survey Company, 1983) was used in the analysis. The unusual stream alignment and existence of three separate bridge crossings on Rillito Creek immediately upstream of the confluence with the Santa Cruz River result in a number of breakouts for flows higher than the 10-percent-annual-chance flood discharge. Upstream of the SPRR bridge, flow breakouts of 500, 1,000, and 2,500 cfs occurred for the 2-, 1-, and 0.2-percent-annual-chance floods, respectively. The breakouts flow northerly as shallow flooding before entering Canada del Oro Wash. Additional flows of 2,000 cfs and 8,000 cfs for the 1- and 0.2-percent-annual-chance floods, respectively, escape between I-10 and the frontage road just upstream. The overflow re-enters the Santa Cruz River through the I-10 underpass northeast of the main channel. The depth of the overflow from the main channel for the 1-percent-annual-chance flood was determined to be approximately 3 feet. Approximately 0.77 mile upstream of the SPRR, a low section (in the left overbank) in the railroad embankment allows 4,000 cfs of the 1-percent-annual-chance floodflow to overflow the bank. This flow re-enters the stream just downstream of the frontage road. All breakout analyses were performed using manually developed rating curves for embankment overflows and backwater profile computations using the USACE HEC-2 computer program (USACE, 1976).
The 0.2-percent annual chance flood was modeled separately between the mouth of Rillito Creek and approximately 0.77 mile upstream of the SPRR. This is due to the fact that the SPRR embankment was completely submerged by the 0.2-percent-annual-chance flood downstream of approximately 0.77 mile upstream of the SPRR; consequently, unlike the lower-frequency floods, the 0.2-percent-annual-chance flood was not forced around the railroad embankment over the lower portions of the embankment section. The entire embankment was therefore coded for the weir overflow computation at the railroad crossing.
The 1-percent-annual-chance flood floodwaters from the main channel of Rillito Creek upstream of North Campbell Avenue are hydraulically separated by two areas of high ground, one on each bank. The area along the southern overbank is perched, and the shallow flooding caused is higher than the main channel water-surface elevations.
The depth for Rillito Creek was calculated using Manning’s equation assuming that the flow in the south overbank approximately 2,800 feet upstream of North Campbell Avenue remained outside the channel until reaching North Campbell Avenue. For Rillito Creek North Overbank Diversion, a profile base line was determined using topographic maps at a scale of 1:1,200, with a contour interval
62
of 2 feet (Kinney Aerial Survey, 1979). Water-surface elevations were determined along the profile base line using the USACE HEC-2 computer program (USACE, 1976).
Four bridges cross Canada del Oro Wash near the mouth. The railroad bridge has the smallest capacity, and backwater from the bridges will cause overflow on the northern bank. During a 1-percent-annual-chance floodflow (28,000 cfs), an overflow of approximately 1,000 cfs will spill to the north, away from Canada del Oro Wash, eventually flowing into the Santa Cruz River. This overflow will average less than 1 foot in depth.
Beyond the upstream limit of detailed study (approximately 0.44 mile upstream of the confluence of Earp Wash) on Julian Wash, approximately one-third (2,500 cfs) of the 1-percent-annual-chance flood discharge separates from the main channel and flows along the southern floodplain as shallow flooding for approximately 1.5 miles, where it then rejoins the main channel. Approximately 500 cfs of this separated flow goes under I-10 west of Craycroft Road and flows westerly.
Shallow flooding was identified on the right overbank downstream of Ina Road and Pima Wash. At Ina Road, the channel is no longer capable of containing the 1-percent-annual-chance flood. Water flows over the road and down along the embankment where it eventually returns to the channel. A large area of shallow flooding was identified on Gibson Arroyo to the east of the Tucson, Cornelia & Gila Bend Railroad. Water from the main channel overtops the railroad embankment and flows down the hillside to a swale, which eventually empties into the Old Gibson Arroyo channel. The boundaries of the flooded area were based on slope-conveyance computations, aerial photographs (Kucera and Associates, Inc., 1976), and historic accounts of flooding (Ajo Copper News, 1960 and 1970). The FEMA alluvial fan methodology was used to determine the flood depths and velocities on the alluvial fans south of the Tortolita Mountains. That methodology is based on the method described by Dawdy (Dawdy, David R., 1979). The Pima County DOTFCD identified the Prospect, Ruelas, and Wild Burro Canyon alluvial fans and the Cochie Canyon alluvial fan below the east apex as being subject to flood events consisting of multiple channels. Therefore, the possibility of multiple flood channels was included in the analyses of those alluvial fans.
In alluvial fan areas subject to flooding from more than one flooding source, flood depths and velocities were computed by assuming that the event of inundation by a flood from any canyon is independent of the event of inundation by a flood from any other canyon. In accordance with FEMA guidelines, the union of such events, which has a probability of 0.01, was used to define depths and velocities in areas where multiple alluvial fans intersect.

63
Some portions of the area south of the Tortolita Mountains are not subject to the additional flood hazards associated with alluvial fans. Two such areas are the North Ranch basin just east of the alluvial fan below Canada Agua and the area northwest of the alluvial fan below Derrio Canyon. Both of those areas were studied by approximate methods.
The FEMA alluvial fan methodology assigns relative flood hazards associated with runoff from the mountainous watersheds Upstream of the alluvial fan apices only. Therefore, it should be noted that runoff resulting from rain falling directly on the alluvial fan surface is not considered when applying the methodology. Runoff generated on the alluvial fan surface is usually conveyed down-fan as shallow overland sheetflow that eventually flows into and down the many channels on the alluvial fan surface. The flood hazards associated with that kind of runoff are usually considered minimal (because of the relatively small drainage area contributing to one channel). However, care should be taken that those local drainageways be maintained. If shallow flows, which under natural conditions are distributed over a very large area of the alluvial fan surface, are somehow concentrated in a few small channels, the increase in flow depths and velocities and, consequently, the associated flood hazards, may be great.
Approximate 1-percent-annual-chance flood elevations for Arroyo Chico, downstream of the limit of detailed study below Campbell Avenue, and the West Branch Santa Cruz River were determined by normal-depth calculations and interpolation between known water-surface elevations.
Flooding along East Branch Brawley Wash and selected areas of the Santa Cruz River was determined by approximate methods. The approximate study consisted of an estimate of the magnitude of the peak discharges that will equal or exceed the 1-percent-annual-chance flood. Field investigations of the area, hydraulic structures, and interpretation of maps and photographs were used to determine the extent of flooding.
Both subcritical and supercritical flow occur in Canada del Oro Wash in the Town of Oro Valley. In subcritical (backwater) flow, the water-surface elevation at a given section is controlled by the elevation downstream, but in supercritical (rapid) flow, the control is upstream. For a given discharge and cross section, either a subcritical or a supercritical elevation is possible with the same total energy, and the former will be higher than the latter. Observations of rapid flow in steep alluvial channels in Arizona reveal large waves moving along the channel; the water surface at any point may vary between the supercritical and the higher, subcritical elevation. Subcritical elevations were used for flood profiles in all supercritical reaches.
The hydraulic computations assume that the existing channel geometry does not change during a flood. In steep alluvial channels, such as Canada del Oro Wash, this is a poor assumption. For example, during the flood of December 22 through 24, 1965, on Rillito Creek, it was not unusual to find lateral erosion of greater than 200 feet. The risk of lateral erosion on Canada del Oro Wash has been

64
reduced by the construction of the levee on the southern bank. The bed of an alluvial stream during a flood may be several feet lower than it is either before or after, because of erosion and subsequent deposition. These changes will certainly affect flood elevations; however, there is no reliable method of quantifying them. The stable-channel assumption is still necessary to the computation of flood profiles. The starting water-surface elevations on Canada del Oro Wash were obtained from the flood profile in the FIS for Pima County.
The starting water-surface elevations on Pusch and Big Washes were computed using the slope/area method.
An approximate 1-percent-annual-chance flood zone was designated on Big Wash between approximately 2,900 feet upstream of its confluence with Canada Del Oro Wash and approximately 400 feet downstream of Rancho Vistoso Boulevard because of numerous braided stream channels and the uncertainty of a large tributary inflow from Honey Bee Wash made a detailed analysis unfeasible. The extent and depth of flooding at the Big Wash-Honey Bee Wash confluence agree with an earlier analysis.
Approximate water-surface elevations were estimated for Oro Valley, Rooney, and Unnamed Washes using field inspections and topographic maps.
The 1-percent-annual-chance flood discharges for Canada Agua and Unnamed Canyons were determined using the Pima County flood-prediction method. These flood-frequency data were fit to a log-Pearson Type III distribution by the method of least squares.
The 1-percent-annual-chance elevations for the remaining areas studied by approximate methods were based on existing flood boundary maps (Cella, Barr, Evans & Associates, 1978), topographic maps, field observations, engineering judgment, and manual hydraulic rating of selected cross sections and bridge structures.
The September 28, 1990, revision to the City of Tucson, shows modifications to the flood hazard information along Alvernon Way (Wash) as a result of the construction of a 96-inch stormwater-sewer system from East Fort Lowell Road to East Grant Road and widening of the roadway from 36 to 72 feet wide. The 1-percent-annual-chance floodplain delineation was modified based on the revised HEC-2 hydraulic computer model using a discharge of 1,580 cfs flowing in the street; hydraulic calculations of the hydraulic grade line analysis for Alvernon Way (Wash); as-built plans showing the location of the stormwater-sewer system (City of Tucson Department of Transportation, 1988); and an aerial photograph showing existing and proposed 1-percent-annual-chance floodplain boundaries, 1-percent-annual-chance water-surface elevations, locations of cross sections, and 2-foot contour intervals (City of Tucson, 1989)

65
The limiting flow capacity (assuming gravity flow conditions) of the storm-sewer system along Alvernon Way (Wash) was determined to be 645 cfs. Under pressure flow conditions, the system could handle higher magnitudes of flow. However, for the revision, a conservative approach was used by assuming that the discharge in the storm-sewer system was at its minimum conveyance capacity of 645 cfs. The storm-sewer system is supplied by two large grates located at either end of the study area. The grate at the downstream study limit is approximately 100 feet north of Presidio Road (Columbus Wash). The grate at the upstream study limit is approximately 75 feet south of the Grant Road intersection. Because the 1-percent-annual-chance peak discharge at Grant and Presidio Roads is approximately 2,225 cfs, of which the stormwater-sewer system conveys 645 cfs, the discharge conveyed in Alvernon Way (Wash) and modeled in the HEC-2 hydraulic computer model was 1,580 cfs between Fort Lowell and Grant Roads, assuming the stormwater-sewer pipe is full at the upstream limit. As a result of widening Alvernon Way (Wash) and the addition of the stormwater-sewer system, the 1-percent-annual-chance floodplain delineation between East Fort Lowell and East Grant Roads and the 1-percent-annual-chance BFEs have been modified. Alamo, Arcadia, Enchanted Hills, Hidden Hills, and Robb Washes were also revised in the September 30, 1992, revision of the City of Tucson. Hidden Hills Wash, a tributary of Tanque Verde Creek, was revised between Rosewood Street and Broadway Boulevard. The revision of Hidden Hills Wash was made to reflect changed physical conditions, including the construction of a concrete channel and new culvert crossings, as well as the placement of fill. The results of the HEC-2 model were shown on topographic work maps at a scale of 1"=200', with a contour interval of 2 feet (Osborn, Pettersn, Walbert and Associates, 1990) for Hidden Hills Wash. Enchanted Hills Wash was revised from its confluence with West Branch Santa Cruz River to approximately 1 mile upstream of the confluence. The revision was based on channel improvements, a more detailed field study of the channel geometry, and the addition of a box culvert adjacent to the existing box culvert under Mission Road. As a result of the channel improvements, the 1-percent-annual-chance recurrence interval flood is contained within the channel of Enchanted Hills Wash, except at the confluence with the West Branch Santa Cruz River. Areas previously not designated as SFHAs are now shown as Zones A and AH in the vicinity of the confluence with the West Branch Santa Cruz River. The results of the HEC-2 model were shown on topographic work maps at a scale of 1"=200', with a contour interval of 2 feet (City of Tucson, May 5, 1983) for Enchanted Hills Wash. Alamo Wash, a tributary of Rillito Creek, was affected by two revisions. The first revision extended from approximately 790 feet downstream of Grant Road to

66
approximately 370 feet upstream of Golf Links Road. The second revision extended from the City of Tucson corporate limits at Fort Lowell Road to approximately 0.75 mile upstream of the approximate alignment of Beverly Boulevard extended north. The results of these analyses are shown on work maps at a scale of 1"=200', with a contour interval of 2 feet (Simons, Li & Associates, Inc., 1990). The second revision along Alamo Wash was based on channel improvements and new bridge construction at Fort Lowell Road. The revised hydraulic analysis was performed by the City of Tucson using the USACE HEC-2 computer program (USACE, 1976). The results of the HEC-2 model were shown on aerial topographic work maps at a scale of 1"=200', with a contour interval of 2 feet (City of Tucson, 1991). The revision for Arcadia Wash was revised from its confluence with Alamo Wash under Glenn Street to approximately 0.96 mile upstream to Pima Street. The revision was based on channel improvements and the construction of a new culvert under Grant Road. The revised hydraulic analysis was performed by the City of Tucson using the USACE HEC-2 computer program (USACE, 1976). The results of the HEC-2 model were shown on aerial topographic work maps at a scale of 1"=200', with a contour interval of 2 feet (City of Tucson, 1991). Robb Wash, another tributary to Tanque Verde Creek, was revised from Pima Street to approximately 550 feet north of Pima Street, this revision was based on more detailed topography and a revised hydraulic analysis. The results of the HEC-2 hydraulic computer model were shown on an aerial topographic work map at a scale of 1"=200', with a contour interval of 2 feet (Osborn, Petterson, Walbert and Associates, March 21, 1990). The revised hydraulic analyses for Rillito and Sabino Creeks and the remaining portion of Tanque Verde Creek used the USACE HEC-2 computer program (USACE, 1976). The floodplain and floodway boundaries were delineated using topographic maps at a scale of 1:2,400, with a contour interval of 2 feet (Cooper Aerial Survey Company, 1984; Cooper Aerial Survey Company, 1986; Greiner Engineering, 1987). BFEs for Railroad and Rodeo Washes in the September 30, 1992, revision of the City of Tucson, were computed using the USGS WSPRO computer model (U.S. Department of Transportation, 1988). The April 2, 1992, revision of the Town of Marana incorporated the effects of the revised hydrologic and hydraulic analyses for the Santa Cruz River and the Tortolita Alluvial Fans. The flood hazard information for the Tortolita Alluvial Fans was incorporated onto the FIRM for the Town of Marana due to annexations from the unincorporated areas of Pima County. The boundaries that define the SFHAs on the alluvial fans south of the Tortolita Mountains were delineated on topographic maps at a scale of 1:24,000, with a
67
contour interval of 20 feet (U.S. Department of the Interior, 1968, et cetera). These delineations were based on topographic and geomorphic information shown on aerial photographs and soils information provided by the Pima County DOTFCD (Cooper Aerial Survey Company, 1982, et cetera; Pima County Department of Transportation and Flood Control District, 1987). Boundaries between flood depth and velocity zones were delineated on the aforementioned topographic maps (U.S. Department of the Interior, 1968, et cetera). The September 30, 1992, revision of the Pima County and the City of Tucson made modifications to the 1- and 0.2-percent-annual-chance floodplain and floodway boundaries and BFEs have been made along Rillito, Tanque Verde Creek and Sabino Creeks. The reaches of Tanque Verde Creek, from its confluence with Rillito Creek to approximately 1 mile upstream of North Craycroft Road; and Sabino Creek, from its confluence with Tanque Verde Creek to approximately 1 mile upstream of its confluence with Tanque Verde Creek, have been revised to reflect channel improvements and bridge construction projects. Rillito Creek North Overbank Diversion, in Pima County, which was located in the vicinity of North Campbell Avenue, had been eliminated as a result of the channel improvement project on Rillito Creek. Tanque Verde Creek and Pantano Wash have a common 1-percent-annual-chance floodplain and floodway in the area of their confluence. The floodplain and floodway analyses were performed separately, and high elevations were used to compute the floodway in this area. The July 5, 1994, revision to the City of Tucson, updated floodplain information for Cemetery, Christmas, Columbus, Flowing Wells, High School and Navajo Washes and added flooding to Bronx, El Rio, Este, Midway, Rolling Hills, Sahuara, Van Buren, and Wilson Washes. The Navajo Wash study comprises four washes: Flowing Wells Wash, from Higgins Lane to Fairview Avenue; Navajo Wash, from Fairview Avenue upstream to Mountain Avenue; Wilson Wash, upstream to Grant Avenue; and Cemetery Wash, from its confluence with Navajo Wash to Fairview Avenue, approximately 0.91 miles upstream to Stone Avenue. The study reach for Christmas Wash extends approximately 1.56 miles upstream from the confluence with Rillito Creek to Country Club Road. The upstream portion of the wash is conveyed primarily within the roadway section of Christmas Avenue as the flow passes through the Winterhaven Subdivision. Once the runoff leaves the subdivision at Tucson Boulevard, the flow is conveyed by a natural undersized channel north toward Rillito River. The drainage area is a narrow, elongated watershed with the headwaters located near the intersections of Alvernon Way and Broadway Boulevard (El Con Mall), approximately 5.25 miles south of where the channel flows in Rillito River. Midway Wash is confluent to Columbus Wash. Runoff in Midway Wash is conveyed in Desert Avenue from Fifth Street at the upstream end to a short channel and culvert located south of Speedway Boulevard. The culvert conveys the runoff

68
under Speedway Boulevard where flow then travels north within the Belvedere Avenue street section up to the intersection with Glenn Street. At this point, the runoff is conveyed west to Columbus Boulevard where the two subbasins combine. Van Buren Wash is an urbanized watershed. Runoff is conveyed via street flow up to Pima Street. From Pima Street to the confluence of Alamo Wash, an undersized earthen channel conveys the flow. Sahuara Wash is an urbanized watershed dominated by shallow street flow. The watershed has two flow diversion, one flowing north through the median opening on Speedway Boulevard, along Sonorita Avenue immediately east of Sahuara Avenue. North of Speedway Boulevard, the flow is collected in a catch basin and discharged directly into Alamo Wash. The restudies of Van Buren and Sahuara Washes included the construction of the storm-sewer system below Pima Street. This storm sewer system captures and conveys 360 cfs that has been subtracted from the hydraulic model. The flow is added back into the channel north of Pima Street. Runoff for El Rio Wash is conveyed within local streets toward the wash that begins at Speedway Boulevard. High School Wash flows east to west and the watershed headwater is located east of Country Club Road and is bounded by Speedway Boulevard to the north anf Broadway Boulevard to the south. Rolling Hills Wash is primarily a natural channel with some bank protection in areas of high potential for channel erosion. Este Wash is characterized by two primary, ephemeral watercourses. The two are reference as the Primary and Coronado Ridge Washes. The model for this stream included the culvert below Bonanza Avenue. The culvert has a sedimentation problem that was assumed to be handled during scheduled maintenance; therefore no reduced capacity was calculated due to sediment deposition or excessive vegetative growth. The starting water-surface elevations for Flowing Wells/Navajo, Cemetery, Christmas, Este, Rolling Hills, Sahuara and Van Buren Washes for the 1994 revision were taken from existing models at the confluence of major washes. Critical depth was used as the starting water-surface elevation for High School, Columbus/Midway, Wilson, and Bronx Washes. The slope/area method was used for El Rio Wash. Where diversions occurred in a watershed due to elevated roadways that caused impoundment of runoff, depth of flow in cross streets was calculated using Manning’s equation and flow through the median opening was then calculated with the weir equation. The amount that flowed through the weir was routed to the next downstream concentration point, while the flow diverted from the watershed was
69
routed to the next watershed, if applicable, or removed from the analysis entirely if no impact occurred farther downstream. The October 16, 1996, revision of the Town of Marana incorporated detailed hydrologic and hydraulic analyses and more detailed topographic information along Idle Hour Wash. As a result of the modifications, the area inundated by the 1-percent-annual-chance flood along the main reach of Idle Hour Wash and the three tributaries to Idle Hour Wash in the Town of Marana was redesignated from Zone A to Zone AE from just downstream of Silverbell Road to approximately 2,600 feet upstream of Camino del Cerro Road. The SFHA boundaries from the confluence with Santa Cruz River to just downstream of Silverbell Road were revised based on the more detailed topographic information and remained designated Zone A. Along the revised reach of Idle Hour Wash in the Town of Marana, the SFHA increased in some areas and decreased in others.
The August 5, 1997, revision to the City of Tucson, incorporated detailed hydrologic and hydraulic analyses along Anklam Wash and “A” Wash. The location of Anklam Wash had shifted and the location of “A” Wash had been added to the FIRM. Locations of selected cross sections used in the hydraulic analyses are shown on the Flood Profiles (Exhibit 1). For stream segments for which a floodway was computed (Section 4.2), selected cross-section locations are also shown on the Flood Insurance Rate Map (Exhibit 2). The hydraulic analyses for this study were based on unobstructed flow. The flood elevations shown on the profiles are thus considered valid only if hydraulic structures remain unobstructed, operate properly, and do not fail. June 16, 2011, Revised Analyses A detailed drainage study for the area of the Town of Marana affected by stormwater runoff emanating from Tortolita Mountain Watersheds was conducted in 2009 (CMG, 2009). The total study area is approximately 165 square miles with the HEC-1 study area being approximately 90 square miles and the FLO-2D study area being approximately 75 square miles. A geomorphic analysis was performed to determine whether or not each of the study area washes is an alluvial fan, to characterize them as active or inactive, and to locate the fan boundaries. The geomorphic analysis was particularly important for accurately defining flood hazard boundaries on active alluvial fans because the available hydraulic models are incapable of addressing this transient nature of the fan surface. FLO-2D, a two-dimensional hydrodynamic computer model, was used to develop a hydrologic/hydraulic model of stormwater runoff from the piedmont and to map areas subject to flooding during the 1-percent-annual-chance storm. The stormwater hydrographs created by the HEC-1 models, were used as point source
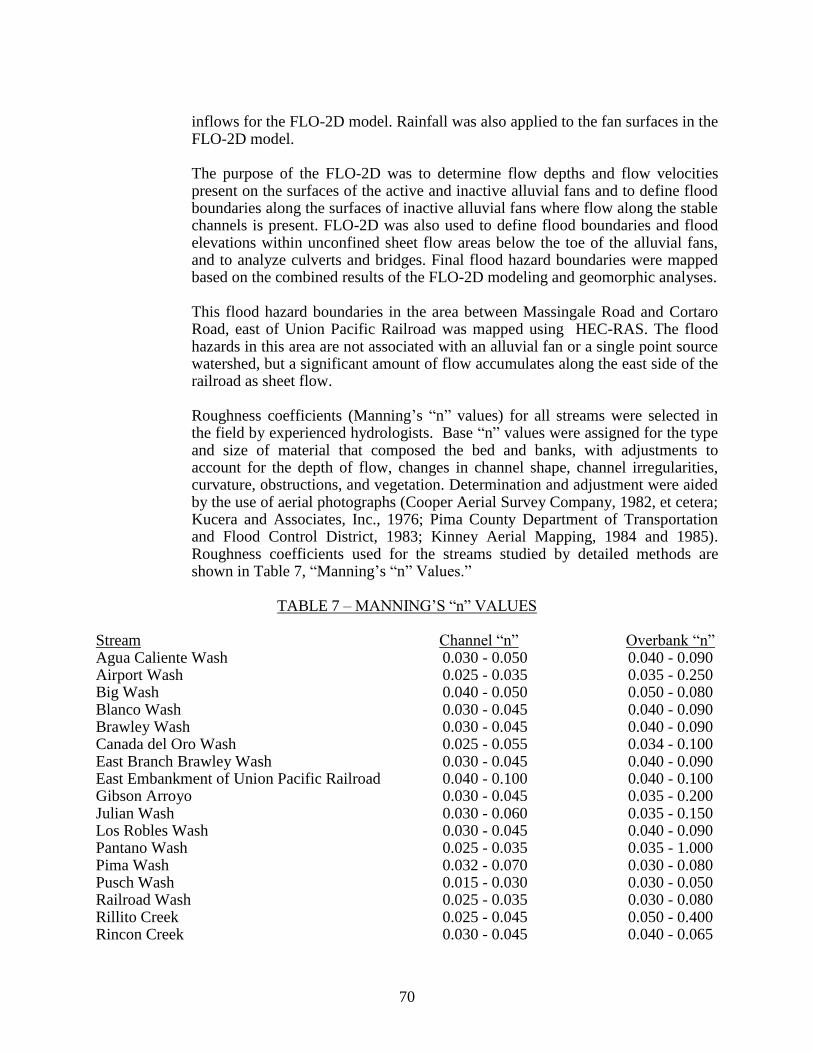
70
inflows for the FLO-2D model. Rainfall was also applied to the fan surfaces in the FLO-2D model. The purpose of the FLO-2D was to determine flow depths and flow velocities present on the surfaces of the active and inactive alluvial fans and to define flood boundaries along the surfaces of inactive alluvial fans where flow along the stable channels is present. FLO-2D was also used to define flood boundaries and flood elevations within unconfined sheet flow areas below the toe of the alluvial fans, and to analyze culverts and bridges. Final flood hazard boundaries were mapped based on the combined results of the FLO-2D modeling and geomorphic analyses. This flood hazard boundaries in the area between Massingale Road and Cortaro Road, east of Union Pacific Railroad was mapped using HEC-RAS. The flood hazards in this area are not associated with an alluvial fan or a single point source watershed, but a significant amount of flow accumulates along the east side of the railroad as sheet flow. Roughness coefficients (Manning’s “n” values) for all streams were selected in the field by experienced hydrologists. Base “n” values were assigned for the type and size of material that composed the bed and banks, with adjustments to account for the depth of flow, changes in channel shape, channel irregularities, curvature, obstructions, and vegetation. Determination and adjustment were aided by the use of aerial photographs (Cooper Aerial Survey Company, 1982, et cetera; Kucera and Associates, Inc., 1976; Pima County Department of Transportation and Flood Control District, 1983; Kinney Aerial Mapping, 1984 and 1985). Roughness coefficients used for the streams studied by detailed methods are shown in Table 7, “Manning’s “n” Values.”
TABLE 7 – MANNING’S “n” VALUES
Stream Channel “n” Overbank “n” Agua Caliente Wash 0.030 - 0.050 0.040 - 0.090 Airport Wash 0.025 - 0.035 0.035 - 0.250 Big Wash 0.040 - 0.050 0.050 - 0.080 Blanco Wash 0.030 - 0.045 0.040 - 0.090 Brawley Wash 0.030 - 0.045 0.040 - 0.090 Canada del Oro Wash 0.025 - 0.055 0.034 - 0.100 East Branch Brawley Wash 0.030 - 0.045 0.040 - 0.090 East Embankment of Union Pacific Railroad 0.040 - 0.100 0.040 - 0.100 Gibson Arroyo 0.030 - 0.045 0.035 - 0.200 Julian Wash 0.030 - 0.060 0.035 - 0.150 Los Robles Wash 0.030 - 0.045 0.040 - 0.090 Pantano Wash 0.025 - 0.035 0.035 - 1.000 Pima Wash 0.032 - 0.070 0.030 - 0.080 Pusch Wash 0.015 - 0.030 0.030 - 0.050 Railroad Wash 0.025 - 0.035 0.030 - 0.080 Rillito Creek 0.025 - 0.045 0.050 - 0.400 Rincon Creek 0.030 - 0.045 0.040 - 0.065
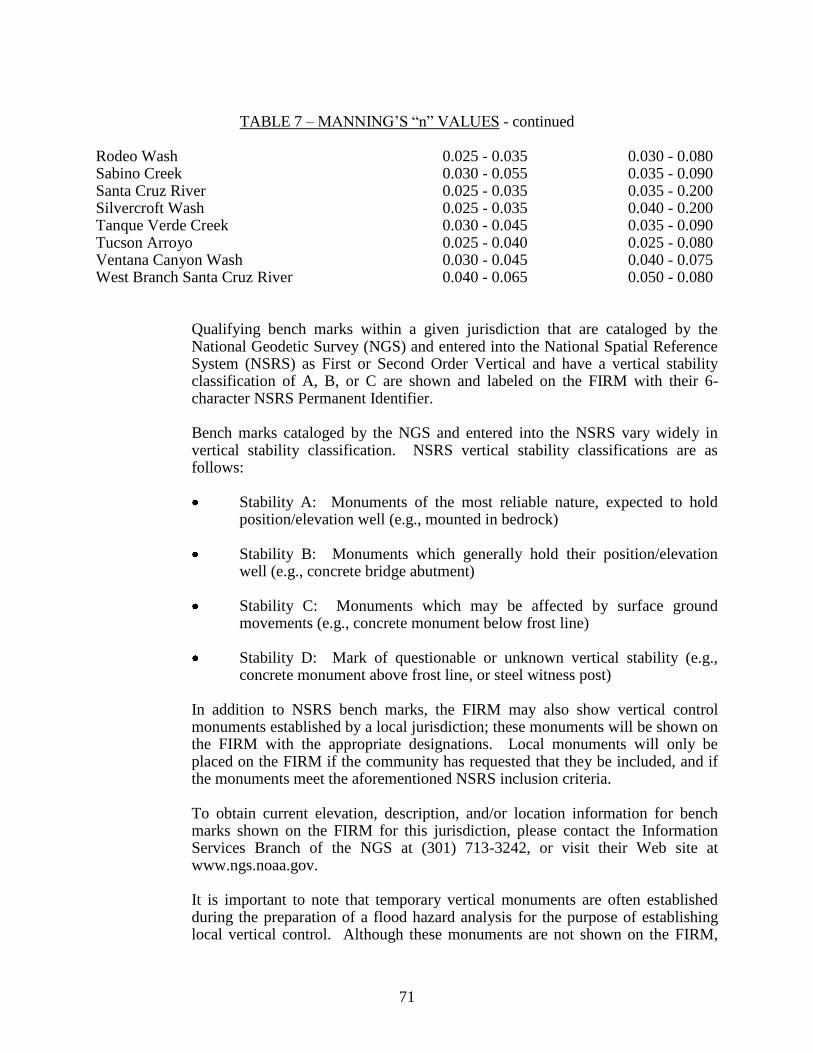
71
TABLE 7 – MANNING’S “n” VALUES - continued Rodeo Wash 0.025 - 0.035 0.030 - 0.080 Sabino Creek 0.030 - 0.055 0.035 - 0.090 Santa Cruz River 0.025 - 0.035 0.035 - 0.200 Silvercroft Wash 0.025 - 0.035 0.040 - 0.200 Tanque Verde Creek 0.030 - 0.045 0.035 - 0.090 Tucson Arroyo 0.025 - 0.040 0.025 - 0.080 Ventana Canyon Wash 0.030 - 0.045 0.040 - 0.075 West Branch Santa Cruz River 0.040 - 0.065 0.050 - 0.080
Qualifying bench marks within a given jurisdiction that are cataloged by the National Geodetic Survey (NGS) and entered into the National Spatial Reference System (NSRS) as First or Second Order Vertical and have a vertical stability classification of A, B, or C are shown and labeled on the FIRM with their 6-character NSRS Permanent Identifier. Bench marks cataloged by the NGS and entered into the NSRS vary widely in vertical stability classification. NSRS vertical stability classifications are as follows:
Stability A: Monuments of the most reliable nature, expected to hold
position/elevation well (e.g., mounted in bedrock) Stability B: Monuments which generally hold their position/elevation
well (e.g., concrete bridge abutment) Stability C: Monuments which may be affected by surface ground
movements (e.g., concrete monument below frost line) Stability D: Mark of questionable or unknown vertical stability (e.g.,
concrete monument above frost line, or steel witness post) In addition to NSRS bench marks, the FIRM may also show vertical control monuments established by a local jurisdiction; these monuments will be shown on the FIRM with the appropriate designations. Local monuments will only be placed on the FIRM if the community has requested that they be included, and if the monuments meet the aforementioned NSRS inclusion criteria. To obtain current elevation, description, and/or location information for bench marks shown on the FIRM for this jurisdiction, please contact the Information Services Branch of the NGS at (301) 713-3242, or visit their Web site at www.ngs.noaa.gov. It is important to note that temporary vertical monuments are often established during the preparation of a flood hazard analysis for the purpose of establishing local vertical control. Although these monuments are not shown on the FIRM,
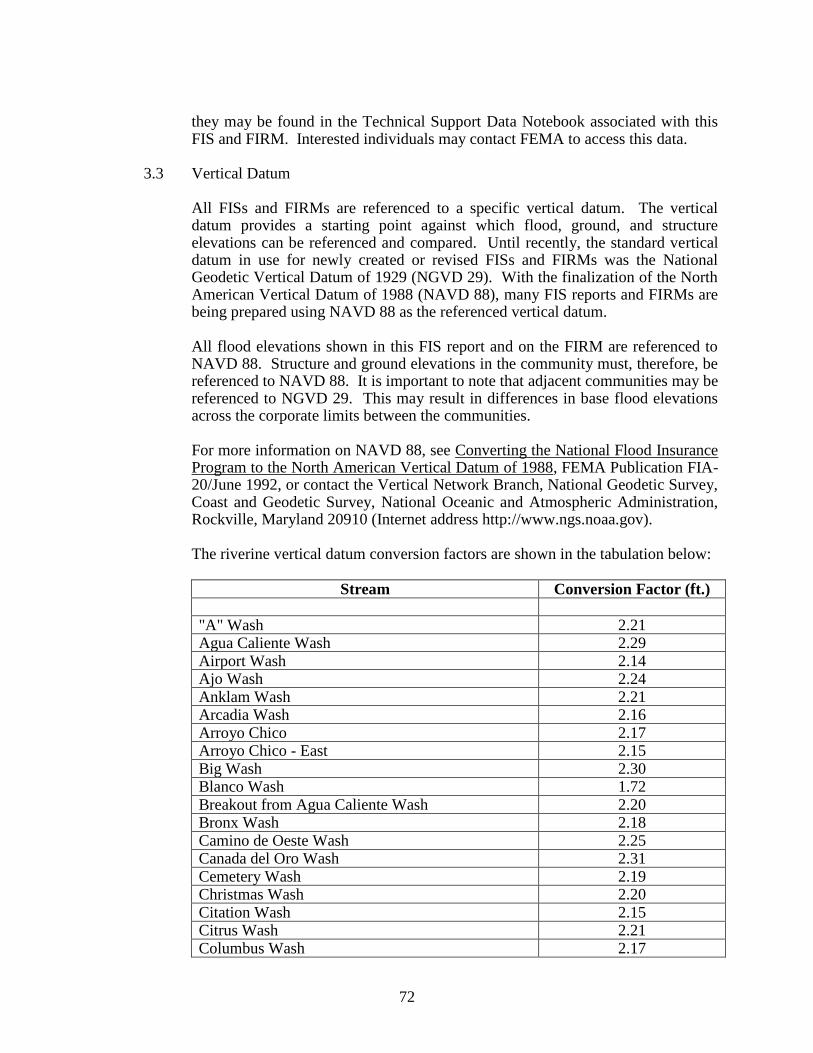
72
they may be found in the Technical Support Data Notebook associated with this FIS and FIRM. Interested individuals may contact FEMA to access this data.
3.3 Vertical Datum
All FISs and FIRMs are referenced to a specific vertical datum. The vertical datum provides a starting point against which flood, ground, and structure elevations can be referenced and compared. Until recently, the standard vertical datum in use for newly created or revised FISs and FIRMs was the National Geodetic Vertical Datum of 1929 (NGVD 29). With the finalization of the North American Vertical Datum of 1988 (NAVD 88), many FIS reports and FIRMs are being prepared using NAVD 88 as the referenced vertical datum. All flood elevations shown in this FIS report and on the FIRM are referenced to NAVD 88. Structure and ground elevations in the community must, therefore, be referenced to NAVD 88. It is important to note that adjacent communities may be referenced to NGVD 29. This may result in differences in base flood elevations across the corporate limits between the communities. For more information on NAVD 88, see Converting the National Flood Insurance Program to the North American Vertical Datum of 1988, FEMA Publication FIA-20/June 1992, or contact the Vertical Network Branch, National Geodetic Survey, Coast and Geodetic Survey, National Oceanic and Atmospheric Administration, Rockville, Maryland 20910 (Internet address http://www.ngs.noaa.gov). The riverine vertical datum conversion factors are shown in the tabulation below:
Stream Conversion Factor (ft.)
"A" Wash 2.21 Agua Caliente Wash 2.29 Airport Wash 2.14 Ajo Wash 2.24 Anklam Wash 2.21 Arcadia Wash 2.16 Arroyo Chico 2.17 Arroyo Chico - East 2.15 Big Wash 2.30 Blanco Wash 1.72 Breakout from Agua Caliente Wash 2.20 Bronx Wash 2.18 Camino de Oeste Wash 2.25 Canada del Oro Wash 2.31 Cemetery Wash 2.19 Christmas Wash 2.20 Citation Wash 2.15 Citrus Wash 2.21 Columbus Wash 2.17

73
Stream Conversion Factor (ft.)
Midway Wash 2.17 Columbus Wash Overflow 2.17 Deer Trail Wash 2.21 El Rio Wash 2.19 El Vado Wash 2.14 Esperero Wash 2.26 Este Wash 2.21 Flowing Wells Wash 2.19 Gibson Arroyo 2.28 Greasewood Wash 2.22 Hidden Hill Wash 2.20 High School Wash 2.17 Julian Wash 2.05 Kinneson Wash 2.16 Los Robles Wash 1.75 Navajo Wash 2.19 Old West Branch Santa Cruz River 2.22 Pantano Wash 2.28 Pima Wash 2.26 Pusch Wash 2.29 Pusch Wash, East Fork 2.30 Pusch Wash, West Fork 2.30 Railroad Wash 2.15 Rillito Creek 2.20 Rincon Creek 2.39 Robb Wash 2.19 Rodeo Wash 2.16 Rodeo Wash Overflow 2.16 Rollercoaster Wash 2.21 Rollercoaster Wash South Drainage 2.21 Rolling Hills Wash 2.19 Sabino Creek 2.24 Sahuara Wash 2.17 San Juan Wash 2.24 Santa Clara Wash 2.16 Santa Cruz River North of Cross-Section BD 1.72 Santa Cruz River South of Cross-Section BD 2.07 Santa Cruz River (Above Pima Mine Road) – North Half 2.23 Santa Cruz River (Above Pima Mine Road) – South Half 2.52 Santa Cruz River West Branch Tributary 2.21 Silvercroft Wash 2.20 Tanque Verde Creek 2.26 Tucson Arroyo/Arroyo Chico 2.18
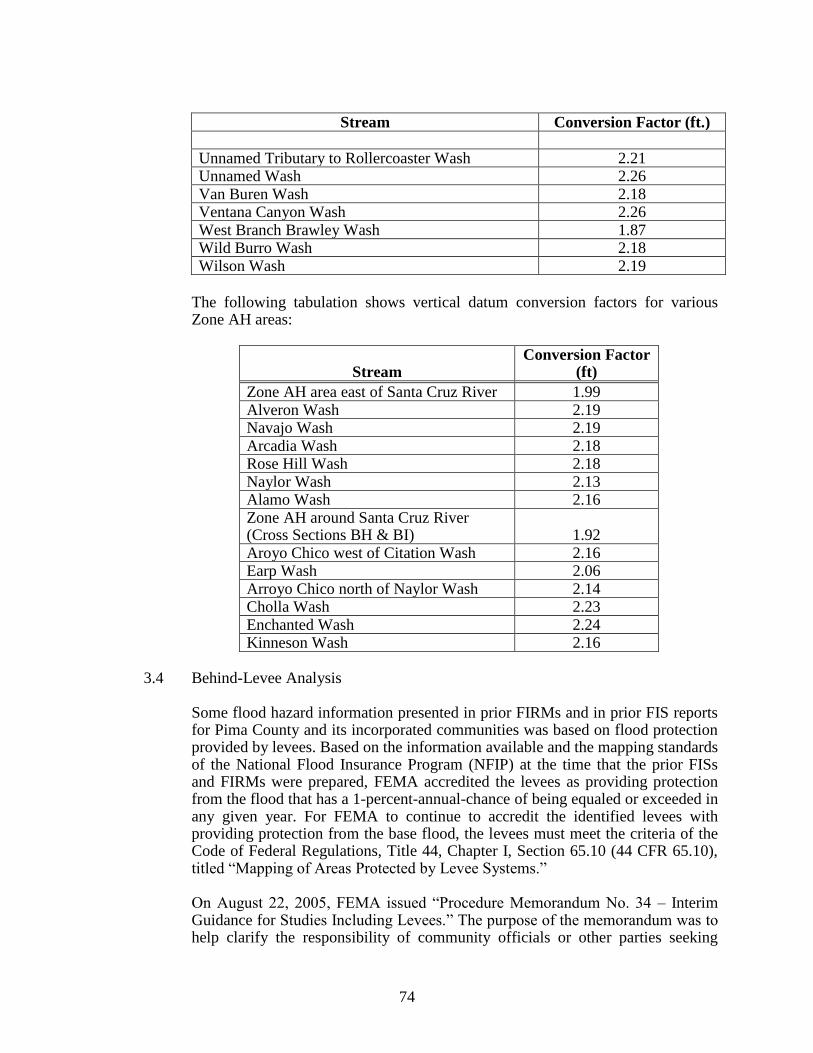
74
Stream Conversion Factor (ft.)
Unnamed Tributary to Rollercoaster Wash 2.21 Unnamed Wash 2.26 Van Buren Wash 2.18 Ventana Canyon Wash 2.26 West Branch Brawley Wash 1.87 Wild Burro Wash 2.18 Wilson Wash 2.19
The following tabulation shows vertical datum conversion factors for various Zone AH areas:
Stream Conversion Factor
(ft)
Zone AH area east of Santa Cruz River 1.99 Alveron Wash 2.19 Navajo Wash 2.19 Arcadia Wash 2.18 Rose Hill Wash 2.18 Naylor Wash 2.13 Alamo Wash 2.16 Zone AH around Santa Cruz River (Cross Sections BH & BI) 1.92 Aroyo Chico west of Citation Wash 2.16 Earp Wash 2.06 Arroyo Chico north of Naylor Wash 2.14 Cholla Wash 2.23 Enchanted Wash 2.24 Kinneson Wash 2.16
3.4 Behind-Levee Analysis
Some flood hazard information presented in prior FIRMs and in prior FIS reports for Pima County and its incorporated communities was based on flood protection provided by levees. Based on the information available and the mapping standards of the National Flood Insurance Program (NFIP) at the time that the prior FISs and FIRMs were prepared, FEMA accredited the levees as providing protection from the flood that has a 1-percent-annual-chance of being equaled or exceeded in any given year. For FEMA to continue to accredit the identified levees with providing protection from the base flood, the levees must meet the criteria of the Code of Federal Regulations, Title 44, Chapter I, Section 65.10 (44 CFR 65.10), titled “Mapping of Areas Protected by Levee Systems.” On August 22, 2005, FEMA issued “Procedure Memorandum No. 34 – Interim Guidance for Studies Including Levees.” The purpose of the memorandum was to help clarify the responsibility of community officials or other parties seeking

75
recognition of a levee by providing information identified during a study/mapping project. Often, documentation regarding levee design, accreditation, and the impacts on flood hazard mapping is outdated or missing altogether. To remedy this, Procedure Memorandum No. 34 provides interim guidance on procedures to minimize delays in near-term studies/mapping projects, to help our mapping partners properly assess how to handle levee mapping issues. While documentation related to 44 CFR 65.10 is being compiled, the release of a more up-to-date FIRM for other parts of a community or county may be delayed. To minimize the impact of the levee recognition and certification process, FEMA issued “Procedure Memorandum No. 43 – Guidelines for Identifying Provisionally Accredited Levees” on March 16, 2007. These guidelines allow issuance of the FIS and FIRM while levee owners or communities compile full documentation required to show compliance with 44 CFR 65.10. The guidelines also explain that a FIRM can be issued while providing the communities and levee owners with a specified timeframe to correct any maintenance deficiencies associated with a levee and to show compliance with 44 CFR 65.10. FEMA contacted the communities within Pima County to obtain data required under 44 CFR 65.10 to continue to show the levees as providing protection from the flood that has a 1-percent-annual-chance of being equaled or exceeded in any given year. FEMA coordinated with the local communities and other organizations to compile a list of levees based on information from the FIRM and community provided information. The levees with inventory IDs #2, #40-#50, #56, and #57 are located on Canada Del Oro Wash. Based on a review of detailed topographic information obtained from Pima County, the floodplain on the landward side of the levee was determined. Levee inventory IDs #3, #58, and #59 are located on Canada Del Oro Wash. Based on a review of the detailed topographic information obtained from Pima County, the floodplain on the landward side of the levee was determined. The levees with inventory IDs #8-#11, #13-33, #35, and #36 are located on the Lower Santa Cruz River. These levees are accredited on the June 16, 2011, maps by LOMR 02-09-1039P. The floodplain on the landward side of the levee was delineated by mapping the Lower Santa Cruz River BFEs using detailed topographic information obtained from Pima County. The structures with IDs #51, #52, and #71 are the I-10 embankment and the Central Arizona Project canal embankments. A two-dimensional analysis was performed by CMG Drainage Engineering, Inc., to determine the flood hazards in this area as part of the Tortolita Piedmont Study for the Town of Marana. The results from the two-dimensional analysis were reviewed by FEMA and used to determine the behind-levee floodplain for these two structures.
76
The levees with inventory ID #54 and #83 are located on Gibson Arroyo. For levee segments south of West 2
nd Avenue the behind-levee floodplain was
delineated using the riverside BFEs and topographic information from the USGS (i.e., 10m DEMs). For the levee segments north West 2
nd Avenue, the behind-
levee floodplain was delineated using topographic information from the USGS (i.e., 10m DEMs). Levee inventory #55 and embankment #162 are located on Canada Del Oro Wash. The behind-levee floodplain was developed by mapping the Canada Del Oro Wash BFEs on the landward side of the levee using detailed topographic information obtained from Pima County. Levee inventory ID #60 is located on an unnamed tributary. Discharges for the stream were calculated using USGS regression equations with the drainage area parameter determined using USGS 10m DEMs. An approximate hydraulic analysis was developed using HEC-RAS and cross-section data obtained from detailed topographic data provided by Pima County. The resulting floodplain was used as the behind-levee floodplain. Levee inventory ID #61 is located on Rillito Creek. Discharges for the stream were calculated using USGS regression equations with the drainage area parameter determined using USGS 10m DEMs. An approximate hydraulic analysis was developed using HEC-RAS and cross-section data obtained from detailed topographic data provided by Pima County. The resulting floodplain was used as the behind-levee floodplain. Craycroft Road embankment (levee inventory ID #64) is located on Pantano Wash. The City of Tucson performed an approximate hydraulic analysis using HEC-RAS and detailed topographic information obtained from Pima County. The behind-levee floodplain was developed using this analysis. The North Houghton Road embankment with inventory ID #66 is located on Agua Caliente Wash. The behind-levee floodplain was developed by mapping the riverside BFEs on the landward side of the levee using detailed topographic information obtained from Pima County. Levee inventory IDs #75 and #104 are located on Santa Cruz River. The behind-levee floodplain was developed by mapping the Santa Cruz River BFEs on the landward side of the levee using detailed topographic information obtained from Pima County. The North Shannon Road embankment with inventory ID #96 is located on Carmack Wash. Pima County Regional Flood Control District performed an approximate hydraulic analysis using HEC-RAS and detailed topographic information. The behind-levee floodplain was developed using the results of this analysis.
77
The embankment on I-10, ID #109, is located on Santa Cruz River. The behind-levee floodplain was delineated based on detailed topographic information obtained from Pima County. Levee inventory ID #113 is located on Santa Cruz River. Based on a review of the detailed topographic information obtained from Pima County the floodplain on the landward side of the levee was used as the behind levee floodplain. Structure with inventory ID #139 is located on the Ajo Detention Basin. Based on correspondence with the USACE, this structure was identified as a dam. However, the floodplain near the structure was reshaped based on topographic data and information supplied by the community. The Union Pacific Railroad embankment with, ID #143, is located on Julian Wash. Discharges for the stream were calculated using USGS regression equations with the drainage area parameter determined using USGS 10m DEMs. An approximate hydraulic analysis was developed using HEC-RAS and cross-section data obtained from detailed topographic data provided by Pima County. The resulting floodplain was used as the behind-levee floodplain. Embankment with inventory ID #144 is located on Pantano Wash. The behind-levee floodplain was delineated based on detailed topographic information obtained from Pima County. The Union Pacific Railroad embankment with inventory ID #158 is located on Santa Cruz River, above Pima Mine Road. The behind-levee floodplain was developed by mapping the riverside BFEs on the landward side of the levee using USGS (i.e., 10m DEMs) topographic information.
4.0 FLOODPLAIN MANAGEMENT APPLICATIONS The NFIP encourages State and local governments to adopt sound floodplain management
programs. To assist in this endeavor, each FIS provides 1-percent-annual-chance floodplain data, which may include a combination of the following: 10-, 2-, 1-, and 0.2-percent annual chance flood elevations; delineations of the 1- and 0.2-percent annual chance floodplains; and 1-percent-annual-chance floodway. This information is presented on the FIRM and in many components of the FIS, including Flood Profiles, Floodway Data tables, and Summary of Stillwater Elevation tables. Users should reference the data presented in the FIS as well as additional information that may be available at the local community map repository before making flood elevation and/or floodplain boundary determinations.
4.1 Floodplain Boundaries
To provide a national standard without regional discrimination, the 1-percent-annual-chance flood has been adopted by FEMA as the base flood for floodplain management purposes. The 0.2-percent annual chance flood is employed to
78
indicate additional areas of flood risk in the county. For the streams studied in detail, the 1- and 0.2-percent annual chance floodplain boundaries have been delineated using the flood elevations determined at each cross section. Between cross sections, the boundaries were interpolated using topographic maps at scales of 1:1,200, 1:2,400, 1:4,800, and 1:24,000, with contour intervals of 1, 2, 10, 20, and 40 feet (Pima County Department of Transportation and Flood Control District, 1983; Cooper Aerial Survey Company, 1982, et cetera; Kucera and Associates, Inc., 1976; U.S. Department of the Interior, 1968, et cetera, , respectively), and stereo interpretation of aerial photographs at a scale of 1:30,400 (Cooper Aerial Survey Company, Stereo Photographs).
Floodplain boundaries at an approximate 2,500-foot section of Agua Caliente Wash in the vicinity of Fort Lowell Road have been delineated using topographic maps at a scale of 1:1,200, with a contour interval of 1 foot (Hydro-Science Engineering Southwest, Inc., 1987).
Floodplain boundaries for Tanque Verde Creek were interpolated using topographic maps at a scale of 1:1,200, with a contour interval of 2 feet (Kinney Aerial Survey, 1979). Floodplain boundaries for Rillito Creek in the areas of Dodge Boulevard and the Hill Farm subdivision were delineated using topographic maps based on aerial photographs at a scale of 1:1,200, with a contour interval of 2 feet (Cella Barr Associates, 1979; Cella Barr Associates, 1979). Floodplain boundaries for Rillito Creek North Overbank Diversion and Rillito Creek from the vicinity of North Campbell Avenue to approximately 975 feet upstream were delineated using topographic maps at a scale of 1:1,200, with a contour interval of 1 foot (Dooley-Jones and Associates, Inc., 1981). Floodplain boundaries for the Santa Cruz River West Overflow Channel from the confluence with the Santa Cruz River to Continental Road were delineated using topographic maps at a scale of 1:4,800, with a contour interval of 2 feet (WBC Consultants, Inc., 1979). Floodplain boundaries for Tanque Verde Creek at the Lakes at Castle Rock subdivision were delineated using topographic maps at a scale of 1:480, with a contour interval of 0.5 foot (Dooley-Jones and Associates, Inc., 1980). The area is bordered by Castle Rock Drive and Quarter Horse Road. Floodplain boundaries for Agua Caliente Wash near its confluence with Tanque Verde Creek were delineated using topographic maps at a scale of 1:2,400, with a contour interval of 2 feet (Cooper Aerial Survey Company, 1982, et cetera), and grading plans at a scale of 1:480, with a contour interval of 1 foot (John S. Collins and Associates, 1980). The area is bordered by Castle Rock Drive and Lightning Drive.
For streams studied with and without consideration of levee, the 1- and 0.2-percent-annual-chance floodplain boundaries were delineated using the highest elevation for each condition. For Santa Cruz River, only the 1-percent-annual-chance floodplain boundary on the right overbank (looking downstream) was delineated without consideration of levee.

79
For each stream studied by detailed or detailed shallow-flooding methods as part of the 1983 updated study, the 1- and/or 0.2-percent-annual-chance floodplain boundaries have been delineated using the flood elevations determined at each cross section. Between cross sections, the boundaries were interpolated using topographic maps at scales of 1:2,400 and 1:4,800, with contour intervals of 2 and 4 feet, respectively (Cooper Aerial Survey Company, 1982, et cetera; Kinney Aerial Mapping, 1984 and 1985, respectively). These topographic maps were also used to revise floodplain boundaries on Rillito Creek between cross Sections AG and AI (from approximately 1,200 feet upstream of First Avenue to approximately 3,400 feet upstream of First Avenue).
Floodplain boundaries for Pantano Wash and Rincon Creek, as well as the upper reach of Agua Caliente Wash, were delineated using topographic maps at a scale of 1:2,400, with a contour interval of 2 feet (Cooper Aerial Survey Company, 1982, et cetera).
The boundaries that define the SFHAs on the alluvial fans south of the Tortolita Mountains were delineated on topographic maps at a scale of 1:24,000, with a contour interval of 20 feet (U.S. Department of the Interior, 1968, et cetera). These delineations were based on topographic and geomorphic information shown on aerial photographs (Cooper Aerial Survey Company, 1982, et cetera) and soils information provided by the Pima County DOTFCD (Pima County Department of Transportation and Flood Control District, 1987). Boundaries between flood depth and velocity zones were delineated on the aforementioned topographic maps at a scale of 1:24,000.
For streams studied by approximate or detailed shallow-flooding methods, 1-percent-annual-chance floodplain boundaries were developed from normal-depth calculations and previously referenced topographic maps and aerial photographs.
Along the entire length of the West Branch Santa Cruz River, approximate floodplain boundaries, which coincide with the stream channel, were delineated using the elevations determined in Section 3.2.
Floodplain boundaries for Sopori Wash were taken from the effective FIS for the unincorporated areas of Santa Cruz County (U.S. Department of Housing and Urban Development, 1980).
Approximate 1-percent-annual-chance floodplain boundaries in some portions of the study area were taken directly from the previous FIRM for Pima County.
For Silvercroft Wash and Tucson Arroyo, topographic maps at a scale of 1:4,800, with a contour interval of 2 feet (City of Tucson Department of Transportation, Drainage and Contour Maps), were used to delineate floodplain boundaries. Floodplain boundaries for Rillito Creek were developed using topographic maps at a scale of 1:1,200, with a contour interval of 2 feet (Kinney Aerial Survey, 1979).
80
For Julian Wash, from its confluence with the Santa Cruz River to Davis Street, and Enchanted Hills Wash, from its confluence with the West Branch Santa Cruz River to Mission Road, approximate floodplain boundaries that coincide with the stream channel were delineated using elevations determined in Section 3.2. For West Branch Santa Cruz River south of the Irvington Road alignment, approximate floodplain boundaries coincide with the stream channel. Approximate 1-percent-annual-chance flood boundaries for Arroyo Chico, downstream of the limit of detailed study below Campbell Avenue, were delineated on topographic maps at a scale of 1:2,400 (Cooper Aerial Survey Company, 1982, et cetera), based on the elevations determined by the methods described in Section 3.2.
Approximate 1-percent-annual-chance floodplain boundaries in some portions of the study area were taken directly from the previous FIRMs for the City of Tucson.
The 1- and 0.2-percent-annual-chance floodplain boundaries along the Santa Cruz River between a point approximately 3.73 miles downstream of Quarry Road to a point approximately 0.68 mile downstream of Quarry Road were delineated using updated topographic maps at a scale of 1:1,200, with a contour interval of 2 feet (Pima County Waste Water Management, Stock Topographic Maps, Marana, Arizona).
For the East Embankment of the SPRR, the 10-percent-annual-chance floodplain boundaries have been determined at each cross section. Between cross sections, the boundaries were interpolated using topographic maps at a scale of 1:2,400, with a contour interval of 2 feet (Cooper Aerial Survey Company, 1982, et cetera).
Along the southern bank of Canada del Oro Wash, the 0.2-percent-annual-chance flood is contained within the channel by the newly constructed embankment. However, in the reaches where the distance between the top of the embankment and the 0.2-percent-annual-chance water-surface elevation is less than 3 feet, there is a potential for flooding outside the embankment. In these reaches, the maximum extent of the 0.2-percent-annual-chance flood boundary was drawn on the maps, assuming no embankment. These boundaries were delineated on topographic maps at a scale of 1:2,400, with a contour interval of 2 feet (Cella Barr Associates, 1980).
Rooney Wash and the upstream portion of Oro Valley Wash are lined channels designed to convey the 1-percent-annual-chance flood discharge. In these cases, the edge of the channel was used as the 1-percent-annual-chance flood boundary. The limits of the 1-percent-annual-chance floodplain boundaries for Unnamed Wash and the lower portion of Oro Valley Wash were estimated based on the discharges in the reaches and channel geometry.
81
The September 30, 1992, revision for the City of Tucson included changes to the BFEs, and the 1- and 0.2-percent-annual-chance floodplain boundaries. The floodplain and floodway boundaries were delineated using topographic maps at a scale of 1”:2,400’, with a contour interval of 2 feet (Cooper Aerial Survey Company, June 29, 1984; Cooper Aerial Survey Company, May 1986; Grenier Engineering, January 1987) In the September 30, 1992, revision for the City of Tucson, the 1-percent-annual-chance floodplain and floodway boundaries and locations for Railroad and Rodeo Washes were plotted on topographic maps at a scale of 1”:2,400’ (City of Tucson Department of Transportation, Engineering Division, May 5, 1983). Cross-section data for the Navajo Wash (Cemetery, Flowing Wells, Navajo, and Wilson Washes) July 5, 1994, restudy, were obtained from field survey and mapping compiled from aerial photographs at a scale of 1:2,400, with 2-foot contour intervals (Cooper Aerial Survey Company, 1982, et cetera). Information relating to the geometry and hydraulic characteristics of all bridges and culverts was obtained through field investigations and as-built plans. Water-surface profiles for the 1-percent-annual-chance floods in the Navajo Wash restudy were computed using the USACE HEC-2 computer program (USACE, 1990).
A detailed drainage study for the area of the Town of Marana affected by
stormwater runoff emanating from Tortolita Mountain Watersheds was conducted in 2009 (CMG, 2009). Final flood hazard boundaries were mapped based on the combined results of the FLO-2D modeling and geomorphic analyses using a consolidated topographic dataset developed by using Pima Association of Government (PAG) DTM data from 2000 and 2005 along with grading plans for residential subdivisions built after 2000 (CMG, 2009).
For the flooding sources studied by approximate methods, the boundaries of the 1-
percent-annual-chance floodplains were delineated using topographic maps taken from the previously printed FIS reports, FHBMs, and/or FIRMs for all of the incorporated and unincorporated jurisdictions within Pima County.
The 1- and 0.2-percent annual chance floodplain boundaries are shown on the
FIRM (Exhibit 2). On this map, the 1-percent-annual-chance floodplain boundary corresponds to the boundary of the areas of special flood hazards (Zones A and AE), and the 0.2-percent annual chance floodplain boundary corresponds to the boundary of areas of moderate flood hazards. In cases where the 1- and 0.2-percent annual chance floodplain boundaries are close together, only the 1-percent-annual-chance floodplain boundary has been shown. Small areas within the floodplain boundaries may lie above the flood elevations but cannot be shown due to limitations of the map scale and/or lack of detailed topographic data.
For the streams studied by approximate methods, only the 1-percent-annual-chance
floodplain boundary is shown on the FIRM (Exhibit 2).

82
4.2 Floodways Encroachment on floodplains, such as structures and fill, reduces flood-carrying
capacity, increases flood heights and velocities, and increases flood hazards in areas beyond the encroachment itself. One aspect of floodplain management involves balancing the economic gain from floodplain development against the resulting increase in flood hazard. For purposes of the NFIP, a floodway is used as a tool to assist local communities in this aspect of floodplain management. Under this concept, the area of the 1-percent-annual-chance floodplain is divided into a floodway and a floodway fringe. The floodway is the channel of a stream, plus any adjacent floodplain areas, that must be kept free of encroachment so that the 1-percent-annual-chance flood can be carried without substantial increases in flood heights. Minimum federal standards limit such increases to 1.0 foot, provided that hazardous velocities are not produced. The floodways in this FIS are presented to local agencies as minimum standards that can be adopted directly or that can be used as a basis for additional floodway studies.
The floodways presented in this FIS were computed for certain stream segments on
the basis of equal conveyance reduction from each side of the floodplain. However, these computations assume stable channels and rigid boundaries. All streams with floodways, other than Rillito Creek; Canada del Oro Wash from approximately 4.8 miles upstream of its mouth to approximately 10.0 miles upstream of its mouth; and Ventana Canyon, Esperero, and Alamo Washes show conditions based on surveys done in 1976.
Most of the streams in Pima County do not have stable channels or rigid boundaries and high flows, such as in 1977 and 1978, have changed channel configurations in some areas. Because of the dynamic conditions, the usual dividing lines between floodways and floodway fringes are not permanent.
Many reaches of streams have hazardous flow velocities even without encroachment. These velocities should be accounted for by bank protection or other measures if floodplain development is considered. No encroachment was allowed at areas where average flow velocities exceeded 15 feet per second.
Floodway elevations for Tanque Verde Creek in the area of its confluence with Pantano Wash were based on the higher elevations on Pantano Wash. The two streams have a common floodplain and floodways computed separately overlap in this area; therefore, a more conservative approach was adopted and the higher elevations were used to compute a floodway in this area.
For Julian Wash upstream of the corporate limits at I-10, approximately one-third of the 1-percent-annual-chance flood discharge (2,500 cfs) overtops the northern bank and flows northwesterly as sheetflow. No floodway is presented on Julian Wash from upstream of the USACE flood channel to the upstream corporate limits because confining the overflow to the Julian Wash channel would cause surcharges greater than 1 foot or hazardous velocities. However, development in

83
this area should be restricted, especially at the divergence point, so as not to create surcharges greater than 1 foot and/or hazardous velocities.
No floodway was computed for the flow along U.S. Highway 89 from Sopori Wash. For streams studied without consideration of levees, floodways were computed on the basis of equal-conveyance reduction. Increases to the 1-percent-annual-chance elevations that were computed without the levees were limited to 1 foot, provided that hazardous velocities were not produced.
In cases where a floodway has been developed with and without consideration of levee for a watercourse, the composite floodway using the outermost floodway boundary should be used for regulatory purposes.
For the breakout analysis at the SPRR Spur embankment on the Santa Cruz River, an independent floodway analysis was performed. Encroachment was permitted on the right overbank using only the right overbank portion of the cross sections. No encroachment was allowed on the remaining portion of the cross section that included the main channel and left overbank.
Because of the shallow flooding and existing development along Alamo Wash, no floodway has been shown.
The revised floodways for Pantano and Agua Caliente Washes and Rincon Creek are a combination of equal-conveyance reduction and existing floodway configuration. The wider of the two floodways was adopted in this restudy. In some locations (particularly upstream reaches of Rincon Creek) where the existing floodway limits were outside of the 1-percent-annual-chance floodplain boundary of the 1985 and 1987 restudies, the 1-percent-annual-chance floodplain limits of the new study were adopted as floodway limits.
On the Santa Cruz River, south of the City of Tucson, from Pima Mine Road to approximately 1.04 miles downstream of US Highway 89 (Tucson Nogales Highway), floodway computations are based on the “without consideration of levee” condition. From approximately 1,490 feet downstream of Continental Road to approximately 2.12 miles upstream of Old Continental Road, no floodway is shown. Along this reach, floodflow will enter a west overflow channel and be separated from the main channel flow. The discharge entering the overflow channel depends on the upstream hydraulic conditions that are not stable. Because of the uncertainty in flow patterns and water-surface elevations, no floodway has been shown.
Upstream from Silverlake Road, the entire 1-percent-annual-chance floodplain of the Santa Cruz River is designated as a floodway because no significant encroachment is feasible due to steep banks and hazardous floodflow velocities. In a few small areas where the flood depths and velocities of flow may not be great, encroachment is not considered feasible because of the likelihood of bank

84
erosion. Downstream from Silverlake Road, there are several reaches where bank encroachment is possible and the floodway has been determined. The banks of the Santa Cruz River are susceptible to erosion from floodwater along much of the study reach.
No floodway analyses have been done for Los Robles, Brawley, and Blanco Washes in Avra Valley because hydraulic conditions are not stable and sources of flooding and flow patterns are not well defined. There are no well-defined channels that could carry even a 10-percent-annual-chance flood. No floodway has been shown for Rillito Creek from its mouth to approximately 0.42 mile upstream of I-10 because confining the overflow to the channel would result in surcharges greater than 1 foot. However, development in this area should be restricted, especially at the divergence point, so as not to create surcharges of greater than 1 foot or hazardous velocities.
A divided floodway analysis was performed for the main channel of Rillito Creek and the Rillito Creek North Overbank Diversion from the vicinity of North Campbell Avenue to approximately 975 feet upstream. The floodway for the main channel was determined using the entire flow from the south overbank and main channel and a portion of the flow from the north overbank. The floodway for Rillito Creek North Overbank Diversion was determined using the remaining north overbank flow. Elevations for the main channel based on encroachment were generally 1 foot higher than the elevations computed based on natural conditions.
Along the West Branch Santa Cruz River, all flooding has been designated as shallow flooding and, therefore, no floodway has been computed.
For the reach of Silvercroft Wash from downstream of Speedway Boulevard to its mouth, no floodway is presented. This is a highly developed area and a floodway would not be a useful management tool along this reach.
For the reach of Tucson Arroyo from Main Street to Park Avenue, a floodway is not suitable because the overflow area is almost fully developed. Encroachment was not allowed at Park Avenue because encroachment on that area would concentrate flow across Park Avenue and could increase damage to downstream properties. A small amount of water from Tucson Arroyo spills over the drainage divide into High School Wash.
The revised floodways for Pantano and Agua Caliente Washes are a combination of equal-conveyance reduction and existing floodway configuration. The wider of the two floodways was adopted in this restudy. In some locations where the existing floodway limits were outside of the 1-percent-annual-chance floodplain boundary of the 1983 and 1985 restudies, the 1-percent-annual-chance floodplain limits of the revised study were adopted as floodway limits.
85
Floodway data for Railroad and Rodeo Washes and Tucson Arroyo in the September 30, 1992, revision of the City of Tucson were computed using the USGS J635 computer program. No floodways were computed for the detailed studied streams as part of the Navajo Wash restudy.
Floodway widths were computed at cross sections. Between cross sections, the
floodway boundaries were interpolated. The results of the floodway computations are tabulated for selected cross sections (Table 8). The computed floodways are shown on the FIRM (Exhibit 2). In cases where the floodway and 1-percent-annual-chance floodplain boundaries are either close together or collinear, only the floodway boundary is shown.
Near the mouths of streams studied in detail, floodway computations are made
without regard to flood elevations on the receiving water body. Therefore, "Without Floodway" elevations presented in Table 8 for certain downstream cross sections of Airport Wash, Canada de Oro Wash, and Rillito Creek are lower than the regulatory flood elevations in that area, which must take into account the 1-percent-annual-chance flooding due to backwater from other sources.
Encroachment into areas subject to inundation by floodwaters having hazardous
velocities aggravates the risk of flood damage, and heightens potential flood hazards by further increasing velocities. A listing of stream velocities at selected cross sections is provided in Table 8, "Floodway Data." In order to reduce the risk of property damage in areas where the stream velocities are high, the community may wish to restrict development in areas outside the floodway.
The area between the floodway and 1-percent-annual-chance floodplain boundaries
is termed the floodway fringe. The floodway fringe encompasses the portion of the floodplain that could be completely obstructed without increasing the water-surface elevation of the 1-percent-annual-chance flood by more than 1.0 foot at any point. Typical relationships between the floodway and the floodway fringe and their significance to floodplain development are shown in Figure 1.
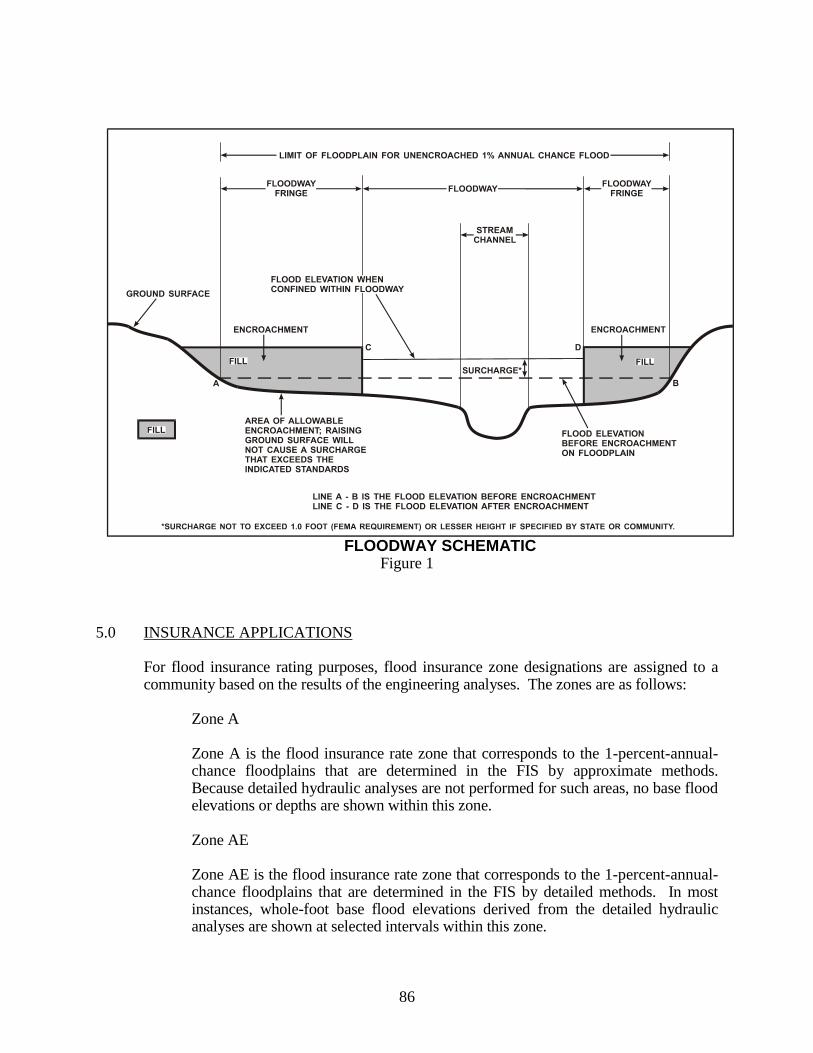
86
FLOODWAY SCHEMATIC Figure 1
5.0 INSURANCE APPLICATIONS For flood insurance rating purposes, flood insurance zone designations are assigned to a
community based on the results of the engineering analyses. The zones are as follows: Zone A Zone A is the flood insurance rate zone that corresponds to the 1-percent-annual-
chance floodplains that are determined in the FIS by approximate methods. Because detailed hydraulic analyses are not performed for such areas, no base flood elevations or depths are shown within this zone.
Zone AE Zone AE is the flood insurance rate zone that corresponds to the 1-percent-annual-
chance floodplains that are determined in the FIS by detailed methods. In most instances, whole-foot base flood elevations derived from the detailed hydraulic analyses are shown at selected intervals within this zone.

87
Zone AH Zone AH is the flood insurance rate zone that corresponds to the areas of 1-percent-
annual-chance shallow flooding (usually areas of ponding) where average depths are between 1 and 3 feet. Whole-foot base flood elevations derived from the detailed hydraulic analyses are shown at selected intervals within this zone.
Zone AO Zone AO is the flood insurance rate zone that corresponds to the areas of 1-percent-
annual-chance shallow flooding (usually sheet flow on sloping terrain) where average depths are between 1 and 3 feet. Average whole-foot depths derived from the detailed hydraulic analyses are shown within this zone.
Zone AR
Area of special flood hazard formerly protected from the 1-percent-annual-chance flood event by a flood control system that was subsequently decertified. Zone AR indicates that the former flood control system is being restored to provide protection from the 1-percent-annual-chance or greater flood event.
Zone A99 Zone A99 is the flood insurance rate zone that corresponds to areas of the 1-
percent-annual-chance floodplain that will be protected by a Federal flood protection system where construction has reached specified statutory milestones. No base flood elevations or depths are shown within this zone.
Zone V Zone V is the flood insurance rate zone that corresponds to the 1-percent-annual-
chance coastal floodplains that have additional hazards associated with storm waves. Because approximate hydraulic analyses are performed for such areas, no base flood elevations are shown within this zone.
Zone VE Zone VE is the flood insurance rate zone that corresponds to the 1-percent-annual-
chance coastal floodplains that have additional hazards associated with storm waves. Whole-foot base flood elevations derived from the detailed hydraulic analyses are shown at selected intervals within this zone.
Zone X Zone X is the flood insurance rate zone that corresponds to areas outside the 0.2-
percent annual chance floodplain, areas within the 0.2-percent annual chance floodplain, and to areas of 1-percent-annual-chance flooding where average depths

88
are less than 1 foot, areas of 1-percent-annual-chance flooding where the contributing drainage area is less than 1 square mile, and areas protected from the 1-percent-annual-chance flood by levees. No base flood elevations or depths are shown within this zone.
Zone D Zone D is the flood insurance rate zone that corresponds to unstudied areas where
flood hazards are undetermined, but possible. 6.0 FLOOD INSURANCE RATE MAP The FIRM is designed for flood insurance and floodplain management applications.
For flood insurance applications, the map designates flood insurance rate zones as described in Section 5.0 and, in the 1-percent annual chance floodplains that were studied by detailed methods, shows selected whole-foot BFEs or average depths. Insurance agents use the zones and BFEs in conjunction with information on structures and their contents to assign premium rates for flood insurance policies. For floodplain management applications, the map shows by tints, screens, and symbols, the 1- and 0.2-percent annual chance floodplains, floodways, and the locations of selected cross sections used in the hydraulic analyses and floodway computations. Panel number changes are shown in Table 9, “Panel Number Changes.” The countywide FIRM presents flooding information for the entire geographic area of Pima County. Previously, FIRMs were prepared for each incorporated community and the unincorporated areas of the county identified as floodprone. This countywide FIRM also includes flood-hazard information that was presented separately on Flood Boundary and Floodway Maps, where applicable. Historical data relating to the maps prepared for each community, up to and including the February 8, 1999, countywide study, are presented in Table 10, "Community Map History."
7.0 OTHER STUDIES This is a multi-volume FIS. Each volume may be revised separately, in which case it
supersedes the previously printed volume. Users should refer to the Table of Contents in Volume 1 for the current effective date of each volume; volumes bearing these dates contain the most up-to-date flood hazard data.
The data for the Santa Cruz River at the Pima-Santa Cruz County line agree with the data in the FIS for Santa Cruz County (U.S. Department of Housing and Urban Development, 1980). Two flood-damage reports are available for the Santa Cruz River (USACE, 1964; USACE, 1978). The reports are a summary of damages, and no profiles are shown.
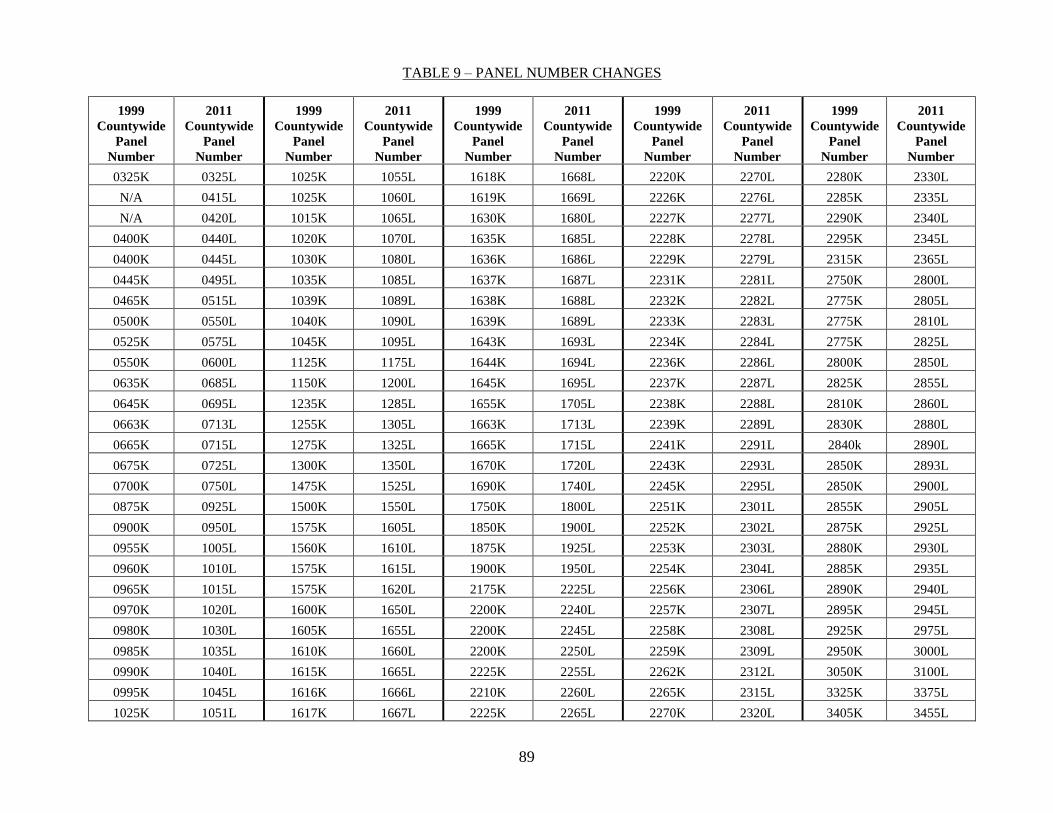
89
TABLE 9 – PANEL NUMBER CHANGES
1999
Countywide
Panel
Number
2011
Countywide
Panel
Number
1999
Countywide
Panel
Number
2011
Countywide
Panel
Number
1999
Countywide
Panel
Number
2011
Countywide
Panel
Number
1999
Countywide
Panel
Number
2011
Countywide
Panel
Number
1999
Countywide
Panel
Number
2011
Countywide
Panel
Number
0325K 0325L 1025K 1055L 1618K 1668L 2220K 2270L 2280K 2330L
N/A 0415L 1025K 1060L 1619K 1669L 2226K 2276L 2285K 2335L
N/A 0420L 1015K 1065L 1630K 1680L 2227K 2277L 2290K 2340L
0400K 0440L 1020K 1070L 1635K 1685L 2228K 2278L 2295K 2345L
0400K 0445L 1030K 1080L 1636K 1686L 2229K 2279L 2315K 2365L
0445K 0495L 1035K 1085L 1637K 1687L 2231K 2281L 2750K 2800L
0465K 0515L 1039K 1089L 1638K 1688L 2232K 2282L 2775K 2805L
0500K 0550L 1040K 1090L 1639K 1689L 2233K 2283L 2775K 2810L
0525K 0575L 1045K 1095L 1643K 1693L 2234K 2284L 2775K 2825L
0550K 0600L 1125K 1175L 1644K 1694L 2236K 2286L 2800K 2850L
0635K 0685L 1150K 1200L 1645K 1695L 2237K 2287L 2825K 2855L
0645K 0695L 1235K 1285L 1655K 1705L 2238K 2288L 2810K 2860L
0663K 0713L 1255K 1305L 1663K 1713L 2239K 2289L 2830K 2880L
0665K 0715L 1275K 1325L 1665K 1715L 2241K 2291L 2840k 2890L
0675K 0725L 1300K 1350L 1670K 1720L 2243K 2293L 2850K 2893L
0700K 0750L 1475K 1525L 1690K 1740L 2245K 2295L 2850K 2900L
0875K 0925L 1500K 1550L 1750K 1800L 2251K 2301L 2855K 2905L
0900K 0950L 1575K 1605L 1850K 1900L 2252K 2302L 2875K 2925L
0955K 1005L 1560K 1610L 1875K 1925L 2253K 2303L 2880K 2930L
0960K 1010L 1575K 1615L 1900K 1950L 2254K 2304L 2885K 2935L
0965K 1015L 1575K 1620L 2175K 2225L 2256K 2306L 2890K 2940L
0970K 1020L 1600K 1650L 2200K 2240L 2257K 2307L 2895K 2945L
0980K 1030L 1605K 1655L 2200K 2245L 2258K 2308L 2925K 2975L
0985K 1035L 1610K 1660L 2200K 2250L 2259K 2309L 2950K 3000L
0990K 1040L 1615K 1665L 2225K 2255L 2262K 2312L 3050K 3100L
0995K 1045L 1616K 1666L 2210K 2260L 2265K 2315L 3325K 3375L
1025K 1051L 1617K 1667L 2225K 2265L 2270K 2320L 3405K 3455L
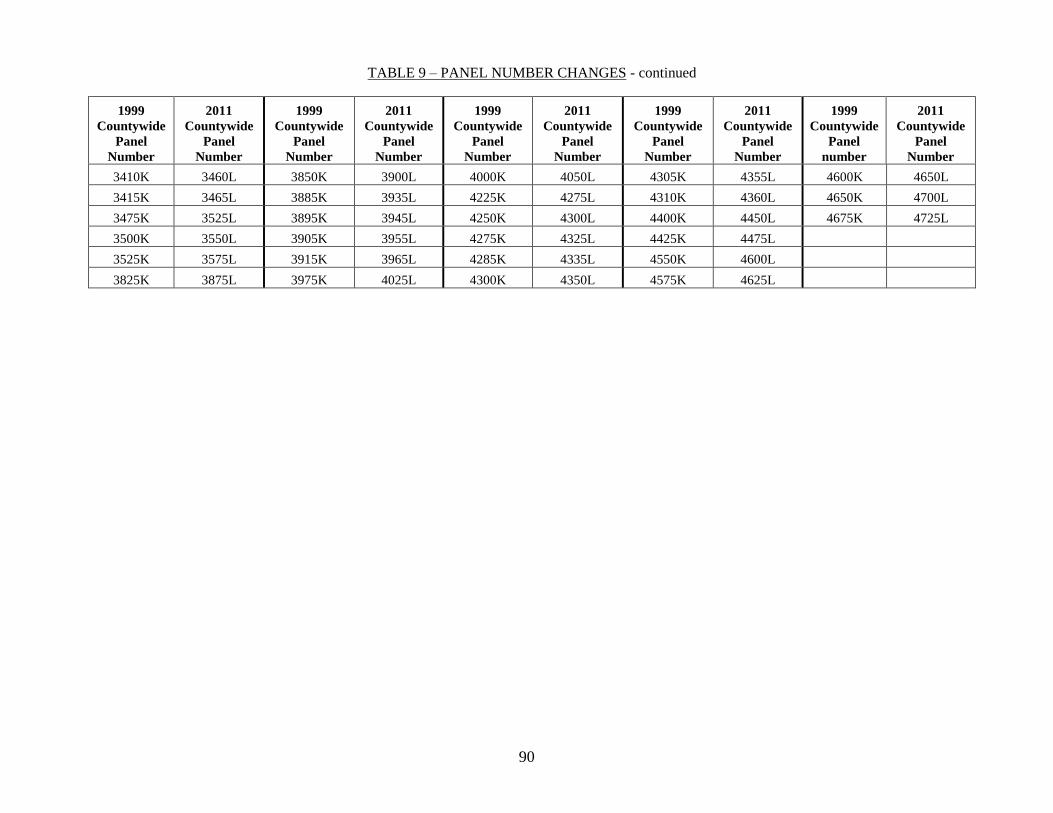
90
TABLE 9 – PANEL NUMBER CHANGES - continued
1999
Countywide
Panel
Number
2011
Countywide
Panel
Number
1999
Countywide
Panel
Number
2011
Countywide
Panel
Number
1999
Countywide
Panel
Number
2011
Countywide
Panel
Number
1999
Countywide
Panel
Number
2011
Countywide
Panel
Number
1999
Countywide
Panel
number
2011
Countywide
Panel
Number
3410K 3460L 3850K 3900L 4000K 4050L 4305K 4355L 4600K 4650L
3415K 3465L 3885K 3935L 4225K 4275L 4310K 4360L 4650K 4700L
3475K 3525L 3895K 3945L 4250K 4300L 4400K 4450L 4675K 4725L
3500K 3550L 3905K 3955L 4275K 4325L 4425K 4475L
3525K 3575L 3915K 3965L 4285K 4335L 4550K 4600L
3825K 3875L 3975K 4025L 4300K 4350L 4575K 4625L

COMMUNITY
NAME
INITIAL
IDENTIFICATION
FLOOD HAZARD
BOUNDARY MAP
REVISIONS DATE
FIRM
EFFECTIVE DATE
FIRM
REVISIONS DATE
Marana, Town of December 17, 1973 May 15, 1979 August 1, 1984 September 4, 1987
April 2, 1992
October 16, 1996
February 8, 1999
Oro Valley, Town of April 11, 1975 July 16, 1976 December 4, 1979 February 1, 1983
February 4, 1987
September 28, 1990
February 8, 1999
Pima County August 23, 1977 None February 15, 1983 September 6, 1989
(Unincorporated Areas) September 30, 1992
August 2, 1995
August 19, 1997
February 8, 1999
Sahuarita, Town of1
August 23, 1977 None February 15, 1983 August 19, 1997
February 8, 1999
South Tucson, City of2 August 2, 1974 December 5, 1975 August 2, 1982 January 6, 1988
February 8, 1999
1This community did not have its own FIRM prior to the February 8, 1999, FIS. The land area for this community was previously shown on the FIRM for the Unincorporated Areas of Pima County, but was not identified as a separate NFIP community. Therefore, the dates for this community were taken from the FIRM for the Unincorporated Areas of Pima County.
2This community did not have its own FIRM prior to the February 8, 1999, FIS. The land area for this community was previously shown on the FIRM for the City of Tucson, but was not identified as a separate NFIP community. Therefore, the dates for this community were taken from the FIRM for the City of Tucson.
TA
BL
E 1
0
FEDERAL EMERGENCY MANAGEMENT AGENCY
PIMA COUNTY, AZ AND INCORPORATED AREAS
COMMUNITY MAP HISTORY
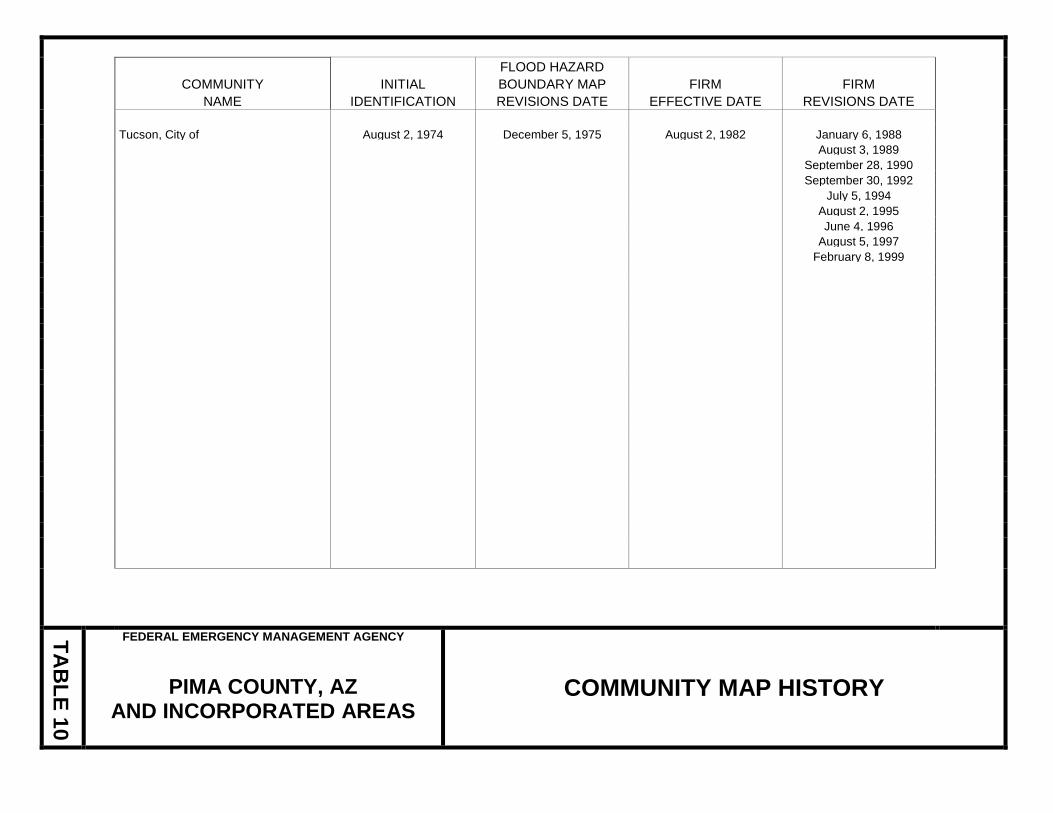
COMMUNITY
NAME
INITIAL
IDENTIFICATION
FLOOD HAZARD
BOUNDARY MAP
REVISIONS DATE
FIRM
EFFECTIVE DATE
FIRM
REVISIONS DATE
Tucson, City of August 2, 1974 December 5, 1975 August 2, 1982 January 6, 1988
August 3, 1989
September 28, 1990
September 30, 1992
July 5, 1994
August 2, 1995
June 4, 1996
August 5, 1997
February 8, 1999
TA
BL
E 1
0
FEDERAL EMERGENCY MANAGEMENT AGENCY
PIMA COUNTY, AZ AND INCORPORATED AREAS
COMMUNITY MAP HISTORY

93
The approximate floodplain boundaries shown at the Pima-Pinal County line are narrower in this study than those shown n the FIRM for Pinal County (FEMA, 1983) because the floodplain boundaries for this study were based on photographs of the October 1977 flood. A report completed in March 1978 shows areas of inundation and profiles of the 1-percent-annual-chance flood for the Avra Valley Stream Group (U.S. Department of the Interior, 1978). For this study, flood hazard information for the area was based mostly on the earlier report. In several areas, there were discrepancies between aerial-surveyed cross sections. Ground surveys showed the 1978 data to be less accurate than data for this FIS; therefore, where discrepancies exist, data for this FIS were used. Profiles for the middle reaches of the Avra Valley Stream Group were shown in the Roeske report (Arizona Department of Transportation, 1978).
Information pertaining to revised and unrevised flood hazards for each jurisdiction within Pima County has been compiled into this FIS. Therefore, this FIS supersedes all previously printed FIS Reports, FHBMs, FBFMs, and FIRMs for all of the incorporated and unincorporated jurisdictions within Pima County.
Several floodplain reports have been completed for streams in Pima County. The results of these reports were reviewed and, where appropriate, incorporated into this study. These reports include a hydrologic analysis for Alamo Wash, from Craycroft Road to the Rillito River (Buchanan-Colins-Johnson and Associates, Inc., 1981); floodplain delineations for the stabilization and flood-control project for Alamo Wash, from Craycroft Road to the Rillito River bank (Buchanan-Colins-Johnson and Associates, Inc., 1982); an amended FIS for the Rillito River, from Interstate Highway 10 to La Cholla Boulevard (Dooley-Jones and Associates, Inc., 1985); and an amended FIS for Canada del Oro Wash, from Overton Road to La Canada Drive (Dooley-Jones and Associates, Inc., 1985).
A USACE Floodplain Information (FPI) report was prepared for Rillito Creek and Pantano Wash (USACE, 1973). Cross-section data for Tanque Verde and Sabino Creeks were taken from another FPI report (USACE, 1975).
An urban development study for Enchanted Hills Wash at the confluence with Honey Bee Wash was used to check limits and depths of flooding in this braided channel reach (Pima County Department of Transportation and Flood Control District, 1987).
A design memorandum was used to determine channel capacity of Julian Wash where channel improvements have been made (USACE, 1962).
A 1975 USACE FPI report provided cross-section data for Tanque Verde Creek (USACE, 1975).
Discharge information from a 1978 report on flooding in Avra Valley was also used in the preparation of this study (U.S. Department of the Interior, 1978).

94
A portion of Canada del Oro Wash was restudied by Dooley-Jones and Associates in March 1985 to account for recent manmade changes (Dooley-Jones and Associates, Inc., 1985). This portion includes the reach of Canada del Oro Wash between Overton Road and La Canada Drive. The Pima County DOTFCD designed a flood-control project to alleviate flooding problems along Canada del Oro Wash in the Town of Oro Valley (Pima County Department of Transportation and Flood Control District, 1983). This project included construction of bank protection along the southern bank of Canada del Oro Wash as well as the northern bank for a short reach upstream of the bridge at La Canada Drive. This FIS report either supersedes or is compatible with all previous studies on streams studied in this report and should be considered authoritative for purposes of the NFIP.
8.0 LOCATION OF DATA Information concerning the pertinent data used in the preparation of this study can be
obtained by contacting FEMA, Federal Insurance and Mitigation Division, Federal Emergency Management Agency, 1111 Broadway, Suite 1200, Oakland, California 94607-4052.
9.0 BIBLIOGRAPHY AND REFERENCES
Ajo Copper News. (August 11 and 18, 1960; August 6, 1970). Ajo, Arizona. Arizona Department of Transportation. (1978). ADOT-R5-15-(121), Methods for Estimating the Magnitude and Frequency of Floods in Arizona. R.H. Roeske (author). Arizona Department of Water Resources. (Unpublished). Hydrologic Data for High School Wash, Citation Wash and Arroyo Chico. Arizona Water Commission. (October 1973). Report 4, Floodplain Delineation Criteria and Procedures. Buchanan-Collins-Johnson and Associates, Inc. (August 1981, Revised February 1982). Flood Plain Delineation for Existing Condition for Alamo Wash, Craycroft Road to Rillito River Bank Stabilization and Flood Control Project, Tucson, Arizona. Buchanan-Collins-Johnson and Associates, Inc. (May 1981). Hydrological Analysis for Alamo Wash, Craycroft Road to Rillito River. Tucson, Arizona. Buck Lewis and Associates, Job 857, Mission Road Area Drainage Study, Part 1, Tucson, Arizona. Cella Barr Associates. (October 2, 1990). Hydrologic/Hydraulic Analyses, Soldier Canyon Wash, Lot 53, La Bella Vista Subdivision, Finished Floor Elevation. Cella Barr Associates. (November 13, 1990). Tortolita Area/North Ranch Floodplain Analyses.

95
Cella Barr Associates. (February 1985). Town of Oro Valley, Arizona, Flood Insurance Study -- Hydrologic Analysis. Cella Barr Associates. (September 19, 1984). Pima County Flood Insurance Study -- Hydrologic Investigation. Cella Barr Associates. (March 13, 1984, Revised January 3, 1985). City of Tucson Flood Insurance Study -- Hydrology Investigation. Cella Barr Associates. (November 10, 1981). Report on Existing 100-Year Flooding Conditions Within the Gardner Lane Area, City of Tucson. Cella Barr Associates. (1980). Topographic Maps, Scale 1:2,400, Contour Interval 2 feet. Cella Barr Associates. (August 1979). Appeal to Flood Insurance Rate Map, Flood Boundary and Floodway Map -- Vicinity of Hill Farm Subdivision, Scale 1:1,200, Contour Interval 2 feet. Cella Barr Associates. (August 1979). Floodway Delineations -- Rillito Creek, Vicinity of Dodge Boulevard, Scale 1:1,200, Contour Interval 2 feet. Cella, Barr, Evans & Associates. (May 1978). Job 75 290 204 01, Flooding - Hydrologic and Hydraulic Investigation for Rancho Vistoso. Chow, Ven T. (1966). Handbook of Applied Hydrology, New York: McGraw-Hill Book Company. City of Tucson. (February 1990). Standards Manual for Drainage Design and Floodplain Management in Tucson, Arizona. City of Tucson. (March 29, 1989). Aerial Photograph, Alvernon Way 100-Year Floodplain. City of Tucson Department of Transportation. (January 8, 1988). As-Built Plans, Alvernon Way - Ft. Lowell Road to Grant Road. City of Tucson Department of Transportation, Engineering Division. (May 5, 1983, flown by Cooper Aerial Survey Company, Tucson, Arizona). Orthophoto Contour Maps, Scale 1:2,400, Contour Interval 2 feet. City of Tucson. (May 5, 1983). Aerial Topographic Work Map, Flood Insurance Study, City of Tucson, Scale 1"=200', Contour Interval 2 feet. City of Tucson Department of Transportation, Engineering Division. (April 1982). Flood Peak Estimator. City of Tucson Department of Transportation, Engineering Division. (1943). E-39, Flood Study, City of Tucson, Arizona.
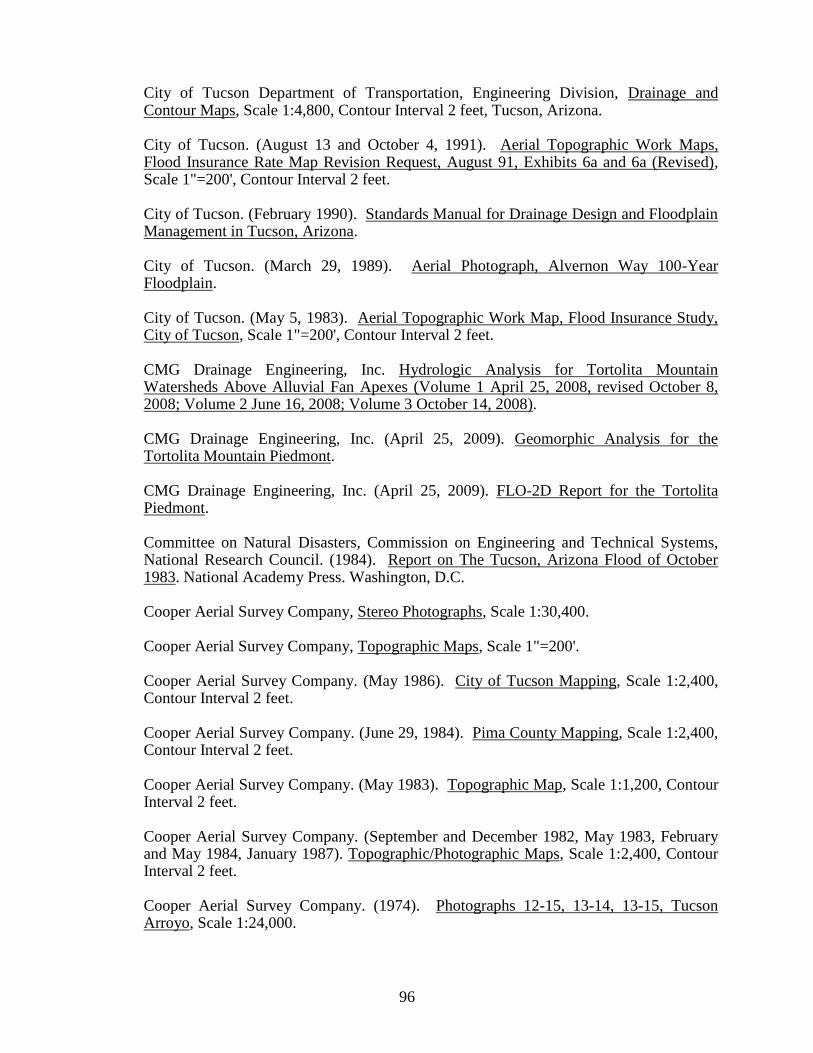
96
City of Tucson Department of Transportation, Engineering Division, Drainage and Contour Maps, Scale 1:4,800, Contour Interval 2 feet, Tucson, Arizona. City of Tucson. (August 13 and October 4, 1991). Aerial Topographic Work Maps, Flood Insurance Rate Map Revision Request, August 91, Exhibits 6a and 6a (Revised), Scale 1"=200', Contour Interval 2 feet. City of Tucson. (February 1990). Standards Manual for Drainage Design and Floodplain Management in Tucson, Arizona. City of Tucson. (March 29, 1989). Aerial Photograph, Alvernon Way 100-Year Floodplain. City of Tucson. (May 5, 1983). Aerial Topographic Work Map, Flood Insurance Study, City of Tucson, Scale 1"=200', Contour Interval 2 feet. CMG Drainage Engineering, Inc. Hydrologic Analysis for Tortolita Mountain Watersheds Above Alluvial Fan Apexes (Volume 1 April 25, 2008, revised October 8, 2008; Volume 2 June 16, 2008; Volume 3 October 14, 2008). CMG Drainage Engineering, Inc. (April 25, 2009). Geomorphic Analysis for the Tortolita Mountain Piedmont. CMG Drainage Engineering, Inc. (April 25, 2009). FLO-2D Report for the Tortolita Piedmont. Committee on Natural Disasters, Commission on Engineering and Technical Systems, National Research Council. (1984). Report on The Tucson, Arizona Flood of October 1983. National Academy Press. Washington, D.C. Cooper Aerial Survey Company, Stereo Photographs, Scale 1:30,400. Cooper Aerial Survey Company, Topographic Maps, Scale 1"=200'. Cooper Aerial Survey Company. (May 1986). City of Tucson Mapping, Scale 1:2,400, Contour Interval 2 feet. Cooper Aerial Survey Company. (June 29, 1984). Pima County Mapping, Scale 1:2,400, Contour Interval 2 feet. Cooper Aerial Survey Company. (May 1983). Topographic Map, Scale 1:1,200, Contour Interval 2 feet. Cooper Aerial Survey Company. (September and December 1982, May 1983, February and May 1984, January 1987). Topographic/Photographic Maps, Scale 1:2,400, Contour Interval 2 feet. Cooper Aerial Survey Company. (1974). Photographs 12-15, 13-14, 13-15, Tucson Arroyo, Scale 1:24,000.
97
Dawdy, David R. (1979). Flood Frequency Estimates on Alluvial Fans, Journal of the Hydraulic Division, American Society of Civil Engineers, Proceedings, Vol. 105, No. HYII, pp. 1407-1413. Dooley-Jones and Associates, Inc. (Revised July 2, 1985). Amended Flood Insurance Study for Rillito River from Interstate 10 to La Cholla Boulevard, Tucson, Arizona. Dooley-Jones and Associates, Inc. (October 22, 1984, Revised March 22, 1985). Amended Flood Insurance Study for Canada del Oro Wash from Overton Road to La Canada Drive, Tucson, Arizona. Dooley-Jones and Associates, Inc. (Revised June 1, 1981). Rillito Bank Protection, Racquet Club, Scale 1:1,200, Contour Interval 1 foot. Dooley-Jones and Associates, Inc. (Tucson, Arizona, August 1980). The Lakes at Castle Rock Grading and Paving Plans, Scale 1:480, Contour Interval 0.5 foot. Federal Emergency Management Agency. (August 19, 1997). Flood Insurance Study, Pima County, Arizona (Unincorporated Areas). Washington, D.C. Federal Emergency Management Agency. (August 5, 1997). Flood Insurance Study, City of Tucson, Pima County, Arizona. Washington, D.C. Federal Emergency Management Agency. (October 16, 1996). Flood Insurance Study, Town of Marana, Pima County, Arizona. Washington, D.C. Federal Emergency Management Agency. (September 28, 1990). Flood Insurance Study, Town of Oro Valley, Pima County, Arizona. Washington, D.C. Federal Emergency Management Agency. (August 15, 1983). Flood Insurance Study, Pinal County, Arizona (Unincorporated Areas). Washington, D.C. Federal Emergency Management Agency. (December 4, 1979). Flood Insurance Study, Town of Oro Valley, Pima County, Arizona, Washington, D.C. Greiner Engineering. (August 1987, Partly Revised February 14 and March 14, 1990). Hydraulic Analysis of Tanque Verde Creek, Sabino Canyon Road to Tanque Verde Road. Greiner Engineering. (January 1987). Tanque Verde Creek Flood Boundary Map, Scale 1:2,400, Contour Interval 2 feet. Greiner Engineering. (December 1986). The Este Wash Basin Management Study. Henderson, F.M. (1966). Open-Channel Flow, New York: MacMillan. Hydro Software, Inc. (October 1984). Hydrologic Evaluation of Santa Cruz Basin, Arizona. Hydro-Science Engineering Southwest, Inc. (September 1987). Map of Agua Caliente Wash at Fort Lowell Road, Scale 1:1,200, Contour Interval 1 foot.

98
John S. Collins and Associates. (Tucson, Arizona, June 1980). Castle Rock/Lightening “A” Ranch, Grading and Paving Plans, Scale 1:480, Contour Interval 1 foot. Johnson-Brittain Associates. (1986). Hydrologic/Hydraulic Investigation for Sixth Avenue, Grant to Drachman. Johnson-Brittain Associates. (1986). Hydrologic/Hydraulic Report for Speedway Boulevard, Silverbell Road to Santa Cruz River District Pavement Improvement. King, H.W. and E.F. Brater. (1963). King’s Handbook of Hydraulics, Fifth Edition, New York: McGraw-Hill Book Company. King, H.W. and E.F. Brater. (1954). Handbook of Hydraulics, Fourth Edition, New York: McGraw-Hill Book Company. Kinney Aerial Mapping. (August 1984, January 1985). Topographic Maps, Scale 1:4,800, Contour Interval 4 feet Kinney Aerial Survey. (August 17, 1979). Topographic Maps, Rillito Creek, Arizona, Scale 1:1,200, Contour Interval 2 feet. Kucera and Associates, Inc. (1976). Aerial and Ground Surveying, City of Tucson. Kucera and Associates, Inc. (1976). Topographic Maps of Major Streams in Pima County, Arizona, Scale 1:4,800, Contour Interval Varies. Kucera and Associates, Inc. (November 3 and 4, 1976). Aerial Photographs and Maps, City of Tucson and Pima County, Arizona, Scale 1:14,000. Lind/Jensen & Associates, Inc. (August 26, 1991). Topographic Work Map, Pima Hollow Patio Homes, Lots 1-58, Scale 1"=50'. Osborn, Petterson, Walbert and Associates. (March 21, 1990). Aerial Topographic Work Map, Aerial Photograph, Brentwood Estates, Scale 1"=200', Contour Interval 2 feet. Osborn, Petterson, Walbert and Associates. (January 1990). Topographic Work Map, FEMA Appeal for Hidden Hills Wash at Eastwood, Scale 1"=200', Contour Interval 2 feet. Pima County Department of Transportation and Flood Control District. (March 1987). Appeal to the Restudy of the Pima County Flood Insurance Study. Pima County Department of Transportation and Flood Control District. (1983). Topographic Maps, Scale 1:1,200, Contour Interval 1 foot. Pima County Department of Transportation and Flood Control District. (November 1983). Canada del Oro Wash Flood Control Project, Bank Protection Plans. Pima County Department of Transportation and Flood Control District. (March 1982). Storm Drain Design Guidelines and Standard Plans.
99
Pima County Department of Transportation and Flood Control District. (September 1979). Hydrology Manual for Engineering Design and Floodplain Management Within Pima County, Arizona. Pima County Department of Transportation and Flood Control District. (Undated). Final Documentation, October 1983 Flood Damage Report, Pima County Board of Supervisors/Board of Directors. Pima County Flood Control District and Town of Marana (September 1998). Lower Santa Cruz levee (Continental Ranch to Sanders Road). Pima County Flood Control District. (August 1978). Analysis of Santa Cruz River Floods in Tucson, Including the Largest Flood of Record that Occurred in October 1977. B.M. Reich (author). Pima County Flood Control District. (1976). Magnitude and Frequency of Floods, CRC Critical Reviews in Environmental Control, Volume 6. B.M. Reich (author). Pima County Waste Water Management, Stock Topographic Maps, Marana, Arizona, Scale 1:1,200, Contour Interval 2 feet. SAS Institute, Inc. (1976). A User’s Guide to SAS (Statistical Analysis System) 76. A.J. Barr, et al. (author). Raleigh, North Carolina. Sellers, W. D. and R. H. Hill. (1974). Arizona Climate: Tucson, University of Arizona Press. Settlemeyer Surveys. (April 22, 1990, Revised November 29, 1990). Site Plan, Snow Residence, La Bella Vista, Lot 53, Pima County, Arizona, Scale 1"=20'. Simons, Li & Associates, Inc. (June 25, 1991). Flood-Hazard Boundary Map for a Segment of Pima Wash Located About One-Half Mile North of Ina Road, Scale 1"=200', Contour Interval 2 feet. Simons, Li & Associates, Inc. (June 6, 1991). Request for a Letter of Map Revision for a Segment of Pima Wash Located About One-Half Mile North of Ina Road in Pima County, Arizona. Simons, Li & Associates, Inc. (February 1990). Work Maps, Flood Insurance Study of Tucson, Arizona, FIRM/Alamo Wash, Scale 1"=200', Contour Interval 2 feet. Sverdrup and Associates. (1984). Hydrologic/Hydraulic Report for Fort Lowell Road, Country Club to Walnut Avenue District Paving Improvement. U.S. Army Corps of Engineers. (September 1990). HEC-2 Water-Surface Profiles, Generalized Computer Program, Version 2.5. U.S. Army Corps of Engineers, Hydrologic Engineering Center. (November 1976, Updated 1984). HEC-2 Water-Surface Profiles, Generalized Computer Program. Davis, California.

100
U.S. Army Corps of Engineers, Los Angeles District. (1978). Flood Damage Report on Storm and Flood of October 6-10, 1977, Santa Cruz, Gila, and San Pedro Rivers, Arizona. U.S. Army Corps of Engineers, Los Angeles District. (August 1975). Flood Plain Information, Tanque Verde Creek and Tributaries, Vicinity of Tucson, Arizona. U.S. Army Corps of Engineers, Los Angeles District. (1973). Flood Plain Information, Rillito River and Pantano Wash, Vicinity of Tucson, Arizona. U.S. Army Corps of Engineers, Los Angeles District. (1964). Flood Damage Report on Storm and Flood of September 9-11, 1964, Upper Santa Cruz River, Southern Arizona. U.S. Army Corps of Engineers, Los Angeles District. (1962). Design Memorandum No. 1, General Design for Tucson Diversion Channel, Tucson, Arizona. Los Angeles, California. U.S. Army Corps of Engineers, Los Angeles District. (1959). Review Report of Interim Survey for Flood Control - Tucson, Arizona and Vicinity. U.S. Department of Agriculture, Agricultural Research Service. (October 1973). Technical Bulletin No. 1468, Linear Theory of Hydrologic Systems. U.S. Department of Agriculture, Soil Conservation Service. (1965). Technical Release No. 20, Project Formulation - Hydrology. U.S. Department of Agriculture, Soil Conservation Service. (1936). Photographs L285, L286, Quadrangle 430, Tucson Arroyo, Scale 1:30,400. U.S. Department of Commerce, Bureau of the Census. (1991). 1990 Census of Data, Arizona. U.S. Department of Commerce. (December 1965). Hydraulic Engineering Circular No. 5, Hydraulic Charts for the Selection of Highway Culverts. U.S. Department of Housing and Urban Development, Federal Insurance Administration. (February 1980). Flood Insurance Study, Santa Cruz County, Arizona (Unincorporated Areas). U.S. Department of the Interior, Geological Survey. (1989). Water Resources Data, Arizona. U.S. Department of the Interior, Geological Survey. (Oro Valley, Arizona, 1981). 15-Minute Series Topographic Maps, Scale 1:62,500, Contour Interval 80 feet. U.S. Department of the Interior, Geological Survey. (March 1978). Areas Subject to Inundation by the 100-Year Flood in Avra Valley, Pima County, Arizona. U.S. Department of the Interior, Geological Survey. (1976). Open-File Report 76-499, Computer Applications for Step-Backwater and Floodway Analysis. J.O. Shearman (author).

101
U.S. Department of the Interior, Geological Survey. (1974). Delineation of Flood Hazards in the Marana Quadrangle, Pima County, Arizona. U.S. Department of the Interior, Geological Survey. (Catalina Mountains, Arizona, 1973; Jaynes, Arizona, 1978; Tucson, Arizona, 1973; Tucson East, Arizona, 1978; Tucson North, Arizona, 1974; Tucson Southwest, Arizona, 1978). 7.5-Minute Series Flood-Prone Area Maps, Scale 1:24,000. U.S. Department of the Interior, Geological Survey. (1971). Water Resources Data for Arizona, Part I, Surface Water Records. Tucson, Arizona. U.S. Department of the Interior, Geological Survey. (1970). Water-Supply Paper 1939A, Streamflow in the Upper Santa Cruz River Basin, Santa Cruz and Pima Counties, Arizona. A. Condes de la Torre (author). U.S. Department of the Interior, Geological Survey. (1970). Water-Supply Paper 1840-C, Floods from Thunderstorms of July-September in Arizona. U.S. Department of the Interior, Geological Survey. (1970). Water-Supply Paper 1850-C, Floods of November 1965 to January 1966 in the Gila River Basin, Arizona and New Mexico, and Adjacent Basins in Arizona. U.S. Department of the Interior, Geological Survey. (1970). Water-Supply Paper 1939-B, Depletion of Streamflow by Infiltration in the Main Channels of the Tucson Basin, Southeastern Arizona. D.E. Burkham (author). U.S. Department of the Interior, Geological Survey. (August 1970). Open-File Report, A Proposed Streamflow Data Program for Arizona. O. Moosburner (author). U.S. Department of the Interior, Geological Survey. (Cat Mountains, Arizona, 1968, Photorevised 1975; Tucson, Arizona, 1946, Photorevised 1971 and 1975; Tucson East, Arizona, 1957, Photorevised 1971 and 1975; Tucson Southwest, Arizona, 1968, Photorevised 1975; Jaynes, Arizona, 1968, Photorevised 1971; Tucson North, Arizona, 1957, Photorevised 1971 and 1975; Marana, Arizona, 1967; Ruelas Canyon, Arizona, 1968, Photorevised 1975). 7.5-Minute Series Topographic Maps, Scale 1:24,000, Contour Intervals 10, 20, and 40 feet U.S. Department of the Interior, Geological Survey. (1967). Water-Supply Paper 1849, Roughness Characteristics of Natural Channels. H.H. Barnes, Jr. (author). U.S. Department of the Interior, Geological Survey. (1966). Water-Supply Paper 1683, Magnitude and Frequency of Floods in the United States, Part 9, Colorado River Basins. J.L Patterson and W.P. Somers (authors). U.S. Department of the Interior, Geological Survey. Data for West Branch Santa Cruz River, Alamo Wash, Arcadia Wash, Cemetery Wash, Flowing Wells Wash, High School Wash, Railroad Wash, Robb Wash, and Rodeo Wash. Tucson, Arizona. U.S. Department of the Interior, Geological Survey. Techniques of Water Resources Investigations, Book 7, Chapter C3.
102
U.S. Department of Transportation, Federal Highway Administration. (1986, Updated June 1, 1988). FHWA RD-86-108, Bridge Waterways Analysis Model/Research Report, WSPRO. Shearman, J.O., and Others (authors). U.S. Department of Transportation, Federal Highway Administration, Bureau of Public Roads. (1970). Hydraulic Design Series No. 1, Second Edition. U.S. Water Resources Council. (March 1976 and June 1977, respectively). Bulletin Nos. 17 and 17A, Guidelines for Determining Flood Flow Frequency. University of Arizona. (1965). Normal Annual Precipitation 1931-1960, State of Arizona. WBC Consultants, Inc. (April 1979). Santa Cruz River Flood Study, Scale 1:4,800, Contour Interval 2 feet, Tucson, Arizona.
103
10.0 REVISION DESCRIPTIONS
This section has been added to provide information regarding significant revisions made since the original Flood Insurance Study was printed. Future revisions may be made that do not result in the republishing of the Flood Insurance Study report. To assure that any user is aware of all revisions, it is advisable to contact the community repository of flood-hazard data. 10.1 Revision – September 28, 2012 The previous study was revised on September 28, 2012 to incorporate the Physical Map Revision (PMR) for the Agua Caliente Wash, the Agua Caliente Split Flow and the Agua Caliente Spur Flow. This work was completed by WEST Consultants in consultation with the Pima County Regional Flood Control District and was completed in July 2010. The final CCO meeting was held on August 16, 2011 and was attended by representatives of the City of Tucson, the Pima County Flood Control District, the Arizona Department of Water Resources and FEMA. The streams affected by this study include:
Agua Caliente Wash – from its confluence with Tanque Verde Creek to approximately 740 feet downstream of the Coronado State Forest boundary
Agua Caliente Split Flow – from its divergence from Agua Caliente Wash to its confluence with Tanque Verde Creek
Agua Caliente Spur Flow – from its divergence from Agua Caliente Wash to its
confluence with Agua Caliente Split Flow Hydrologic Analysis There was no revised hydrologic analysis for this PMR but the flow distribution between the Agua Caliente Wash, the Agua Caliente Split Flow and the Agua Caliente Spur Flow was revised to reflect new topographic data and updates to flood control structures. Table 6 has been updated to reflect these changes. Hydraulic Analysis The hydraulic analyses were conducted using HEC-RAS version 4.0. Many of the cross sections from the effective HEC-2 model were realigned and additional cross sections were added. Therefore, the cross sections do not correspond to the currently effective model. The cross sections were oriented perpendicular to the flow direction in the channel and the floodplain. The cross section spacing generally varied from 100 feet to 400 feet. The Manning’s n values were determined from aerial photos and field observations of the study area. Generally the roughness values varied horizontally in the overbank areas. The contraction coefficients generally vary between 0.1 and 0.3 and the expansion coefficients vary between 0.3 and 0.5. There are several locations where the flow naturally contracts and expands because of the physical characteristics of the geometry of the wash and the topography in the overbank area. These locations are identified from field observations and an examination of the topographic maps. Flow also contracts and expands at locations such as at the ends of the soil cement levees and through the Tanque Verde Road and Houghton Road Bridges.

104
It was determined that two flow splits occur from Agua Caliente Wash and the HEC-RAS model includes junctions and flowpaths to model these flow splits. The first split flow is the Agua Caliente Spur Flow that breaks out from the left bank of Agua Caliente Wash around the spur dike upstream of Tanque Verde Road. The second split flow is the Agua Caliente Split Flow that breaks out from the left bank of Agua Caliente Wash upstream of Houghton Road. The Agua Caliente Spur Flow meets the Agua Caliente Split Flow which then confluences with Tanque Verde Creek. The discharge in the main channel and split flows was computed using the HEC-RAS split flow optimization option. Two bridges were modeled for this revision, Houghton Road and Tanque Verde Road. There are several other road crossings but they have not been modeled because they are low water crossings and do not have a significant effect on the hydraulics. However, the contraction/expansion coefficients at the cross section locations at the low water crossing shave been increased to account for additional losses. The spur dike structure on the east bank of Agua Caliente Wash was constructed by the Flood Control District to divert flood flows in the east overbank into the main channel of Agua Caliente Wash. As part of this revision the Flood Control District conducted improvements to that structure and to the west bank structure to meet FEMA freeboard requirements. Floodplain Boundaries The 1% and 0.2% annual chance floodplain boundaries were delineated on topographic data provided by the Flood Control District at a scale of 1 inch = 200 feet and at a contour interval of 2 feet. Based on engineering judgment, an area of high ground upstream of the spur dike was added to the 1% annual chance floodplain even though calculated water surface elevations were not sufficient to show inundation. Also included in the 1% annual chance floodplain was the area near the confluence of the Agua Caliente Split Flow, the Agua Caliente Spur Flow and Tanque Verde Creek upstream of Houghton Road. Although not modeled as such this area is likely to experience shallow sheet flow. Floodways The improvements to the levees were intended to remove the undesirable situation of a floodway in the urbanized left bank of the Agua Caliente Spur Flow reach. Flow that flanks the east end of the spur dike has historically been overbank flow; the spur dike reduces the amount of this flow in the left overbank. Therefore, the flow in the left overbank has a reduced flow profile and a floodway did not need to be analyzed or delineated.