and Distributions - UMasspeople.umass.edu/bethanyb/Bradley et al., 2012 DDI.pdf ·...
13
BIODIVERSITY RESEARCH Predicting how adaptation to climate change could affect ecological conservation: secondary impacts of shifting agricultural suitability Bethany A. Bradley 1 *, Lyndon D. Estes 2 , David G. Hole 3 , Stephen Holness 4,5 , Michael Oppenheimer 2,6 , Will R. Turner 3 , Hein Beukes 7 , Roland E. Schulze 8 , Mark A. Tadross 9 and David S. Wilcove 2,10 INTRODUCTION Climate change directly threatens a significant fraction of the Earth’s species. Changing precipitation and temperature condi- tions likely will alter the geographical ranges of species and may drive many to extinction (Parmesan & Yohe, 2003; Thomas et al., 2004). Climate change is also likely to trigger a wide range of secondary impacts, whereby efforts by people to mitigate and 1 Department of Environmental Conservation, University of Massachusetts, Amherst, MA 01003, USA, 2 Program in Science, Technology, and Environmental Policy, Woodrow Wilson School, Princeton University, Princeton, NJ 08544, USA, 3 Science and Knowledge Division, Conservation International, Arlington, VA 22202, USA, 4 Park Planning and Development Conservation Services, South African National Parks, Humewood 6013, South Africa, 5 Center for African Conservation Ecology, Department of Zoology, Nelson Mandela Metropolitan University, Port Elizabeth 6013, South Africa, 6 Department of Geosciences, Princeton University, Princeton, NJ 08544, USA, 7 Institute for Soil, Climate, and Water, Agricultural Research Council, Stellenbosch 2599, South Africa, 8 School of Bioresources Engineering and Environmental Hydrology, University of KwaZulu-Natal, Pietermaritzburg 3209, South Africa, 9 Climate Systems Analysis Group, University of Cape Town, Rondebosch 7701, South Africa, 10 Department of Ecology and Evolutionary Biology, Princeton University, Princeton, NJ 08544, USA *Correspondence: Bethany A. Bradley, Department of Environmental Conservation, University of Massachusetts, Amherst, MA 01003, USA. E-mail: [email protected] ABSTRACT Aim: Ecosystems face numerous well-documented threats from climate change. The well-being of people also is threatened by climate change, most prominently by reduced food security. Human adaptation to food scarcity, including shifting agricultural zones, will create new threats for natural ecosystems. We investigated how shifts in crop suitability because of climate change may overlap currently protected areas (PAs) and priority sites for PA expansion in South Africa. Predicting the locations of suitable climate conditions for crop growth will assist conservationists and decision-makers in planning for climate change. Location: South Africa. Methods: We modelled climatic suitability in 2055 for maize and wheat cultivation, two extensively planted, staple crops, and overlaid projected changes with PAs and PA expansion priorities. Results: Changes in winter climate could make an additional 2 million ha of land suitable for wheat cultivation, while changes in summer climate could expand maize suitability by up to 3.5 million ha. Conversely, 3 million ha of lands currently suitable for wheat production are predicted to become climatically unsuitable, along with 13 million ha for maize. At least 328 of 834 (39%) PAs are projected to be affected by altered wheat or maize suitability in their buffer zones. Main conclusions: Reduced crop suitability and food scarcity in subsistence areas may lead to the exploitation of PAs for food and fuel. However, if reduced crop suitability leads to agricultural abandonment, this may afford opportunities for ecological restoration. Expanded crop suitability in PA buffer zones could lead to additional isolation of PAs if portions of newly suitable land are converted to agriculture. These results suggest that altered crop suitability will be widespread throughout South Africa, including within and around lands identified as conservation priorities. Assessing how climate change will affect crop suitability near PAs is a first step towards proactively identifying potential conflicts between human adaptation and conservation planning. Keywords Adaptation, climate change, crop suitability, indirect impacts, maize, South Africa, species distribution modelling, wheat. Diversity and Distributions, (Diversity Distrib.) (2012) 18, 425–437 DOI: 10.1111/j.1472-4642.2011.00875.x ª 2012 Blackwell Publishing Ltd http://wileyonlinelibrary.com/journal/ddi 425 A Journal of Conservation Biogeography Diversity and Distributions
Transcript of and Distributions - UMasspeople.umass.edu/bethanyb/Bradley et al., 2012 DDI.pdf ·...

BIODIVERSITYRESEARCH
Predicting how adaptation to climatechange could affect ecologicalconservation: secondary impacts ofshifting agricultural suitability
Bethany A. Bradley1*, Lyndon D. Estes2, David G. Hole3, Stephen Holness4,5,
Michael Oppenheimer2,6, Will R. Turner3, Hein Beukes7, Roland E. Schulze8,
Mark A. Tadross9 and David S. Wilcove2,10
INTRODUCTION
Climate change directly threatens a significant fraction of the
Earth’s species. Changing precipitation and temperature condi-
tions likely will alter the geographical ranges of species and may
drive many to extinction (Parmesan & Yohe, 2003; Thomas
et al., 2004). Climate change is also likely to trigger a wide range
of secondary impacts, whereby efforts by people to mitigate and
1Department of Environmental Conservation,
University of Massachusetts, Amherst, MA
01003, USA, 2Program in Science, Technology,
and Environmental Policy, Woodrow Wilson
School, Princeton University, Princeton, NJ
08544, USA, 3Science and Knowledge
Division, Conservation International,
Arlington, VA 22202, USA, 4Park Planning
and Development Conservation Services,
South African National Parks, Humewood
6013, South Africa, 5Center for African
Conservation Ecology, Department of Zoology,
Nelson Mandela Metropolitan University,
Port Elizabeth 6013, South Africa,6Department of Geosciences, Princeton
University, Princeton, NJ 08544, USA,7Institute for Soil, Climate, and Water,
Agricultural Research Council, Stellenbosch
2599, South Africa, 8School of Bioresources
Engineering and Environmental Hydrology,
University of KwaZulu-Natal,
Pietermaritzburg 3209, South Africa, 9Climate
Systems Analysis Group, University of Cape
Town, Rondebosch 7701, South Africa,10Department of Ecology and Evolutionary
Biology, Princeton University, Princeton, NJ
08544, USA
*Correspondence: Bethany A. Bradley,
Department of Environmental Conservation,
University of Massachusetts, Amherst, MA
01003, USA.
E-mail: [email protected]
ABSTRACT
Aim: Ecosystems face numerous well-documented threats from climate change.
The well-being of people also is threatened by climate change, most prominently
by reduced food security. Human adaptation to food scarcity, including shifting
agricultural zones, will create new threats for natural ecosystems. We investigated
how shifts in crop suitability because of climate change may overlap currently
protected areas (PAs) and priority sites for PA expansion in South Africa.
Predicting the locations of suitable climate conditions for crop growth will assist
conservationists and decision-makers in planning for climate change.
Location: South Africa.
Methods: We modelled climatic suitability in 2055 for maize and wheat
cultivation, two extensively planted, staple crops, and overlaid projected
changes with PAs and PA expansion priorities.
Results: Changes in winter climate could make an additional 2 million ha of land
suitable for wheat cultivation, while changes in summer climate could expand
maize suitability by up to 3.5 million ha. Conversely, 3 million ha of lands
currently suitable for wheat production are predicted to become climatically
unsuitable, along with 13 million ha for maize. At least 328 of 834 (39%) PAs are
projected to be affected by altered wheat or maize suitability in their buffer zones.
Main conclusions: Reduced crop suitability and food scarcity in subsistence areas
may lead to the exploitation of PAs for food and fuel. However, if reduced crop
suitability leads to agricultural abandonment, this may afford opportunities
for ecological restoration. Expanded crop suitability in PA buffer zones could lead
to additional isolation of PAs if portions of newly suitable land are converted to
agriculture. These results suggest that altered crop suitability will be widespread
throughout South Africa, including within and around lands identified as
conservation priorities. Assessing how climate change will affect crop suitability
near PAs is a first step towards proactively identifying potential conflicts between
human adaptation and conservation planning.
Keywords
Adaptation, climate change, crop suitability, indirect impacts, maize, South
Africa, species distribution modelling, wheat.
Diversity and Distributions, (Diversity Distrib.) (2012) 18, 425–437
DOI: 10.1111/j.1472-4642.2011.00875.xª 2012 Blackwell Publishing Ltd http://wileyonlinelibrary.com/journal/ddi 425
A J
ourn
al o
f Co
nser
vati
on B
ioge
ogra
phy
Div
ersi
ty a
nd D
istr
ibut
ions
adapt to climate change further compromise natural ecosystems.
Secondary impacts have already been observed or projected for
several large-scale projects aimed at the mitigation of climate
change (Paterson et al., 2008). For example, the recent push for
biofuels has resulted in agricultural expansion and correspond-
ing loss of ecosystems (Wilson et al., 2008).
Of potentially greater consequence to biodiversity conser-
vation are secondary impacts resulting from human adaptation
to climate change (Turner et al., 2010). Because the effects of
climate change have only begun to be felt, human adaptive
responses have thus far been limited in scope and scale. Hence,
the conservation community has not dealt with, and is largely
unprepared for, the increased pressures to biodiversity that will
result from human adaptation. However, historical examples
of the ways in which societies have responded to shifting
climate conditions suggest that the impacts of human adap-
tation could pose substantial risks for ecological conservation
(Turner et al., 2010).
A major threat to ecosystems stemming from human
adaptation is changes in the distribution of lands suitable for
agriculture. Agricultural development is a well-known driver of
habitat loss (Foley et al., 2005; Gibbs et al., 2010), and change
in productivity because of climate change will prompt
agricultural expansion in some areas accompanied by contrac-
tion in others. For example, rising temperatures are projected
to increase crop suitability at higher latitudes (Ramankutty
et al., 2002). Conversely, agricultural productivity in the
tropics and many developing countries is projected to decrease
(Ramankutty et al., 2002; Lobell et al., 2008), which will also
affect conservation (both positively and negatively), depending
on how individuals and societies respond.
Although there are many factors that shape human decisions
to cultivate crops, including market forces and socio-political
drivers, climatic suitability clearly plays an important role.
Altered crop yield may prompt farmers to intensify crop
production, alter management practices, expand into new
areas or abandon existing farms. All of these actions have
ecological consequences, including changing habitat quality,
altering landscape connectivity or changing land values and the
associated costs of land acquisition (Henle et al., 2008).
Projecting the second-order impacts of climate change for
ecological conservation inherently involves assessing human
decision-making. As such, the problem crosses numerous
disciplinary boundaries. In this study, we address only the
physical science component, with a goal of identifying the
potential magnitude of the impact on biodiversity conservation
if agricultural zones were fully shifted in response to climate
change. We use species distribution models to project changes
in climatic suitability for non-irrigated wheat and maize in
South Africa. We measure the degree to which altered crop
productivity will overlap existing protected areas (PAs) and PA
expansion priorities and/or create restoration opportunities
within existing agricultural matrices. The types of conflicts –
and opportunities – forecast here are likely to arise in many
parts of the world where agricultural lands and natural
ecosystems commingle.
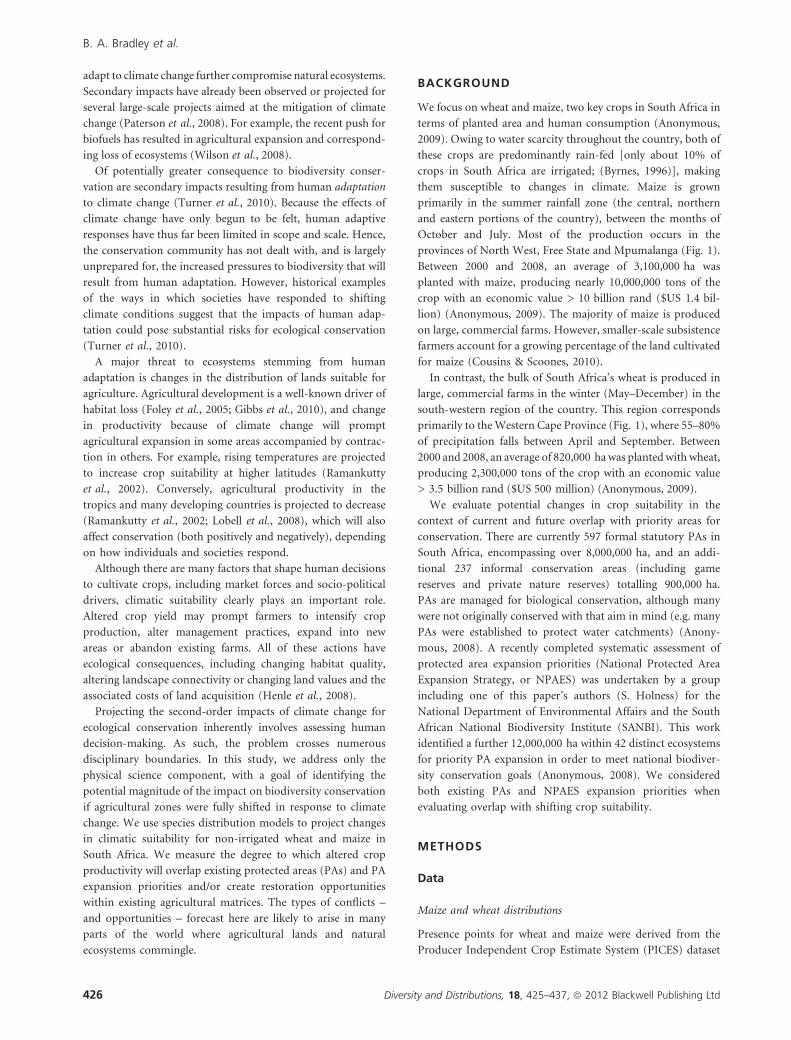
BACKGROUND
We focus on wheat and maize, two key crops in South Africa in
terms of planted area and human consumption (Anonymous,
2009). Owing to water scarcity throughout the country, both of
these crops are predominantly rain-fed [only about 10% of
crops in South Africa are irrigated; (Byrnes, 1996)], making
them susceptible to changes in climate. Maize is grown
primarily in the summer rainfall zone (the central, northern
and eastern portions of the country), between the months of
October and July. Most of the production occurs in the
provinces of North West, Free State and Mpumalanga (Fig. 1).
Between 2000 and 2008, an average of 3,100,000 ha was
planted with maize, producing nearly 10,000,000 tons of the
crop with an economic value > 10 billion rand ($US 1.4 bil-
lion) (Anonymous, 2009). The majority of maize is produced
on large, commercial farms. However, smaller-scale subsistence
farmers account for a growing percentage of the land cultivated
for maize (Cousins & Scoones, 2010).
In contrast, the bulk of South Africa’s wheat is produced in
large, commercial farms in the winter (May–December) in the
south-western region of the country. This region corresponds
primarily to the Western Cape Province (Fig. 1), where 55–80%
of precipitation falls between April and September. Between
2000 and 2008, an average of 820,000 ha was planted with wheat,
producing 2,300,000 tons of the crop with an economic value
> 3.5 billion rand ($US 500 million) (Anonymous, 2009).
We evaluate potential changes in crop suitability in the
context of current and future overlap with priority areas for
conservation. There are currently 597 formal statutory PAs in
South Africa, encompassing over 8,000,000 ha, and an addi-
tional 237 informal conservation areas (including game
reserves and private nature reserves) totalling 900,000 ha.
PAs are managed for biological conservation, although many
were not originally conserved with that aim in mind (e.g. many
PAs were established to protect water catchments) (Anony-
mous, 2008). A recently completed systematic assessment of
protected area expansion priorities (National Protected Area
Expansion Strategy, or NPAES) was undertaken by a group
including one of this paper’s authors (S. Holness) for the
National Department of Environmental Affairs and the South
African National Biodiversity Institute (SANBI). This work
identified a further 12,000,000 ha within 42 distinct ecosystems
for priority PA expansion in order to meet national biodiver-
sity conservation goals (Anonymous, 2008). We considered
both existing PAs and NPAES expansion priorities when
evaluating overlap with shifting crop suitability.
METHODS
Data
Maize and wheat distributions
Presence points for wheat and maize were derived from the
Producer Independent Crop Estimate System (PICES) dataset
B. A. Bradley et al.
426 Diversity and Distributions, 18, 425–437, ª 2012 Blackwell Publishing Ltd

(SIQ, 2007). PICES data identify the crop types growing within
known crop fields (mapped using satellite imagery) between
2006 and 2009; these identifications were made by a trained
observer in a light aircraft. Aerial surveys occurred during the
months of peak crop growth (summer for maize and winter for
wheat) and followed a geographically systematic sampling
approach (SIQ, 2007). The PICES dataset also identifies
irrigated crops.
Although the PICES crop data are reliable, in some cases
points represented very small fields (< 1 ha) with low
productivity that were not representative of crop types being
grown at the resolution of this study (1 km2). In order to select
presence points that were representative of landscape scale
growth patterns, we used time series of Normalized Difference
Vegetation Index (NDVI) derived from the Moderate Resolu-
tion Imaging Spectroradiometer (MODIS) satellite at 1-km
resolution. First, we resampled presence points to a 1-km
spatial resolution to remove duplicate points within the same
pixel. Next, we selected only those presence points displaying
the appropriate growing season based on remote sensing. For
wheat, we identified pixels with a winter growing season, while
for maize we identified pixels with a summer growing season.
We identified winter and summer growing seasons as pixels
with > 0.10 NDVI difference between February and August
(for summer maize) and between August and January (for
winter wheat).
Finally, in order to differentiate between high-productivity
and low-productivity crops, which might provide further
insight into climate requirements for productive non-irrigated
agriculture, we divided each dataset in half based on average
maximum NDVI between 2000 and 2008, creating equal
numbers of crop presence points with high productivity
(upper 50%) and low productivity (lower 50%). The distri-
bution of wheat and maize points in South Africa is shown in
Fig. 1.
Environmental variables
Climate variables used to build crop suitability models were
derived from the South African quinary catchment database,
which provides historical weather records from 1979 to 1999 for
5838 watersheds (mean area = 135 km2) in South Africa,
Lesotho and Swaziland (Schulze & Horan, 2010). Including
terrain variables in addition to climate in distribution models
has been shown to improve model fit (Austin & Van Niel, 2011).
We tested eight soil-related predictors: drained upper and lower
limits for the top- and subsoil horizons, the differences between
the drained upper and lower limits for the top- and subsoils (i.e.
plant available water), total soil depth and topsoil organic
carbon content. The first seven of these parameters were derived
from the South African Land Type Memoirs (SIRI, 1987),
mapped onto topographic landforms (catenal positions) with
an average area of 46 km2. We derived topsoil organic carbon
estimates at the same spatial resolution using regression kriging
(Hengl et al., 2004) with 3377 soil profiles measured by the
Agricultural Research Council and eight spatial predictors.
Further details on the methods used to create the soils data can
be found in the study by Estes et al. (2011).
Climate projections for 2046–2065 were derived from the
IPCC 4th assessment Atmosphere Ocean General Circulation
Figure 1 Current distribution of non-irrigated maize and wheat in South Africa based on the Producer Independent Crop Estimate System
dataset (SIQ, 2007). Grey circles are winter wheat, with darker grey indicating higher-productivity cultivation (based on remote sensing; see
Methods). Grey triangles are maize, with darker grey indicating higher-productivity cultivation.
Agricultural adaptation effects on conservation
Diversity and Distributions, 18, 425–437, ª 2012 Blackwell Publishing Ltd 427

Models (AOGCMs). We used a total of nine climate models in
the analysis: CCCMA-CGCM3.1, CNRM-cm3, CSIRO-mk3.5,
GFDL-CM2.1, GFDL-CM2.0, IPSL-CM4, MIUB-ECHO-G,
MPI-ECHAM5 and MRI-CGCM-2.3.2. We used climate
projections from each AOGCM based on both the B1 and
A2 emissions scenarios. The B1 scenario describes a world with
increasing globalization coupled with the rapid development of
alternative energy where atmospheric CO2 concentrations
approach 550 p.p.m. by 2100 (Nakicenovic & Swart, 2000).
The A2 scenario describes a world of rapid population growth
and regional economic growth where atmospheric CO2
concentrations approach 850 p.p.m. by 2100 (Nakicenovic &
Swart, 2000). We selected these two scenarios to illustrate both
low (B1) and high (A2) degrees of climate change.
To improve the spatial resolution of our modelled future
climate data, we downscaled each AOGCM scenario to the
quinary catchment records using a technique based on self-
organizing maps (Hewitson & Crane, 2006). This approach
classified unique climatic states defined by atmospheric
predictors provided by the AOGCM (and the NCEP-DEO
AMIP-II Reanalysis data provided by NOAA/OAR/ESRL PSD
from http://www.esrl.noaa.gov/psd/, which was used to train
the downscaling). We then constructed observed probability
density functions of each variable to be downscaled (drawn
from quinary catchment weather records) for each of the
identified synoptic states. Twenty-year precipitation and
temperature records were then constructed for the control
(1979–1999) and future (2046–2065) time periods for each
quinary catchment by stochastically resampling from the
probability density functions. To calculate future climate
conditions, we added the projected anomalies (found by
subtracting current from future conditions for each AOGCM)
to the baseline quinary catchment climate variables.
Crop modelling approach
One approach for modelling crop productivity uses detailed,
process-based mechanistic models (e.g. DSSAT, Jones et al.,
2003; APSIM, Keating et al., 2003). However, these models are
data intensive and require detailed inputs describing, for
example, soil water-holding and chemical properties at multi-
ple depths, management practices (e.g. planting density,
fertilization timing and amount) and daily climate data. These
types of data are often collected for specific agricultural fields,
which is the application for which they were originally
designed. However, the information required by process-based
models is rarely available spatially, has been interpolated at a
coarse resolution (e.g. ¼ degree) or is of questionable quality
because of limited data.
In order to produce model results at management-relevant
spatial scales (in this case, 1-km2 spatial resolution over a 1.2-
million km2 land area), we instead used a distribution
modelling approach to project shifts in crop suitability.
Empirical correlations between climate and crop yield have
previously been used to estimate future risk to agricultural
sectors (Lobell et al., 2008). Distribution modelling uses
empirical relationships between abiotic variables (in this case,
climate and slope) and current distribution to identify
climatically suitable habitat (e.g. Franklin, 1995; Guisan &
Zimmermann, 2000; Pearson & Dawson, 2003). Distribution
models have been criticized for being too simplistic (Dormann,
2007), in particular because they neglect species interactions
and population dispersal. However, agricultural communities
are typically grown in monocultures and dispersed through
deliberate cultivation. Our focus on rain-fed maize and wheat,
meanwhile, means that these crops are not growing in
climatically unsuitable regions, maintained by irrigation, which
would introduce model bias (Thuiller et al., 2004). Further,
comparative studies have shown that plant distributions
projected by empirical distribution models are comparable to
those generated by mechanistic models (Hijmans & Graham,
2006). Hence, empirical distribution models should provide a
reasonable characterization of the spatial distribution of
current and future climate conditions needed by the two crops.
Current climatic suitability
Distribution models for wheat and maize were created using
maximum entropy (MAXENT; Phillips et al., 2006), which
applies simple functions to each environmental variable
relative to crop presence points. The MAXENT model was
selected because it is commonly used by conservation scientists
and practitioners and performs well when compared with
other distribution (Elith et al., 2006) and mechanistic (Hij-
mans & Graham, 2006) models.
We used cumulative precipitation, maximum and minimum
temperatures during each crops’ growing season as climatic
predictor variables. These climatic predictors were selected
based on crop physiology. We supplemented these predictors
with soils data, but added soil predictors based on their
contribution to the MAXENT model. We selected the best
model by dividing the maize and wheat datasets into 80%
training and 20% testing. We defined climatically suitable for
cultivation by identifying the model thresholds that encom-
passed 95% of training occurrences. Following Warren &
Seifert (2011), we then chose the set of climate + soils predictor
variables that minimized the difference in overall map accuracy
of the testing–training suitability maps. Overall map accuracy
was calculated using the average of (1) fraction of occurrence
points correctly predicted, and (2) 1 – fraction of total land
area predicted, where total land area was the country of South
Africa. Minimizing the difference in the accuracy of testing–
training achieves a balanced model that is neither oversim-
plistic nor overcomplex and is effective for approximating
suitable habitat with large distribution datasets (Warren &
Seifert, 2011).
Future climatic suitability
We used MAXENT and the same set of predictor variables to
create maps of future climatic suitability based on the AOGCM
projections scaled to the quinary catchments. In addition to
B. A. Bradley et al.
428 Diversity and Distributions, 18, 425–437, ª 2012 Blackwell Publishing Ltd

precipitation and temperature changes projected by the
AOGCMs, we built in an assumption of increased plant
water-use efficiency because of increasing atmospheric CO2
concentrations. Based on the changes in crop water-use
efficiency associated with CO2 rise in free-air CO2 enrichment
(FACE), we assumed a 5% increase in wheat water-use
efficiency (Hunsaker et al., 2000) and a 10% increase in maize
water-use efficiency (Leakey et al., 2009), which we incorpo-
rated by increasing AOGCM projected precipitation variables
used in MAXENT. We did not include any changes in
suitability associated with direct CO2 uptake for photosynthe-
sis owing to uncertainties in the magnitude of that effect (Long
et al., 2006), although C3 crops (e.g. wheat, but not maize) will
likely become more productive with rising atmospheric CO2.
Projections of climatic suitability for wheat and for maize
based on each individual AOGCM were summed together to
create a model ensemble with values ranging from zero (none
of the AOGCMs project climatic suitability) to nine (all of the
AOGCMs project climatic suitability) (Araujo & New, 2007).
This type of ensemble approach identifies the degree of overlap
amongst the models of future crop suitability, which can
inform how much confidence is assigned to projected change
at a given location. For the purpose of calculating changes in
land area and overlap with PAs, we defined future suitability as
any pixel projected as suitable in 2050 by two or more
AOGCMs and unsuitable as any pixel projected as suitable by
less than two AOGCMs (See Appendix S1 in Supporting
Information for sensitivity analysis of ensemble model thresh-
olds). This threshold will tend to err on the side of
overpredicting future crop suitability (and underpredicting
unsuitability), but model ensemble values (between 2 and 9)
can ultimately be used to inform the likelihood of future
suitability.
We identified both expansion and contraction of climatically
suitable land area for maize and wheat. We overlaid areas that
gained crop suitability with NPAES expansion priorities, as
well as lands within a 10-km buffer surrounding existing PAs,
and calculated overlapping land area for wheat and maize
using both the B1 and A2 emissions scenarios. We also overlaid
areas that lost crop suitability with NPAES expansion priorities
and PA buffers. However, in the lost suitability case, land area
also had to be within an existing agricultural matrix (defined as
< 10 km from current cultivation). In order to compare
potential future expansion of croplands to current patterns of
cultivation, we also calculated the area of existing crop fields
with NPAES and PA buffers. Existing crop fields data were
based on field boundaries manually digitized from satellite data
by Geo Terra Image (GTI, 2008).
RESULTS
Maize and wheat distributions
The original PICES dataset consisted of 6362 points of non-
irrigated wheat cultivation and 29,287 points of non-irrigated
maize. The removal of duplicate points within a 1-km MODIS
pixel reduced those numbers to 4664 wheat points and 21,209
maize points. The final criterion of winter (for wheat) and
summer (for maize) phenologies with amplitudes > 0.10
NDVI further reduced the datasets to a final set of 2119 wheat
presence points and 20,210 maize presence points (Fig. 1).
Crop fields in South Africa currently cover over 13 mil-
lion ha (GTI, 2008). The majority are maize or wheat
cultivation, but this number also includes secondary crops
(fruits, vegetables, viticulture, sugarcane). Crop fields currently
overlap 2.6 million ha of PA buffers (10% of total buffer area)
and 270,000 ha of NPAES expansion priorities (2% of total
NPAES area).
Current climatic suitability
Environmental variables used to construct the maize and wheat
models are presented in Table 1, along with their mean value and
standard deviation across all crop occurrence points. Land areas
suitable for maize cultivation based on current climate condi-
tions are widely distributed across the north-eastern provinces in
South Africa (Fig. 2). The area under the curve (AUC) statistic
for the maize model is 0.895. Overall map accuracy based on the
testing dataset was 0.80. Land area currently climatically suitable
for maize cultivation totals over 40 million ha (9 million ha of
this suitable area currently contains crop fields; GTI, 2008).
High-productivity maize has a very similar distribution to all
maize, except for some reduced climatic suitability to the west as
conditions become increasingly arid.
Land areas suitable for wheat cultivation are concentrated
primarily in the Western Cape Province (Fig. 2). AUC for the
wheat model is 0.985. Overall map accuracy based on the
testing dataset was 0.95. Land area currently climatically
suitable for wheat cultivation totals over 5.5 million ha (over
1.7 million ha of this suitable area currently contains crop
fields; GTI, 2008). High-productivity wheat distribution is
considerably different from all wheat. High-productivity wheat
is concentrated in the Agulhas Plain along the south coast and
Swartland along the west coast. Land area currently climatically
suitable for high-productivity wheat totals over 1.9 million ha
(1 million ha of this suitable area currently contains crop
fields; GTI, 2008). Wheat suitability declines as conditions
become drier to the north and as soil conditions are less
favourable at higher elevations.
Future climatic suitability
There are currently 597 formal reserves in South Africa, plus an
additional 237 informal conservation areas (mainly game
reserves and private nature reserves). The 10-km buffer zones
surrounding between 232 and 254 (39–43%)1 of formal and
96–107 (40–45%) of informal reserves are projected to have
altered wheat or maize suitability. That is, at least 40% of PA
1Ranges in land area presented in this section depend on the emissions
scenario (B1 or A2) used in the models. Figures of A2 model results are
presented in supplementary materials.
Agricultural adaptation effects on conservation
Diversity and Distributions, 18, 425–437, ª 2012 Blackwell Publishing Ltd 429

buffer zones will either gain crop suitability or lose crop
suitability within existing agricultural matrices (10 km from
current agriculture).
Loss of climatic suitability for maize is projected to be most
extensive along the northern and western edges of its current
distribution (Fig. 3; Appendix S2). These lands are semi-arid,
and it is likely that water limitation is the primary cause.
Between 12 and 15 million ha are projected to lose climatic
suitability for maize production, representing up to 37% of
currently suitable land area. Maize suitability is most likely to
expand into higher elevation areas such as those along the
eastern edges of Mpumalanga and Free State and the interior of
Eastern Cape. Projected gains in climatic suitability for maize
production total between 3.5 and 3.8 million ha (Fig. 3;
Appendix S2). There was no substantive difference in the
projections for maize suitability using the subset of high maize
productivity, so we presented only results from models using
all maize points here.
The area of increased maize suitability overlaps buffer zones
surrounding 132–135 PAs (out of a total 221 PAs currently
within the maize-growing region), including nature reserves,
game reserves, national parks and state forests. Maize suitabil-
ity gains in PA buffer zones total between 960,000 and
980,000 ha, with the most overlap occurring in Limpopo and
Eastern Cape provinces. Increased maize suitability also
overlaps 540,000–560,000 ha of NPAES expansion priority
sites, primarily in the northern portion of the Eastern Cape
Province (Figs. 3b,c; Appendix S2B,C).
Decreased maize suitability within current agriculture
matrices overlaps buffer zones surrounding between 70 and
91 PAs. Maize suitability losses in buffer zones total between
1.3 and 1.7 million ha, with the largest blocks of overlap
occurring in game reserves and nature reserves in Limpopo
and North West provinces. Decreased maize suitability over-
laps 260,000–410,000 ha of NPAES expansion priority sites
throughout the maize-growing region. An example in western
Free State is shown in Fig. 3d and Appendix S2D.
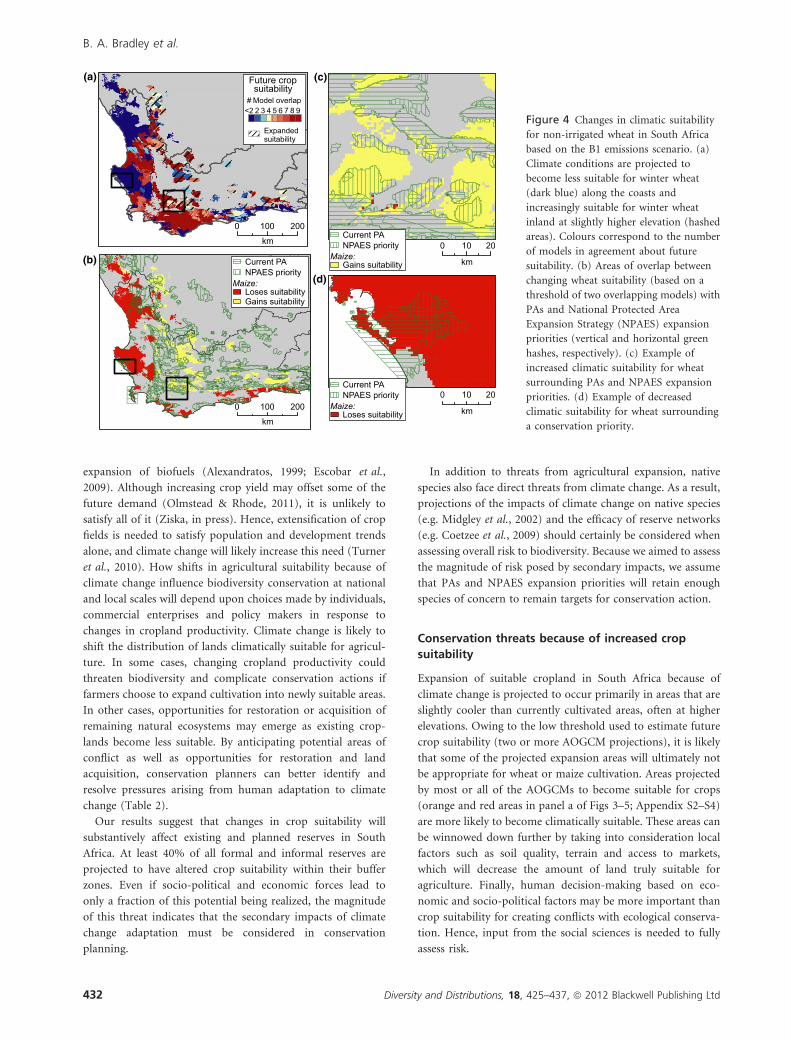
Loss of climatic suitability for wheat occurs primarily along
the west coast of the Western Cape Province (Fig. 4; Appen-
dix S3). Temperatures along the coasts are higher than inland
and higher temperatures are the primary cause for reduced
wheat suitability. Between 2.6 and 3.4 million ha (48–62%) of
currently suitable land area are projected to lose climatic
suitability. However, wheat suitability is also likely to expand
substantially into slightly higher elevations as well as inland
into areas that are currently cooler and/or drier than existing
Table 1 Predictor variables used to construct models for maize and wheat based on crop physiology, including the mean value and standard
deviation across all presence points. Predictor variables are presented in order of importance based on MAXENT predictor gain.
Predictor variables used for maize Mean value Standard deviation
Growing season precipitation (October–April) 551 mm 122 mm
Growing season maximum temp (January) 28.5 �C 2.1 �C
Soil depth 73 cm 27 cm
Growing season minimum temp (April) 9.4 �C 2.1 �C
Topsoil organic carbon 0.79% 0.66%
Predictor variables used for wheat Mean Value Standard deviation
Growing season precipitation (May–September) 263 mm 112 mm
Growing season minimum temp (August) 7.2 �C 1.0 �C
Topsoil organic carbon 0.67% 0.38%
Growing season maximum temp (May–September) 19.4 �C 1.1 �C
0 200 400
km
0 100 200
km
Suitable for wheat
Suitable for high productivity wheat
Suitable for maize
Suitable for high productivity maize
Figure 2 Current climatic suitability for
maize and wheat cultivation based on
MAXENT models constructed from
current non-irrigated crop distributions.
B. A. Bradley et al.
430 Diversity and Distributions, 18, 425–437, ª 2012 Blackwell Publishing Ltd

cultivated lands. Projected gains in climatic suitability for
wheat production total 2.2 million ha in both scenarios, a
potential 40% expansion relative to current suitability, offset-
ting some of the losses elsewhere.
The area of increased wheat suitability overlaps buffer zones
surrounding 88–94 PAs (out of a total 166 PAs currently
within the wheat growing region), primarily nature reserves,
national parks and protected water catchments. Wheat
suitability gains within PA buffer zones total between
860,000 and 960,000 ha, with the majority of overlap occurring
in upland areas of interior Western Cape. Increased wheat
suitability overlaps 450,000–500,000 ha of NPAES expansion
priority sites, along the border of Western Cape and Northern
Cape provinces and in the interior of the Western Cape
(Fig. 4c; Appendix S3C).
The area of decreased wheat suitability within current
agriculture matrices overlaps buffer zones surrounding 72–83
PAs. Wheat suitability losses in PA buffer zones total between
640,000 and 760,000 ha, with the largest blocks of overlap
occurring around reserves on the west coast (Fig. 4d;
Appendix S3D). A further 80,000–90,000 ha of NPAES
expansion priorities exist in areas likely to lose wheat crop
suitability, including several expansion priorities along the
south coast.
Changing climatic suitability also affects high-productivity
wheat. Loss of climatic suitability for high-productivity wheat
is projected across broad portions of the west coast, including
the bulk of heavily cultivated Swartland (Fig. 5; Appendix S4).
Decreased suitability totals between 1.6 and 1.8 million ha, or
81–93% of current high-productivity wheat. Although many
of these areas remain suitable for wheat production (Fig. 4;
Appendix S3), reductions in climatic suitability could
substantially reduce crop output. Increased suitability for
high-productivity wheat totals only between 300,000 and
430,000 ha.
Increased high-productivity wheat suitability overlaps buffer
zones surrounding 36–41 PAs. Overlap areas total between
170,000 and 240,000 ha. High-productivity wheat suitability
gains overlap an additional 60,000–100,000 ha of NPAES
expansion priorities. The area of decreased high-productivity
wheat suitability within current agriculture matrices overlaps
the buffer zones of 54–64 PAs and overlaps a total of 40,000–
50,000 ha of NPAES expansion priority sites.
DISCUSSION
Demand for cereal crops globally is likely to continue to
increase because of population growth, changing diets and
0 20 40
km
Current PANPAES priority
Loses suitabilityMaize:
(a)
(b)
(c)
(d)0 200 400
km
0 200 400km
0 20 40
km
Expandedsuitability
Future cropsuitability
# Model overlap2 3 4 5 6 7<2 8 9
Current PANPAES priority
Gains suitabilityMaize:
Current PANPAES priority
Loses suitabilityGains suitability
Maize:
Figure 3 Changes in climatic suitability
for non-irrigated maize in South Africa
based on the B1 emissions scenario.
(a) Within areas currently suitable for
maize cultivation, climatic conditions are
projected to become less suitable (dark
blue) in parts of North West, the Free
State and Limpopo provinces. Climatic
conditions are projected to become newly
favourable for maize cultivation (hashed
areas) in the northern portions of
Mpumalanga and Eastern Cape provinces.
Colours correspond to the number of
models in agreement about future
suitability. (b) Projected gains and losses
in climatic suitability for maize (based on
a threshold of two overlapping models)
compared to PAs and National Protected
Area Expansion Strategy (NPAES)
expansion priorities (vertical and
horizontal green hashes, respectively). (c)
Example of increased climatic suitability
for maize surrounding NPAES expansion
priorities. (d) Example of decreased cli-
matic suitability for maize surrounding
PAs and NPAES expansion priorities
currently within an agricultural matrix.
Agricultural adaptation effects on conservation
Diversity and Distributions, 18, 425–437, ª 2012 Blackwell Publishing Ltd 431
expansion of biofuels (Alexandratos, 1999; Escobar et al.,
2009). Although increasing crop yield may offset some of the
future demand (Olmstead & Rhode, 2011), it is unlikely to
satisfy all of it (Ziska, in press). Hence, extensification of crop
fields is needed to satisfy population and development trends
alone, and climate change will likely increase this need (Turner
et al., 2010). How shifts in agricultural suitability because of
climate change influence biodiversity conservation at national
and local scales will depend upon choices made by individuals,
commercial enterprises and policy makers in response to
changes in cropland productivity. Climate change is likely to
shift the distribution of lands climatically suitable for agricul-
ture. In some cases, changing cropland productivity could
threaten biodiversity and complicate conservation actions if
farmers choose to expand cultivation into newly suitable areas.
In other cases, opportunities for restoration or acquisition of
remaining natural ecosystems may emerge as existing crop-
lands become less suitable. By anticipating potential areas of
conflict as well as opportunities for restoration and land
acquisition, conservation planners can better identify and
resolve pressures arising from human adaptation to climate
change (Table 2).
Our results suggest that changes in crop suitability will
substantively affect existing and planned reserves in South
Africa. At least 40% of all formal and informal reserves are
projected to have altered crop suitability within their buffer
zones. Even if socio-political and economic forces lead to
only a fraction of this potential being realized, the magnitude
of this threat indicates that the secondary impacts of climate
change adaptation must be considered in conservation
planning.
In addition to threats from agricultural expansion, native
species also face direct threats from climate change. As a result,
projections of the impacts of climate change on native species
(e.g. Midgley et al., 2002) and the efficacy of reserve networks
(e.g. Coetzee et al., 2009) should certainly be considered when
assessing overall risk to biodiversity. Because we aimed to assess
the magnitude of risk posed by secondary impacts, we assume
that PAs and NPAES expansion priorities will retain enough
species of concern to remain targets for conservation action.
Conservation threats because of increased crop
suitability
Expansion of suitable cropland in South Africa because of
climate change is projected to occur primarily in areas that are
slightly cooler than currently cultivated areas, often at higher
elevations. Owing to the low threshold used to estimate future
crop suitability (two or more AOGCM projections), it is likely
that some of the projected expansion areas will ultimately not
be appropriate for wheat or maize cultivation. Areas projected
by most or all of the AOGCMs to become suitable for crops
(orange and red areas in panel a of Figs 3–5; Appendix S2–S4)
are more likely to become climatically suitable. These areas can
be winnowed down further by taking into consideration local
factors such as soil quality, terrain and access to markets,
which will decrease the amount of land truly suitable for
agriculture. Finally, human decision-making based on eco-
nomic and socio-political factors may be more important than
crop suitability for creating conflicts with ecological conserva-
tion. Hence, input from the social sciences is needed to fully
assess risk.
0 100 200
km
0 100 200
km
0 10 20
km
0 10 20
km
(a)
(b)
(c)
(d)
Current PANPAES priority
Loses suitabilityMaize:
Expandedsuitability
Future cropsuitability
# Model overlap2 3 4 5 6 7<2 8 9
Current PANPAES priority
Loses suitabilityGains suitability
Maize:
Current PANPAES priority
Gains suitabilityMaize:
Figure 4 Changes in climatic suitability
for non-irrigated wheat in South Africa
based on the B1 emissions scenario. (a)
Climate conditions are projected to
become less suitable for winter wheat
(dark blue) along the coasts and
increasingly suitable for winter wheat
inland at slightly higher elevation (hashed
areas). Colours correspond to the number
of models in agreement about future
suitability. (b) Areas of overlap between
changing wheat suitability (based on a
threshold of two overlapping models) with
PAs and National Protected Area
Expansion Strategy (NPAES) expansion
priorities (vertical and horizontal green
hashes, respectively). (c) Example of
increased climatic suitability for wheat
surrounding PAs and NPAES expansion
priorities. (d) Example of decreased
climatic suitability for wheat surrounding
a conservation priority.
B. A. Bradley et al.
432 Diversity and Distributions, 18, 425–437, ª 2012 Blackwell Publishing Ltd

Despite these caveats, it is likely that up to 1 million ha
within NPAES expansion priorities and up to 2 million ha in
PA buffer zones will become increasingly suitable for maize or
wheat cultivation (yellow areas in panel b of Figs 3–5). If crop
fields were to expand into all climatically suitable range, the
addition of 1 million ha of cultivation in NPAES expansion
priorities would represent a 400% increase relative to current
crop field extents (270,000 ha). The addition of 2 million ha of
crop fields in PA buffer zones would represent a 75% increase
relative to current crop field extents (2.6 million ha). Within
NPAES expansion priorities, increased competition for land
and associated rises in land prices could reduce the ability of
government and private conservation organizations to acquire
priority areas. Increased crop suitability adjacent to existing
PAs is likely to affect land prices similarly, while intensified
agricultural development in buffer regions could make PAs
increasingly isolated.
In areas where food security is already a problem (primarily
within former apartheid ‘homelands’ in the maize-growing
region; Rose & Charlton, 2002), increased climatic suitability
may lead to farmers encroaching into PAs and buffers. Increased
climatic suitability for maize is likely in the Eastern Cape and
Mpumalanga provinces. This area also contains a number of PAs
and NPAES expansion priorities (Fig. 3c). An increase in small-
scale illegal farming could result in the fragmentation of
remaining natural ecosystems, primarily within the grassland
biome. For example, South African grasslands, which are poorly
protected and found primarily in maize-dominated agricultural
zones (Neke & Du Plessis, 2004), could be increasingly
threatened if maize suitability increases.
Lands suitable for wheat cultivation in the Western Cape
could expand by upwards of 2.2 million ha (Fig. 4). Of the
lands that gain suitability, over half are within PA buffers
or NPAES expansion priorities, primarily within the Fynbos
or Succulent Karoo biomes. Commercial farmers are likely to
have the economic means to expand or intensify cultivation
on newly suitable land. Several areas are likely to become
climatically similar to current highly productive wheat fields,
making them especially desirable for cropland expansion
(Fig. 5c). In the Western Cape, where much of the land is
already being farmed, increased suitability could lead farmers
to convert remaining uncultivated lands that are currently
marginal (e.g. owing to steeper slopes) to wheat cultivation.
Conversion of marginal lands in the Western Cape threatens
the few remaining patches of Renosterveld, one of the most
threatened and heavily transformed ecosystems in the Cape
Floristic Region and home to numerous endangered species
(Kemper et al., 1999).
Conservation threats because of decreased crop
suitability
Commercial and subsistence farmers across South Africa are
likely to experience an overall reduction of cultivatable land
because of climate change (Figs 4 and 5). The average change
in wheat suitability across the B1 and A2 scenarios is a net
0 50 100
km
0 50 100
km
(a)
(b)
(c)
0 10 20
km
Current PANPAES priority
Loses suitabilityGains suitability
Maize:
Expandedsuitability
Future cropsuitability
# Model overlap2 3 4 5 6 7<2 8 9
Current PANPAES priority
Loses suitabilityGains suitability
Maize:
Figure 5 Changes in climatic suitability for non-irrigated,
high-productivity wheat based on the B1 emissions scenario.
(a) Climate conditions are projected to become less suitable for
high-productivity wheat in Swartland (dark blue) and increasingly
suitable for high-productivity wheat inland at slightly higher
elevation (hashed areas). Colours correspond to the number of
models in agreement about future suitability. (b) Areas of overlap
between changing high-productivity wheat suitability (based on a
threshold of two overlapping models) with PAs and National
Protected Area Expansion Strategy (NPAES) expansion priorities
(vertical and horizontal green hashes, respectively). (c) Example of
gained and lost suitability for high-productivity wheat
surrounding PAs and NPAES expansion priorities.
Agricultural adaptation effects on conservation
Diversity and Distributions, 18, 425–437, ª 2012 Blackwell Publishing Ltd 433

loss of 800,000 ha, or 14% of current suitable area. Although
we modelled suitability for crop production rather than crop
productivity, this projection corresponds well to previous
estimates of 15% losses in wheat production in southern
Africa by 2030 (Lobell et al., 2008). The average change in
maize suitability across the B1 and A2 scenarios is a net loss
of 9.8 million ha, or 24% of current suitable area. This
projection also compares well to previous estimates of 30%
losses in maize production in southern Africa by 2030 (Lobell
et al., 2008). At a national level, climate change is likely to
make it increasingly difficult for South Africa to meet its
domestic food needs.
In regions dominated by subsistence farmers, who are less
able to adopt technologies that might maintain crop
productivity, decreasing crop yields could result in food
scarcity. Food scarcity, in turn, may create new pressures on
PAs and, in extreme cases, unstable social conditions not
conducive to conservation. Communities with insecure food
sources might seek additional farmland to make up for lost
production (e.g. in marginal lands or PAs) and/or become
more dependent on surrounding natural resources. For
example, farming households may make increasing use of
fuel and food resources within native ecosystems, harvesting
wood and wild game (bush meat) to replace lost income
(Brashares et al., 2004).
Commercial farmers will have greater access to infrastruc-
ture and technological resources (e.g. irrigation, drought
resistant cultivars, fertilizers) that may allow them to
maintain current levels of crop production even where
climatic suitability decreases. This scenario is possible in the
coastal portions of the Western Cape wheat belt (Figs 4d and
5d) and in areas of commercial maize cultivation in central
Free State (Fig. 3). However, some of these compensatory
practices could be detrimental to ecosystems (e.g. increased
fertilizer run-off), while others may not be feasible [e.g.
consistent irrigation in areas with periodic water shortages
such as the Western Cape; (Muller et al., 2009)].
Minimizing risk, maximizing opportunities
Although human adaptation to decreased crop productivity
may increase pressure on some protected lands, diminished
crop potential or cropland abandonment could also provide
conservation opportunities. Declining suitability in current
croplands could lower surrounding land prices, making it
more affordable for government or non-governmental orga-
nizations to acquire priority areas for conservation manage-
ment (Pence et al., 2003; Anonymous, 2008) assuming these
areas are able to retain their key species in the face of climate
change. Restoration of cropland to native habitat could
support important conservation goals, including reducing
pressure from non-native species and increasing connectivity
between patches of rare ecosystems (e.g. the Renosterveld in
the Western Cape; Krug & Krug, 2007). Of course, the success
of such efforts will depend on the extent to which conser-
vation objectives can be met in areas of decreased agricultural
suitability. Our analysis suggests that these opportunities
exist; multiple locations within the Agulhas Plain, for
Table 2 Changes in agriculture and potential consequences for biodiversity conservation.
Change Consequence
Agriculture suitability increases
Generally Expansion of cropland could lead to habitat fragmentation, reduced connectivity and introduction of
invasive species
Expansion of cropland into new areas could increase threats to a range of species and habitats, creating
new urgent conservation priorities and increasing the burden on conservation resources
In situ Conversion of native ecosystems in marginal lands to crops if prices increase
Agricultural intensification owing to economic benefits
Reduced need for agricultural expansion
Adjacent to and within
protected areas
Reserve isolation owing to agricultural development in buffer areas
Social pressure to open protected areas to farming to avoid food scarcity
Illegal subsistence farming
In PA expansion priorities Increased demand for land could trigger rising land prices and lesser land acquisition for conservation
Loss of expansion opportunities as land is transformed
Agricultural suitability decreases
In situ Improved management practices and adoption of new agricultural technologies could mitigate crop loss
Increased use of fertilizers in response to crop loss could threaten surrounding native ecosystems
Diversion of water resources could threaten riparian habitat
Agriculture abandonment creates restoration opportunities
Adjacent to protected areas Increased human dependence on natural resources (e.g. fuel wood, bush meat) threatens protected
ecosystems
In PA expansion priorities Decreased demand for land could trigger declines in land prices and greater land acquisition for
conservation
PA, protected areas.
B. A. Bradley et al.
434 Diversity and Distributions, 18, 425–437, ª 2012 Blackwell Publishing Ltd

example, are critical to dispersal of Cape Proteaceae (Phillips
et al., 2008), and several of these are currently under wheat
cultivation but likely to lose crop suitability with climate
change (Fig. 4d).
The distribution of areas of potential crop expansion, such
as those projected for wheat in the Western Cape, could
inform PA acquisition. Lands that are projected to become
increasingly suitable for crops may become more expensive
and thus difficult to acquire in future. These areas could
be considered a high priority for acquisition now in order
to ensure that an efficient and representative reserve network is
created before they are either fragmented by agricultural
activities or become prohibitively expensive. On the other
hand, NPAES expansion priorities that overlap increased crop
suitability also represent potential long-term conflicts with
farmers and thus should be targeted only where very important
for biodiversity.
CONCLUSIONS
The results presented here provide a broad, national view of
potential changes to crop suitability in relation to PAs. Climate
change plays an important role in human decision-making
(Turner et al., 2010), and hence, shifts in cultivated areas could
pose a serious threat to conservation efforts. It is likely that the
threats and opportunities summarized in Table 2 are relevant
for many areas where conservation and agriculture priorities
intersect. Without better projections of human adaptive
responses to climate change, conservationists and decision-
makers run the risk of overlooking a major, emerging threat to
biodiversity.
ACKNOWLEDGEMENTS
We gratefully acknowledge funding from the Princeton
Environmental Institute’s Grand Challenges Program. We
thank Anneliza Collet and Rona Beukes of the National
Department of Agriculture, Terry Newby and Dave Turner of
the Agricultural Research Council, Fanie Ferreira and Mark
Thompson of GeoTerraImage and Eugene du Preez of SiQ for
providing data used in developing models. Three anonymous
reviewers provided suggestions that greatly improved this
manuscript.
REFERENCES
Alexandratos, N. (1999) World food and agriculture:
outlook for the medium and longer term. Proceedings of the
National Academy of Sciences United States of America, 96,
5908–5914.
Anonymous. (2008) The National Protected Area expansion
strategy 2008–2012: a framework for implementation. South
African National Biodiversity Institute; National Department
of Environmental Affairs and Tourism.
Anonymous.(2009)Abstractofagriculturalstatistics.p.115.South
African Department of Agriculture, Pretoria, South Africa.
Araujo, M.B. & New, M. (2007) Ensemble forecasting of spe-
cies distributions. Trends in Ecology & Evolution, 22, 42–47.
Austin, M.P. & Van Niel, K.P. (2011) Impact of landscape
predictors on climate change modelling of species distribu-
tions: a case study with Eucalyptus fastigata in southern New
South Wales, Australia. Journal of Biogeography, 38, 9–19.
Brashares, J.S., Arcese, P., Sam, M.K., Coppolillo, P.B., Sinclair,
A.R.E. & Balmford, A. (2004) Bushmeat hunting, wildlife de-
clines, and fish supply in West Africa. Science, 306, 1180–1183.
Byrnes, R.M. (1996) South Africa: a Country Study. Federal
Research Division, Library of Congress, Washington, DC.
Available at: http://countrystudies.us/south-africa/ (accessed
1 May 2011)
Coetzee, B.W.T., Robertson, M.P., Erasmus, B.F.N., Van
Rensburg, B.J. & Thuiller, W. (2009) Ensemble models
predict Important Bird Areas in southern Africa will become
less effective for conserving endemic birds under climate
change. Global Ecology and Biogeography, 18, 701–710.
Cousins, B. & Scoones, I. (2010) Contested paradigms of
‘viability’ in redistributive land reform: perspectives from
southern Africa. Journal of Peasant Studies, 37, 31–66.
Dormann, C.F. (2007) Promising the future? Global change
projections of species distributions. Basic and Applied Ecol-
ogy, 8, 387–397.
Elith, J., Graham, C.H., Anderson, R.P. et al. (2006) Novel
methods improve prediction of species’ distributions from
occurrence data. Ecography, 29, 129–151.
Escobar, J.C., Lora, E.S., Venturini, O.J., Yanez, E.E., Castillo,
E.F. & Almazan, O. (2009) Biofuels: environment, technol-
ogy and food security. Renewable & Sustainable Energy Re-
views, 13, 1275–1287.
Estes, L.D., Bradley, B.A., Beukes, H., Hole, D.G., Lau, M.,
Oppenheimer, M., Schulze, R., Tadross, M.A. & Turner,
W.R. (2011) Comparing mechanistic and empirical model
projections of crop suitability and productivity: implications
for projecting ecological change. In, Princeton, NJ.
Foley, J.A., Defries, R., Asner, G.P., Barford, C., Bonan, G.,
Carpenter, S.R., Chapin, F.S., Coe, M.T., Daily, G.C., Gibbs,
H.K., Helkowski, J.H., Holloway, T., Howard, E.A., Ku-
charik, C.J., Monfreda, C., Patz, J.A., Prentice, I.C., Rama-
nkutty, N. & Snyder, P.K. (2005) Global consequences of
land use. Science, 309, 570–574.
Franklin, J. (1995) Predictive vegetation mapping: geographic
modelling of biospatial patterns in relation to environmental
gradients. Progress in Physical Geography, 19, 474–499.
Gibbs, H.K., Ruesch, A.S., Achard, F., Clayton, M.K., Holm-
gren, P., Ramankutty, N. & Foley, J.A. (2010) Tropical for-
ests were the primary sources of new agricultural land in the
1980s and 1990s. Proceedings of the National Academy of
Sciences United States of America, 107, 16732–16737.
GTI. (2008) Geo Terra Image: South African Crop Field Bound-
aries. In: National Crop Statistics Consortium Available at:
http://www.geoterraimage.com (accessed 1 September 2009).
Guisan, A. & Zimmermann, N.E. (2000) Predictive habitat
distribution models in ecology. Ecological Modelling, 135,
147–186.
Agricultural adaptation effects on conservation
Diversity and Distributions, 18, 425–437, ª 2012 Blackwell Publishing Ltd 435
Hengl, T., Heuvelink, G.B. & Rossiter, D.G. (2004) A generic
framework for spatial prediction of soil variables based on
regression kriging. Geoderma, 120, 75–93.
Henle, K., Alard, D., Clitherow, J., Cobb, P., Firbank, L., Kull,
T., Mccracken, D., Moritz, R.F.A., Niemela, J., Rebane, M.,
Wascher, D., Watt, A. & Young, J. (2008) Identifying and
managing the conflicts between agriculture and biodiversity
conservation in Europe – a review. Agriculture Ecosystems &
Environment, 124, 60–71.
Hewitson, B.C. & Crane, R.G. (2006) Consensus between GCM
climate change projections with empirical downscaling:
precipitation downscaling over South Africa. International
Journal of Climatology, 26, 1315–1337.
Hijmans, R.J. & Graham, C.H. (2006) The ability of climate
envelope models to predict the effect of climate change on
species distributions. Global Change Biology, 12, 2272–2281.
Hunsaker, D.J., Kimball, B.A., Pinter, P.J., Wall, G.W., La-
morte, R.L., Adamsen, F.J., Leavitt, S.W., Thompson, T.L.,
Matthias, A.D. & Brooks, T.J. (2000) CO2 enrichment and
soil nitrogen effects on wheat evapotranspiration and water
use efficiency. Agricultural and Forest Meteorology, 104, 85–
105.
Jones, J.W., Hoogenboom, G., Porter, C.H., Boote, K.J.,
Batchelor, W.D., Hunt, L.A., Wilkens, P.W., Singh, U., Gi-
jsman, A.J. & Ritchie, J.T. (2003) The DSSAT cropping
system model. European Journal of Agronomy, 18, 235–265.
Keating, B.A., Carberry, P.S., Hammer, G.L. et al. (2003) An
overview of APSIM, a model designed for farming systems
simulation. European Journal of Agronomy, 18, 267–288.
Kemper, J., Cowling, R.M. & Richardson, D.M. (1999) Frag-
mentation of South African renosterveld shrublands: effects
on plant community structure and conservation implica-
tions. Biological Conservation, 90, 103–111.
Krug, C.B. & Krug, R.M. (2007) Restoration of old fields in
Renosterveld: a case study in a Mediterranean-type shrub-
land of South Africa. Old fields: dynamics and restoration of
abandoned famland (ed. by V.A. Cramer and R.J. Hobbs),
pp. 265–285. Island Press, Washington, DC.
Leakey, A.D.B., Ainsworth, E.A., Bernacchi, C.J., Rogers, A.,
Long, S.P. & Ort, D.R. (2009) Elevated CO2 effects on plant
carbon, nitrogen, and water relations: six important lessons
from FACE. Journal of Experimental Botany, 60, 2859–2876.
Lobell, D.B., Burke, M.B., Tebaldi, C., Mastrandrea, M.D.,
Falcon, W.P. & Naylor, R.L. (2008) Prioritizing climate
change adaptation needs for food security in 2030. Science,
319, 607–610.
Long, S.P., Ainsworth, E.A., Leakey, A.D.B., Nosberger, J. &
Ort, D.R. (2006) Food for thought: lower-than-expected
crop yield stimulation with rising CO2 concentrations. Sci-
ence, 312, 1918–1921.
Midgley, G.F., Hannah, L., Millar, D., Rutherford, M.C. &
Powrie, L.W. (2002) Assessing the vulnerability of species
richness to anthropogenic climate change in a biodiversity
hotspot. Global Ecology and Biogeography, 11, 445–451.
Muller, M., Schreiner, B., Smith, L., van Koppen, B., Sally, H.,
Aliber, M., Cousins, B., Tapela, B., van der Merwe-Botha,
M., Karar, E. & Pietersen, K. (2009) Water security in South
Africa. In: Working paper series No.12. Development plan-
ning division, DBSA, Midrand.
Nakicenovic, N. & Swart, R. (2000) Special report on emissions
scenarios. Cambridge University Press, Cambridge.
Neke, K.S. & Du Plessis, M.A. (2004) The threat of transfor-
mation: quantifying the vulnerability of grasslands in South
Africa. Conservation Biology, 18, 466–477.
Olmstead, A.L. & Rhode, P.W. (2011) Adapting North
American wheat production to climatic challenges, 1839–
2009. Proceedings of the National Academy of Sciences United
States of America, 108, 480–485.
Parmesan, C. & Yohe, G. (2003) A globally coherent finger-
print of climate change impacts across natural systems.
Nature, 421, 37–42.
Paterson, J.S., Araujo, M.B., Berry, P.M., Piper, J.M. &
Rounsevell, M.D.A. (2008) Mitigation, Adaptation, and the
Threat to Biodiversity. Conservation Biology, 22, 1352–1355.
Pearson, R.G. & Dawson, T.P. (2003) Predicting the impacts of
climate change on the distribution of species: are bioclimate
envelope models useful? Global Ecology and Biogeography, 12,
361–371.
Pence, G.Q.K., Botha, M.A. & Turpie, J.K. (2003) Evaluating
combinations of on-and off-reserve conservation strategies
for the Agulhas Plain, South Africa: a financial perspective.
Biological Conservation, 112, 253–273.
Phillips, S.J., Anderson, R.P. & Schapire, R.E. (2006) Maxi-
mum entropy modeling of species geographic distributions.
Ecological Modelling, 190, 231–259.
Phillips, S.J., Williams, P., Midgley, G. & Archer, A. (2008)
Optimizing dispersal corridors for the cape proteaceae using
network flow. Ecological Applications, 18, 1200–1211.
Ramankutty, N., Foley, J.A. & Olejniczak, N.J. (2002) People
on the land: changes in global population and croplands
during the 20(th) century. Ambio, 31, 251–257.
Rose, D. & Charlton, K.E. (2002) Prevalence of household food
poverty in South Africa: results from a large, nationally
representative survey. Public Health Nutrition, 5, 383–389.
Schulze, R.E. & Horan, M.J.C. (2010) Methods I: delineation of
South Africa, Lesotho and Swaziland into Quinary Carch-
ments. Methodological approaches to assessing eco-hydrological
responses to climate change in South Africa. WRC Report
1562/1/10 (ed. by R.E. Schulze, B.S. Hewitson, K.R. Baric-
hievy, M.A. Tadross, R.P. Kunz, M.J.C. Horan and T.G.
Lumsden). Water Resources Commission, Pretoria, South
Africa.
SIQ. (2007) Point frame sampling: producer independent crop
estimate system (PICES). Available at: http://www.SIQ.co.za
(accessed 1 September 2009).
SIRI. (1987) Land type series. Memoirs on the Agricultural
Natural Resources of South Africa. In. Soil and Irrigation
Research Institute, Department of Agriculture and Water
Supply, Pretoria, South Africa.
Thomas, C.D., Cameron, A., Green, R.E., Bakkenes, M.,
Beaumont, L.J., Collingham, Y.C., Erasmus, B.F.N.,
De SIQueira, M.F., Grainger, A., Hannah, L., Hughes, L.,
B. A. Bradley et al.
436 Diversity and Distributions, 18, 425–437, ª 2012 Blackwell Publishing Ltd

Huntley, B., Van Jaarsveld, A.S., Midgley, G.F., Miles, L.,
Ortega-Huerta, M.A., Peterson, A.T., Phillips, O.L. & Wil-
liams, S.E. (2004) Extinction risk from climate change.
Nature, 427, 145–148.
Thuiller, W., Brotons, L., Araujo, M.B. & Lavorel, S. (2004)
Effects of restricting environmental range of data to pro-
ject current and future species distributions. Ecography, 27,
165–172.
Turner, W.R., Bradley, B.A., Estes, L.D., Hole, D.G., Oppen-
heimer, M. & Wilcove, D.S. (2010) Climate change: helping
nature survive the human response. Conservation Letters, 3,
304–312.
Warren, D.L. & Seifert, S.N. (2011) Ecological niche modeling
in Maxent: the importance of model complexity and the
performance of model selection criteria. Ecological Applica-
tions, 21, 335–342.
Wilson, W.W., Koo, W., Dahl, B. & Taylor, R. (2008) Impacts
of ethanol expansion on cropping patterns and grain flows.
Review of Agricultural Economics, 30, 642–663.
Ziska, L.H. (in press) Climate change, carbon dioxide and
global crop production: food security and uncertainty.
Handbook on climate change and agriculture (ed. by A. Dinar
and R. Mendelson). Edward Elgar, Cheltenham, UK.
SUPPORTING INFORMATION
Additional Supporting Information may be found in the online
version of this article:
Appendix S1 Sensitivity to ensemble model threshold.
Appendix S2 A2 Emission Scenario Results.
Figure S1 The effect on changing the ensemble model
suitability threshold on estimated land area.
Figure S2 Changes in climatic suitability for non-irrigated
maize in South Africa based on the A2 emissions scenario.
Figure S3 Changes in climatic suitability for non-irrigated
wheat in South Africa based on the A2 emissions scenario.
Figure S4 Changes in climatic suitability for non-irrigated,
high-productivity wheat based on the A2 emissions scenario.
As a service to our authors and readers, this journal provides
supporting information supplied by the authors. Such
materials are peer-reviewed and may be re-organized for
online delivery, but are not copy-edited or typeset. Technical
support issues arising from supporting information (other
than missing files) should be addressed to the authors.
BIOSKETCH
Bethany Bradley is an assistant professor of Environmental
Conservation at the University of Massachusetts, Amherst. She
is interested in how global change affects species distribution,
and the implications for biological conservation.
Author contributions: B.A.B., M.O., W.R.T. and D.S.W.
conceived of the study. L.D.E., D.G.H., S.H., R.E.S. and
M.A.T. collected, compiled or contributed data. B.A.B.
conducted the analyses with help from L.D.E. B.A.B. wrote
the manuscript with help from L.D.E., D.G.H., S.H., M.O.,
W.R.T. and D.S.W.
Editor: Graeme Cumming
Agricultural adaptation effects on conservation
Diversity and Distributions, 18, 425–437, ª 2012 Blackwell Publishing Ltd 437