and Approach - AIASarchive.uva-aias.net/uploaded_files/publications/81-3-3-1.pdf · The Measurement...
63
The Measurement of Tracking, Vocational Orientation, and Standardization of Educational Systems: a Comparative Approach Thijs Bol, Herman G. Van de Werfhorst GINI Discussion Paper 81 August 2013
Transcript of and Approach - AIASarchive.uva-aias.net/uploaded_files/publications/81-3-3-1.pdf · The Measurement...

!
!
!
!
!
!
!
!
!
!
!
!
!
!
The Measurement of Tracking, Vocational Orientation, and
Standardization of Educational Systems: a Comparative Approach
Thijs Bol, Herman G. Van de Werfhorst
!
GINI Discussion Paper 81 August 2013

!
August 2013 © Thijs Bol, Herman G. Van de Werfhorst, Amsterdam.
General contact: [email protected] Bibliograhic+Information+ Bol T.,Van de Werfhorst H. (2013). The Measurement of Tracking, Vocational Orientation, and Standardization of Educational Systems: a Comparative Approach. AIAS, GINI Discussion Paper 81. Information may be quoted provided the source is stated accurately and clearly. Reproduction for own/internal use is permitted.
This paper can be downloaded from our website www.gini-research.org.

!
The Measurement of Tracking, Vocational Orientation, and
Standardization of Educational Systems: a Comparative Approach
!
!
!
Thijs Bol, Herman G. Van de Werfhorst !
!
!
!
!
!
!
!
!
!
!
!
!August 2013
DP 81

Thijs Bol, Herman G. Van de Werfhorst
!
!
!
!
!
! !
The Measurement of Tracking, Vocational Orientation, and Standardization of Educational Systems: a Comparative Approach
!
Table of contents !
ABSTRACT .................................................................................................................................................................................. 1!
1.! THREE INSTITUTIONAL DIMENSIONS OF EDUCATIONAL SYSTEMS ........................................................................................................... 3!1.1.! Level of tracking .......................................................................................................................................................... 3!1.2.! Level of vocational orientation .................................................................................................................................... 4!1.3.! Level of standardization .............................................................................................................................................. 6!
2.! CENTRAL FUNCTIONS OF EDUCATION ............................................................................................................................................. 7!
3.! COMBINING EDUCATIONAL INSTITUTIONS AND CENTRAL FUNCTIONS OF SCHOOLING ................................................................................... 9!
4.! MEASURING EDUCATIONAL SYSTEMS ........................................................................................................................................... 10!4.1.! Level of tracking ........................................................................................................................................................ 11!4.2.! Level of vocational orientation .................................................................................................................................. 12!4.3.! Level of standardization ............................................................................................................................................ 13![Table 2 about here] .............................................................................................................................................................. 14![Table 3 about here] .............................................................................................................................................................. 14![Figure 1 about here] ............................................................................................................................................................. 15!
5.! DATA AND METHODS ............................................................................................................................................................... 16!
6.! RESULTS .............................................................................................................................................................................. 18![Table 4 about here] .............................................................................................................................................................. 18![Table 5 about here] .............................................................................................................................................................. 19!
CONCLUSION ............................................................................................................................................................................... 21!
REFERENCES ............................................................................................................................................................................... 22!Table 2, continued. ................................................................................................................................................................ 28!
APPENDICES ............................................................................................................................................................................... 36!
!

Thijs Bol, Herman G. Van de Werfhorst
!
List of Tables !
TABLE 1. SUMMARY OF HYPOTHESIZED RELATIONSHIPS BETWEEN EDUCATIONAL INSTITUTIONS AND FOUR CENTRAL FUNCTIONS OF EDUCATION. .................. 25!
TABLE 2. INDICATORS OF EDUCATIONAL SYSTEMS. ............................................................................................................................................... 26!
TABLE 3. PAIRWISE CORRELATIONS BETWEEN ALL INDICATORS .............................................................................................................................. 29!
TABLE 4. EFFECTS OF EDUCATIONAL SYSTEM ON FOUR CENTRAL FUNCTIONS OF EDUCATION (1). ................................................................................... 30!
TABLE 5. EFFECTS OF EDUCATIONAL SYSTEM ON FOUR CENTRAL FUNCTIONS OF EDUCATION (2). ................................................................................... 32!
LIST OF FIGURES
FIGURE 1. SCATTER PLOT OF TRACKING, VOCATIONAL ENROLMENT, AND VOCATIONAL SPECIFICITY. ............................................................................... 34!
!

The Measurement of Tracking, Vocational Orientation, and Standardization of Educational Systems: a Comparative Approach
!

The Measurement of Tracking, Vocational Orientation, and Standardization of Educational Systems: a Comparative Approach
Page !!1!
Abstract !
Educational systems differ on at least three dimensions: the timing and form of tracking of
students, the extent to which a system provides vocationally specific skills, and the extent to
which an educational system is standardized nationwide. Existing conceptualizations of these
three dimensions are rather fragmented, and in this article we develop new indicators for a
large number of countries, based on various sources of data (OECD, UNESCO, TIMSS, PISA
and Eurydice). With our new indicators we examine the relationship between the three
dimensions of educational systems and four core functions of schooling: equality of
opportunity, the optimization of students’ skills, the allocation of students to the labor market,
and the preparation for active participation in society at large.
JEL codes: I21; I25; I28
Keywords: education; educational expansion; educational levels

Thijs Bol, Herman G. Van de Werfhorst
Page !!2!
1. Introduction and motivation
Comparative research on education has taken a tremendous development in the past
decade. We have come to learn a lot about cross-national differences in the effect of education
on labor market outcomes (Shavit & Müller 1998; Breen & Buchmann 2002; Müller & Gangl
2003; Bol and Van de Werfhorst 2013), in levels of student achievement (Hanushek &
Wössmann 2005; Jenkins et al. 2008) and in effects of social origin on educational
achievement (Brunello & Checchi 2007, Van de Werfhorst and Mijs 2010). In understanding
this cross-national variation, researchers have proposed three different institutional
characteristics that drive these outcomes: the placement of students in different educational
tracks, the extent and the specificity of the vocational skills provided by a system, and the
extent to which an educational system is standardized (Allmendinger 1989; Shavit & Müller
1998; Kerckhoff 2006).
We argue that there are two issues on which improvement can be made. First, the
conceptualizations and operationalizations of (elements of) these three dimensions are
fragmented. For each study new indicators are used, sometimes developed for the specific
study, sometimes based on already existing indicators provided by statistical agencies. Often
the used classifications of educational systems are poorly documented so that other
researchers cannot replicate the findings or use the classifications of educational systems in
other research. With the increased availability of institutional data of educational systems
such as provided by the OECD, Eurydice, UNESCO, or other international organizations, it is
now possible to rank countries on the three institutional dimensions based on available data,
and make our classifications available to the field.
A second issue on which improvement can be made is the relationship between the three
institutional characteristics and four central “functions” of education. Functions, in this
understanding, should be seen as correlates of education on which basis one may judge the
extent to which education is functional to the tasks that are set to them. Typically comparative
research has examined educational inequality, skill optimization, and the allocation to the
labor market as central functions of education. Given the aims of educational systems to
improve equal opportunities, to optimize the attained skill level, and to provide skills relevant
for work, these are three important correlates on which we should want to know the impact of
institutions. In addition to these three functions that have been examined before, we study the
The Measurement of Tracking, Vocational Orientation, and Standardization of Educational Systems: a Comparative Approach
Page !!3!
impact of educational institutions on a fourth central function of education: to socialize
youngsters into society at large, by creating active citizens who actively participate in society.
In this paper we address both issues. First we give an overview of the three institutional
characteristics of education that are relevant for cross national comparisons. In comparison to
other data now used in the field our indicators are an improvement with respect to
transparency of our sources and the number of countries for which the data is available. A
total of 59, predominantly Western, countries have a score on one or more of the indicators.
Secondly we describe the four central functions of education and formulate hypotheses on the
relation between the institutional characteristics and these four functions. After this we will
describe our data and method and discuss the results. In the final section we conclude.
1. Three institutional dimensions of educational systems
!
Comparative stratification research has proposed three dimensions on which educational
systems can be classified cross-nationally: the level of tracking of students with different
levels of scholastic ability, the extent to which systems provide vocationally specific skills,
and the level of nation-wide standardization of regulations, funding, and examinations
(Allmendinger 1989; Kerckhoff 1995; Shavit & Müller 1998; Horn 2009). We follow this
literature and classify educational systems on these dimensions (albeit sometimes with two
indicators for one dimension).
1.1. Level of tracking
Educational systems firstly differ to the extent to which students are placed in different
educational tracks. Between these tracks it is clear which is the higher and which is the lower
track (Allmendinger 1989). Tracking, in earlier research also defined as the level of
stratification of an educational system (e.g. Shavit & Müller 1998), mainly takes place in
secondary education, although there is tracking in post-secondary education as well (Shavit et
al. 2007). It is important that our focus for this dimension is on tracking between educational
programmes,i instead of the differentiation of students within different streams or tracks
within the same educational programme. Arguably, systems that track between educational

Thijs Bol, Herman G. Van de Werfhorst
Page !!4!
programmes have more manifest forms of separating students on the basis of ability than
internally differentiated systems, because such systems are characterized by separation for the
full curriculum, often in separate school organizations, and for the duration of multiple years.
For example, Canada is a country where all students are in the same educational
programme during the majority of their secondary education. Although in Canada education is
organized on the provincial level, at almost all regions the tracking of students between
programmes is relatively low. Students start in “Primary” or “Kindergarten” and end up in a
“Secondary” or “Senior” programme. Other educational systems where there is a low level of
tracking can be found in the Scandinavian countries (Denmark, Sweden, Finland, and
especially Norway) and some of the Anglo-Saxon countries (United States, United Kingdom,
and Australia).
A country where tracking forms an important part of the educational system is Germany.
In Germany 10 year old students face three options after primary education: “Hauptschule”
(lowest level), “Realschule” (intermediate level), and “Gymnasium” (highest level).ii Next to
educational level these progammes differ in curricula and organization: the three options do
not teach the same subjects and differ, for example, in length. It is however possible to start at
“Hauptschule” and finally get an “Abitur” (the examination for the “Gymnasium”), but such
transitions are relatively rare. Other countries that have a tracked educational system are the
continental European countries (Netherlands, Belgium, Austria, and Luxembourg) as well as
some Eastern European countries (Slovenia and Hungary) and Turkey.
1.2. Level of vocational orientation
A second dimension on which educational systems differ is the level of vocational
orientation: the extent to which education provides students with vocational skills, and the
specificity of these skills. Education can supply students with general and specific skills, and
the balance between these two differs across educational systems. The specificity of skills in
education is mainly associated with vocational programmes, where the emphasis lies on
learning highly (work-)specific skills. While the prevalence of vocational education differs
across educational systems, there is as much variation in the specificity of the skills that are
taught in vocational educational programmes. Many educational systems provide vocational
programmes in a few broad fields, while other educational systems provide students with job
The Measurement of Tracking, Vocational Orientation, and Standardization of Educational Systems: a Comparative Approach
Page !!5!
specific skills by offering a dual system in which institutionalized education and working in
firms are combined. Both are categorized as vocational education, but the skills that are
provided in the dual system are more specific than those in broad vocational programmes.
Because of this, the dual system is said to be particularly relevant to provide students with
specific work-relevant skills (Breen 2005). Educational systems thus differ in the extent and
the form of their vocational training programmes and whether they offer a dual system (Shavit
& Müller 1998; Müller & Gangl 2003). Systems that are highly vocational provide (more)
students with specific skills, while less vocational systems produce more generally skilled
students.
While the United States and Canada are often mentioned as educational systems with
little emphasis on vocational training, Brazil belongs to this group as well. Education takes
place there in three main stages; fundamental, medium and higher education. There are some
possibilities in higher education to get vocational schooling, but the majority of education is
non-vocational (Gvirtz & Beech 2008).
The Czech Republic on the other hand, has an educational system where vocational
education is well-developed. Besides a Gymnasium programme there are several vocational
programmes that students can participate in (e.g. “Stredni Skola” or “Konzervator”).
Vocational education here does not only take place at the secondary but also on the tertiary
level. This means that a high percentage of students is enrolled in some kind of vocational
education. Next to broad vocational programmes the educational system of Czech Republic
has a strongly developed dual system as well. Here students are working and participating in
education at the same time. Continental European countries (Netherlands, Belgium, Austria,
and Switzerland) as well as some eastern European countries (Hungary, Slovakia, and
Slovenia) have educational systems that offer vocational programmes as well. The countries
where vocational education is less important are more geographically dispersed (e.g.,
Australia, Ireland, and Uruguay).

Thijs Bol, Herman G. Van de Werfhorst
Page !!6!
1.3. Level of standardization
All educational systems in all countries are to a certain degree standardized: “the degree to
which the quality of education meets the same standards nationwide” (Allmendinger 1989, p.
233). Standardization is achieved by institutions like the use of central exams, uniform
curricula, the same training for teachers, and standardized budgets. We distinguish between
two forms of standardization: standardization of input and standardization of output (cf.
Rowan 1990).
Standardization of input refers to the extent to which schools have limited control over the
input in education. Examples of such standardization are restrictions for schools on what they
teach and how they teach it. Some countries, for example Greece or Jordan, regulate the text
books that are used for courses, whilst others give more autonomy to schools.
Standardization of output, secondly, describes the extent to which educational performance
(the output) is tested against external standards. It tells us how much schools are held
accountable for their performance (Horn 2009). This could for example be induced by a
national inspectorate, or other regulatory institutes, but the most important institution
concerns centralized exit examinations. Central examination leads to a standardization of the
educational system as it obliges schools to learn their students what is examined in the central
exams. Pioneering work on this topic has been done by Bishop (1997) and Wössmann (2000;
2005). Bishop argues that we must specifically look at curriculum-based external exit exams
(CBEEEs) which guarantee a high level of standardization over the output of education.
Educational systems differ to a great extent on the dimension of standardization. A country
where the educational system is not strongly standardized is Italy. Here the grading system
and the commission that evaluate the exams are internally appointed by schools. This means
that there is no external control on the quality of the exams. As an effect there are big
disparities between regions; to obtain a degree in the Northern part of Italy probably more
knowledge is expected than getting the same degree in the South. Since there is no nationwide
external control educational degrees are hardly comparable.
In the Netherlands, on the other hand, the output of educational performance is highly
standardized. There is a national commission who has the control over all the exams for
secondary and vocational education. These standardized final exams, which are taken
regardless of the school attended, make up for half of the final grade in the examinations, and

The Measurement of Tracking, Vocational Orientation, and Standardization of Educational Systems: a Comparative Approach
Page !!7!
norms are set at the national level on the minimum grades in the centralized final exams.
Even at primary schools a standardized test (the CITO-test) is used. In the Netherlands the
input of education is less standardized as schools have the freedom to choose study material.iii
Other standardized educational systems can be found in, for example, Iceland, New Zealand
and South Africa whereas the educational systems in Switzerland, Belgium and Cyprus are
characterized by lower levels of standardization.
2. Central functions of education !
Education can be seen to have four central functions in contemporary societies (see also
Fend 1974; Van de Werfhorst and Mijs 2010): allocating students to the labor market,
optimize skills, promote equality of opportunity, and to socialize into society at large. An
educational system that performs well on these aspects, is held to be a well-functioning
educational system.
As a first domain, an educational system can be said to be well-functioning if graduates of
different levels of education are well-prepared for the labor market. They have obtained
relevant skills for working life, and employers are well-informed about those skills and are
willing to reward these. This way, the labor market opportunities of school leavers are
optimized, as well as the production of firms. A well-functioning educational system therefore
adequately allocates students to the labor market.
The second function to which an educational system’s performance can be assessed
concerns the extent to which the system optimizes students’ skills. Students differ with regard
to their learning abilities, and education optimizes these abilities. An educational system can
be seen as well-functioning if educational achievements of students are maximized, given a
particular budget for education. The “total” production of knowledge and skills is then
optimized.
The third function of education is that it can optimize equal opportunities to children of
different social backgrounds. Educational systems can be seen as well-functioning if they
minimize inequality of educational opportunity. This is not to say that educational systems
would be able to fully eliminate educational inequalities, as inequalities partly result from
family processes in which educational policy cannot interfere. Yet, if two educational systems
differ in the extent to which they either enlarge or reduce inequalities, the system that reduces
inequalities can be seen as, ceteris paribus, a better functioning system. Although this function

Thijs Bol, Herman G. Van de Werfhorst
Page !!8!
of education highlights equality of opportunity rather than equality of outcomes, studies have
shown that both forms of equality are strongly linked (Duru-Bellat & Suchaut 2005).
The fourth function of educational institutions is to socialize the youth into society at large.
By socialization, we refer to increasing the commitment to, and involvement with, the society
of which youngsters will be part. Through schooling, students get informed about regional,
national and supranational institutions (e.g. legal or political), obtain knowledge on current
affairs, develop democratic attitudes, and improve their social skills. All these civic qualities
will help them to be involved with societal issues at large, helping them to become active
citizens. A well-functioning educational system not only optimizes these qualities, but also
minimizes variations between students in them. A common view in political philosophy is
that the only legitimate justice criterion in the relationship between the state and its citizens is
equality (e.g. Verba et al. 1995; Miller 1999). An educational system that “socializes
selectively,” by increasing inequalities in civic and political engagement is thus harmful to
democratic equality, and may hence be seen as malfunctioning.
Within a given educational institutional structure, some of these four functions may be
more easily met than others. A system that focuses on skill optimization may, for example
perform less well when it comes to equality of opportunity (Brunello & Checchi 2007). This
implies that, in the design of educational institutions, governments have to face policy trade-
offs when a particular institution serves one function but harms another (Van de Werfhorst
and Mijs 2010). Another trade-off is that between labor market preparation and equality of
opportunity (Bol and Van de Werfhorst 2013). It is well-known that a strong vocational
educational sector helps youngsters in the transition process from the educational system to
the workplace. For instance, youth unemployment is lower in countries with a strong dual
system (Breen 2005). On the other hand, several studies showed that the specific skills
acquired in a dual system are not always beneficial. During the life course specific skills turn
out to be one of the reasons of long unemployment. Furthermore, people from a dual system
are more often stuck in poorly-paid jobs (Korpi et al. 2003). Yet, there still is a significant
social class effect on choice for vocational versus generic types of schooling. If people
enrolled in vocational secondary have fewer opportunities to enroll in tertiary education,
strongly vocationally oriented systems may enlarge social class differences in the attainment
of a tertiary-level degree.

The Measurement of Tracking, Vocational Orientation, and Standardization of Educational Systems: a Comparative Approach
Page !!9!
3. Combining educational institutions and central functions of schooling !
In this paper we study the four correlates of education and their connection to the three
educational institutional dimensions. In Table 1 we summarize the hypothesized relationships
between educational institutions and four core functions of education.
[Table 1 about here]
The first function that we distinguished concerns the way that education allocates people to
the labor market. As said above, more vocationally oriented educational systems provide
students with specific skills which should make the education to work transition easier. We
therefore hypothesize that the school-to-work transition happens smoother the more
vocationally oriented a countries’ educational system is. Usual indicators for how effective
education allocates students in the labor market are the level youth unemployment (Breen
2005), and the length of the school-to-work transition (Wolbers 2003). We expect these
effects for both the prevalence of vocational education (hypothesis 1a) and the vocational
specificity (hypothesis 1b).
The second task is skill optimization, making sure that the attained skill level in a society is
maximized given a particular budget for education. A simple measure of this goal is average
academic achievement. Several studies showed that the level of standardization of output of
an educational system enhances student performance (Bishop 1997; Horn 2009). A first
rationale is that students are willing to work harder if they know that the degree they are
working for has a higher value. This is believed to be the case in educational systems where
the output is standardized by using, for example, exams (Spence 1975; Stiglitz 1975). A
second reason is that because the government monitors the quality of education more in more
standardized educational systems the performance increases. Earlier research found
significant effects of the level of standardization of output on student performance (Bishop
1997; Fuchs & Wössmann 2007; Hanushek & Raymond 2004). We therefore expect that in
educational systems in which output is standardized the average student performance is higher
(hypothesis 2a). However, with regard to input, it has been argued that weak standardization
leads to higher performance due to higher levels of competition between schools (Wössmann
2003). So hypothesis 2b reads that higher levels of standardization of input lead to lower
average school performance.

Thijs Bol, Herman G. Van de Werfhorst
Page !!10!
The third function of education is to enhance equality of opportunity. Research showed
that the effect of tracking on equality of opportunities is negative (Erikson & Jonsson 1996;
Lucas 2001; Van de Werfhorst and Mijs 2010): the more tracked the educational system is,
the lower the equality of educational opportunity. In systems where the choice of educational
programme is made earlier, and has more severe consequences because of the rigid form of
selection in separate school organizations for the duration of multiple years, it is likely that
parents play a relatively large role in educational decision making. Given that the distribution
of achievement is strongly related to school type, social origin is relatively important for one’s
place in the distribution of student performance in more strongly tracked educational systems
(hypothesis 3).
Finally, a function of educational institutions is to socialize students into society, thereby
promoting active citizenship. Thus far only limited evidence exists for the relation between
this central function and the educational institutional structure . It is however plausible that
tracking has a negative impact on commitment to active citizenship. It prohibits
communication between groups that are strongly separated on the basis of social and ethnic
background, and communication is central to the development of critical citizens. Hyland
(2006) has, for example, argued that a more heterogeneous composition of school classes lead
to more equality in democratic attitudes and values on political participation. Janmaat and
Mons (2011) demonstrate that the variability in civic competences is larger in countries with a
tracked educational system. It is likely that students in the academic programmes get trained
in civic competences related to critical thinking, whereas students in the vocational
programmes get little education with regard to skills that are relevant for political awareness,
and knowledge on democratic institutions (Ten Dam & Volman 2003). Therefore, we expect
that tracking leads to lower levels of active citizenship (hypothesis 4).
4. Measuring educational systems !
A large share of this article is dedicated to the description of our measurements of the three
dimensions of educational systems. While these dimensions are theoretically very relevant
and often used in research, a clear overview of how they can be measured is missing in the
literature. Most of the indicators we propose are derived from a principal factor analysis. This
means that the score of each country on a certain dimension is based on its relative position
relative to all the other countries that are in the sample. Eventually we create standardized

The Measurement of Tracking, Vocational Orientation, and Standardization of Educational Systems: a Comparative Approach
Page !!11!
indicators on a maximum number of countries on which we were able to collect data. The
score of a country on this standardized indicator is therefore fixed, and independent on
whether a country is part of one particular empirical analysis or not. This is particularly
helpful because it may help other researchers to use our scales independent of the countries
they have in their dataset.
We decided to perform separate factor analyses for each dimension, as this allows us
to increase the number of countries that have the available data for the specific dimension. All
the specific references and sources of the data we use to create the indicators is summarized in
appendix A.
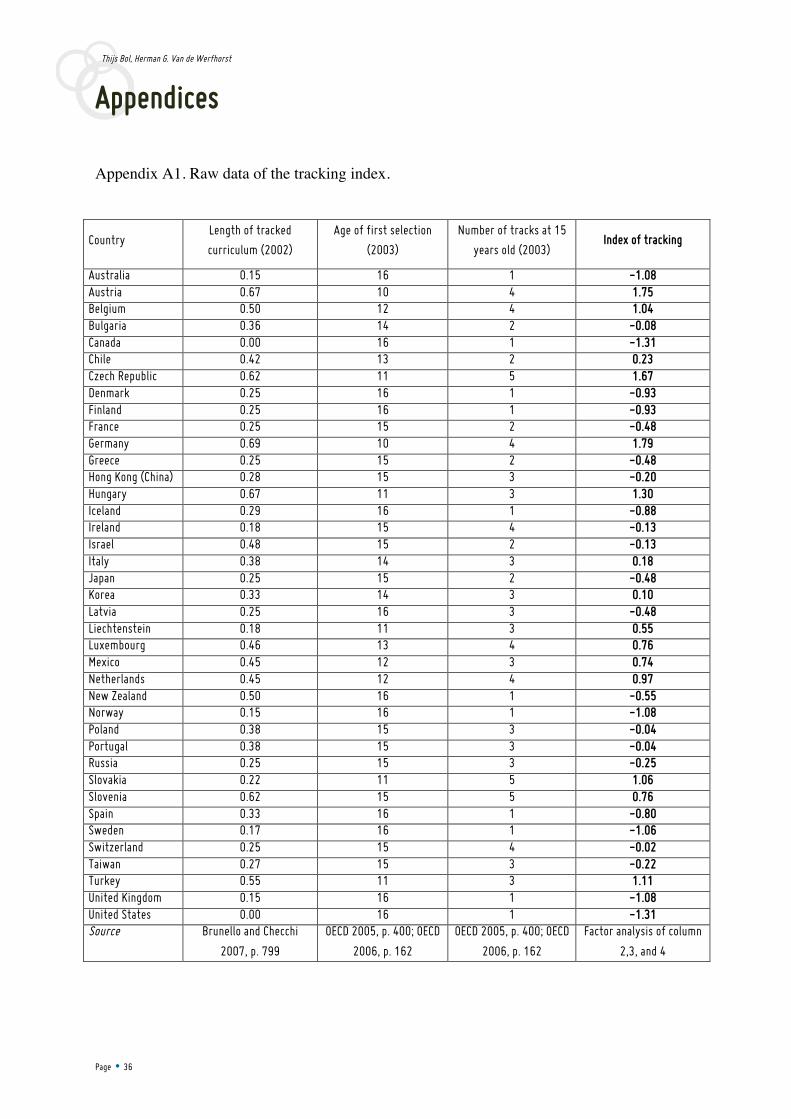
4.1. Level of tracking
The level of tracking is constructed by performing a factor analysis on three country level
variables that are good indicators for tracking. The first indicator that we use is the age of first
selection. This indicator tells us when the actual tracking starts. It is the most important
indicator of tracking and often used as the only indicator (see, e.g., Hanushek & Wössmann
2006). Data for this indicator is gathered by OECD (2005). The second indicator we use is the
length of the tracked curriculum. This indicator expresses the tracked curriculum as a
percentage of the total curriculum in secondary education. The length of the tracked
curriculum is derived from Brunello and Checchi (2007) and tells us what share of
educational programmes takes place in tracked form. The third and final indicator that is used
to construct the index is the number of distinct school types that are available for 15-year old
students. The logic behind this indicator is that tracking takes place, or at least starts,
especially in secondary education and the number of different educational programmes that
are available for someone of the age of 15 indicate tracking of an educational system best. It
tells us something not on the time when tracking starts or what share of the educational
system is differentiated, but on the extent to which this is the case. The data for this indicator
was derived from the OECD (2005). Together these three variables give a comprehensive
view on tracking and pay attention to all theoretical aspects of the dimension.
On these three indicators a principal factor analysis was performed, and all three indicators
loaded on one factor. The eigenvalue of this factor was 1.76, giving enough statistical
leverage to claim that all three variables indicate one latent concept. All factor loadings are

Thijs Bol, Herman G. Van de Werfhorst
Page !!12!
saved as regression coefficients., thereby giving all countries a relative score on the index of
tracking, with a mean of zero and a standard deviation of one.
4.2. Level of vocational orientation
The level of vocational orientation is divided in two variables: the prevalence of vocational
enrolment and the specificity of the vocational education. The reason why we chose this less
parsimonious way of summarizing the vocational orientation of educational systems has to do
with the specific role of specific skills that are taught in the dual system (especially on the
allocation of students in the labor market) that is emphasized by several studies (e.g. Breen
2005).
The first indicator of vocational orientation is the prevalence of vocational enrolment.
There is a high level of between country variance with respect to the percentage of students
that are enrolled in any kind of vocational education (the specificity of this vocational
education is addressed by the next measure). Our focus is on the amount of students that are
enrolled in vocational programmes in upper secondary education, as vocational schooling
mostly takes place in upper secondary education. On top of this, it is especially vocational
education in upper secondary educational programmes that provide the final schooling before
entering the labor market. To measure the prevalence of vocational education we use two
indicators: vocational enrolment as a percentage of upper secondary education as measured by
the OECD (2006) and by UNESCO.iv To reduce measurement error we use both indicators
instead of just one and perform a principal factor analysis to create a new index of enrolment
in vocational programmes. The eigenvalue of the one factor that stood out was 1.84, and the
factor loadings are saved the factor as regression scores. The new index, vocational
enrolment, has a mean of zero and a standard deviation of one.
While enrolment in vocational programmes reveals the prevalence of vocational
education—which is indicative of the extent to which vocational education is institutionalized
in a country—another element of vocational education examines more deeply how the
vocational training system is set up. In particular, vocational education and training systems
differ in the extent to which learning takes place in a dual (school-based and work-based)
form. The existence of a dual system tells us a lot on the provision of specific vocational
skills. In a dual system students learn and work at the same time, based on the idea that the

The Measurement of Tracking, Vocational Orientation, and Standardization of Educational Systems: a Comparative Approach
Page !!13!
necessary skills for a job are best learned on the job. Instead of only focusing on learning in
the context of a school, the context of the employer is at least as important. The strength of
the dual system is measured by a single indicator; the percentage of students in upper
secondary education that are in a dual system (OECD 2007).
4.3. Level of standardization
Following the theoretical section, we operationalize the level of standardization in two
different variables: standardization of input and standardization of output. Standardization of
input deals with the autonomy of schools and the extent to which they can decide by
themselves how and what they teach. This is an important category for the level of
standardization: the more schools are alike in terms of teaching methods and curriculum, the
more standardized an educational system is. When schools cannot decide themselves how
they organize their education, there will be higher similarities in students’ knowledge in
different schools. In the 2006 data of the Programme for International Student Assessment
(PISA), school principals were surveyed on topics that concern the standardization of input.
We aggregated three questions to the country level (with the lowest score being the most
autonomous and the highest score being the most standardized) and a principal factor analysis
was performed on these variables. The variables measure the extent to which schools are
autonomous in choosing textbooks, the course content, and the courses that are being offered.v
These variables give an accurate view on how much a school is standardized with respect to
input. All variables range from zero (low level of standardization of input) to one (high level
of standardization of input), which resembles the percentage of principals in a country who
answered positive or negative to the questions. On these four variables a principal component
factor analysis was performed and one factor stood out (eigenvalue=2.14), interpreted by us
as the level of standardization of input. The index has mean of zero and a standard deviation
of one.
The second index of standardization is standardization of output. The indicator that is most
important for this kind of standardization is the existence of centralized exit exams. In
educational systems with nationally regulated exit exams the quality of the skills obtained in
education are standardized. Although a national educational board, a national curriculum or
national education inspectorate are other potentially relevant indicators, the existence of

Thijs Bol, Herman G. Van de Werfhorst
Page !!14!
central examinations have the most direct bearing on the accountability of schools and thus
the standardization of their output. In countries with a national curriculum, it remains unclear
if the students are on the same level after attaining the same education. In the measurement of
central examinations we follow the five criteria proposed by Bishop (1997, p. 260). Firstly
exams should have real consequences and not only be symbolic. Secondly degrees issued
after exams are tested against an external standard. Thirdly, the central examinations are
organized by discipline. Fourthly, it is not only a pass and fail exam, but there is also some
differentiation in the possible outcome. Finally it concerns secondary school students and
covers almost the complete secondary student population. All these criteria ensure that it is
standardization of output that is imposed by central exams.
Standardization of output is a dummy variable: when there are central exams in secondary
education a country scores a one. Two sources of data were used in determining the existence
of central exams. The first source for information was the section on examinations,
qualifications and titles in the European Glossary on Education (Eurydice 2004). The second
source utilizes earlier research on this topic by Wössmann (2005) and Wössmann et al. (2009,
p. 123). Their data is based on accounts of national experts and is not completely a
dichotomous variable. Following Wössmann et al. (2009, p. 123), in four countries (United
States, Germany, Canada and Australia) the percentage of regions where central examination
exists is used.
[Table 2 about here]
Summary
In Table 2 all five indicators are shown for as many countries as we could find data for. All
sources and raw indicators are tabled in Appendix A. To summarize this paragraph on the
description of the data we will discuss the correlations between the five indicators.
[Table 3 about here]
Table 3 shows that tracking has a sizeable correlation with both indicators of vocational
orientation: 0.48 and 0.40 for vocational prevalence and vocational specificity, respectively.

The Measurement of Tracking, Vocational Orientation, and Standardization of Educational Systems: a Comparative Approach
Page !!15!
This indicates that tracked educational systems are often also those systems that offer (more)
vocational education. The most likely explanation for this high correlation is that in
comprehensive systems with only one track (for example the United States), this one track
will offer general instead of vocational education. When there is a high level of tracking, it is
likely that at least one of the tracks will have a vocational nature or takes place in the form of
a dual system. We can see this even better in Figure 1, where we plotted all countries on their
levels of tracking, vocational prevalence, and vocational specificity.
[Figure 1 about here]
Although most countries follow the general pattern where high levels of tracking and
vocational orientation are combined, there are educational systems, in particular in
Scandinavian countries, England and Australia, that have a relatively high score on the
vocational orientation index but not on the tracking index. These systems are characterized by
non-differentiated schooling until around the age of 16, after which vocational programmes
are offered that are quite sizable in terms of student numbers. In Denmark the vocational
specificity comes also in the form of a sizeable dual system.
Figure 1 also shows the scatter plot of both indicators of the dimension of vocational
orientation; the prevalence of vocational enrolment and the vocational specificity. As
expected we find a positive correlation between the two variables (0.54, see Table 2). The
correlation is however far from perfect, indicating that the distinction between vocational
prevalence and specificity is not only theoretically but also empirically relevant. While in
some countries (for example Slovenia) a large amount of students is enrolled in vocational
education, the skills that they obtain are not highly specific. In other countries, for example
Estonia or Hungary, the total percentage of students enrolled in vocational education is not
extremely high; however, most of them are enrolled in a dual system.
The final dimension is standardization and consists of two indicators: the standardization
of input and the standardization of output (central examinations). The correlations between
the standardization of input and all other indicators are relatively small: 0.21 with tracking, -
0.14 with vocational prevalence, and -0.11 with vocational specificity, and 0.01 with
standardization of output. One reason for the positive correlation between tracking and
standardization of input is that creating a homogenous curriculum is easier when students with
different ability levels are clustered in different tracks. It is difficult to standardize textbooks,

Thijs Bol, Herman G. Van de Werfhorst
Page !!16!
for example, when students of different ability levels are in the same track, whilst this is not
the case in tracked systems.
The negative correlations of standardization of input with both indicators of vocational
orientation could point to the fact that vocational programs are less suited for standardization.
In vocational programs often job-specific skills are gained, which makes it hard to test these
nationwide, or standardize the input of these vocational skills. This is also confirmed by the
negative correlation between standardization of output (central exams) and vocational
specificity (-0.29), which again shows that educational systems that offer vocationally specific
skills less often implement central exit exams. Finally, the correlation table shows that there is
no correlation between the standardization of input and the standardization of output. This
demonstrates that the distinction between standardization of output and input is a relevant
one; and that both are not related; at least not on the country level.
5. Data and methods !
In the previous paragraph we presented the three dimensions of educational systems, the
five variables that we created for these dimensions, and the ways in which these are related.
Now we turn to the question to what extent these indicators are related to central functions of
education: allocating students to the labor market, sort efficiently to maximize learning, to
offer equal opportunities, and to socialize youngsters into society at large by stimulating
active citizenship.
To study this we perform OLS regressions and use the indicators we established for the
three different dimensions as independent variables. It is important to note that our analyses
are carried out using country-level information only, and therefore are not suited to base
strong individual level claims on. However, the analyses are mainly aimed to test the validity
of our indicators, and only to provide a broad picture of the relationship between the
institutional variables and central outcomes of education systems.
To measure the allocation function of education we use two variables (cf. Bol and Van
de Werfhorst 2013). First, we focus on the level of youth unemployment as a ratio of adult
unemployment. The youth unemployment ratio is derived from the UNESCO online database
and is based on data from the year 2002. The second variable we use is the average duration
of the school-to-work transition, as measured by the OECD in the Employment Outlook of
2008 (OECD 2008b, p. 72). When educational systems function well according to labor
The Measurement of Tracking, Vocational Orientation, and Standardization of Educational Systems: a Comparative Approach
Page !!17!
market allocation, this should be displayed by low youth unemployment and short duration
spells between leaving school and entering the labor market.
Skill optimization, the second function of education, is measured by using the average
score on a cognitive test. We use a country aggregate of data from the PISA 2009 study, a
large country comparative performance survey. Here we use the aggregate country score on
the PISA 2009 mathematics test. The results we present later are highly similar to results
using the score on the PISA 2009 science or reading test as dependent variable.
The third function of education, relating to equality of opportunities, is measured with data
from PISA 2009 as well. On the basis of that survey we calculated the effect of social origin
on performance. The used indicator takes the difference between the average performance on
the mathematics test of children who grew up in a high social class environment (top decile)
and the average performance on the mathematics test of children who grew up in a low social
class environment (bottom decile). A larger score on this indicator means a larger class-based
gap in the score on the mathematics test (cf. Bol and Van de Werfhorst 2013).
The final function of education, relating to preparing youth for active civic engagement, is
measured by the level of participation in voluntary organizations other than a religious, sports,
leisure, political organization or a trade union. We use the data of the International Social
Survey Programme (ISSP) of 2004, where a special section was dedicated to citizenship. We
aggregated individual scores of the dummy variable (participation = 1) to the country level.
All results are controlled for the percentage of GDP per capita that is spent on each student
in secondary education (World Bank Datavi) to make sure that we are not measuring an effect
of resources instead. The results for the two dependent variables that are associated with labor
market allocation (youth unemployment ratio and length of school-to-work transition) are also
controlled for the strictness of employment protection, since this is well-known to affect the
transition from school to work (e.g., Nickell 1997). In appendix B the dependent variables,
control variables, and their sources, can be found.

Thijs Bol, Herman G. Van de Werfhorst
Page !!18!
6. Results !
In this section we discuss the regression results where the dimensions of educational
systems are the independent variables and the four central functions of education constitute
the dependent variables. The labor market allocation function of education, assessed by the
youth to adult unemployment rate and the length of the school-to-work transition, is related to
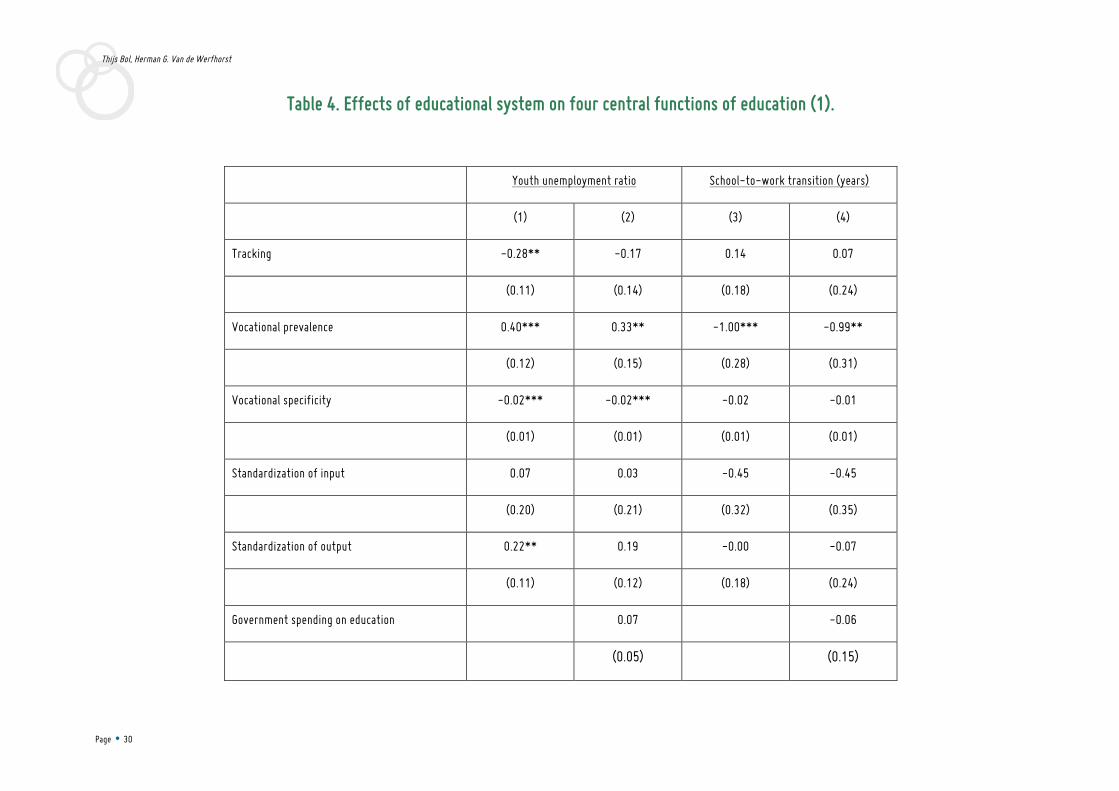
the educational institutional variables in Table 4.
[Table 4 about here]
In the Model 1 of Table 4 we see that four indicators are significantly related to the
youth/adult unemployment ratio. Tracking and vocational specificity decrease the extent to
which youth is unemployed, whereas the standardization of input and vocational prevalence
are positively related to youth unemployment. When we control our findings for government
spending on education and the strictness of employment protection two results remain. First,
we find that in countries where the educational system provides students with highly job-
specific skills in the form of a dual system there are relatively less unemployed youngsters.
Second, and more surprisingly, we find a negative effect of the vocational prevalence. Thus,
only the dual system, not just any form of vocational education, enhances the integration of
youngsters into employment (see also Breen 2005; Bol and Van de Werfhorst 2013). Net of
vocational specificity, the vocational prevalence even has a negative effect. The results shown
in Model 2 confirm hypothesis 1b, while with this dependent variable we do not find evidence
for hypothesis 1a.
In Model 3 and 4 the results of the regression with average length of school-to-work
transition as dependent variable is shown. Both indicators of vocational orientation have a
negative effect on the average time it takes to find a job, only the vocational prevalence,
however, has a significant effect. When an educational system is more vocationally oriented
the time it takes to find a job is lower, but this effect is particularly driven by the prevalence
of vocational education instead of the specificity of the skills that are taught. When more
students are enrolled in programs where they acquire job specific skills, the amount of years it
takes before students enter their first job is lower. By using this dependent variable we only
confirm hypothesis 1b, and find no evidence to substantiate hypothesis 1a.

The Measurement of Tracking, Vocational Orientation, and Standardization of Educational Systems: a Comparative Approach
Page !!19!
The second function of education is to optimize students’ skills, in order to enhance later
productivity. There are several ideas on how educational systems influence the performance
of students. The most important characteristic of educational systems that is argued to affect
student performance is standardization. Table 5 shows the outcomes of the regression
analysis.
[Table 5 about here]
With respect to standardization, we only find significant effects of standardization of input.
When schools are more standardized, the average performance is lower (Model 5). This is in
line with our hypothesis 2b, where we argue that a high level of standardization of input
decreases room for competition between schools. Our results confirm the findings by
Wössmann (2003), although in Model 6 the effects disappear. The effect of central exams, the
standardization of output, is positive in both models, but does not reach statistical
significance. Contrary to earlier findings we do not find support for hypothesis 2a, which
assumed a positive effect of standardization of output on average performance. There could
be different reasons why we do not fully confirm the results of earlier results with our data,
for example that the average score is equal across countries while the variation is much
higher. This is something that has yet to be researched.
The third function of education is to promote the equality of opportunity between social
classes. In Model 7 and 8 the regression results of educational dimensions on the difference
between PISA mathematics performances of higher and lower class children are shown. The
results clearly show that tracking increases the inequality of opportunity. The difference in
performance between students from a higher social class and students from a lower social
class increases as educational systems get more tracked. When students are separated in more
different tracks at a younger age, social background determines to a larger extent in which
track you will end up. Our hypothesis 3 is hereby confirmed: more tracking leads to a stronger
influence of socioeconomic class on science test scores.
The final function of education is to prepare students for active civic engagement. We
hypothesized that especially tracked educational systems may be harmful to this function, as
they increase the separation of students on the basis of social background. The results, using
participation in voluntary associations as dependent variable, are shown in Model 9 and 10.
As expected we find a negative effect of tracking on the average participation in voluntary
associations. The more tracked an educational system is, the less likely people are to be
Thijs Bol, Herman G. Van de Werfhorst
Page !!20!
“active” citizens. For all other education variables no effects where found, and we therefore
accept our hypothesis 4. How an educational system is organized seems related to the
socialization function of education.
The Measurement of Tracking, Vocational Orientation, and Standardization of Educational Systems: a Comparative Approach
Page !!21!
Conclusion !
For this paper we set two goals: (1) conceptualize the different dimensions of an
educational system and (2) see how these dimensions are related to four central functions of
education. We argued that there are three dimensions that one can distinguish in educational
systems: the extent to which they are tracked, the vocational orientation and the level of
standardization. These three dimensions turned out to be distinguishable with different
sources of macro-data which led to five institutional variables that are useable in future
research. The five variables are created for a large number of countries.
We also showed that dimensions of educational systems are related to four central
functions of education. Not all functions are performed equally well by each educational
system. This for example means that school leavers in educational systems with a strong
vocational orientation on average will be allocated to the labor market sooner, and that in
more tracked educational systems the educational opportunities of lower class children are
lower. We furthermore found a negative effect of the standardization of input on the
performance of students. More autonomous schools seem to enhance the performance of
students. Our final results showed that the level of tracking within an educational system
influences the civic behavior of citizens: in countries with a differentiated educational system
the participation in voluntary associations is lower than in countries were educational
programmes are not stratified.
These results should, however, be interpreted with caution: no micro level mechanisms
were empirically tested and the country level regression results cannot provide evidence for
such mechanisms. The results of this study do however show that several dimensions of
educational systems are highly important for highly different functions of education. It is
therefore as important to measure educational systems correctly and with more universal and
replicable measures. Only then the studies of the importance of educational systems on
differing outcomes can be compared.
!
!
!

Thijs Bol, Herman G. Van de Werfhorst
Page !!22!
References Allmendinger, J. (1989). Educational systems and labor market outcomes. European Sociological
Review, 5, 231-250.
Ayalon, H., & Gamoran, A. (2000). Stratification in Academic Secondary Programs and Educational Inequality in Israel and the United States. Comparative Education Review, 44, 54-80.
Bishop, J.H. (1997). The effect of national standards and curriculum-based exams on achievement. American Economic Review, 87, 260–264.
Bol, T., & Van de Werfhorst, H.G. (2013). Educational Systems and the Trade-off Between Labor Market Allocation and Equality of Educational Opportunity. Comparative Education Review, 57(2).
Breen, R. (2005). Explaining Cross-national Variation in Youth Unemployment: Market and Institutional Factors. European Sociological Review, 21, 125-134.
Breen, R, & Buchman, M. (2002). Institutional Variation and the Position of Young People: A Comparative Perspective. Annals of the American Academy of Political and Social Science, 580, 288-305.
Brunello, G., & Checchi, D. (2007). Does School Tracking Affect Equality of Opportunity? New International Evidence. Economic Policy, 22, 781-861.
Duru-Bellat, M., & Suchaut, B. (2005). L'approche sociologique des effets du contexte scolaire : Méthodes et difficultés. Revue internationale de psychologie sociale, 18, 5-42.
Erikson, R., & Jonsson, J.O. (1996). Can Education Be Equalized? The Swedish Case in Comparative Perspective. Boulder, CO: Westview Press.
Eurydice. (2004). European Glossary on Education. Volume 1 – Second Edition. Examinations, Qualifications and Titles. Brussels: Eurydice.
–––––––. (2005). Key Data on Education in Europe 2005. Brussels: Eurydice.
Fend, H. (1974). Gesellschaftliche Bedingungen schulischer Sozialisation. Weinheim, Germany: Beltz.
Fuchs, T., & Wössmann, L. (2007). What Accounts for International Differences in Student Performance? A Re-examination using PISA Data. Empirical Economics, 32, 433-464.
Gvirtz, S., & Beech, J. (2008). Going to School in Latin America. USA: Greenwood Press.
Hanushek, E.A., & Wössmann, L. (2005). Does Educational Tracking Affect Performance and Inequality? Differences-in-Differences Evidence Across Countries. Economic Journal, 116, C63-C76.
Hanushek, E.A., & Raymond, M.E. (2004). The Effect of School Accountability Systems on the Level and Distribution of Student Achievement. Journal of the European Economic Association, 2, 406-415.
Horn, D. (2009). Age of Selection Counts: A Cross-country Analysis of Educational Institutions. Educational Research and Evaluation, 15, 343-366.
Hyland, N.E. (2006). Detracking in the Social Studies: A Path to a More Democratic Education? Theory Into Practice, 45, 64-71.
Janmaat, J.G., & Mons, N. (2011). Promoting Ethnic Tolerance and Patriotism: The Role of Education System Characteristics. Comparative Education Review, 55, 56-81.
Jenkins, S.P., Micklewright, J., & Schnepf, S.V. (2008). Social segregation in secondary schools: how does England compare with other countries? Oxford Review of Education, 34, 21-37.

The Measurement of Tracking, Vocational Orientation, and Standardization of Educational Systems: a Comparative Approach
Page !!23!
Kerckhoff, A.C. (1995). Institutional Arrangements and Stratification Processes in Industrial Societies. Annual Review of Sociology, 21, 323-347.
–––––––. (2006). From Student to Worker. In Jeylan, T., Mortimer J.T., & Michael J. (Eds.), Handbook of the Life Course. New York: Springer.
Korpi, T., de Graaf, P., Hendrickx, J., & Layte, R. (2003). Vocational Training and Career Employment Precariousness in Great Britain, the Netherlands and Sweden. Acta Sociologica, 46, 17-30.
Lucas, S.R. (2001). Effectively Maintained Inequality: Education Transitions, Track Mobility, and Social Background Effects. American Journal of Sociology, 106, 1642-1690.
Miller, D. (1999). Principles of Social Justice. Cambridge, Mass.: Harvard University Press.
Müller, W., & Gangl, M. (2003). Transitions from Education to Work in Europe. Oxford/NY: Oxford University Press.
Nickell, S. (1997). Unemployment and Labor Market Rigidities: Europe versus North America. Journal of Economic Perspectives, 11, 55-74.
OECD. (2005). Education at a Glance 2005. Paris: Organization for Economic Cooperation and Development.
–––––––. (2006). Education at a Glance 2006. Paris: Organization for Economic Cooperation and Development.
–––––––. (2007). Education at a Glance 2007. Paris: Organization for Economic Cooperation and Development.
–––––––. (2008a). Education at a Glance 2008. Paris: Organization for Economic Cooperation and Development.
–––––––. (2008b). Employment Outlook.. Paris: OECD
–––––––. (2009). Education at a Glance 2009. Paris: Organization for Economic Cooperation and Development.
Rowan, B. (1990). Commitment and Control: Alternative Strategies for the Organizational Design of Schools Review of Education Research, 16, 353-389.
Shavit, Y., & Müller, W. (1998). From School to Work. A Comparative Study of Educational Qualifications and Occupational Destinations. Oxford, England: Clarendon Press.
Shavit, Y., Arum, R., & Gamoran, A.(2007). Stratification in Higher Education. A Comparative Study. Palo Alto, CA: Stanford University Press.
Spence, M. (1975). Job Market Signaling. Quarterly Journal of Economics, 87, 355-74.
Stiglitz, J.E. (1975). The theory of “screening”, education and the distribution of income. American Economic Review, 65, 283-300.
Ten Dam, G., & Volman, M. (2003). Life jacket and art of living. Social competency and the reproduction of inequality in education. Curriculum Inquiry, 33, 117-137.
UNESCO. (2006). International Standard Classification of Education: ISCED 1997. Paris: UNESCO.
Van de Werfhorst, H.G. & Mijs. J.J.B. (2010). Achievement inequality and the institutional structure of educational systems: A comparative perspective. Annual Review of Sociology, 36, 407-428.
Verba, S., Lehman Schlozman, K., & Brady, H.E. (1995). Voice and Equality: Civic Voluntarism in American Politics. Cambridge: Harvard University Press.
Wössmann L. (2000). Schooling Resources, Educational Institutions, and Student Performance: The International Evidence. Kiel Working Paper No. 983.
Thijs Bol, Herman G. Van de Werfhorst
Page !!24!
–––––––. (2003). Central Exams as the “Currency” of School Systems: International Evidence on the Complementarity of School Autonomy and Central Exams. CESifo DICE Report, 1, 46-56.
–––––––. (2005). The effect heterogeneity of central examinations: evidence from TIMSS, TIMSS-Repeat and PISA. Education Economics 13, 143-169.
Wössmann, L., Luedemann, E., Schuetz, G., & West M.R. (2009). School accountability, autonomy, and choice around the world. Cheltenham, UK: Edward Elgar.
!
!
!
!
!
!
!
!
!
!
!
!
!
!
!
!
!
!
!
!
!

The Measurement of Tracking, Vocational Orientation, and Standardization of Educational Systems: a Comparative Approach
Page !!25!
Tables
Table 1. Summary of Hypothesized Relationships between Educational Institutions and Four Central Functions of Education.∗
!
Labor market
allocation Skill optimization
Equality of opportunity
Socialization
Tracking Hypothesis 3:– Hypothesis 4: –
Vocational orientation
Vocational enrolment Hypothesis 1a: +
Vocational specificity Hypothesis 1b: +
Standardization
Standardization of input Hypothesis
2b:–
Standardization of output
Hypothesis
2a: +

Thijs Bol, Herman G. Van de Werfhorst
Page !!26!
!
Table 2. Indicators of educational systems.
!
Tracking Vocational prevalence Vocational specificity Standardization of input Standardization of ou output
Argentina -.902
Australia -1.078 .967 -1.175 .81
Austria 1.751 1.701 32.7 -.095 0
Belgium 1.041 .945 3.3 .033 0
Brazil 0 -.894
Bulgaria -.075 .623 1.182 1
Canada -1.315 -1.723 0 .905 .51
Chile .233 -.164 0 -.077
Colombia -.916 1
Croatia 1.691
Cyprus -1.23 0
Czech Republic 1.671 1.744 35.5 -.595 0
Denmark -.93 .455 47.7 -.298 1
Estonia -.441 30.9 -.647 1
Finland -.93 .737 10.5 -.614 1
France -.477 .393 11.3 -.008 1
Germany 1.789 .887 45 .018 .44
Greece -.477 -.306 5.1 2.067 0
Hong Kong -.204 -.976 1
Hungary 1.297 -.7 13.2 -.092 1
Iceland -.875 -.142 16.4 .138 1
Indonesia -.268 -.391 1
Iran 1
Ireland -.128 -.354 3.8 -.236 1
Israel -.127 -.269 4.1 .194 1
Italy .184 .948 0 -.34 1
Japan -.477 -.729 0 -1.243 1
Jordan -1.004 1.612
Korea (Rep.) .104 -.55 0 -1.151 1
Latvia -.477 -.184 .831 1
Liechtenstein .552 .004 1
Lithuania -.124 1
Luxembourg .755 .992 13.6 2.079 1
Macedonia

The Measurement of Tracking, Vocational Orientation, and Standardization of Educational Systems: a Comparative Approach
Page !!27!
Malaysia
Malta -1.186 1
Mexico .745 .298
Moldova -1.385 0
Morocco
! !

Thijs Bol, Herman G. Van de Werfhorst
Page !!28!
!
Table 2, continued. Netherlands .971 1.26 20 -.701 1
New Zealand -.546 0 -.762 1
Norway -1.078 .885 13.3 .459 1
Philippines -1.844 0
Poland -.043 .296 6.5 -.498 1
Portugal -.043 -.442 -.041 1
Romania .215 1
Russian Fed. -.25 .102 .157 1
Singapore 1
Slovakia 1.059 1.492 31.7 .817 0
Slovenia .764 1.056 3.7 1.293 1
South Africa
Spain -.803 -.001 2.8 -.841 0
Sweden -1.058 .686 0 -.127 0
Switzerland -.024 1.078 58.3 -1.114 0
Taiwan -.215 -.869
Thailand -.27 0 -1.103 1
Tunisia -1.593 0 2.077 1
Turkey 1.11 -.139 7.4 1.154 1 United Kingdom -1.078 .467 0 -.592 1
United States -1.315 -1.844 0 -1.089 .09
Uruguay -.943 0 1.287
NOTE. – All sources of the indicators can be found in Appendix A. Empty cells indicate missing values on that indicator. ! !

The Measurement of Tracking, Vocational Orientation, and Standardization of Educational Systems: a Comparative Approach
Page !!29!
Table 3. Pairwise correlations between all indicators
!
NOTE. – Based on calculations with data from Table 2 and Appendix B. Correlations are calculated for all countries that have a score on the two variables. The sample between the correlation is therefore different.
!
!
!
Variable 1 2 3 4 5
1 Tracking 1.00
2 Vocational enrolment 0.48 1.00
3 Vocational specificity 0.40 0.54 1.00
4 Standardization of input 0.21 -0.14 -0.11 1.00
5 Standardization of output -0.17 -0.08 -0.29 0.01 1.00
Thijs Bol, Herman G. Van de Werfhorst
Page !!30!
Table 4. Effects of educational system on four central functions of education (1).
!
Youth unemployment ratio School-to-work transition (years)
(1) (2) (3) (4)
Tracking -0.28** -0.17 0.14 0.07
(0.11) (0.14) (0.18) (0.24)
Vocational prevalence 0.40*** 0.33** -1.00*** -0.99**
(0.12) (0.15) (0.28) (0.31)
Vocational specificity -0.02*** -0.02*** -0.02 -0.01
(0.01) (0.01) (0.01) (0.01)
Standardization of input 0.07 0.03 -0.45 -0.45
(0.20) (0.21) (0.32) (0.35)
Standardization of output 0.22** 0.19 -0.00 -0.07
(0.11) (0.12) (0.18) (0.24)
Government spending on education
0.07
-0.06
(0.05)
(0.15)

The Measurement of Tracking, Vocational Orientation, and Standardization of Educational Systems: a Comparative Approach
Page !!31!
Employment protection legislation 0.17 0.08
(0.20) (0.38)
Constant 2.66*** 1.50* 4.15*** 4.59*
(0.19) (0.84) (0.33) (2.12)
R2 0.55 0.59 0.69 0.70
Observations 27 26 17 17
NOTE. – Based on calculations with data from Table 2 and Appendix B. The results in the models without controls remain the same with a constant sample (equal sample to the models with control variable).
* p<0.10, ** p<0.05, *** p<0.01

Thijs Bol, Herman G. Van de Werfhorst
Page !!32!
Table 5. Effects of educational system on four central functions of education (2).
!
Average score on math test Class-based difference on math test Civic participation
(5) (6) (7) (8) (9) (10)
Tracking -3.24 1.53 15.01** 13.03* -0.08*** -0.05**
(5.45) (6.26) (5.70) (6.91) (0.02) (0.02)
Vocational prevalence 2.16 0.04 -2.88 -1.29 0.01 0.02
(6.27) (6.23) (6.56) (6.89) (0.03) (0.02)
Vocational specifity 0.30 0.21 -0.03 -0.02 0.00 0.00
(0.34) (0.36) (0.35) (0.39) (0.00) (0.00)
Standardization of input -11.33** -8.68 0.65 -0.73 0.04 0.04
(5.19) (5.22) (5.42) (5.77) (0.03) (0.03)
Standardization of output 4.23 5.64 -11.53 -13.20 0.04 0.03
(10.01) (9.97) (10.46) (11.02) (0.04) (0.04)
Government spending on education
1.50
-0.08
0.02*
(2.34)
(2.59)
(0.01)

The Measurement of Tracking, Vocational Orientation, and Standardization of Educational Systems: a Comparative Approach
Page !!33!
Constant 491.68*** 475.78*** 109.08*** 109.55*** 0.17*** -0.08
(9.55) (27.44) (9.99) (30.32) (0.04) (0.13)
R2 0.25 0.22 0.33 0.31 0.47 0.58
Observations 28 27 28 27 23 23
NOTE. – Based on calculations with data from Appendix B. The results in the models without controls remain the same with a constant sample (equal sample to the models with control variable).
* p<0.10, ** p<0.05, *** p<0.01 ! !

Thijs Bol, Herman G. Van de Werfhorst
Page !!34!
Figures Figure 1. Scatter plot of tracking, vocational enrolment, and vocational specificity.

The Measurement of Tracking, Vocational Orientation, and Standardization of Educational Systems: a Comparative Approach
Page !!35!
AU
S!
AU
T!BE
L!BG
R!
CA
N!
CH
L!
CZ
E!
DN
K!
FI
N! FR
A!
DE
U!
GR
C!HU
N!
IS
L! IR
L!
IS
R!
IT
A!
JP
N!KO
R!
LV
A!
LU
X!
NL
D!NO
R!PO
L!PR
T!
RU
S!
SV
K!SV
N!ES
P!
SW
E!
CH
E!TU
R!
U
K!
US
A!
AU
T!
BE
L!CA
N!CH
L!
CZ
E!
DN
K!
FI
N!FR
A!
DE
U!
GR
C!
HU
N!
IS
L!IR
L!IS
R! IT
A!JP
N!KO
R!
LU
X!
NL
D!
NZ
L!
NO
R! PO
L!
SV
K!
SV
N!ES
P!SW
E!
CH
E!
TU
R!U
K!US
A!
AU
T!
BE
L!CA
N! CH
L!
CZ
E!
DN
K!ES
T!
FI
N!FR
A!
DE
U!
GR
C!
HU
N!
IS
L!IR
L!IS
R! IT
A!
JP
N!KO
R!
LU
X!MD
A!
NL
D!NO
R!PO
L!
SV
K!
SV
N!ES
P!SW
E!
CH
E!
TH
A!TU
N!
TU
R! U
K!US
A!
URY!
Tracking!
Vocational!enrolment!
Vocational!specificity!
-2! 0! 2!
-2!
0!
2!
-2! 0! 2!0!
20!
40!
60!
Thijs Bol, Herman G. Van de Werfhorst
Page !!36!
Appendices !
Appendix A1. Raw data of the tracking index.
!
Country Length of tracked curriculum (2002)
Age of first selection (2003)
Number of tracks at 15 years old (2003)
Index of tracking
Australia 0.15 16 1 -1.08 Austria 0.67 10 4 1.75 Belgium 0.50 12 4 1.04 Bulgaria 0.36 14 2 -0.08 Canada 0.00 16 1 -1.31 Chile 0.42 13 2 0.23 Czech Republic 0.62 11 5 1.67 Denmark 0.25 16 1 -0.93 Finland 0.25 16 1 -0.93 France 0.25 15 2 -0.48 Germany 0.69 10 4 1.79 Greece 0.25 15 2 -0.48 Hong Kong (China) 0.28 15 3 -0.20 Hungary 0.67 11 3 1.30 Iceland 0.29 16 1 -0.88 Ireland 0.18 15 4 -0.13 Israel 0.48 15 2 -0.13 Italy 0.38 14 3 0.18 Japan 0.25 15 2 -0.48 Korea 0.33 14 3 0.10 Latvia 0.25 16 3 -0.48 Liechtenstein 0.18 11 3 0.55 Luxembourg 0.46 13 4 0.76 Mexico 0.45 12 3 0.74 Netherlands 0.45 12 4 0.97 New Zealand 0.50 16 1 -0.55 Norway 0.15 16 1 -1.08 Poland 0.38 15 3 -0.04 Portugal 0.38 15 3 -0.04 Russia 0.25 15 3 -0.25 Slovakia 0.22 11 5 1.06 Slovenia 0.62 15 5 0.76 Spain 0.33 16 1 -0.80 Sweden 0.17 16 1 -1.06 Switzerland 0.25 15 4 -0.02 Taiwan 0.27 15 3 -0.22 Turkey 0.55 11 3 1.11 United Kingdom 0.15 16 1 -1.08 United States 0.00 16 1 -1.31 Source
Brunello and Checchi 2007, p. 799
OECD 2005, p. 400; OECD 2006, p. 162
OECD 2005, p. 400; OECD 2006, p. 162
Factor analysis of column 2,3, and 4
!

The Measurement of Tracking, Vocational Orientation, and Standardization of Educational Systems: a Comparative Approach
Page !!37!
Appendix A2. Raw data of vocational orientation !
Country Vocational enrollment in
upper secondary education (2004)a
Vocational enrollment in upper secondary
education (2006)b
Index of vocational enrollment
Vocational specificity (2005)c
Australia 62.48 61.63 0.97 Austria 78.59 77.93 1.70 32.70 Belgium 68.21 55.33 0.95 3.30 Brazil 4.70 0.00 Bulgaria 55.50 53.48 0.62 Canada 5.50 0.00 -1.72 0.00 Chile 36.14 37.94 -0.16 0.00 Cyprus 13.80 13.29 -1.23 Czech Republic 79.45 78.96 1.74 35.50 Denmark 46.79 54.44 0.45 47.70 Estonia 31.00 30.94 -0.44 30.90 Finland 60.09 54.02 0.74 10.50 France 56.46 42.71 0.39 11.30 Germany 61.22 59.38 0.89 45.00 Greece 33.95 33.94 -0.31 5.10 Hungary 23.74 26.68 -0.70 13.20 Iceland 38.46 36.73 -0.14 16.40 Indonesia 35.30 34.28 -0.27 Ireland 33.48 32.33 -0.35 3.80 Israel 35.18 34.38 -0.27 4.10 Italy 62.79 60.55 0.95 0.00 Japan 24.63 24.58 -0.73 0.00 Jordan 19.60 17.54 -1.00 Korea 29.46 27.73 -0.55 0.00 Latvia 39.10 34.31 -0.18 Luxembourg 63.93 61.34 0.99 13.60 Malta 14.90 14.14 -1.19 Moldova 10.50 9.76 -1.39 0.00 Netherlands 69.06 67.98 1.26 20.00 New Zealand 0.00 Norway 60.53 59.96 0.89 13.30 Philippines 0.00 0.00 -1.84 Poland 49.45 45.14 0.30 6.50 Portugal 28.46 33.29 -0.44 Russia 41.48 44.32 0.10 Slovakia 74.07 73.21 1.49 31.70 Slovenia 67.40 60.81 1.06 3.70 Spain 38.70 42.54 0.00 2.80 Sweden 53.41 58.12 0.69 0.00 Switzerland 64.85 64.15 1.08 58.30 Thailand 29.40 39.77 -0.27 0.00 Tunisia 3.00 7.93 -1.59 0.00 Turkey 37.25 37.97 -0.14 7.40 United Kingdom 71.48 31.77 0.47 0.00

Thijs Bol, Herman G. Van de Werfhorst
Page !!38!
United States 0.00 0.00 -1.84 0.00 Uruguay 18.70 20.98 -0.94 0.00 Source OECD 2006a, p. 281
UNESCO Online database. Factor analysis of
column 2 and 3 OECD 2007, p. 277
!
Appendix A3. Raw data for standardization.!
Determine textbooks
Determine course content
Determine course offerings
Standardization of input
Standardization of output
Argentina 0.074 0.159 0.085 -0.902
Australia 0.008 0.053 0.025 -1.175 0.81
Austria 0.045 0.457 0.442 -0.095 0
Belgium 0.023 0.555 0.457 0.033 0
Brazil 0.080 0.138 0.110 -0.894
Bulgaria 0.218 0.911 0.866 1.182 1
Canada 0.547 0.838 0.476 0.905 0.51
Chile 0.213 0.609 0.166 -0.077
Colombia 0.006 0.238 0.037 -0.916 1
Croatia 0.615 0.932 0.969 1.691
Cyprus
0
Czech Republic 0.342 0.239 0.051 -0.595 0
Denmark 0.000 0.378 0.395 -0.298 1
Estonia 0.272 0.219 0.083 -0.647 1
Finland 0.006 0.368 0.142 -0.614 1
France 0.000 0.392 0.618 -0.008 1
Germany 0.181 0.721 0.144 0.018 0.44
Greece 0.984 1.000 0.931 2.067 0
Hong Kong 0.027 0.144 0.075 -0.976 1
Hungary 0.027 0.468 0.446 -0.092 1
Iceland 0.102 0.472 0.575 0.138 1
Indonesia 0.125 0.293 0.321 -0.391 1
Iran
1
Ireland 0.000 0.644 0.153 -0.236 1
Israel 0.428 0.593 0.248 0.194 1
Italy 0.003 0.428 0.304 -0.340 1

The Measurement of Tracking, Vocational Orientation, and Standardization of Educational Systems: a Comparative Approach
! 39
Japan 0.022 0.016 0.000 -1.243 1
Jordan 0.871 0.871 0.781 1.612
Korea(rep) 0.026 0.058 0.026 -1.151 1
Latvia 0.392 0.875 0.489 0.831 1
Liechtenstein 0.250 0.417 0.417 0.004 1
Lithuania 0.183 0.533 0.234 -0.124 1
Luxembourg 0.903 1.000 1.000 2.079 1
Malta
1
Mexico 0.200 0.525 0.576 0.298
Netherlands 0.005 0.224 0.230 -0.701 1
New Zealand 0.000 0.300 0.100 -0.762 1
Norway 0.010 0.677 0.682 0.459 1
Philippines
0
Poland 0.068 0.086 0.502 -0.498 1
Portugal 0.006 0.705 0.243 -0.041 1
Romenia 0.149 0.770 0.276 0.215 1
Russian Federation
0.325 0.651 0.230 0.157 1
Singapore
1
Slovakia 0.423 0.725 0.619 0.817 0
Slovenia 0.538 0.843 0.796 1.293 1
Spain 0.006 0.266 0.067 -0.841 0
Sweden 0.000 0.437 0.472 -0.127 0
Switzerland 0.022 0.055 0.063 -1.114 0
Taiwan 0.043 0.185 0.107 -0.869
Thailand 0.061 0.052 0.047 -1.103 1
Tunisia 0.987 0.961 0.980 2.077 1
Turkey 0.419 0.906 0.700 1.154 1
United Kingdom 0.017 0.365 0.156 -0.592 1
United States 0.012 0.104 0.037 -1.089 0.09
Uruguay 0.601 0.808 0.783 1.287
Source Aggregation of PISA 2006
Aggregation of PISA 2006
Aggregation of PISA 2006
Factor analysis of column 1, 2, and 3
Eurydice (2004); Wössmann et al.
(2009,123)
! !

The Measurement of Tracking, Vocational Orientation, and Standardization of Educational Systems: a Comparative Approach
Page !!1!
Appendix B. Dependent variables and control variables.
Youth unemployment
ratio
School-to-work
transition (years)
Average score on math test
Class-based difference on
math test
Civic participati
on
Government spending on education
EPL
Argentina
388.068
Australia 2.60
514.340 82.35 0.28 13.77 1.38
Austria 1.70 2.00 495.909 92.44 0.25 11.01 2.41
Belgium 2.60 2.90 515.272 118.30 0.15 12.38 2.61
Brazil 2.90
385.814 99.71 0.07 16.18 2.27
Bulgaria 2.20
428.066 126.19 0.02 11.61
Canada 2.10
526.805 64.81 0.35 12.55 1.02
Chile 3.40
421.06 114.35 0.11 16.02 1.93
Colombia
380.848 122.08
14.18
Croatia
459.939
Cyprus 2.80
0.07 9.45
Czech Republic 2.60 3.00 492.814 151.62 0.13 10.51 2.32
Denmark 1.80 2.80 503.278 91.62 0.42 15.46 1.91
Estonia
4.30 512.104 74.95
13.94 2.39
Finland 2.60
540.504 59.60 0.36 12.60 2.29
France 2.60 2.80 496.782 128.48 0.34 10.59 3.00
Germany 1.20 1.50 512.778 73.04 0.12 9.73 2.63
Greece 3.30 4.40 466.096 97.77
9.20 2.97
Hong Kong 2.40
554.528 80.25
22.99
Hungary 2.50 4.70 490.170 156.63 0.04 10.92 2.11
Iceland 2.90
506.669 63.06
17.97 2.11

Thijs Bol, Herman G. Van de Werfhorst
Page !!2!
Indonesia 6.70 4.00 371.301 75.23
14.87 3.02
Iran
22.85
Ireland 2.20
487.136 77.32 0.27 13.93 1.39
Israel 2.40
446.864 81.77 0.21 13.27 1.88
Italy 3.70 3.40 482.908 86.41
9.21 2.58
Japan 2.10
528.993 70.03 0.07 9.51 1.73
Jordan
386.664 81.21
20.60
Korea (Rep.)
546.228 103.34 0.29 15.21 2.13
Latvia 2.00
481.954 80.88 0.10 13.28
!
Appendix B continued.
!
Liechtenstein
536.048 107.25
Lithuania
476.602 101.09
14.41
Luxembourg 3.20 2.60 489.067 111.99
9.82 3.39
Macedonia
15.62
Malaysia
86.34
18.24
Malta
90.70
14.86
Mexico 3.00
418.509 91.92 0.08 25.61 3.23
Moldova
93.65
20.18
Morocco
26.13
Netherlands 2.30 2.00 525.836 102.39 0.25 11.98 2.23
New Zealand 3.00
519.301 111.00 0.30 19.67 1.16
Norway 4.10
497.956 81.63 0.38 16.19 2.65
Philippines 3.10
0.16 16.66
Poland 2.60 3.40 494.803 113.71 0.05 11.99 2.41
Portugal 2.80 3.80 486.888 134.33 0.09 11.34 3.05
Romania
427.079 101.24
11.78
Russian Fed. 2.40
467.812 96.18 0.03 12.94 1.80
Singapore
562.019 126.88
15.27

The Measurement of Tracking, Vocational Orientation, and Standardization of Educational Systems: a Comparative Approach
Page !!3!
Slovakia 2.40 2.80 496.683 147.25 0.14 10.24 2.13
Slovenia 3.20
501.472 109.4 0.21 12.77 2.76
South Africa
17.65 1.35
Spain 2.30 4.40 483.493 103.12 0.14 11.12 3.11
Sweden 3.00 2.80 494.238 91.57 0.24 12.66 2.06
Switzerland 2.30 2.00 533.961 117.96 0.24 16.32 1.77
Taiwan
117.41 0.18
Thailand
418.584 122.37
25.02
Tunisia
371.484 92.95
21.46
Turkey 2.40
445.451 138.54
3.46
United Kingdom
2.80 2.60 492.414 83.67 0.17 11.90 1.09
United States
2.60
487.397 110.17 0.26 14.71 0.85
Uruguay
426.724 127.00 0.10 11.58
NOTE. – All sources of the indicators can be found in tshe text. Empty cells indicate missing values on that indicator.
!

!
!! !

!
GINI Discussion Papers Recent publications of GINI. They can be downloaded from the website www.gini-research.org under the
subject Papers.
DP 93 Crime, Punishment and Inequality in Ireland
Healy, D., Mulcahy, A. and I. O’Donnell
August 2013
DP 92 Euroscepticism and education: A longitudinal study of twelve EU member states, 1973-2010
Armen Hakhverdian, Erika van Elsas, Wouter van der Brug, Theresa Kuhn
August 2013
DP 91 An ever wider gap in an ever closer Union. Rising inequalities and euroscepticism in 12 West European democracies, 1976-2008
Theresa Kuhn, Erika van Elsas, Armèn Hakhverdian, Wouter van der Brug
August 2013
DP 90 Income Inequality and Status Anxiety
Marii Paskov, Klarita Ge ̈rxhani, Herman G. van de Werfhorst
August 2013
DP 89 "On the relationship between income inequality and intergenerational mobility"
Timothy M. Smeeding
August 2013
DP 88 The redistributive effect and progressivity of taxes revisited: An International Comparison across the European Union
Gerlinde Verbist, Francesco Figari
August 2013
DP 87 Activation strategies within European minimum income schemes
Sarah Marchal, Natascha Van Mechelen
August 2013
DP 86 Incequalities at work. Job quality, Health and Low pay in European Workplaces
Elena Cottini, Claudio Lucifora
August 2013

!
DP 85 The Relative Role of Socio- Economic Factors in Explaining the Changing Distribution of Wealth in the US and the UK
Frank Cowell, Eleni Karagiannaki and Abigail McKnight
August 2013
DP 84 Conditional cash transfers in high- income OECD countries and their effects on human capital accumulation
Márton Medgyesi, Zsolt Temesváry
August 2013
DP 83 The expansion of education in Europe in the 20th Century
Gabriele Ballarino, Elena Meschi, Francesco Scervini
August 2013
DP 82 The paradox of redistribution revisited: and that it may rest in peace?
Ive Marx, Lina Salanauskaite, Gerlinde Verbist
August 2013
DP 81 The Measurement of Tracking, Vocational Orientation, and Standardization of Educational Systems: a Comparative Approach
Thijs Bol, Herman G. Van de Werfhorst
August 2013
DP 80 On changes in general trust in Europe
Javier Olivera
August 2013
DP 79 A Critical Evaluation of the EU 2020 Poverty and Social Exclusion Target: An Analysis of EU-SILC 2009
Bertrand Maître, Brian Nolan, Christopher T. Whelan
August 2013
DP 78 Who Feels Inferior? A Test of the Status Anxiety Hypothesis of Social Inequalities in Health
Richard Layte, Christopher T.Whelan
August 2013
DP 77 Educational stratification in cultural participation: Cognitive competence or status motivation?
Natascha Notten, Bram Lancee, Herman G. van de Werfhorst, Harry B. G. Ganzeboom
August 2013

!
DP 76 Successful policy mixes to tackle child poverty: an EU-wide comparison
András Gábos
August 2013
DP 75 Income Inequality and the Family
Emma Calvert and Tony Fahey
August 2013
DP 74 The Impact of Publicly Provided Services on the Distribution of Resources: Review of New Results and Methods
Gerlinde Verbist, Michael Förster, Maria Vaalavou
August 2013
DP 73 Income Inequality and Support for Development Aid
Christina Haas
August 2013
DP 72 Accounting for cross-country differences in wealth inequality
Frank A. Cowell, Eleni Karagiannaki and Abigail McKnight
August 2013
DP 71 Mapping and measuring the distribution of household wealth
Frank Cowell, Eleni Karagiannaki and Abigail McKnight
November 2012
DP 70 Inequality and Poverty in Boom and Bust: Ireland as a Case Study
Brian Nolan, Bertrand Maître, Sarah Voitchovsky and Christopher T. Whelan
November 2012
DP 69 Return to education and income inequality in Europe and the US
Camilla Mastromarco, Vito Peragine and Laura Serlenga
December 2011
DP 68 Material Deprivation in Europe
Emma Calvert and Brian Nolan
October 2012

!
DP 67 Preferences for redistribution in Europe
Javier Olivera
November 2012
DP 66 Income Inequality in Nations and Sub-national Regions, Happiness and Economic Attitudes
Krzysztof Zagórski and Katarzyna Piotrowska
October 2012
DP 65 Socioeconomic gradients in children’s cognitive skills: are cross-country comparisons robust to who reports family background?
John Jerrim and John Micklewright
October 2012
DP 64 Cross-temporal and cross-national poverty and mortality rates among developed countries
Johan Fritzell, Olli Kangas, Jennie Bacchus Hertzman, Jenni Blomgren and Heikki Hiilamo
October 2012
DP 63 Parental health and child schooling
Massimiliano Bratti and Mariapia Mendola
September 2012
DP 62 The division of parental transfers in Europe
Javier Olivera Angulo
September 2012
DP 61 Expansion of schooling and educational inequality in Europe: Educational Kuznets curve revisited
Elena Meschi and Francesco Scervini
August 2012
DP 60 Income Inequality and Poverty during Economic Recession and Growth: Sweden 1991—2007
Jan O. Jonsson, Carina Mood and Erik Bihagen
August 2012
DP 58 The effect of parental wealth on children’s outcomes in early adulthood
Eleni Karagiannaki
July 2012

!
DP 57 Alike in many ways: Intergenerational and Sibling Correlations of Brothers’ Life-Cycle Earnings
Paul Bingley and Lorenzo Cappellari
August 2012
DP 56 Mind the Gap: Net Incomes of Minimum Wage Workers in the EU and the US
Ive Marx and Sarah Marchal
July 2012
DP 55 Struggle for Life: Social Assistance Benefits, 1992-2009
Natascha Van Mechelen and Sarah Marchal
July 2012
DP 54 Social Redistribution, Poverty and the Adequacy of Social Protection in the EU
Bea Cantillon, Natascha Van Mechelen, Olivier Pintelon, and Aaron Van den Heede
July 2012
DP 53 The Redistributive Capacity of Services in the EU
Gerlinde Verbist and Manos Matsaganis
July 2012
DP 52 Virtuous Cycles or Vicious Circles? The Need for an EU Agenda on Protection, Social Distribution and Investment
Bea Cantillon
July 2012
DP 51 In-Work Poverty
Ive Marx, and Brian Nolan
July 2012
DP 50 Child Poverty as a Government Priority: Child Benefit Packages for Working Families, 1992-2009
Natascha Van Mechelen and Jonathan Bradshaw
July 2012
DP 49 From Universalism to Selectivity: Old Wine in New Bottels for Child Benefits in Europe and Other Countries
Tommy Ferrarini, Kenneth Nelson and Helena Höög
July 2012

!
DP 48 Public Opinion on Income Inequality in 20 Democracies: The Enduring Impact of Social Class and Economic Inequality
Robert Andersen and Meir Yaish
July 2012
DP 47 Support for Democracy in Cross-national Perspective: The Detrimental Effect of Economic Inequality
Robert Andersen
July 2012
DP 46 Analysing Intergenerational Influences on Income Poverty and Economic Vulnerability with EU-SILC
Brian Nolan
May 2012
DP 45 The Power of Networks. Individual and Contextual Determinants of Mobilising Social Networks for Help
Natalia Letki and Inta Mierina
June 2012
DP 44 Immigration and inequality in Europe
Tommaso Frattini
January 2012
DP 43 Educational selectivity and preferences about education spending
Daniel Horn
April 2012
DP 42 Home-ownership, housing regimes and income inequalities in Western Europe
Michelle Norris and Nessa Winston
May 2012
DP 41 Home Ownership and Income Inequalities in Western Europe: Access, Affordability and Quality
Michelle Norris and Nessa Winston
May 2012
DP 40 Multidimensional Poverty Measurement in Europe: An Application of the Adjusted Headcount Approach
Christopher, T. Whelan, Brian Nolan and Bertrand Maître
July 2012

!
DP 39 Socioeconomic gradient in health: how important is material deprivation?
Maite Blázquez, Elena Cottini and Ainhoa Herrarte
March 2012
DP 38 Inequality and Happiness: a survey
Ada Ferrer-i-Carbonell and Xavier Ramos
March 2012
DP 37 Understanding Material Deprivation in Europe: A Multilevel Analysis
Christopher T. Whelan and Bertrand Maître
March 2012
DP 36 Material Deprivation, Economic Stress and Reference Groups in Europe: An Analysis of EU-SILC 2009
Christopher T. Whelan and Bertrand Maître
July 2012
DP 35 Unequal inequality in Europe: differences between East and West
Clemens Fuest, Judith Niehues and Andreas Peichl
November 2011
DP 34 Lower and upper bounds of unfair inequality: Theory and evidence for Germany and the US
Judith Niehues and Andreas Peichl
November 2011
DP 33 Income inequality and solidarity in Europe
Marii Paskov and Caroline Dewilde
March 2012
DP 32 Income Inequality and Access to Housing in Europe
Caroline Dewilde and Bram Lancee
March 2012
DP 31 Forthcoming: Economic well-being… three European countries
Virginia Maestri

!
DP 30 Forthcoming: Stylized facts on business cycles and inequality
Virginia Maestri
DP 29 Forthcoming: Imputed rent and income re-ranking: evidence from EU-SILC data
Virginia Maestri
DP 28 The impact of indirect taxes and imputed rent on inequality: a comparison with cash transfers and direct taxes in five EU countries
Francesco Figari and Alari Paulus
January 2012
DP 27 Recent Trends in Minimim Income Protection for Europe’s Elderly
Tim Goedemé
February 2012
DP 26 Endogenous Skill Biased Technical Change: Testing for Demand Pull Effect
Francesco Bogliacino and Matteo Lucchese
December 2011
DP 25 Is the “neighbour’s” lawn greener? Comparing family support in Lithuania and four other NMS
Lina Salanauskait and Gerlinde Verbist
March 2012
DP 24 On gender gaps and self-fulfilling expectations: An alternative approach based on paid-for-training
Sara de la Rica, Juan J. Dolado and Cecilia García-Peñalos
May 2012
DP 23 Automatic Stabilizers, Economic Crisis and Income Distribution in Europe
Mathias Dolls, Clemens Fuestz and Andreas Peichl
December 2011
DP 22 Institutional Reforms and Educational Attainment in Europe: A Long Run Perspective
Michela Braga, Daniele Checchi and Elena Meschi
December 2011
!
DP 21 Transfer Taxes and InequalIty
Tullio Jappelli, Mario Padula and Giovanni Pica
December 2011
DP 20 Does Income Inequality Negatively Effect General Trust? Examining Three Potential Problems with the Inequality-Trust Hypothesis
Sander Steijn and Bram Lancee
December 2011
DP 19 The EU 2020 Poverty Target
Brian Nolan and Christopher T. Whelan
November 2011
DP 18 The Interplay between Economic Inequality Trends and Housing Regime Changes in Advanced Welfare Democracies: A New Research Agenda
Caroline Dewilde
November 2011
DP 17 Income Inequality, Value Systems, and Macroeconomic Performance
Giacomo Corneo
September 2011
DP 16 Income Inequality and Voter Turnout
Daniel Horn
October 2011
DP 15 Can Higher Employment Levels Bring Down Poverty in the EU?
Ive Marx, Pieter Vandenbroucke and Gerlinde Verbist
October 2011
DP 14 Inequality and Anti-Globlization Backlash by Political Parties
Brian Burgoon
October 2011
DP 13 The Social Stratification of Social Risks. Class and Responsibility in the ‘New’ Welfare State
Olivier Pintelon, Bea Cantillon, Karel Van den Bosch and Christopher T. Whelan
September 2011

!
DP 12 Factor Components of Inequality. A Cross-Country Study
Cecilia García-Peñalosa and Elsa Orgiazzi
July 2011
DP 11 An Analysis of Generational Equity over Recent Decades in the OECD and UK
Jonathan Bradshaw and John Holmes
July 2011
DP 10 Whe Reaps the Benefits? The Social Distribution of Public Childcare in Sweden and Flanders
Wim van Lancker and Joris Ghysels
June 2011
DP 9 Comparable Indicators of Inequality Across Countries (Position Paper)
Brian Nolan, Ive Marx and Wiemer Salverda
March 2011
DP 8 The Ideological and Political Roots of American Inequality
John E. Roemer
March 2011
DP 7 Income distributions, inequality perceptions and redistributive claims in European societies
István György Tóth and Tamás Keller
February 2011
DP 6 Income Inequality and Participation: A Comparison of 24 European Countries + Appendix
Bram Lancee and Herman van de Werfhorst
January 2011
DP 5 Household Joblessness and Its Impact on Poverty and Deprivation in Europe
Marloes de Graaf-Zijl
January 2011
DP 4 Inequality Decompositions - A Reconciliation
Frank A. Cowell and Carlo V. Fiorio
December 2010

!
DP 3 A New Dataset of Educational Inequality
Elena Meschi and Francesco Scervini
December 2010
DP 2 Are European Social Safety Nets Tight Enough? Coverage and Adequacy of Minimum Income Schemes in 14 EU Countries
Francesco Figari, Manos Matsaganis and Holly Sutherland
June 2011
DP 1 Distributional Consequences of Labor Demand Adjustments to a Downturn. A Model-based Approach with Application to Germany 2008-09
Olivier Bargain, Herwig Immervoll, Andreas Peichl and Sebastian Siegloch September 2010

!
Information on the GINI project Aims
The core objective of GINI is to deliver important new answers to questions of great interest to European societies:
What are the social, cultural and political impacts that increasing inequalities in income, wealth and education may
have? For the answers, GINI combines an interdisciplinary analysis that draws on economics, sociology, political
science and health studies, with improved methodologies, uniform measurement, wide country coverage, a clear
policy dimension and broad dissemination.
Methodologically, GINI aims to:
� exploit differences between and within 29 countries in inequality levels and trends for understanding the impacts
and teasing out implications for policy and institutions,
� elaborate on the effects of both individual distributional positions and aggregate inequalities, and
� allow for feedback from impacts to inequality in a two-way causality approach.
The project operates in a framework of policy-oriented debate and international comparisons across all EU countries
(except Cyprus and Malta), the USA, Japan, Canada and Australia.
Inequality Impacts and Analysis
Social impacts of inequality include educational access and achievement, individual employment opportunities and
labour market behaviour, household joblessness, living standards and deprivation, family and household formation/
breakdown, housing and intergenerational social mobility, individual health and life expectancy, and social cohesion
versus polarisation. Underlying long-term trends, the economic cycle and the current financial and economic crisis
will be incorporated. Politico-cultural impacts investigated are: Do increasing income/educational inequalities widen
cultural and political ‘distances’, alienating people from politics, globalisation and European integration? Do they
affect individuals’ participation and general social trust? Is acceptance of inequality and policies of redistribution
affected by inequality itself? What effects do political systems (coalitions/winner-takes-all) have? Finally, it focuses
on costs and benefi ts of policies limiting income inequality and its effi ciency for mitigating other inequalities
(health, housing, education and opportunity), and addresses the question what contributions policy making itself may
have made to the growth of inequalities.
Support and Activities
The project receives EU research support to the amount of Euro 2.7 million. The work will result in four main reports
and a fi nal report, some 70 discussion papers and 29 country reports. The start of the project is 1 February 2010 for a
three-year period. Detailed information can be found on the website.
www.gini-research.org

!
!
!