and Analysis and Financial of the - torontopearson mda and...Management’s Discussion and Analysis...
60
Management’s Discussion and Analysis and Financial Statements of the Greater Toronto Airports Authority June 30, 2011
-
Upload
phungnguyet -
Category
Documents
-
view
214 -
download
1
Transcript of and Analysis and Financial of the - torontopearson mda and...Management’s Discussion and Analysis...

Management’s Discussion and Analysis and Financial
Statements of the
Greater Toronto Airports Authority
June 30, 2011

Page 1 of 26
GREATER TORONTO AIRPORTS AUTHORITY
MANAGEMENT’S DISCUSSION AND ANALYSIS
FOR THE QUARTER ENDED JUNE 30, 2011
Dated August 10, 2011
Forward‐looking Information
This Management’s Discussion and Analysis (“MD&A”) contains
certain forward‐looking information. This forward‐looking information is
based on a variety of assumptions and is subject to risks and uncertainties.
Please refer to the section titled “Caution Regarding Forward‐Looking
Information” contained at the end of this MD&A for a discussion of such
risks and uncertainties and the material factors and assumptions related to
the forward‐looking information.
This report discusses the financial and operating results of the Greater Toronto
Airports Authority (“GTAA”) for the quarter ended June 30, 2011 and should be
read in conjunction with the Financial Statements of the GTAA for the same
period. In addition, the reader is directed to the Financial Statements and
MD&A for the year ended December 31, 2010 and the Annual Information Form
for the year ended December 31, 2010. These documents provide additional
information on certain matters which may or may not be discussed in this report.
Additional information relating to the GTAA, including the Annual Information
Form, the Financial Statements and the MD&A referred to above, is available on
SEDAR at www.sedar.com. The GTAA’s Financial Statements and MD&A are
also available on its website at www.gtaa.com.
Corporate Profile
The GTAA was incorporated in March 1993 as a corporation without share
capital, and recognized as a Canadian Airport Authority by the federal
government in November 1994. The GTAA is authorized to operate airports
within the south‐central Ontario region, including the Greater Toronto Area
(“GTA”), on a commercial basis, to set fees for their use and to develop and
improve the facilities. In accordance with this mandate, the GTAA currently
manages and operates Toronto Pearson International Airport (the “Airport” or
“Toronto Pearson”).

Page 2 of 26
The responsibilities of the GTAA for the operation, management and
development of Toronto Pearson are set out in the ground lease with the federal
government which was executed in December 1996 (the “Ground Lease”). The
Ground Lease has a term of 60 years, with one renewal term of 20 years. The
GTAA’s priorities are to operate a safe, secure and efficient Airport and to ensure
that the facilities provide the necessary services, amenities, and capacity for
current and future air travel requirements for the region.
BUSINESS STRATEGY
In carrying out its responsibilities, the GTAA is focused on providing quality
aviation facilities and services for air carriers, passengers and other users of
Toronto Pearson. To meet current and anticipated demand for air services the
GTAA undertook the Airport Development Program (“ADP”), completed in
January 2007, and the expansion and redevelopment of Terminal 3, which was
substantially completed in December 2010. Recognizing that the region’s
demand for air travel is expected to continue to grow, the GTAA continues to
plan for additional future development.
In 2010 the GTAA completed a review of its strategic direction. The GTAA’s
vision statement ‐ “Toronto Pearson will be North America’s premier portal to a
world of possibilities” and its mission statement ‐ “Together, we will attract,
serve, and delight our customers by consistently delivering value through
innovative products and services” reflect the GTAA’s commitment to customer
service and becoming North America’s leading international gateway.
The principal areas of strategic focus by the GTAA are:
• achieving long‐term sustainability;
• achieving operational excellence;
• empowering employees to deliver value to GTAA’s customers and other
stakeholders;
• growing through innovation and leveraging assets; and
• developing an air and ground mobility hub.
This strategic focus, together with the values of the GTAA and its employees,
will guide the corporate activities, including an increased customer focus, which
the GTAA believes are required to meet its goals and the air transportation needs
of the region.

Page 3 of 26
On June 7, 2011, the GTAA introduced a new brand identity to signal this change
in strategic focus. To help demonstrate this shift, travellers will see a new
Toronto Pearson logo, featuring a new colour scheme and the slogan: ʺFor You.
The World.ʺ The brand focuses on Toronto Pearson, the public‐facing aspect of
the GTAA’s business, and represents the qualities that the GTAA and the Airport
will need to deliver to meet the expectations of our air carrier and passenger
customers and in turn meet the GTAA’s strategic objectives.
The Airport now has sufficient capacity to meet projected air travel demands for
the near‐term and accordingly it is anticipated that, in the near term, there will be
no significant capital investment to increase Airport capacity undertaken. Any
additional investment, such as the planned work on Terminal 3, and associated
indebtedness will be used to fund expenditures related to the repair and
maintenance of existing facilities and capital investments to improve operations
at the Airport or to generate additional non‐aeronautical revenue. These
investments are described in the section on Capital Projects. However, as
outlined in the GTAA’s Airport Master Plan covering the 2008 to 2030 period
(available on the GTAA’s website at www.gtaa.com), significant new capital
expenditures and financing activities will be required by the GTAA over the
term of the plan to meet the anticipated air travel needs of the region.
Operating Activity
When compared to the first six months of 2010, in the first six months of 2011, air
carriers serving Toronto Pearson have increased service (on a net basis) on a total
of 37 routes representing either completely new service or an increase in capacity
on existing routes.
During the first six months of 2011, 16.2 million passengers travelled through the
Airport, as compared to 15.4 million passengers during the same period in 2010,
representing an increase of 5.1 per cent. As has been the trend for several years,
the strongest passenger segment continued to be the international sector where
there was an increase in passenger traffic of 8.8 per cent in the first six months of
2011 when compared to the same period in 2010. The transborder sector
experienced a passenger increase of 6.9 per cent and the domestic sector
experienced a slight improvement of 0.7 per cent over the same comparable
periods. In the three‐month period ended June 30, 2011 passenger traffic
increased by 5.2 per cent when compared to the same period in 2010. During this
quarter domestic passenger traffic increased by 1.5 per cent, transborder traffic

Page 4 of 26
increased by 5.9 per cent and international traffic increased by 9.2 per cent,
respectively, when compared to the same quarter of 2010.
The following table summarizes passenger activity by sector for the three‐ and
six‐month periods ended June 30, 2011 and 2010.
(in thousands) 2011 2010 % 2011 2010 %
Domestic 3,271 3,223 1.5% 6,038 5,996 0.7%
Transborder 2,270 2,142 5.9% 4,504 4,213 6.9%
International 2,780 2,545 9.2% 5,644 5,186 8.8%
Total 8,321 7,910 5.2% 16,186 15,395 5.1%
Three Months Six Months
The relative underperformance of the domestic sector reflects the maturity of this
market, the imposition of the Harmonized Sales Tax in Ontario on July 1, 2010,
which increased the cost of domestic airfare, and competition from Billy Bishop
Toronto City Airport (“City Centre Airport”) particularly on the high volume
routes to Ottawa and Montréal. Strong growth in transborder passenger traffic
continues a trend that began in 2010 and can be partially attributed to the
increased use of Toronto Pearson as a connection point for passengers traveling
from the United States to Canadian and international destinations and an
increase in transborder services offered in response to the GTAA’s air service
incentive programs. The international sector, as it has for several years,
continues to show the strongest growth as increased travel between Toronto and
destinations in Asia, the Middle East and Latin America is driven by increasing
economic and cultural linkages with these emerging markets. In June 2010,
China granted Canada “Approved Destination Status” which is expected to have
a positive impact on passenger travel between China and Canada as
demonstrated by the recent growth in capacity and passenger traffic to and from
the Pacific Rim.
Flight activity is measured by aircraft movements. The type and size of aircraft
using the Airport determines the total maximum take‐off weight (“MTOW”) and
the total number of arrived seats. These measures are used to calculate airline
charges for each flight. Total movements in the first six months of 2011 increased
by 3.1 per cent, from 204.2 thousand movements in the first six months of 2010 to
210.6 thousand movements in the first six months of 2011. In the second quarter
of 2011, total movements increased from 104.8 thousand to 107.7 thousand, or 2.8
per cent, as compared to the same 2010 period.

Page 5 of 26
For the six months ended June 30, 2011, MTOW increased by 5.7 per cent, as
compared to the same period in 2010, from 6.4 million to 6.8 million tonnes. For
the three months ended June 30, 2011, MTOW totaled 3.4 million tonnes, an
increase of 5.8 per cent, as compared to the same 2010 period.
During the first half of 2011, the total number of arrived seats was 5.3 per cent
greater than during the same period in 2010 with 10.5 million seats recorded in
the 2011 period compared to 10.0 million in the 2010 period. In the second
quarter of 2011, arrived seats were 5.3 per cent greater than in the same period in
2010, with 5.3 million seats recorded in the 2011 period compared to 5.1 million
in the 2010 period.
During the past several years airlines have been adjusting their fleet mixes and
flight schedules in order to improve their financial performance, resulting in
higher airline load factors, or the ratio of passengers to seats. Passenger, seat and
MTOW growth rates are now roughly equivalent, which the GTAA concludes to
mean that air carriers are adding capacity, either through additional routes or
frequencies or larger aircraft, to accommodate the additional demand for air
travel. It is expected that air carriers will continue to engage in capacity
management techniques for the foreseeable future.
The GTAA reviews and updates measures of Airport operating activity on an
ongoing basis. Changes to these measures, although generally not material, do
occur. For the most current operating activity statistics, please consult GTAA’s
website at www.gtaa.com.
RESULTS OF OPERATIONS
Rate Setting
In reviewing the financial results, it is important to note that the GTAA is a
corporation without share capital. Under the GTAA’s financial model all funds,
whether generated through revenue or debt, are used for Airport operations,
ancillary aviation‐related activities, construction, repairs and maintenance, debt
payments, reserve funds, and other activities within the GTAA’s mandate.
The objective of the GTAA’s annual aeronautical rate setting approach is to
break‐even on a modified cash basis after including projected operating costs
and reserve and debt requirements as set out in the master trust indenture for the
GTAA’s debt program (the “Trust Indenture”). To calculate the rates and

Page 6 of 26
charges for a given year, projections are developed for measures of Airport
operating activity such as passengers, MTOW, arrived seats, gate and counter
usage, non‐aeronautical revenue and operating costs. Operating costs include
debt service for those assets that are operational, but do not include non‐cash
items such as amortization of capital assets. Capital costs, including interest for
projects under construction, are funded through debt and are not included in the
calculation of the aeronautical rates and charges. However, a notional
amortization of debt, based on a 30‐year amortization period, which is not
included in the operating results, is included in the rate setting calculation. This
amortization of outstanding debt is reserved and used for future debt
repayments.
The GTAA’s aeronautical revenues are comprised of the following: landing fees
based on the aircraft’s MTOW; general terminal charges based on the number of
seats of an arriving aircraft; and since July 1, 2010, turnaround fees charged for
the use of terminal facilities to gate aircraft and check‐in fees charged for the use
of check‐in counters in the terminals.
The introduction of the turnaround fee and the check‐in fee was designed to
increase transparency in Airport pricing, provide air carriers opportunities to
reduce their costs through the operating choices they make and to encourage
more efficient use of Airport resources, thereby reducing Airport operating costs
and the future need for additional capital development.
Commencing on January 1, 2011, the landing fees for cargo aircraft were reduced
by 4.3 per cent when compared to the rates implemented on July 1, 2010.
Effective January 1, 2011, the general terminal charges and landing fees for
passenger airlines were reduced by 7.9 per cent and 4.5 per cent respectively, as
compared to the rates in effect in the prior year. At the same time, the
turnaround fee charged for gating passenger aircraft at the Airport was increased
to $66.66 per flight as part of the change to Toronto Pearson’s fee structure as
endorsed by the airline community. Effective January 1, 2011, the per‐seat
portion of the turnaround fee increased to $2.41. The check‐in fee for 2011
remained unchanged from the 2010 levels. The increase in the turnaround fee
largely offsets the decrease in the landing fee and general terminal charge which
became effective January 1, 2011.
Also effective January 1, 2011, the AIF for passengers connecting through
Toronto Pearson decreased from $8 to $4 (including administration fee paid to

Page 7 of 26
the air carriers). The AIF for originating passengers remained unchanged at $25
(including administration fee paid to the air carriers).
The GTAA’s continuing commitment to increase non‐aeronautical revenues and
manage operating expenses is reflected in the reductions in average air carrier
cost per enplaned passenger (the amount that air carriers pay to the GTAA
expressed as a per passenger rate) which began in 2008 and continue into 2011.
Revenues
Revenues are derived from aeronautical charges (landing fees and general
terminal charges, which include the turnaround fee and the check‐in fee), AIF,
and non‐aeronautical sources such as car parking and ground transportation,
concessions, rentals, electricity sales and other sources. The primary drivers for
aeronautical revenue are aircraft movements. Landing fees are based on the
MTOW and general terminal charges are based on the number of seats of an
arriving aircraft and the usage of terminal facilities to gate aircraft and check‐in
passengers. The AIF is charged per passenger and a portion of non‐aeronautical
revenues is correlated to passenger activity. The following table summarizes the
GTAA’s revenues for the three‐ and six‐month periods ended June 30, 2011 and
2010:
(in thousands) 2011 2010 2011 2010
Landing fees $86,237 $93,241 $168,485 $184,443
General terminal charges 54,135 38,937 107,009 77,649
140,372 132,178 275,494 262,092
AIF, net 71,833 73,229 146,494 145,529
Car parking & ground 31,764 28,982 62,597 59,035
Concessions & rentals 35,557 34,482 68,930 68,303
Other 3,141 2,347 5,336 4,357
Total $282,667 $271,218 $558,851 $539,316
Three Months Six Months
For the first six months of 2011, aeronautical revenue totaled $275.5 million, an
increase of $13.4 million from the same period in 2010. The increase in 2011, as
compared to the same period in 2010, reflects the increase in Airport activity
between the two periods as aeronautical rates were largely unchanged in 2011
when compared to 2010. However, due to the introduction of the turnaround fee
and the check‐in fee discussed above, landing fee revenue decreased while
general terminal charge fee revenue, which includes revenue from the two new

Page 8 of 26
fees, increased in the first half of 2011 compared to the first half of 2010. A
similar increase was experienced during the second quarter ended June 30, 2011,
as aeronautical revenues increased by $8.2 million, from $132.2 million at June
30, 2010 to $140.4 million at June 30, 2011.
AIF revenue, which excludes the administration fee paid to the air carriers for the
collection of the AIF, for the six months ended June 30, 2011 was $146.5 million
as compared to $145.5 million for the same period in 2010. This increase reflects
higher passenger activity which was largely offset by the reduction in the AIF for
connecting passengers from $8 to $4 which became effective January 1, 2011. AIF
revenue earned during the second quarter ending June 30, 2011 totaled $71.8
million, as compared to $73.2 million during the same period in 2010. Under the
AIF agreements with each of the air carriers, the GTAA has committed to using
primarily all of the AIF revenue for capital programs, including the associated
debt service (interest and principal). Historically, the GTAA has used AIF
revenue to fund debt service. Recognizing that capital expenditures or payment
of debt service and receipt of AIF revenue may not occur in the same period, AIF
revenue earned and collected, but not used in a given period, is retained in the
AIF Reserve Fund for future capital or debt service payments.
The increase in revenue from car parking and ground transportation from $59.0
million to $62.6 million for the six months ended June 30, 2010 and 2011,
respectively, reflects the increase in passenger volumes during the first six
months of 2011, offset by a reduction in ground transportation revenues due to
certain ground transportation concession contracts being renewed at the
beginning of the second quarter of 2010, at lower rates reflecting the market
impact of the economic downturn at that time. Car parking and ground
transportation revenue during the three‐month period ended June 30, 2011,
increased by $2.8 million when compared to the three‐month period ending June
30, 2010, as the increase in car parking revenues due to higher passenger activity
was offset by the impact of lower revenues derived from the aforementioned
ground‐transportation concession contracts.
Concession and rental revenues increased marginally from $68.3 million to $68.9
million for the six months ended June 30, 2010 and 2011, respectively.
Concession and rental revenues increased from $34.5 million to $35.6 million for
the quarters ended June 30, 2010 and June 30, 2011, respectively. Concession and
rental revenues are driven by contractual arrangements which tend to limit
period‐over‐period changes in revenues.

Page 9 of 26
Other revenues, which are primarily composed of revenues from the
Cogeneration Plant, consulting services, and fire and emergency services
training, totaled $5.3 million in the first six months of 2011 as compared to $4.4
million in the comparable period in 2010. The increase is due to a combination of
fluctuations in the price of natural gas and electricity which resulted in increased
Cogeneration Plant operations during the first six months of 2011 and an increase
in revenues from fire and emergency services training. For the same reasons,
when comparing other revenues during the three‐month period ended June 30,
2011 and June 30, 2010, there was an increase of $0.8 million from $2.3 million in
2010 to $3.1 million in 2011.
Expenses
Expenses include the costs to operate and maintain the Airport, interest and
financing costs, and amortization of property and equipment. The following
table summarizes the total expenses for the three‐ and six‐month periods ended
June 30, 2011 and 2010.
(in thousands) 2011 2010 2011 2010
Ground rent $32,385 $31,061 $64,273 $62,217
Goods and services 50,280 51,650 105,653 104,224
Salaries, wages and benefits 27,269 28,181 57,384 56,368
PILT 6,902 6,573 13,787 13,146
Amortization of property and equipment,
investment property and intangible assets 54,349 55,496 104,858 111,747
Operating Expenses 171,185 172,961 345,955 347,702
Interest Income (2,827) (1,182) (5,776) (2,113)
Interest expense on debt instruments and other
financing costs 108,491 111,832 220,692 220,903
Premium on early retirement of debt ‐ ‐ 27,565 ‐
Net Interest and Financing Costs 105,664 110,650 242,481 218,790
Total expenses $276,849 $283,611 $588,436 $566,492
Three Months Six Months
Ground rent payments are calculated as a percentage of revenues, as set out in
the Ground Lease. Ground rent expense during the first six months of 2011 was
higher by $2.1 million, when compared to the same period in 2010. This increase
is due to the increase in revenues (as defined in the Ground Lease) between the
two periods. Similarly, the ground rent expense for the three‐month period
ended June 30, 2011 increased to $32.4 million from $31.1 million for the same
period in 2010. In each quarter beginning in 2006 and ending in 2015, actual

Page 10 of 26
ground rent payments made to the federal government include a $1.0 million
payment of ground rent that had been deferred by the federal government in the
2003 to 2005 period. This payment is not recorded as an expense in the statement
of operations as it has been accrued in a previous period.
Expenditures for goods and services were $105.7 million for the six months
ended June 30, 2011, a $1.4 million increase from the same period in 2010. The
increase can be attributed to increased snow removal expense, partially offset by
decreases in professional and contractual services and a higher gain on the
valuation of a derivative contract with the Ontario Power Authority related to
the Cogeneration Plant during the 2011 period. During the quarter ended June
30, 2011, costs incurred in relation to goods and services were $50.3 million as
compared to $51.7 million for the same period ended June 30, 2010. This
decrease is attributable to a greater gain on the valuation of a derivative contract
with the Ontario Power Authority related to the Cogeneration Plant during the
2010 period, which offsets goods and services expense.
Salaries, wages and benefits increased from $56.4 million to $57.4 million for the
six‐month periods ending on June 30, 2010 and June 30, 2011, respectively. The
increase is primarily attributable to an accrual related to actuarial valuation of
certain post‐employment benefit costs and an increase in overtime costs due to a
time lag in filling certain full‐time positions, both incurred during the first
quarter of 2011. The expenditures for salaries, wages and benefits decreased by
$0.9 million from $28.2 million for the quarter ended June 30, 2010 to $27.3
million for the same period in 2011. The reduction is primarily attributable to the
time lag in filling certain full‐time positions.
The GTAA has an exemption from the payment of real property taxes under the
Assessment Act (Ontario), and instead pays payments‐in‐lieu of taxes (“PILT”) to
each of the Cities of Toronto and Mississauga as prescribed by an Ontario
regulation. The PILT amount is based on passenger volumes in a prior year and
therefore the increase of $0.6 million for the six months ended June 30, 2011 over
the same 2010 period reflects the increased annual passenger volumes in the
underlying year (2008 as compared to 2007) used in the calculation. The decrease
in passenger activity in 2009 will be reflected in lower PILT payments in future
years, and similarly, the traffic recovery in 2010 will be reflected in higher PILT
payments in later years. The increase in PILT expenditure of $0.3 million during
the three‐month period ended June 30, 2011, as compared to the same period in
2010 was for the same reason.

Page 11 of 26
Net interest and financing costs were $242.5 million for the six‐month period
ended June 30, 2011, as compared to $218.8 million for the same period in 2010.
This increase of $23.7 million is primarily attributed to the costs associated with
the early redemption of the Series 2008‐2 MTNs, partially offset by higher
interest income on cash and restricted fund investment holdings and lower
interest expense due to lower average balance of outstanding debt. The
redemption of the Series 2008‐2 MTNs resulted in a charge of $27.6 million,
primarily due to the difference between the redemption price and the carrying
value for financial statement purposes of the notes at the time of redemption.
This charge was recorded in interest and financing costs in the first quarter of
2011. The redemption of the Series 2008‐2 MTNs was funded by the issuance of
the Series 2011‐1 MTNs. By taking advantage of current low interest rates the
GTAA has achieved interest expense savings and expects to experience interest
savings over the life of the Series 2011‐1 MTNs greater than the premium paid on
the Series 2008‐2 redemption. Net interest and financing costs for the quarter
ended June 30, 2011 decreased by $5.0 million to $105.7 million when compared
to the same quarter in 2010. The reduction in net interest and financing costs
between the periods was primarily attributable to higher interest income on cash
and restricted‐fund investment holdings and lower interest expense due to lower
average balance of outstanding debt.
Amortization of property and equipment, investment property and intangible
assets decreased from a total of $111.7 million to $104.9 million when comparing
the results for the six‐month periods ended June 30, 2010 and 2011, respectively.
The decrease in amortization of property and equipment was due to a reduction
in the asset base due to the ongoing amortization of property and equipment,
investment property and intangible assets. Similarly, the amortization of
property and equipment, investment property and intangible assets decreased by
$1.1 million from $55.5 million for the quarterly period ended June 30, 2010 to
$54.3 million for the same period in 2011.

Page 12 of 26
Net Operating Results
The revenues and expenses discussed in the previous sections generated the
following net operating results for the three‐ and six‐month periods ended June
30, 2011 and 2010.
(in thousands) 2011 2010 2011 2010
Revenues $282,667 $271,218 $558,851 $539,316
Operating expenses 171,185 172,961 345,955 347,702
Revenues over operating expenses 111,482 98,257 212,896 191,614
Interest and financing costs, net 105,664 110,650 242,481 218,790
Net Income/(Loss) $5,818 $(12,393) $(29,585) $(27,176)
Three Months Six Months
The components of revenues and expenses were discussed previously. Revenues
over operating expenses increased to $212.9 million in the six months ended June
30, 2011, from $191.6 million for the same period in 2010. Similarly, revenues
over operating expenses increased to $111.5 million in the three months ended
June 30, 2011, from $98.3 million for the same period in 2010.
For the six‐month period ended June 30, 2011, the GTAA recorded a net loss of
$29.6 million, compared to a net loss of $27.2 million in the same 2010 period. As
discussed previously, the primary reason for the increase in net interest and
financing costs was the one‐time charge of $27.6 million related to the
redemption of the Series 2008‐2 MTN which is expected to result in lower future
interest and financing costs. For the three‐month period ended June 30, 2011, the
GTAA recorded net income of $5.8 million, compared to a net loss of $12.4
million in the same 2010 period.

Page 13 of 26
SUMMARY OF QUARTERLY RESULTS
Selected unaudited quarterly financial information for the quarters ended
September 30, 2009 through June 30, 2011 is set out in the following table:
Quarter Ended
2011 (1) 2010 (1) 2009(2)
Jun Mar Dec Sep Jun Mar Dec Sep
Revenues $283 $276 $270 $303 $271 $268 $273 $297
Operating expenses (3) 117 124 128 119 117 119 146 116
Revenues over operating expenses ( 166 152 142 184 154 149 127 181
Interest and financing costs, net 106 137 109 105 111 108 114 101
54 51 58 54 55 56 54 50
Net Income/(Loss) $6 $(36) $(25) $25 $(12) $(15) $(41) $30
(in millions)
Amortization of assets
(1) Prepared in accordance with IFRS
(2) Prepared in accordance with previous Canadian GAAP
(3) Excluding amortization of assets, which represents amortization of property
and equipment, investment property, and intangible assets.
The GTAA’s quarterly results are influenced by passenger activity and aircraft
movements which vary with travel demand associated with holiday periods and
other seasonal factors. In addition, factors such as weather and economic
conditions may affect operating activity, revenues and expenses. Changes in
operating facilities at the Airport may impact operating costs which may result in
quarterly results not being directly comparable. Due to these factors the historic
quarterly results cannot be relied upon to determine future trends.
CAPITAL PROJECTS
After the GTAA assumed responsibility for the Airport in 1996, it initiated an
extensive redevelopment program to improve and redevelop the facilities to
meet current and future demand. The Airport Development Program (“ADP”)
included the construction of terminal facilities, roadways, cargo facilities, airside
improvements such as runways and taxiways, ancillary services and utilities
infrastructure. The total cost of the ADP, which was completed on time and on
budget, was $4.4 billion.

Page 14 of 26
Continued long‐term growth in passenger demand will require further
expansion of Terminal 1. In order to facilitate this, the GTAA has developed a
work plan, the Post ADP Program, which includes the demolition of Terminal 2
and the Terminal 2 parking garage; apron construction in the area that Terminal
2 once occupied; replacing the Terminal 2 parking capacity and increasing the
overall parking capacity at the Airport with the construction of a new parking
facility in Area 6B on the east side of Airport Road; replacement of certain
utilities infrastructure; and the preliminary design of Pier G at Terminal 1. The
majority of this work was completed in 2009 with the exception of the
preliminary design of Pier G, which has been deferred until future requirements
warrant this work, demolition of the Terminal 2 parking garage and the
construction of the apron in the area formerly occupied by the Terminal 2
parking garage. The contract for the demolition of the Terminal 2 parking garage
and construction of the associated apron was tendered and awarded at the end of
2010. The garage demolition and apron construction is currently underway. The
Post ADP Program has an authorized budget of $439.7 million of which $282.2
million has been expended at June 30, 2011. The timing of the final design and
construction of Pier G and other future Airport expansion projects remain under
review, and will be dependent on demand.
The GTAA has also undertaken a program to further expand and redevelop
certain areas in Terminal 3, including the baggage handling systems and
passenger processing areas as well as other improvements. This work, which
had been budgeted at $355.3 million, was substantially complete as of December
31, 2010. The total cost of the program as of June 30, 2011 was $359.3 million.
In 2008, the GTAA approved a capital program to improve Terminal 3. This
program was designed to provide improvements to the food and beverage and
other retail offerings in the terminal and changes to passenger processing and
security areas designed to improve passenger connections and other passenger
flows through the terminal. The budget was $85.1 million. Due to the slowdown
in passenger activity experienced in 2009, the GTAA deferred work on this
program. There have been no material expenditures on the program. The GTAA
is currently reviewing the Terminal 3 Master Plan to address new security,
branding, pricing and capacity, retail and guest experience initiatives. This
program will be implemented once the review has been completed and a new
scope of work and budget have been approved.
Other capital projects typically undertaken are primarily to upgrade, refurbish or
replace existing facilities. During the six‐ and three‐month periods ending on

Page 15 of 26
June 30, 2011 a total of $12.4 million and $10.3 million, respectively, was
expended on such projects.
The GTAA has historically funded, and expects to continue to fund, capital
projects primarily through borrowing in the debt capital markets.
ASSETS AND LIABILITIES
Total assets and liabilities as at June 30, 2011 as compared to December 31, 2010
are set out below.
(in millions) June 30, 2011 December 31, 2010
Total Assets $6,807.7 $6,829.4
Total Liabilities $7,522.0 $7,512.8
Total assets, at June 30, 2011, decreased by $21.7 million from the December 31,
2010 balance of $6.8 billion. This decrease in assets is primarily attributable to a
decrease in current assets and ongoing amortization of property and equipment
partially offset by an increase in the balance of restricted funds. Total liabilities
increased by $9.2 million between December 31, 2010 and June 30, 2011, from the
opening balance of $7.5 billion. The increase in total liabilities results primarily
from a net increase in long‐term debt and value of the security deposits on hand
offset by a reduction in accounts payable, provisions and other accrued current
liabilities.
The deficit and accumulated other comprehensive income of $714.4 million at
June 30, 2011, as reported on the statements of financial position is a combination
of the cumulative impact of the restricted funds which have been funded
through operating revenue and cumulative net income/(loss). Debt service
included in the aeronautical charges includes a notional principal amount based
on a 30‐year amortization which is lower in the early years of the debt and
increases over time, similar to the principal payments of a mortgage. This
notional principal amount is set aside in a reserve fund which the GTAA has
used and intends to continue to use for debt repayment. Amortization of
property and equipment is not included in the calculation of aeronautical
charges. Historically the amortization of the GTAA’s most significant assets was
reported on a declining balance basis, which is higher in the early years of the
asset life and decreases over time. Effective January 1, 2011, the GTAA
reassessed its amortization policy for certain assets and commenced amortizing
Page 16 of 26
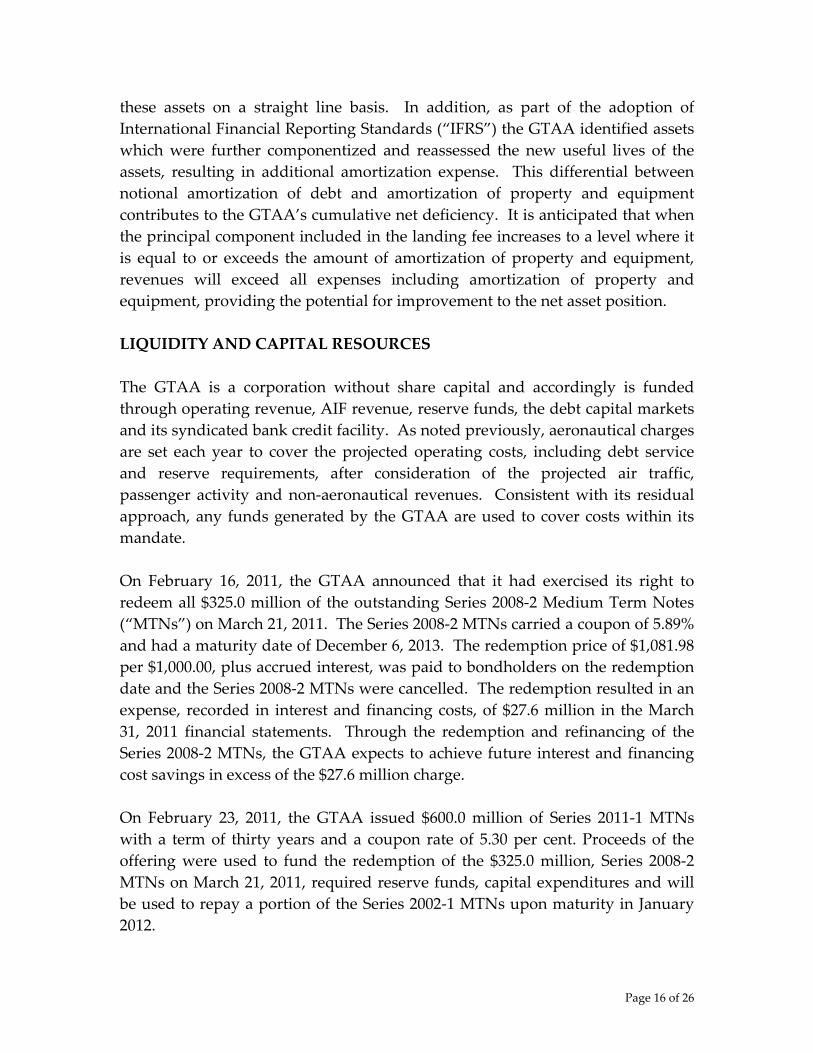
these assets on a straight line basis. In addition, as part of the adoption of
International Financial Reporting Standards (“IFRS”) the GTAA identified assets
which were further componentized and reassessed the new useful lives of the
assets, resulting in additional amortization expense. This differential between
notional amortization of debt and amortization of property and equipment
contributes to the GTAA’s cumulative net deficiency. It is anticipated that when
the principal component included in the landing fee increases to a level where it
is equal to or exceeds the amount of amortization of property and equipment,
revenues will exceed all expenses including amortization of property and
equipment, providing the potential for improvement to the net asset position.
LIQUIDITY AND CAPITAL RESOURCES
The GTAA is a corporation without share capital and accordingly is funded
through operating revenue, AIF revenue, reserve funds, the debt capital markets
and its syndicated bank credit facility. As noted previously, aeronautical charges
are set each year to cover the projected operating costs, including debt service
and reserve requirements, after consideration of the projected air traffic,
passenger activity and non‐aeronautical revenues. Consistent with its residual
approach, any funds generated by the GTAA are used to cover costs within its
mandate.
On February 16, 2011, the GTAA announced that it had exercised its right to
redeem all $325.0 million of the outstanding Series 2008‐2 Medium Term Notes
(“MTNs”) on March 21, 2011. The Series 2008‐2 MTNs carried a coupon of 5.89%
and had a maturity date of December 6, 2013. The redemption price of $1,081.98
per $1,000.00, plus accrued interest, was paid to bondholders on the redemption
date and the Series 2008‐2 MTNs were cancelled. The redemption resulted in an
expense, recorded in interest and financing costs, of $27.6 million in the March
31, 2011 financial statements. Through the redemption and refinancing of the
Series 2008‐2 MTNs, the GTAA expects to achieve future interest and financing
cost savings in excess of the $27.6 million charge.
On February 23, 2011, the GTAA issued $600.0 million of Series 2011‐1 MTNs
with a term of thirty years and a coupon rate of 5.30 per cent. Proceeds of the
offering were used to fund the redemption of the $325.0 million, Series 2008‐2
MTNs on March 21, 2011, required reserve funds, capital expenditures and will
be used to repay a portion of the Series 2002‐1 MTNs upon maturity in January
2012.

Page 17 of 26
On February 28, 2011, the $250.0 million Series 2006‐1 MTNs matured and were
repaid using cash on hand and certain reserve funds.
The GTAA has a $500 million credit facility and a $50 million facility for interest
rate and foreign exchange hedging activities, both with the same banking
syndicate. These facilities mature on November 22, 2013 and can be extended
annually for one additional year with the lenders’ consent. The $500 million
credit facility is used to fund capital or operating expenses, as required, and
provides flexibility on the timing for accessing the capital markets in the future.
These facilities rank pari passu with all other debt of the GTAA. Other than a $2.3
million letter of credit, the GTAA had no funds drawn under the $500 million
credit facility and no amounts were utilized under the $50 million hedging
facility, as at June 30, 2011.
Total restricted funds, which are comprised of reserve funds required under the
Trust Indenture and other reserves held according to GTAA policy, as at June 30,
2011, were $1.0 billion, as compared to $926.5 million at December 31, 2010. All
of the restricted funds, as at June 30, 2011, are cash funded and invested and
depending on the nature of the fund, are held by the Trustee for specific
purposes as required under the Trust Indenture, or held by the GTAA in
accordance with its own policies.
At June 30, 2011, the GTAA had a working capital deficiency of $548.3 million.
As of that date, the GTAA had available $1.0 billion in restricted funds which are
classified as long‐term assets. In addition the GTAA had available $138.8 million
in cash and cash equivalents, the majority of which is earmarked to fund the
remaining 2011 capital expenditures and partially repay the $500 million Series
2002‐1 MTNs which mature in January 2012 (classified as a current liability on
the June 30, 2011 statements of financial position), and $497.7 million of credit
available under its credit facility. The GTAA believes that the reserve balances,
available credit and cash balances, and its ability to access the capital markets
provide sufficient liquidity to mitigate any potential impact of the reported
working capital deficiency.
The objective of the GTAA’s investment and cash management strategy is to
ensure that the cash requirements for operations, capital programs and other
demands are met, and to maximize the flexibility in accessing capital markets as
may be required. The GTAA monitors its cash flow requirements accordingly.
Given its current cash balance, the current available credit facility, reserves and
projected operating revenues and costs, the GTAA does not anticipate any

Page 18 of 26
funding shortfalls during 2011. However, there may be events outside of the
control of the GTAA that could negatively impact its liquidity.
SIGNIFICANT ACCOUNTING POLICIES AND ESTIMATES
The significant accounting policies and critical accounting judgments and
estimates of the GTAA are set out in Notes 3 and 6, respectively, of the Financial
Statements and Notes as of June 30, 2011. Other than the adoption of IFRS,
effective January 1, 2011, there were no changes to the accounting policies of the
GTAA in the first six months of 2011. The Notes to the Financial Statements of
the GTAA dated June 30, 2011 contain important disclosure regarding the
adoption of IFRS by the GTAA and should be consulted in conjunction with this
MD&A.
INTERNATIONAL FINANCIAL REPORTING STANDARDS
In February 2008, the Canadian Institute of Chartered Accountants announced
that Canadian Generally Accepted Accounting Principles (“GAAP”) for publicly
accountable enterprises would be replaced by International Financial Reporting
Standards (“IFRS”) for fiscal years beginning on or after January 1, 2011.
Accordingly, the GTAA transitioned to IFRS in the first quarter of 2011 with 2010
IFRS compliant comparative figures.
Significant Impact upon Adoption of IFRS:
a) Property and equipment:
IFRS and Canadian GAAP generally contain the same basic principles for
property and equipment, however there are some differences. Specifically, IFRS
is more prescriptive over the requirements to componentized its property and
equipment and amortizing each component separately. On adoption, the GTAA
identified various components of the terminal and other assets which required
further componentization under IFRS. These components have different useful
lives than the primary asset under Canadian GAAP. To reflect the further
amortization in respect of these assets, adjustments of $6.2 million and $13.7
million were required for the three‐month and six‐month periods ended June 30,
2010, respectively in addition to an adjustment of $209.7 million, at January 1,
2010.

Page 19 of 26
Under IFRS, major spare parts and stand‐by equipment qualify as property and
equipment when an entity expects to use them during more than one period and
the equipment can be used only in connection with an item of property and
equipment. As a result as at June 30, 2010, $1.4 million of certain spare parts and
servicing equipment was reclassified from Inventory to Property and equipment
and amortized accordingly.
Property meeting the definition of investment property under IAS 40, Investment
Property continues to be measured at historic cost less any accumulated
amortization but is required to be disclosed separately on the statement of
financial position with additional disclosure requirements. As a result, at June 30,
2010, $24.2 million was reclassified from Property and equipment to Investment
property on the statement of financial position.
b) Post‐employment benefits:
As a result of differences in measuring the current expense for benefits under
IFRS, the GTAA recorded a recovery of $0.1 million and $0.3 million related to
the three‐month and six‐month periods ended June 30, 2010 respectively.
c) Provisions:
IFRS requires provisions be disclosed separately on the face of the financial
statements. As such, a reclassification of accruals previously presented in
Accounts payable and accrued liabilities on the statement of financial position, to
Provisions was made at June 30, 2010 and for each subsequent quarter.
Reconciliation of Deficit:
Significant transactions impacting deficit at June 30, 2010 include:
$
Deficit as reported under Canadian GAAP 432,710 IFRS adjustments:Impact due to amortization of property and equipment as a result of componentization and other changes 224,690 Adjustment to borrowing costs (602) Adjustment to pension asset 21,019
Change in recorded pension expense (268)
Deficit under IFRS 677,549

Page 20 of 26
Reference should be made to the Financial Statements of the GTAA dated March
31, 2011 and MD&A for the period ended March 31, 2011, for further description
of above adjustments. These Financial Statements and MD&A are available on
SEDAR at www.sedar.com and the GTAA’s website at www.gtaa.com.
Impact of future changes to IFRS:
Several IFRS standards are in the process of being amended by the International
Accounting Standards Board (“IASB”). The GTAA monitors the IASB’s
announcements on an ongoing basis, giving consideration to any proposed
changes, where applicable, in its assessment of differences between IFRS and
GAAP. However, since all potential changes to IFRS that will be effective as at
December 31, 2011, are not yet known, any conclusions drawn at this time must
be considered preliminary. As a result, at this time, the GTAA cannot reasonably
determine the full impact that adopting IFRS may have on its financial and
future results.
INTERNAL CONTROLS AND PROCEDURES
GTAA management is responsible for establishing and maintaining disclosure
controls and procedures to ensure that information required to be disclosed to
satisfy the GTAA’s continuous disclosure obligations is recorded, processed,
summarized and reported as required by applicable Canadian securities
legislation. Management has carried out an evaluation of the effectiveness as of
June 30, 2011 of the design and operation of the disclosure controls and
procedures, as defined in National Instrument 52‐109, Certification of Disclosure in
Issuers’ Annual and Interim Filings, under the supervision of, and with the
participation of, the President and Chief Executive Officer (“CEO”), and the Vice
President and Chief Financial Officer (“CFO”). Based on this evaluation, the
CEO and CFO concluded that the disclosure controls and procedures are
effective in recording, processing, summarizing and reporting, on a timely basis,
information required to be disclosed by the GTAA to satisfy its continuous
disclosure obligations and are effective in ensuring that information required to
be disclosed in the reports that the GTAA files is accumulated and
communicated to management as appropriate to allow timely decisions
regarding required disclosure. The Board of Directors has reviewed and
approved the GTAA’s Policy Regarding Corporate Disclosure Controls and
Procedures. Management has determined that as at June 30, 2011, the design and
operation of the disclosure controls and procedures continues to be effective.

Page 21 of 26
GTAA management is responsible for designing and implementing internal
controls over financial reporting to provide reasonable assurance regarding the
reliability of the GTAA’s reporting and the preparation of financial statements
for external purposes in accordance with Canadian GAAP (now IFRS). While no
material weaknesses with respect to internal controls over financial reporting
have been identified as at June 30, 2011, any assessment may not detect all
weaknesses nor prevent or detect all misstatements because of inherent
limitations. Additionally, projections of any assessment of effectiveness to future
periods are subject to the risk that controls may become inadequate due to
changes in conditions or deterioration in the degree of compliance with the
GTAA’s policies and procedures. There were no changes in the GTAA’s internal
controls over financial reporting that occurred during the quarter ended June 30,
2011 that have materially affected, or are reasonably likely to materially affect, its
internal control over financial reporting.
RISKS AND UNCERTAINTIES
The GTAA’s Board of Directors is accountable for the oversight of the principal
risks of the GTAA’s business. The Audit Committee and certain other standing
committees of the Board are responsible for ensuring that management has
appropriate policies and procedures to identify and manage specific risks and to
ensure that such policies and procedures are effective.
In 2010, the GTAA’s Board of Directors approved an Enterprise Risk
Management (“ERM”) program. The purpose of the ERM program is to instill a
behavioural awareness among employees and provide a disciplined process to
identify, mitigate and manage risks. The ERM program is incorporated into the
GTAA’s decision‐making process.
The GTAA, its operations, and its financial results and condition are subject to
certain risks. The reader is directed to the Financial Statements and MD&A for
the year ended December 31, 2010 and the Annual Information Form for the year
ended December 31, 2010 which provide a comprehensive discussion of the
GTAA’s risks and uncertainties. The following are the principal risks facing the
GTAA.
Systemic Aviation Industry Risk: The GTAA’s ability to derive revenues from
its operation of the Airport depends on a variety of factors, many of which are
not within the control of the GTAA. The health of the air transportation industry
and future airline traffic at the Airport will be affected by, among other things,

Page 22 of 26
growth of the population and the condition of the economy of the GTA;
unemployment rates; national, U.S. and international economic conditions;
regulatory actions and legislative changes; international air transportation
agreements; air carrier instability; the ability and willingness of airlines to
provide air service; capital market conditions; air fare levels including taxes and
surcharges; labour disputes; the availability and cost of aviation fuel; carbon
emissions charges, taxes and restrictions; insurance costs; environmental
regulation; the operation of the air traffic control system; competition from
telecommunications, ground transportation and other airports; health epidemics
such as SARS and the avian flu and related travel advisories; geopolitical risk;
war; and the perceived threat of terrorist attacks and additional security
measures put in place to guard against such attacks.
Partner Concentration Risk: Overdependence on a limited number of business
partners may materially impact the operations and financial condition of the
GTAA should one of these significant partners significantly reduce or cease
operations at Toronto Pearson or take actions that are harmful to the GTAA. If
an airline serving the Airport were to cease operations or to reduce service at the
Airport, some period of time could elapse before other airlines absorb its traffic.
In addition, the GTAA is exposed to the risk of financial loss if any tenant or air
carrier operating at the Airport files for creditor protection or declares
bankruptcy. Since Air Canada, including its regional affiliate Georgian Airlines,
and Jazz (with which Air Canada has a Capacity Management Agreement),
carried 56.2 per cent of total Airport passengers in 2010, the GTAA has a
particular exposure to this dominant air carrier. The GTAA has taken measures
to protect itself from defaulting air carriers by strengthening its payment terms
with the air carriers and obtaining security deposits, where appropriate.
Funding Risk: As at June 30, 2011, the GTAA had outstanding debt securities,
including accrued interest and net of unamortized discounts and premiums, of
$7.3 billion. The GTAA will need to continue to access the capital markets to
refinance maturing debt and finance future capital projects. The GTAA has
included in the calculation of its landing fees a notional principal component to
enable portions of principal to be paid down when debt matures. This notional
principal component will increase over time based on a thirty‐year amortization.
There is always risk when raising funds in the capital markets, including risks
relating to fluctuating interest rates and the availability of funds at any point in
time. While the GTAA’s debt program has historically been well received by the
capital markets in Canada, any dislocation in the global capital markets could
affect the GTAA’s ability to meet its financing requirements. While no adverse

Page 23 of 26
impact on the GTAA has been noted, recent events affecting the sovereign debt
of the United States and several European Union countries have impacted local
and global credit markets. The GTAA monitors the overall debt markets and
works with its financial advisors to select the timing, size and term of any debt
issue so as to ensure continued access to the markets and to maximize
opportunities. The GTAA also monitors its debt maturity profile to minimize
refinancing risk in the future.
Labour Risk: In 2009, the GTAA and CAW Local 2002, which represents the
unionized employees of the GTAA (excluding firefighters), settled the terms of a
consolidated collective agreement which expires on July 31, 2013. The Airport’s
largest air carrier, Air Canada, has several collective agreements with its
unionized employees which expire in 2011. After the expiration of these
collective agreements, there is a risk of a strike or lockout if the parties are unable
to agree on the terms of a new collective agreement. It is anticipated that the
primary impact of a strike or lockout of GTAA’s unionized employees would be
delays in accessing the Airport due to picketing activity. It is anticipated that a
strike or lockout of Air Canada’s unionized employees could result in delays in
accessing the Airport due to picketing activity and a decrease in the GTAA’s
revenues if Air Canada’s operations are materially impacted. A labour dispute
affecting 3,800 Air Canada customer service and sales, gate and check‐in agents
was settled after a three‐day strike action at the Airport in June 2011. In the
event of a strike by the unionized employees of the GTAA, an air carrier or other
significant business partner, the GTAA will implement its labour contingency
plans to maintain continued airport operations.
Airport Competition Risk: Toronto Pearson competes with other airports for air
passenger traffic. There is a risk of the diversion of passengers from Toronto
Pearson to other airports. Toronto Pearson’s main competitors for transborder
and domestic traffic are Buffalo Niagara International Airport (“Buffalo
Airport”) and City Centre Airport.
In 2010, the Globe and Mail newspaper reported that approximately 1.9 million
passengers using Buffalo Airport were Canadians, who comprised
approximately 36 per cent of that airport’s passenger volume. The Niagara
Frontier Transportation Authority, the operator of Buffalo Airport, estimated
that approximately one million passengers who used Buffalo Airport in 2010
were from the Greater Toronto Area and Hamilton.
In 2010, City Centre Airport handled approximately 1.2 million passengers, a 48
per cent increase over 2009 as a result of the expansion of Porter Airlines’ route
Page 24 of 26
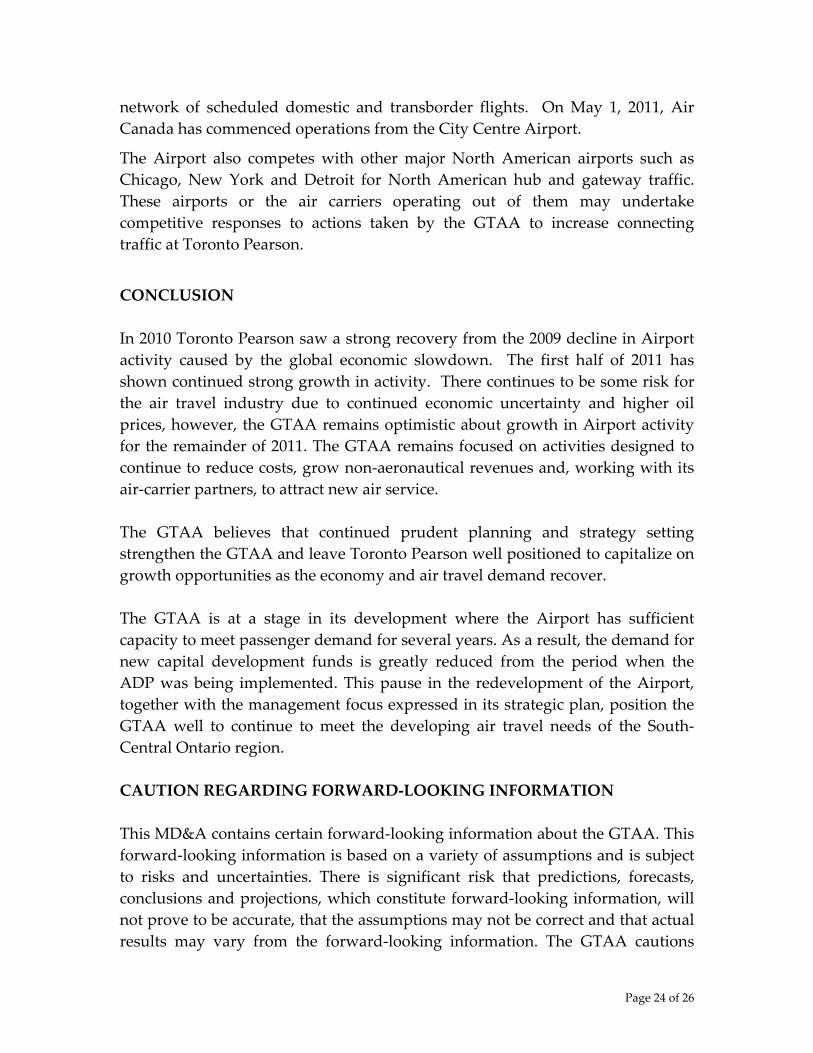
network of scheduled domestic and transborder flights. On May 1, 2011, Air
Canada has commenced operations from the City Centre Airport.
The Airport also competes with other major North American airports such as
Chicago, New York and Detroit for North American hub and gateway traffic.
These airports or the air carriers operating out of them may undertake
competitive responses to actions taken by the GTAA to increase connecting
traffic at Toronto Pearson.
CONCLUSION
In 2010 Toronto Pearson saw a strong recovery from the 2009 decline in Airport
activity caused by the global economic slowdown. The first half of 2011 has
shown continued strong growth in activity. There continues to be some risk for
the air travel industry due to continued economic uncertainty and higher oil
prices, however, the GTAA remains optimistic about growth in Airport activity
for the remainder of 2011. The GTAA remains focused on activities designed to
continue to reduce costs, grow non‐aeronautical revenues and, working with its
air‐carrier partners, to attract new air service.
The GTAA believes that continued prudent planning and strategy setting
strengthen the GTAA and leave Toronto Pearson well positioned to capitalize on
growth opportunities as the economy and air travel demand recover.
The GTAA is at a stage in its development where the Airport has sufficient
capacity to meet passenger demand for several years. As a result, the demand for
new capital development funds is greatly reduced from the period when the
ADP was being implemented. This pause in the redevelopment of the Airport,
together with the management focus expressed in its strategic plan, position the
GTAA well to continue to meet the developing air travel needs of the South‐
Central Ontario region.
CAUTION REGARDING FORWARD‐LOOKING INFORMATION
This MD&A contains certain forward‐looking information about the GTAA. This
forward‐looking information is based on a variety of assumptions and is subject
to risks and uncertainties. There is significant risk that predictions, forecasts,
conclusions and projections, which constitute forward‐looking information, will
not prove to be accurate, that the assumptions may not be correct and that actual
results may vary from the forward‐looking information. The GTAA cautions

Page 25 of 26
readers of this MD&A not to place undue reliance on the forward‐looking
information as a number of factors could cause actual results, conditions, actions
or events to differ materially from the targets, expectations, estimates or
intentions expressed in the forward‐looking information.
Words such as “believe”, “expect”, “plan”, “intend”, “estimate” “anticipate” and
similar expressions, as well as future or conditional verbs such as “will”,
“should” “would” and “could” often identify forward‐looking information.
Specific forward‐looking information in this MD&A includes, among others,
statements regarding: demand for air travel in the GTA; budgets and
expenditures relating to capital programs; terminal, airside, infield and other
capital developments at the Airport; the relationship between the GTAA’s
revenues and reserve funds and its operating expenses and interest and
financing costs; non‐aeronautical revenues; airline load factors and fleet mix; the
commencement of operations of facilities currently under construction at the
Airport; the GTAA’s capital borrowing requirements and its ability to access the
capital markets; passenger projections; the impact of incentive programs and
reductions in aeronautical rates; the implementation of new aeronautical or other
fees; cash flows and liquidity; the use of current cash and cash equivalent
balances; the impact of China granting “Approved Destination Status” on travel
between China and Canada; the impact of terrorism or the threat of terrorism
and enhanced security screening on passenger activity; the impact of a strike or
lockout of GTAA or Air Canada unionized employees; and the impact of the
transition to IFRS.
The forward‐looking information is based on a variety of material factors and
assumptions including, but not limited to: long‐term growth in population,
employment and personal income will provide the basis for increased aviation
demand in the GTA; the Canadian, U.S. and global economies will slow down,
recover and grow at expected levels; air carrier capacity will meet the demand
for air travel in the GTA; the growth and sustainability of low cost and other air
carriers will contribute to aviation demand in the GTA; the GTA will continue to
attract domestic, transborder and international travellers; the commercial
aviation industry will not be directly affected by terrorism or the threat of
terrorism; the cost of enhancing aviation security will not overly burden air
carriers, passengers, shippers or the GTAA; no significant event will occur that
impacts the ordinary course of business such as a natural disaster or other
calamity; the GTAA will be able to access the capital markets at competitive
terms and rates; and there are no significant cost overruns or delays relating to
capital programs. These assumptions are based on information currently

Page 26 of 26
available to the GTAA, including information obtained by the GTAA from third‐
party experts and analysts.
Risk factors that could cause actual results to differ materially from the results
expressed or implied by forward‐looking information include, among other
things: volatility in the economic recovery and future economic activity; high
rates of unemployment; levels of aviation activity; air carrier instability; aviation
liability insurance; construction risk; geopolitical unrest; terrorist attacks and the
threat of terrorist attacks; war; health epidemics; labour disputes; capital market
conditions; changes in laws; adverse amendments to the Ground Lease;
competition from other airports, telecommunications and ground transportation;
the availability and cost of jet fuel; carbon emission costs and restrictions;
adverse regulatory developments or proceedings; environmental issues;
lawsuits; and other risks detailed from time to time in the GTAA’s publicly filed
disclosure documents.
The forward‐looking information contained in this MD&A represents
expectations as of the date of this report and is subject to change. Except as
required by applicable law, the GTAA disclaims any intention or obligation to
update or revise any forward‐looking information whether as a result of new
information, future events or for any other reason.

Financial Statements of the
Greater Toronto Airports Authority
June 30, 2011
(unaudited)

Page 1 of 32
Greater Toronto Airports AuthorityStatements of Financial Position
June 30 December 31
(unaudited)(in thousands of Canadian dollars) 2011 2010
Assets $ $
Current Assets
Cash and cash equivalents 138,786 170,188
Accounts receivable 41,888 36,604
Prepaids and other receivables 5,032 11,351
Inventory 6,741 6,786
192,447 224,929
Non‐current Assets
Restricted funds (Note 7) 1,007,000 926,503
Intangibles and other assets (Note 8) 87,029 85,736
Property and equipment (Note 9) 5,489,829 5,562,251
Investment property (Note 10) 23,697 24,055
Post‐employment benefit asset 7,660 5,933
6,807,662 6,829,407
Liabilities
Current Liabilities
Accounts payable and accrued liabilities 55,439 67,664
Provisions (Note 12) 3,589 14,495
Security deposits and deferred credits 73,704 66,958
Current portion of deferred ground rent (Note 1) 4,156 4,156
Current portion of long‐term debt (Note 11) 603,827 349,516
740,715 502,789
Non‐current Liabilities
Deferred credit and other liabilities (Note 8) 32,114 33,590
Deferred ground rent (Note 1) 14,547 16,625
Post‐employment benefit liability 10,362 8,924
Long‐term debt (Note 11) 6,724,310 6,950,825
7,522,048 7,512,753
Deficit and Accumulated other comprehensive income (Note 1) (714,386) (683,346)
6,807,662 6,829,407
Commitments and contingent liabilities (Note 14)
The accompanying notes are an integral part of these interim financial statements.

Page 2 of 32
Greater Toronto Airports AuthorityStatements of Operations and Comprehensive Income (Loss)
(unaudited)(in thousands of Canadian dollars) 2011 2010 2011 2010
$ $ $ $
Revenues
Landing fees 86,237 93,241 168,485 184,443
General terminal charges 54,135 38,937 107,009 77,649
Airport improvement fees 71,833 73,229 146,494 145,529
Car parking and ground transportation 31,764 28,982 62,597 59,035
Concessions 20,126 17,865 37,709 35,946
Rentals 15,431 16,617 31,221 32,357
Other 3,141 2,347 5,336 4,357
282,667 271,218 558,851 539,316
Operating Expenses
Ground rent (Note 1) 32,385 31,061 64,273 62,217
Goods and services 50,280 51,650 105,653 104,224
Salaries, wages and benefits 27,269 28,181 57,384 56,368
Payments‐in‐lieu of real property taxes 6,902 6,573 13,787 13,146
Amortization of property and equipment and
investment property (Notes 9 and 10) 53,015 55,002 102,895 111,044
Amortization of intangible assets (Note 8) 1,334 494 1,963 703
171,185 172,961 345,955 347,702
Earnings before interest and financing costs, net 111,482 98,257 212,896 191,614
Interest income 2,827 1,182 5,776 2,113
Interest expense on debt instruments and other
financing costs (108,491) (111,832) (220,692) (220,903)
Premium paid for early retirement of debt ‐ ‐ (27,565) ‐
Interest and financing costs, net (Note 11) (105,664) (110,650) (242,481) (218,790)
Net Income (Loss) 5,818 (12,393) (29,585) (27,176)
Amortization of terminated hedge 108 231 (1,251) 461
Amortization of gain on terminated interest rate swap (102) (267) (204) (535)
Other Comprehensive Income (Loss) 6 (36) (1,455) (74)
Total Comprehensive Income (Loss) 5,824 (12,429) (31,040) (27,250)
June 30
Three Months Ended Six Months Ended
June 30
The accompanying notes are an integral part of these interim financial statements.

Page 3 of 32
Greater Toronto Airports AuthorityStatements of Changes in Deficit and Accumulated Other
Comprehensive Income
Six‐month period ended Accumulated Other
June 30, 2011 Comprehensive
(unaudited)(in thousands of Canadian dollars) Deficit Income Total
$ $ $
Balance, January 1, 2011 (685,614) 2,268 (683,346)
Total Net Loss (29,585) ‐ (29,585)
Amortization of terminated hedge ‐ (1,251) (1,251)
Amortization of gain on sale of terminated interest rate swap ‐ (204) (204)
Total Comprehensive loss for the period (29,585) (1,455) (31,040)
Balance, June 30, 2011 (715,199) 813 (714,386)
Six‐month period ended Accumulated Other
June 30, 2010 Comprehensive
(unaudited)(in thousands of Canadian dollars) Deficit Income Total
$ $ $
Balance, January 1, 2010 (652,714) 2,415 (650,299)
Total Net Loss (27,176) ‐ (27,176)
Amortization of terminated hedge ‐ 461 461
Amortization of gain on sale of terminated interest rate swap ‐ (535) (535)
Total Comprehensive loss for the period (27,176) (74) (27,250)
Balance, June 30, 2010 (679,890) 2,341 (677,549)
The accompanying notes are an integral part of these interim financial statements.

Page 4 of 32
Greater Toronto Airports AuthorityStatements of Cash Flows
Six‐month period ending June 30
(unaudited)(in thousands of Canadian dollars) 2011 2010
Cash Flows from Operating Activities $ $
Net Loss (29,585) (27,176)
Adjustments for:
Amortization of property and equipment and investment property 102,895 111,044
Amortization of intangibles and other assets 2,714 1,308
Change in fair value of restricted funds ‐ (5,122)
Loss on disposal of property and equipment 3,546 753
Change in fair value of derivative (5,310) (4,111)
Derivative cash receipts 2,798 2,679
Post‐employment benefit obligation (289) (1,900)
Interest expense 220,692 220,903
Amortization of loss on terminated hedge (1,251) 461
Amortization of gain on terminated interest rate swap (204) (535)
Changes in non‐cash working capital:
Accounts receivable (4,849) (7,714)
Prepaids and other receivables 6,319 (6,799)
Inventory 45 (508)
Accounts payable and accrued liabilities (3,863) 1,317
Provisions (10,906) (1,453)
Security deposits, deferred credits and other liabilities 5,270 (5,821)
288,022 277,326
Cash Flows from Investing Activities
Acquisition and construction of property and equipment (45,190) (32,981)
Proceeds on disposal of property and equipment 42 21
(Increase) decrease in restricted funds (80,497) 16,852
(125,645) (16,108)
Cash Flows from Financing Activities
Issuance of medium term notes and long‐term debt (Note 11) 596,820 397,596
Repayment of medium term notes and long‐term debt (Note 11) (575,077) (350,307)
Interest paid (213,444) (227,658)
Decrease in deferred ground rent payable (Note 1) (2,078) (2,078)
(193,779) (182,447)
Net Cash (Outflow) Inflow (31,402) 78,771
Cash and cash equivalents, beginning of year 170,188 551,803
Cash and cash equivalents, end of period 138,786 630,574
As at June 30, 2011, cash and cash equivalents consisted of short‐term investments of $135.9
million (December 31, 2010 ‐ $167.8 million), cash of $14.1 million (December 31, 2010 ‐ $14.2
million) less outstanding cheques of $11.2 million (December 31, 2010 ‐ $11.8 million).
The accompanying notes are an integral part of these interim financial statements.

Greater Toronto Airports Authority Notes to the Financial Statements
For the six-month period ended June 30, 2011 (unaudited) (Unless otherwise stated, all amounts are in thousands of Canadian dollars)
Page 5 of 32
1. General Information
National Airports Policy
In July 1994, the federal government announced its National Airports Policy whereby the
management, operation and maintenance of 26 airports within the National Airport
System was to be transferred through various ground lease arrangements to locally
controlled Canadian Airport Authorities (“CAAs”). The National Airports Policy also
prescribed the Fundamental Principles for the creation and operation of CAAs including
the Public Accountability Principles to be adopted by each CAA.
CAAs are free to operate airports on a commercial basis and have the authority to set all
fees and charges. The federal government retains regulatory control over aeronautics and
as such will set safety and security standards for airports, license airports and regulate the
aviation industry as a whole.
Corporate Profile of the Greater Toronto Airports Authority
Greater Toronto Airports Authority (“GTAA”) was incorporated on March 3, 1993 under
Part II of the Canada Corporations Act, as a corporation without share capital. This
corporate structure ensures that the excess of revenues over expenses is retained and
reinvested in airports and airport operations under control of the GTAA. The GTAA is
governed by a 15‐member Board of Directors (the “Board”). Directors serve a term of
three years and are eligible to be re‐appointed subject to a maximum limit of nine years.
Seven Directors are appointed by the Board on a cyclical basis from a pool of candidates
identified in a search process provided that at least three of these appointments are
candidates who have been nominated by the Named Community Nominators comprised
of The Board of Trade of the City of Brampton, The Board of Trade of the City of
Mississauga, The Toronto Board of Trade, the Law Society of Upper Canada, Association
of Professional Engineers Ontario, and the Institute of Chartered Accountants of Ontario.
The Board appoints five Directors from municipal candidates. Each of the Regional
Municipalities of York, Halton, Peel, Durham and the City of Toronto are entitled to
provide, on a rotating basis, the names of three candidates and the Board appoints one of
the three candidates for each available position as a Director. In addition, the
Government of Canada and the Province of Ontario are entitled to appoint two Directors
and one Director, respectively.
The GTAA is exempt from federal and provincial income tax and Ontario capital tax. The
GTAA is also exempt from real property tax under the Assessment Act (Ontario).
However, the GTAA is required to pay each of the Cities of Toronto and Mississauga an
amount as calculated in accordance with regulations under the Assessment Act (Ontario)
as a payment‐in‐lieu of real property taxes.

Greater Toronto Airports Authority Notes to the Financial Statements
For the six-month ended June 30, 2011(unaudited) (Unless otherwise stated, all amounts are in thousands of Canadian dollars)
Page 6 of 32
1. General Information (continued) The GTAA is authorized to operate airports within the south‐central Ontario region,
including the Greater Toronto Area on a commercial basis, to set fees for their use and to
develop and improve the facilities. In accordance with this mandate, the GTAA manages
and operates Toronto Pearson International Airport (the “Airport”). Under the terms of a
ground lease, the Airport was transferred to the GTAA in 1996. The Airport operates on
1,882 hectares of land which includes Terminals 1 and 3, airside assets including five
runways, taxiways and aprons, groundside assets including bridges and parking lots,
infield assets including an aircraft deicing facility and cargo buildings, and ancillary
structures. Excluded are any assets owned by Nav Canada, the operator of Canada’s civil
air navigation system.
The GTAA is committed to the continuing development of the Airport. This includes
continued redevelopment of the terminals, increasing airside capacity, increasing cargo
and aircraft facilities, and reconstructing the roadway system.
The GTAA’s registered office and principal place of business is located at 3111 Convair
Drive, Mississauga, Ontario, Canada.
Airport Subject to Ground Lease
On December 2, 1996, the GTAA assumed the operation, management and control of the
Airport for a period of 60 years, together with one renewal term of 20 years, by virtue of a
ground lease (the “Ground Lease”) between the GTAA, as tenant, and Her Majesty the
Queen in Right of Canada, represented by the Minister of Transport (“Transport
Canada”), as landlord. The GTAA assumed the obligations of Transport Canada under all
existing agreements at the Airport.
The Ground Lease is the principal document governing the relationship between the
GTAA and Transport Canada at the Airport. It determines the airport rent to be paid and
generally allocates risk and responsibilities between the GTAA and the federal
government for all matters related to the operation of the Airport. Under the Ground
Lease, all revenue and expenditure contracts in effect on December 1, 1996, were assigned
to the GTAA. The GTAA did not assume any liability with respect to claims against the
federal government incurred prior to December 2, 1996.
By virtue of its status as the tenant under the Ground Lease, the GTAA has the authority
to set and collect airline rates and charges, negotiate and issue leases, licenses and permits
and construct and develop the infrastructure of the Airport. The Ground Lease permits
the GTAA to pledge its leasehold interest in the Airport as security.
Ground rent is calculated as a percentage of Airport Revenue, as defined by the Ground
Lease and related documents, using escalating percentages with the following ranges: 0%
for Airport Revenue below $5.0 million, 1% for Airport Revenue between $5.0 million and
$10.0 million, 5% for Airport Revenue between $10.0 million and $25.0 million, 8%

Greater Toronto Airports Authority Notes to the Financial Statements
For the six-month period ended June 30, 2011(unaudited) (Unless otherwise stated, all amounts are in thousands of Canadian dollars)
Page 7 of 32
1. General Information (continued) for Airport Revenue between $25.0 million and $100.0 million, 10% for Airport Revenue
between $100.0 million and $250.0 million, and 12% for Airport Revenue in excess of
$250.0 million. The calculation of Airport Revenue is subject to audit by Transport
Canada.
In July 2003, the Government of Canada announced a program to allow for a deferral in
the ground rent for a two‐year period commencing July 1, 2003, in the amount of $41.6
million. This amount is being repaid over a 10‐year period, commencing in 2006, through
increased annual ground rent payments of approximately $4.2 million per year. The
decrease in the liability for the six‐month period ended June 30, 2011 was approximately
$2.1 million, bringing the total remaining liability at June 30, 2011 to $18.7 million.
The GTAA’s operations can be affected by seasonal fluctuations due to changes in
customer travel demands. This seasonality could impact quarter‐over‐quarter
comparisons.
2. Basis of Presentation and Adoption of IFRS The GTAA prepares its financial statements in accordance with Canadian generally
accepted accounting principles as set out in the Handbook of the Canadian Institute of
Chartered Accountants (“CICA Handbook”). In 2010, the CICA Handbook was revised to
incorporate International Financial Reporting Standards (“IFRS”), and require publicly
accountable enterprises to apply such standards effective for years beginning on or after
January 1, 2011. Accordingly, the GTAA has commenced reporting on this basis effective
January 1, 2011. In these interim financial statements, the term “Canadian GAAP” refers
to Canadian GAAP before the adoption of IFRS.
These interim financial statements have been prepared in accordance with IFRS applicable
to the preparation of interim financial statements, including IAS 34, Interim Financial
Reporting and IFRS 1, First‐time Adoption of International Financial Reporting Standards.
Subject to certain transition elections disclosed in Note 5, Transition to IFRS on first time
adoption, the GTAA has consistently applied the same accounting policies in its opening
IFRS statement of financial position at January 1, 2010 and throughout all periods
presented, as if these policies had always been in effect. Note 5 discloses the impact of the
transition to IFRS on the GTAA’s reported financial position, financial performance and
cash flows, including the nature and effect of significant changes in accounting policies
from those used in the GTAA’s financial statements for the year ended December 31,
2010.
The policies applied in these interim financial statements are based on IFRS issued and
outstanding as of August 10, 2011, the date the Audit Committee of the Board of Directors
approved the financial statements. Any subsequent changes to IFRS that are given effect
in the GTAA’s annual financial statements for the year ending December 31,

Greater Toronto Airports Authority Notes to the Financial Statements
For the six-month ended June 30, 2011(unaudited) (Unless otherwise stated, all amounts are in thousands of Canadian dollars)
Page 8 of 32
2. Basis of Presentation and Adoption of IFRS (continued) 2011 could result in restatement of these interim financial statements, including the
transition adjustments recognized on change‐over to IFRS.
The interim financial statements should be read in conjunction with the GTAA’s
Canadian GAAP annual financial statements for the year ended December 31, 2010.
3. Significant Accounting Policies The significant accounting policies used in the preparation of these interim financial
statements are the same accounting policies and methods of computation as those
discussed in the March 31, 2011 interim financial statements.
4. Accounting Standards Issued But Not Yet Applied a) Amendments to IAS 1, Presentation of Items of Other Comprehensive Income: The amendment provides guidance on the presentation of items contained in other
comprehensive income (“OCI”) and their classification within OCI. The amendment is
effective for periods beginning on or after January 1, 2013, with early adoption permitted.
The GTAA does not expect any impact to the financial statements as a result of adopting
the amended standard.
b) Amendments to IAS 19, Employee Benefits: The amendment makes significant changes to the recognition and measurement of post
employment defined benefit expense and termination benefits, and to the disclosures for
all employee benefits. The amendment is effective for periods beginning on or after
January 1, 2013, with early adoption permitted. The GTAA has not yet assessed the
impact of the amended standard or determined whether it will adopt the amended
standard early. c) IFRS 9, Financial Instruments: This standard replaces the current IAS 39, Financial Instruments Recognition and
Measurement. The standard introduces new requirements for classifying and measuring
financial assets and liabilities. This standard is required to be applied for periods
beginning on or after January 1, 2013, with earlier adoption permitted. The GTAA has not
yet assessed the impact of the standard or determined whether it will adopt the standard
early.
d) IFRS 13, Fair Value Measurements: This standard defines fair value, provides guidance on its determination and introduces
consistent requirements for disclosures on fair value measurements. This standard is
required to be applied for periods beginning on or after January 1, 2013, with earlier
adoption permitted. The GTAA has not yet assessed the impact of the standard or
determined whether it will adopt the standard early.

Greater Toronto Airports Authority Notes to the Financial Statements
For the six-month period ended June 30, 2011(unaudited) (Unless otherwise stated, all amounts are in thousands of Canadian dollars)
Page 9 of 32
5. Transition to IFRS on First Time Adoption The GTAA’s interim financial statements for the three‐month period ending March 31,
2011 were the first interim financial statements to be prepared in accordance with IFRS.
These financial statements were prepared as described in Note 3, Significant accounting
policies. The GTAA applied IFRS 1, First‐time Adoption of International Financial Reporting
Standards, in the preparation of these interim financial statements.
The GTAA’s date of transition to IFRS is January 1, 2010, i.e. the date of the earliest
comparative period. The GTAA prepared its opening IFRS statement of financial position
at that date. The date of IFRS adoption by the GTAA is January 1, 2011. The GTAA’s
financial statements for the year ending December 31, 2011 will be the first annual
financial statements that comply with IFRS. The GTAA will complete its IFRS statement
of financial position by applying existing IFRS with an effective date of December 31, 2011
or prior. Accordingly, the opening IFRS statement of financial position and the December
31, 2010 comparative statement of financial position presented in the financial statements
for the year ending December 31, 2011 may differ from those presented at this time.
Reconciliations between IFRS and Canadian GAAP
The following reconciliations demonstrate the impact of the transition to IFRS:
i. Reconciliation of deficit as previously reported under Canadian GAAP to IFRS;
ii. Reconciliation of comprehensive loss as previously reported under Canadian
GAAP to IFRS;
iii. Adjustments to the statement of cash flows.

Greater Toronto Airports Authority Notes to the Financial Statements
For the six-month period ended June 30, 2011 (unaudited) (Unless otherwise stated, all amounts are in thousands of Canadian dollars)
Page 10 of 32
5. Transition to IFRS on First Time Adoption (continued)
i. Reconciliation of deficit as previously reported under Canadian GAAP to IFRS:
Canadian
Note GAAP Adj. IFRS
Assets $ $ $
Current Assets
Cash and cash equivalents 630,574 ‐ 630,574
Accounts receivable 48,309 ‐ 48,309
Prepaids and other receivables 10,476 ‐ 10,476
Inventory a. 9,030 (1,411) 7,619
698,389 (1,411) 696,978
Non‐current Assets
Restricted funds 988,660 ‐ 988,660
Intangibles and other assets 72,943 ‐ 72,943
Property and equipment a.b.c.g. 5,892,813 (246,878) 5,645,935
Investment property c. ‐ 24,201 24,201
Post‐employment benefit asset d. 29,816 (20,751) 9,065
7,682,621 (244,839) 7,437,782
Liabilities
Current Liabilities
Accounts payable and accrued liabilities e. 61,126 (7,655) 53,471
Provisions e. ‐ 7,655 7,655
Security deposits and deferred credits 61,412 ‐ 61,412
Current portion of deferred ground rent 4,156 ‐ 4,156
Current portion of long‐term debt 960,750 ‐ 960,750
1,087,444 ‐ 1,087,444
Non‐current Liabilities
Deferred credit and other liabilities 34,316 ‐ 34,316
Deferred ground rent 18,704 ‐ 18,704
Post‐employment benefit obligation 7,422 ‐ 7,422
Long‐term debt 6,967,445 ‐ 6,967,445
8,115,331 ‐ 8,115,331
Deficit and Accumulated other comprehensive income f. (432,710) (244,839) (677,549)
7,682,621 (244,839) 7,437,782
June 30, 2010

Greater Toronto Airports Authority Notes to the Financial Statements
For the six-month period ended June 30, 2011 (unaudited) (Unless otherwise stated, all amounts are in thousands of Canadian dollars)
Page 11 of 32
5. Transition to IFRS on First Time Adoption (continued)
ii. Reconciliation of comprehensive loss as previously reported under Canadian GAAP to IFRS:
Canadian Canadian
Note GAAP Adj. IFRS GAAP Adj. IFRS
$ $ $ $ $ $
Revenues
Landing fees 93,241 ‐ 93,241 184,443 ‐ 184,443
General terminal charges 38,937 ‐ 38,937 77,649 ‐ 77,649
Airport improvement fees, 73,229 ‐ 73,229 145,529 ‐ 145,529
Car parking and ground transportation 28,982 ‐ 28,982 59,035 ‐ 59,035
Concessions 17,865 ‐ 17,865 35,946 ‐ 35,946
Rentals 16,617 ‐ 16,617 32,357 ‐ 32,357
Other 2,347 ‐ 2,347 4,357 ‐ 4,357
271,218 ‐ 271,218 539,316 ‐ 539,316
Operating Expenses
Ground rent 31,061 ‐ 31,061 62,217 ‐ 62,217
Goods and services 51,650 ‐ 51,650 104,224 ‐ 104,224
Salaries, wages and benefits d. 28,315 (134) 28,181 56,636 (268) 56,368
Payments‐in‐lieu of real property taxes 6,573 ‐ 6,573 13,146 ‐ 13,146
Amortization of property and equipment and
investment property b. 48,793 6,209 55,002 97,326 13,718 111,044
Amortization of intangible assets 494 ‐ 494 703 ‐ 703
166,886 6,075 172,961 334,252 13,450 347,702 Earnings before interest and financing costs, net 104,332 (6,075) 98,257 205,064 (13,450) 191,614
Interest income 1,182 ‐ 1,182 2,113 ‐ 2,113
Interest expense on debt instruments and
other financing costs g. (112,133) 301 (111,832) (221,505) 602 (220,903)
Interest and financing costs, net (110,951) 301 (110,650) (219,392) 602 (218,790)
Net Loss (6,619) (5,774) (12,393) (14,328) (12,848) (27,176)
Amortization of terminated hedge 231 ‐ 231 461 ‐ 461
Amortization of gain on terminated interest rate swap (267) ‐ (267) (535) ‐ (535)
Other Comprehensive Loss (36) ‐ (36) (74) ‐ (74)
Total Comprehensive Loss (6,655) (5,774) (12,429) (14,402) (12,848) (27,250)
Six Months Ended
June 30, 2010June 30, 2010
Three Months Ended

Greater Toronto Airports Authority Notes to the Financial Statements
For the six-month period ended June 30, 2011 (unaudited) (Unless otherwise stated, all amounts are in thousands of Canadian dollars)
Page 12 of 32
5. Transition to IFRS on First Time Adoption (continued) a. Spare parts and servicing equipment were carried as inventory and recognized in the
statement of operations and comprehensive loss as consumed. However, under IFRS,
major spare parts and stand‐by equipment qualify as property and equipment when
an entity expects to use them during more than one period and the equipment can be
used only in connection with an item of property and equipment. As a result, certain
spare parts and servicing equipment were reclassified from inventory to property and
equipment and amortized accordingly.
b. IFRS requires entities to allocate the amounts initially recognized in respect of
property and equipment to its significant parts (components) and amortized
separately each such component over its useful life. On adoption, the GTAA identified
various components of the terminal and other assets which required further
componentization under IFRS. These components have different useful lives than the
primary asset under Canadian GAAP. To reflect the further amortization in respect of
these assets, adjustments of $6.2 million and $13.7 million were required for the three‐
month and six‐month periods ended June 30, 2010, respectively and on adoption
$209.7 million at January 1, 2010. In addition, adjustments were made to property and
equipment to reflect IFRS guidance on when amortization should commence. The
GTAA has historically commenced amortization of property and equipment when the
assets are put into productive use, in accordance with Canadian GAAP. IAS 16,
Property, plant and equipment, requires the amortization of assets to commence when
the asset is available for use. As a result of the differences in principle, a one‐time
adjustment to the opening balance sheet to reflect approximately $1.3 million in
additional amortization expense was required.
c. Property meeting the definition of investment property under IAS 40, Investment
Property, continues to be measured at historic cost less any accumulated amortization
but is required to be disclosed separately on the statement of financial position with
additional disclosure requirements (see Note 10, Investment property).
d. The GTAA elected to recognize all cumulative unamortized actuarial gains and losses
on transition in its opening deficit on January 1, 2010. Previously under Canadian
GAAP, the corridor method was used and these items were amortized into the
statement of operations and comprehensive loss over time. IFRS also contains specific
guidance over when an asset relating to a pension plan can be recognized including
the entity’s legal ability to access the surplus. As a result, the previously established
surplus under Canadian GAAP was revised to amounts calculated in accordance with
applicable IFRS standards.

Greater Toronto Airports Authority Notes to the Financial Statements
For the six-month period ended June 30, 2011(unaudited) (Unless otherwise stated, all amounts are in thousands of Canadian dollars)
Page 13 of 32
5. Transition to IFRS on First Time Adoption (continued) As a result of differences in measuring the current expense for benefits under IFRS,
the GTAA recorded a recovery of $0.5 million for the 2010 pension expense of which
$0.3 million related to the six‐month period ended June 30, 2010. This amount was
recorded in the statement of operations and comprehensive loss.
e. IFRS requires provisions be disclosed separately on the face of the financial
statements. As such, a reclassification of accruals previously presented in accounts
payable and accrued liabilities on the statement of financial position to provisions was
done at June 30, 2010.
f. Deficit is presented without segregating balances into externally and internally
restricted funds previously disclosed under Canadian GAAP.
Transactions impacting deficit included:
June 30, 2010
$
Deficit as reported under Canadian GAAP 432,710
IFRS adjustments:
Impact due to amortization of property and equipment as a
result of componentization and other changes (Notes a,b,c and g) 224,690
Adjustment to borrowing costs (Note g) (602)
Adjustment to pension asset (Note d) 21,019
Change in recorded pension expense (Note d) (268)
Deficit under IFRS 677,549
g. IFRS requires that the interest be capitalized on amounts included in assets under
construction including interest previously capitalized. Canadian GAAP was not
specific in this requirement. As a result, $1.2 million of additional interest was
capitalized to assets under construction for 2010 of which $0.6 million related to the
six‐month period ended June 30, 2010.
iii. Adjustments to the statement of cash flow:
There were no material adjustments to the cash flow statement as a result of the
conversion to IFRS.
iv. Comparative figures:
Certain comparative figures previously reported under Canadian GAAP have been
reclassified to conform with presentation under IFRS.

Greater Toronto Airports Authority Notes to the Financial Statements
For the six-month ended June 30, 2011(unaudited) (Unless otherwise stated, all amounts are in thousands of Canadian dollars)
Page 14 of 32
6. Critical Accounting Judgments and Estimates In applying GTAA’s accounting policies, which are described in Note 3, Significant
accounting policies, management is required to make judgments, estimates and
assumptions about the carrying amount of assets and liabilities that are not readily
apparent from other sources. The estimates and associated assumptions are based on
historical experience and other factors that are considered to be relevant. Actual results
may differ from these estimates.
Accounting estimates and underlying assumptions are reviewed on an ongoing basis.
Revisions to accounting estimates are recognized in the period in which the estimate is
revised if the revision affects only that period, or in the period of the revision and future
periods if the revision affects both current and future periods.
Critical Judgments in Applying Accounting Policies
The following are the critical judgments that management has made in the process of
applying the GTAA’s accounting policies and that have the most significant effect on the
amounts recognized in the financial statements.
Accounts Receivable
The allowance for doubtful accounts involves management judgment and review of
individual receivable balances based on individual customer creditworthiness, current
economic trends and analysis of historical bad debts.
Property and Equipment and Intangibles
Critical judgments are utilized in determining amortization rates and useful lives of
assets.
Provisions
The determination of a provision is based on best available accounting estimates. Such
estimates are subject to change based on new information.
Key Sources of Estimation Uncertainty
The following are the key assumptions concerning the future, and other key sources of
estimation uncertainty at the end of the reporting period, that have a significant risk of
causing a material adjustment to the carrying amounts of assets and liabilities within the
next fiscal year.
OPA Derivative
The fair value of the GTAA’s derivative is determined using a valuation technique which
uses assumptions including discount rates, forward gas and electricity prices, plant
utilization and other factors.

Greater Toronto Airports Authority Notes to the Financial Statements
For the six-month period ended June 30, 2011(unaudited) (Unless otherwise stated, all amounts are in thousands of Canadian dollars)
Page 15 of 32
6. Critical Accounting Judgments and Estimates (continued) Post-employment Benefit Obligations
The GTAA accounts for pension and other post‐retirement benefits through the use of
actuarial valuations. These valuations rely on statistical and other factors in order to
anticipate future events. These factors include key actuarial assumptions including
discount rates, expected return on plan assets, expected salary increases and mortality
rates. Actual results may differ from results which are estimated based on assumptions.
7. Restricted Funds Restricted funds consist of certain funds, the use of which are directed by the Master
Trust Indenture (“Trust Indenture”) or Medium term note offering documents, and
consist of the Debt Service Fund and Debt Service Reserve Fund (the “Trust Funds”) and
Operations, Capital and Financing Funds. These funds are invested in cash or short‐term
commercial paper with less than one year to maturity as follows:

Greater Toronto Airports Authority Notes to the Financial Statements
For the six-month ended June 30, 2011(unaudited) (Unless otherwise stated, all amounts are in thousands of Canadian dollars)
Page 16 of 32
7. Restricted Funds (continued)
June 30 December 31
2011 2010
$ $
Debt Service Fund
Interest 80,997 75,534
Principal 16,391 9,215
97,388 84,749
Debt Service Reserve Fund
Revenue Bonds
Series 1997‐3 due December 3, 2027 37,254 36,971
Series 1999‐1 due July 30, 2029 40,616 40,303
Medium Term Notes
Series 2000‐1 due June 12 , 2030 39,021 38,827
Series 2001‐1 due June 4, 2031 35,528 35,254
Series 2002‐1 due January 30, 2012 31,430 31,246
Series 2002‐2 due December 13, 2012 29,893 29,674
Series 2002‐3 due October 15, 2032 38,666 38,459
Series 2004‐1 due February 2, 2034 39,180 38,912
Series 2005‐1 due June 1, 2015 17,717 17,616
Series 2005‐3 due February 15, 2016 16,649 16,551
Series 2006‐1 due February 28, 2011 ‐ 11,090
Series 2007‐1 due June 1, 2017 22,043 21,931
Series 2008‐1 due April 17, 2018 26,602 26,397
Series 2008‐2 due December 6, 2013 ‐ 19,137
Series 2009‐1 due November 20, 2019 36,127 35,860
Series 2010‐1 due June 7, 2040 22,723 22,657
Series 2011‐1 due February 25, 2041 32,085 ‐
Security for Bank Indebtedness
Series 1997‐A Pledge Bond 10,325 10,269
475,859 471,154
Operations, Capital and Financing Funds
Operating and Maintenance Reserve Fund 63,762 63,275
Renewal and Replacement Reserve Fund 3,025 3,000
Airport Improvement Fee Reserve Fund 176,466 127,425
Notional Principal Fund 69,325 65,300
Debt Service Coverage Fund 121,175 111,600
433,753 370,600
1,007,000 926,503

Greater Toronto Airports Authority Notes to the Financial Statements
For the six-month period ended June 30, 2011(unaudited) (Unless otherwise stated, all amounts are in thousands of Canadian dollars)
Page 17 of 32
7. Restricted Funds (continued)
Trust Funds
The GTAA is required to establish and maintain with the Trustee the Trust Funds in
accordance with the terms of the Trust Indenture (see Note 11, Credit facility and long‐
term debt). The Trust Funds are held for the benefit of the bondholders and noteholders
for use and application by the Trustee in accordance with the terms of the Trust
Indenture.
(i) Debt Service Fund (principal and interest)
Amounts in the Debt Service Fund are allocated to either an Interest Account or a
Principal Account. On a monthly basis, the GTAA is required to deposit into the
Interest Account an amount equal to one‐sixth of the semi‐annual aggregate interest
requirement due on all outstanding bonds and medium term notes. Also on a
monthly basis, the GTAA is required to deposit into the Principal Account an
amount equal to one‐twelfth of the total principal amount included in annual debt
service, during the term, for any bonds or notes due in such year. The principal
requirements of the Debt Service Fund were funded during the six‐month period
ended June 30, 2011 and has a balance of $16.4 million (December 31, 2010 – $9.2
million). Amounts in the Debt Service Fund are held by the Trustee for the benefit of
the bondholders or noteholders and are disbursed by the Trustee to pay interest and
principal as they become due.
Principal of $4.5 million was paid from the Debt Service Fund during the six‐month
period ended June 30, 2011 (December 31, 2010 – $29.6 million). During the six‐
month period ended June 30, 2011, $11.7 million was deposited and/or allocated to
the Principal Account of the Debt Service Fund by the GTAA for the principal of the
Series 1999‐1, Series 2002‐1 and Series 2006‐1 bonds (December 31, 2010 – $25.4
million).
(ii) Debt Service Reserve Fund
To the extent provided in any Supplemental Indenture, the GTAA is required to set
aside funds in the Debt Service Reserve Fund for each series of bond or medium
term note. The required amount is established at the time of issue of each series of
bond or medium term note and funded from the proceeds of each issue. Amounts
held in the Debt Service Reserve Fund are held by the Trustee for the benefit of the
bondholders or noteholders for use and application in accordance with the terms of
the Trust Indenture.
At the maturity of each series of bond or medium term note, funds not applied by
the Trustee will be returned to the GTAA.
Included among these Trust Funds is a Debt Service Reserve Fund related to the
$550.0 million pledge bond (Series 1997‐A) securing the credit facility with the

Greater Toronto Airports Authority Notes to the Financial Statements
For the six-month period ended June 30, 2011 (unaudited) (Unless otherwise stated, all amounts are in thousands of Canadian dollars)
Page 18 of 32
7. Restricted Funds (continued) (ii) Debt Service Reserve Fund (continued)
syndicate of six Canadian banks. The minimum required balance is adjusted
annually based on the prevailing Bankersʹ Acceptance rate plus applicable margin.
At the maturity or cancellation of this series of bonds, funds not applied by the
Trustee will be returned to the GTAA.
Operations, Capital and Financing Funds
The GTAA has established an Operating and Maintenance Reserve Fund and a Renewal
and Replacement Reserve Fund pursuant to the Trust Indenture. The Operating and
Maintenance Reserve Fund is calculated as one‐sixth of the projected operating and
maintenance expenses estimated for the following fiscal year. As at June 30, 2011, this
fund had a balance of $63.8 million (December 31, 2010 – $63.3 million). This amount is to
be used only for operating and maintenance expenses or other purposes as required for
the safe, ongoing operation and maintenance of the Airport as set out in the Trust
Indenture. The Renewal and Replacement Reserve Fund of $3.0 million (December 31,
2010 – $3.0 million) is to be used for unanticipated repairs to, or the replacement of,
property and equipment as set out in the Trust Indenture.
In conjunction with the airport improvement fee agreements with participating airlines,
the GTAA has established an Airport Improvement Fee Reserve Fund for the deposit of
fees collected and not yet utilized. As at June 30, 2011, this fund had an accumulated
balance of $176.5 million (December 31, 2010 – $127.4 million). During the six‐month
period ended June 30, 2011, $102.1 million (December 31, 2010 – $278.9 million) of
accumulated Airport Improvement Fee Funds were utilized for certain debt service
payments.
Capital and Financing Funds include Notional Principal and Debt Service Coverage
Funds, which are amounts that have been collected through airline rates and charges. The
Notional Principal Fund may be used to reduce future debt obligations, when principal is
due for any series of bond or medium term note. For non‐amortizing debt, principal is
deemed to be included in annual debt service, based on a 30‐year amortization,
commencing on the same date as interest is expensed. As at June 30, 2011, the balance in
the Notional Principal Fund was $69.3 million (December 31, 2010 – $65.3 million). The
Debt Service Coverage Fund is established to meet the coverage requirements set out in
the Trust Indenture. As at June 30, 2011, it had a balance of $121.2 million (December 31,
2010 – $111.6 million).

Greater Toronto Airports Authority Notes to the Financial Statements
For the six-month period ended June 30, 2011(unaudited) (Unless otherwise stated, all amounts are in thousands of Canadian dollars)
Page 19 of 32
8. Intangibles and Other Assets
Accumulated Net Book
Cost Amortization Value
$ $ $
Defer red leasehold inducements 6,107 3,629 2,478
Land acquisit ion costs 39,708 2,725 36,983
Computer softw are 12,740 10,523 2,217
58,555 16,877 41,678
Fair value of the OPA der ivat ive 45,351
87,029
June 30, 2011
Accumulated Net Book
Cost Amortization Value
$ $ $
Deferred leasehold inducements 6,107 3,285 2,822
Land acquisition costs 39,708 2,317 37,391
Computer software 10,809 8,560 2,249
56,624 14,162 42,462
Fair value of the OPA derivative 43,274
85,736
December 31, 2010
The aggregate amortization expense in respect of deferred leasehold inducements for the
six‐month period ended June 30, 2011, was $0.3 million (June 30, 2010 – $0.3 million) and
is included in concession revenue on the statement of operations and comprehensive
income (loss).
The aggregate amortization expense in respect of land acquisition costs for the six‐month
period ended June 30, 2011, was $0.4 million (June 30, 2010 – $0.3 million) and is included
in ground rent expense on the statement of operations and comprehensive income (loss).
The aggregate amortization expense in respect of computer software for the six‐month
period ended June 30, 2011, was $2.0 million (June 30, 2010 – $0.7 million) and is included
in amortization of intangible assets on the statement of operations and comprehensive
income (loss). Additions to computer software for the six‐month period ended June 30,
2011 were $1.9 million (June 30, 2010 – $0.5 million).
On February 1, 2006, the GTAA entered into a Clean Energy Supply contract (“CES
Contract”) with the Ontario Power Authority (“OPA”), pursuant to which the GTAA is
obligated to have 90 MW of electrical energy available to the Ontario power grid. The
term of the CES Contract is for 20 years, subject to early termination rights available to the
GTAA. The contract allows for payments by either party, depending on whether net

Greater Toronto Airports Authority Notes to the Financial Statements
For the six-month period ended June 30, 2011 (unaudited) (Unless otherwise stated, all amounts are in thousands of Canadian dollars)
Page 20 of 32
8. Intangibles and Other Assets (continued) electricity market revenues that the GTAA is deemed to have earned are greater or less
than a predetermined threshold, as defined in the CES Contract.
The contract has been determined to be a derivative. The fair value of the derivative as at
June 30, 2011 was estimated to be $45.4 million (December 31, 2010 ‐ $43.3 million). The
GTAA realized an increase in the fair value of the derivative during the six‐month period
ended June 30, 2011 of $5.3 million (December 31, 2010 ‐ $6.5 million) which was recorded
in goods and services expense on the statement of operations and comprehensive income
(loss), and has received and accrued for cash proceeds of approximately $3.2 million
(December 31, 2010 ‐ $5.2 million) which reduced its value.
The GTAA also recorded a deferred credit of $42.0 million which is being amortized over
the term of 20 years. The unamortized balance at June 30, 2011, was $32.1 million
(December 31, 2010 – $33.2 million), and is recorded in deferred credit and other liabilities
on the statement of financial position.

Greater Toronto Airports Authority Notes to the Financial Statements
For the six-month period ended June 30, 2011(unaudited) (Unless otherwise stated, all amounts are in thousands of Canadian dollars)
Page 21 of 32
9. Property and Equipment Property and equipment are comprised of:
June 30, 2011
Terminal and Baggage Improvements Runways Airport Assets
Airside handling to leased and operating Finance under
assets systems land taxiways assets leases construction Total
$ $ $ $ $ $ $ $
Cost
Balance, January 1, 2011 5,951,674 287,256 9,480 401,841 550,903 6,743 93,202 7,301,099
Additions 40,686 82 ‐ 278 7,634 ‐ 35,575 84,255
Disposals / Transfers ‐ ‐ ‐ ‐ (3,959) (225) (50,553) (54,737)
Balance, June 30, 2011 5,992,360 287,338 9,480 402,119 554,578 6,518 78,224 7,330,617
Accumulated amortization
Balance, January 1, 2011 1,291,861 97,731 2,206 85,443 255,383 6,224 ‐ 1,738,848
Amortization expense 72,258 6,244 79 6,401 17,476 79 ‐ 102,537
Disposals / Transfers ‐ ‐ ‐ ‐ (372) (225) ‐ (597)
Balance, June 30, 2011 1,364,119 103,975 2,285 91,844 272,487 6,078 ‐ 1,840,788
Net book value, June 30, 2011 4,628,241 183,363 7,195 310,275 282,091 440 78,224 5,489,829
December 31, 2010
Terminal and Baggage Improvements Runways Airport Assets
Airside handling to leased and operating Finance under
assets systems land taxiways assets leases construction Total
$ $ $ $ $ $ $ $
Cost
Balance, January 1, 2010 5,882,452 283,041 9,480 394,037 546,265 7,592 152,851 7,275,718
Additions 72,601 4,215 ‐ 7,804 34,060 ‐ 61,706 180,386
Disposals / Transfers (3,379) ‐ ‐ ‐ (29,422) (849) (121,355) (155,005)
Balance, December 31, 2010 5,951,674 287,256 9,480 401,841 550,903 6,743 93,202 7,301,099
Accumulated amortization
Balance, January 1, 2010 1,160,957 83,599 2,031 71,023 223,335 6,749 ‐ 1,547,694
Amortization expense 133,910 14,132 175 14,420 57,983 324 ‐ 220,944
Disposals / Transfers (3,006) ‐ ‐ ‐ (25,935) (849) ‐ (29,790)
Balance, December 31, 2010 1,291,861 97,731 2,206 85,443 255,383 6,224 ‐ 1,738,848
Net book value, December 31, 2010 4,659,813 189,525 7,274 316,398 295,520 519 93,202 5,562,251
As at June 30, 2011, $78.2 million (December 31, 2010 – $93.2 million) of property and
equipment was under construction and not yet subject to amortization. Included in this
amount is $8.8 million (December 31, 2010 – $12.8 million) of capitalized interest.

Greater Toronto Airports Authority Notes to the Financial Statements
For the six-month ended June 30, 2011(unaudited) (Unless otherwise stated, all amounts are in thousands of Canadian dollars)
Page 22 of 32
10. Investment Property
June 30 December 31
(in thousands) 2011 2010
$ $
Cost
Balance, beginning of year 26,085 25,901
Additions ‐ 184
Balance, end of period 26,085 26,085
Accumulated amortization and impairment
Balance, beginning of year 2,030 1,312
Amortization expense 358 718
Balance, end of period 2,388 2,030
Net book value, end of period 23,697 24,055
Investment property includes the flight simulator facility operated by the GTAA.
The fair value of investment property at January 1, 2010 and December 31, 2010 was
estimated to be $28.0 million and $28.2 million respectively.
The valuation technique used by the GTAA to estimate the fair value of investment
property incorporates discounted cash flows derived considering the best available public
information regarding market conditions rental rates and other factors that a market
participant would consider for such a property. The discount rate of 10.8% used in the
valuation is based on the weighted average cost of capital for the Canadian airline
industry and the GTAA’s own internal rate of return.
For the six‐month period ended June 30, 2011 rental income generated from investment
property amounted to $1.5 million (June 30, 2010 ‐ $1.5 million) and direct operating
expenses amounted to $0.5 million (June 30, 2010 ‐ $0.5 million). These amounts are
included in rental revenue and goods and services expense respectively on the statement
of operations and comprehensive income (loss).

Greater Toronto Airports Authority Notes to the Financial Statements
For the six-month period ended June 30, 2011(unaudited) (Unless otherwise stated, all amounts are in thousands of Canadian dollars)
Page 23 of 32
11. Credit Facility and Long-term Debt As at June 30, 2011 and December 31, 2010, long‐term debt including accrued interest, net
of unamortized discounts and premiums consists of:
Coupon Maturity Principal June 30 December 31
Series Rate Date Amount 2011 2010
Revenue Bonds, See below $ $ $
1997‐3 6.45% December 3, 2027 375,000 371,868 371,851
1999‐1 6.45% July 30, 2029 432,720 440,894 440,824
Medium Term Notes
2000‐1 7.05% June 12, 2030 550,000 550,039 550,124
2001‐1 7.10% June 4, 2031 500,000 497,926 497,971
2002‐1 6.25% January 30, 2012 500,000 512,942 512,846
2002‐2 6.25% December 13, 2012 475,000 475,686 475,547
2002‐3 6.98% October 15, 2032 550,000 558,125 558,238
2004‐1 6.47% February 2, 2034 600,000 609,563 609,610
2005‐1 5.00% June 1, 2015 350,000 349,125 348,956
2005‐3 4.70% February 15, 2016 350,000 354,594 354,540
2006‐1 4.40% February 28, 2011 250,000 ‐ 253,610
2007‐1 4.85% June 1, 2017 450,000 449,349 449,303
2008‐1 5.26% April 17, 2018 500,000 503,418 503,379
2008‐2 5.89% December 6, 2013 325,000 ‐ 325,281
2009‐1 5.96% November 20, 2019 600,000 627,343 628,564
2010‐1 5.63% June 7, 2040 400,000 398,433 398,112
2011‐1 5.30% February 25, 2041 600,000 606,822 ‐
7,306,127 7,278,756
Finance leases 79 152
Province of Ontario
Interest‐free loan, payable in five equal annual
installments commencing 2011 21,931 21,433
7,328,137 7,300,341
Less current portion (including accrued interest) 603,827 349,516
6,724,310 6,950,825
On February 23, 2011, the GTAA issued Series 2011‐1 Medium Term Notes (“MTNs”)
with a face value of $600.0 million for net proceeds of $596.8 million.
On February 28, 2011, the GTAA redeemed the Series 2006‐1 MTN with a face value of
$250.0 million.
On March 21, 2011, the GTAA exercised its right to redeem all $325.0 million of the
outstanding Series 2008‐2 MTNs. The Series 2008‐2 MTNs carried a coupon of 5.89% and
had a maturity date of December 6, 2013. The redemption price, including accrued
interest was paid on the redemption date and the Series 2008‐2 MTNs were cancelled.
This resulted in the early retirement charge of $27.6 million in the period.

Greater Toronto Airports Authority Notes to the Financial Statements
For the six-month ended June 30, 2011(unaudited) (Unless otherwise stated, all amounts are in thousands of Canadian dollars)
Page 24 of 32
11. Credit Facility and Long-term Debt (continued) Interest and financing costs, net consisted of the following:
(in thousands) 2011 2010 2011 2010
$ $ $ $
Interest income (1,106) (639) (2,471) (1,199)
Interest earned on restricted funds (1,721) (543) (3,305) (914)
(2,827) (1,182) (5,776) (2,113)
Interest expense on debt instruments 108,460 114,341 219,222 228,348
Premium paid for early retirement of debt ‐ ‐ 27,565 ‐
Other financing fees and fair value adjustments 31 (2,509) 1,470 (7,445)
108,491 111,832 248,257 220,903
Interest and financing costs, net 105,664 110,650 242,481 218,790
Six Months Ended
June 30
Three Months Ended
June 30
With the exception of Series 1999‐1 revenue bonds, principal on each series of revenue
bonds and medium term notes is payable on the maturity date. Series 1999‐1 are
amortizing revenue bonds repayable in scheduled annual installments of principal,
payable on July 30 of each year. These payments commenced July 30, 2004, and continue
until maturity.
Interest on each series of revenue bond and medium term note is payable semi‐annually
from the interest payable commencement date, based on fixed rates.
Set out below is a comparison of the amounts that would be reported if long‐term debt
amounts were reported at fair values. Fair values were based on quoted market rates for
GTAA bonds as at June 30, 2011 and December 31, 2010:
Book Fair Book Fair
Value Value Value Value
$ $ $ $
Long‐term debt 7,328,137 8,255,207 7,300,341 8,194,502
June 30, 2011 December 31, 2010
All notes are redeemable in whole or in part at the option of the GTAA at any time at a
redemption price which is the greater of (i) the face value amount plus accrued and
unpaid interest and (ii) the price based on yields over Government of Canada bonds with
similar terms to maturity.

Greater Toronto Airports Authority Notes to the Financial Statements
For the six-month period ended June 30, 2011(unaudited) (Unless otherwise stated, all amounts are in thousands of Canadian dollars)
Page 25 of 32
11. Credit Facility and Long-term Debt (continued)
Credit Facility
The GTAA maintains a credit facility with a syndicate of six Canadian banks. The credit
facility is secured by a $550.0 million pledge bond (Series 1997‐A) issued pursuant to the
Trust Indenture. Indebtedness under the credit facility ranks pari passu with other
indebtedness issued under the Trust Indenture. Under this credit facility, the GTAA is
provided with a $500.0 million facility for general corporate purposes and capital
expenditures, and a $50.0 million facility for interest rate and foreign exchange hedging
activities. The facility matures on November 22, 2013, and can be extended annually for
an additional year with the lenders’ consent.
As at June 30, 2011, $2.3 million was utilized under the $500.0 million facility by way of a
letter of credit (June 30, 2010 – $2.3 million) (see Note 14, Commitments and contingent
liabilities). No amounts were drawn against the $50.0 million facility (June 30, 2010 – $nil).
Indebtedness under the credit facility bears interest at rates that vary with the lenders’
prime rate, Bankers’ Acceptance rates and LIBOR, as appropriate. If funds were drawn on
the facility during the quarter, interest rates would have ranged from 2.36% to 3.25%
(April 1, 2010 to June 30, 2010 – 2.39% to 3.50%).
12. Provisions
Restructuring Litigation Other Total
$ $ $ $
Balance, January 1, 2011 4,345 10,150 ‐ 14,495
Additional provision ‐ 293 1,668 1,961
Reductions arising from payments (2,767) (10,100) ‐ (12,867)
Balance, June 30, 2011 1,578 343 1,668 3,589
Balance, January 1, 2010 7,858 1,100 ‐ 8,958
Additional provision 1,950 9,050 ‐ 11,000
Reductions arising from payments (5,463) ‐ ‐ (5,463)
Balance, December 31, 2010 4,345 10,150 ‐ 14,495
Restructuring
In 2009, the GTAA implemented a restructuring plan to align its cost structure to the
current economic and market conditions. These charges are included in the salaries,
wages and benefits expense on the statement of operations and comprehensive income
(loss). No charge was recorded during the first six months of 2011 relating to voluntary
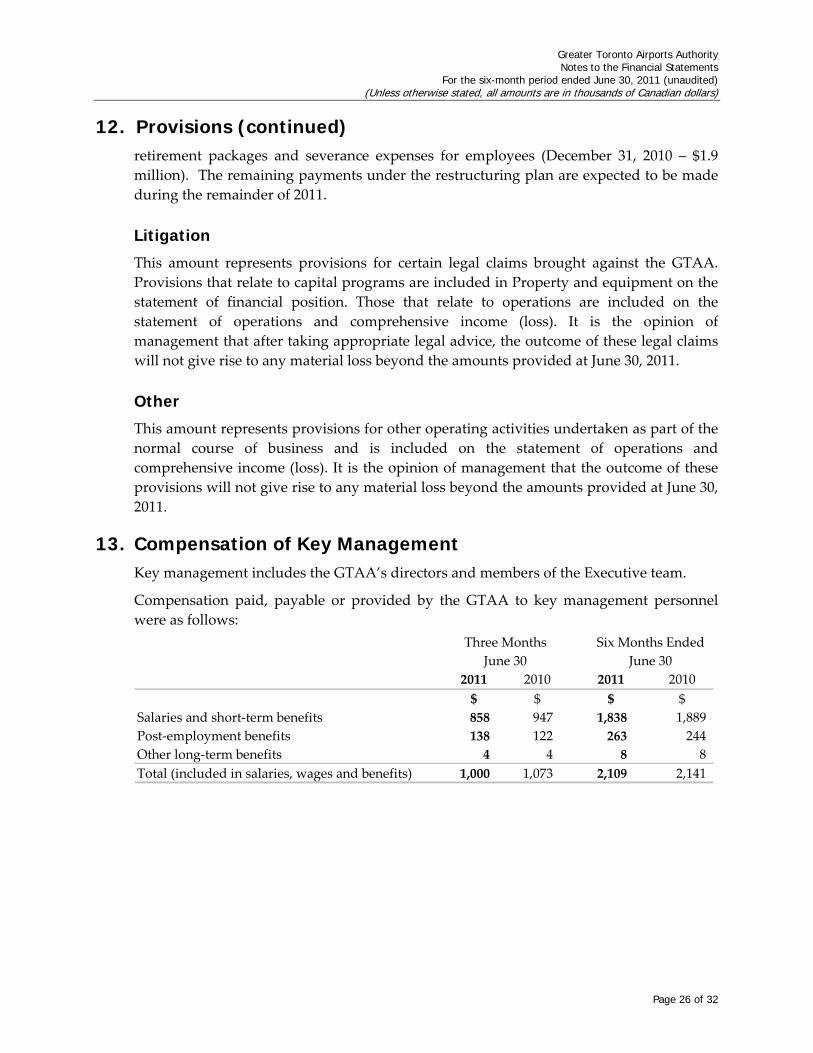
Greater Toronto Airports Authority Notes to the Financial Statements
For the six-month period ended June 30, 2011 (unaudited) (Unless otherwise stated, all amounts are in thousands of Canadian dollars)
Page 26 of 32
12. Provisions (continued) retirement packages and severance expenses for employees (December 31, 2010 – $1.9
million). The remaining payments under the restructuring plan are expected to be made
during the remainder of 2011.
Litigation
This amount represents provisions for certain legal claims brought against the GTAA.
Provisions that relate to capital programs are included in Property and equipment on the
statement of financial position. Those that relate to operations are included on the
statement of operations and comprehensive income (loss). It is the opinion of
management that after taking appropriate legal advice, the outcome of these legal claims
will not give rise to any material loss beyond the amounts provided at June 30, 2011.
Other
This amount represents provisions for other operating activities undertaken as part of the
normal course of business and is included on the statement of operations and
comprehensive income (loss). It is the opinion of management that the outcome of these
provisions will not give rise to any material loss beyond the amounts provided at June 30,
2011.
13. Compensation of Key Management Key management includes the GTAA’s directors and members of the Executive team.
Compensation paid, payable or provided by the GTAA to key management personnel
were as follows:
2011 2010 2011 2010
$ $ $ $
Salaries and short‐term benefits 858 947 1,838 1,889
Post‐employment benefits 138 122 263 244
Other long‐term benefits 4 4 8 8
Total (included in salaries, wages and benefits) 1,000 1,073 2,109 2,141
Three Months Six Months Ended
June 30 June 30

Greater Toronto Airports Authority Notes to the Financial Statements
For the six-month period ended June 30, 2011(unaudited) (Unless otherwise stated, all amounts are in thousands of Canadian dollars)
Page 27 of 32
14. Commitments and Contingent Liabilities
Capital Commitments
In connection with the operation and development of the Airport, the GTAA had capital
commitments outstanding at June 30, 2011, of approximately $106.6 million (December 31,
2010 – $113.0 million).
Letters of Credit
A letter of credit for $2.3 million was outstanding at June 30, 2011 (see Note 11, Credit
facility and long‐term debt), relating to the GTAA’s CES contract with the OPA. The letter
of credit expires April 11, 2012.
Environmental
The GTAA is committed to ensuring that activities undertaken at the Airport are carried
out in an environmentally responsible manner, in compliance with applicable
environmental laws and regulations, and with sensitivity to community and public
concerns.
The GTAA performs environmental assessments as part of its ongoing environmental
management program and has achieved ISO 14001 certification.
Roadway Infrastructure
In connection with receiving a deferral for the payment of land transfer tax to the
Province of Ontario until 2011 (see Note 11, Credit facility and long‐term debt), the GTAA
agreed to participate in the development of highway infrastructure and transit
improvements related to the Airport. The GTAA has undertaken significant
transportation infrastructure work and believes it has met this requirement.
Boeing Lands
In July 2001, the GTAA and Boeing Canada Operations Ltd. (formerly Boeing Toronto,
Ltd.) (“Boeing”) signed an agreement, amended in June 2002, under which Boeing agreed
to sell to the GTAA 45.73 hectares of land adjoining the Airport property for a total of
$30.0 million. These lands will be transferred by Boeing in stages. The first parcel
representing 16.1 hectares of land was conveyed on May 29, 2006. The second parcel
representing 14.8 hectares of land was conveyed on August 9, 2010. The remaining 14.8
hectares of land will be transferred after environmental remediation is completed.
Commitments related to the third parcel are included under capital commitments. All
lands purchased under this agreement by the GTAA will be transferred to the federal
government as required under the terms of the Ground Lease. Deposits totalling $4.7

Greater Toronto Airports Authority Notes to the Financial Statements
For the six-month ended June 30, 2011(unaudited) (Unless otherwise stated, all amounts are in thousands of Canadian dollars)
Page 28 of 32
14. Commitments and Contingent Liabilities (continued)
million, which were recorded in assets under construction, have been applied to the
purchase price of the second parcel.
Insurance
The Government of Canada has issued an Order in Council providing full indemnity to
the Canadian aviation industry for any coverage that was lost due to the cancellation of
war and terrorism insurance. The Order in Council has been approved for the years 2011
to 2013. Official declarations of its status occur every 90 days to account for the potential
of change in the insurance industry. As part of the original Order in Council of September
2001, the GTAA was required to purchase a $50.0 million primary layer of war and
terrorist coverage from the commercial markets. This coverage is in place until June 2012.
Cogeneration Facility
The GTAA has entered into certain contracts in order to secure the supply and delivery of
natural gas necessary for anticipated future operations of the Cogeneration facility. Under
these contracts, the GTAA will be required to make payments relating to both the delivery
of natural gas based on standard rate agreements and the cost of natural gas as
determined by market rates. The GTAA has also entered into a delivery contract that
establishes a maximum volume of natural gas inventory that the GTAA is permitted to
maintain, as of the anniversary date. The GTAA has the option to dispose of natural gas
in excess of this maximum volume either through consumption or through the sale of
natural gas to third parties.
Contingent liabilities
The GTAA is subject to legal proceedings and claims from time to time which arise in the
normal course of business. Where appropriate, the GTAA has recorded provisions while
it actively pursues its position (see Note 12, Provisions). Where it is the opinion of
management that the ultimate outcome of these matters will not have a material effect
upon the GTAA’s financial position, results of operations, or cash flows, no provisions
have been recorded.
Air France
As a result of the Air France incident on August 2, 2005, the GTAA together with a
number of other parties were named as defendants in several lawsuits including a class
action lawsuit involving most passengers and their family members. In 2010, the class
action lawsuit which named the GTAA was settled. The settlement did not involve any
admission of liability by the GTAA. The GTAA’s insurers are responsible for paying

Greater Toronto Airports Authority Notes to the Financial Statements
For the six-month period ended June 30, 2011(unaudited) (Unless otherwise stated, all amounts are in thousands of Canadian dollars)
Page 29 of 32
14. Commitments and Contingent Liabilities (continued)
the GTAA’s share of the settlement amount to the class action plaintiffs. The GTAA’s
insurers continue to defend the GTAA in four remaining lawsuits. It is the opinion of
management that the GTAA’s financial exposure is limited to its insurance deductible.
15. Guarantees In the normal course of operations, the GTAA provides indemnification agreements to
counterparties in a wide variety of transactions such as contracts for goods and services,
maintenance agreements, design‐build contracts, construction contracts, and information
technology agreements. These indemnification agreements require the GTAA to
indemnify the counterparties in respect of costs incurred as a result of certain changes in
the underlying nature of the contracts (including, without limitation, changes in laws,
delays caused by the GTAA, pre‐existing environmental conditions) and in respect of
costs incurred as a result of certain litigation claims that may result from the transaction
(such as, by way of example, patent infringement or personal injury and property damage
due to the GTAA’s negligence). The terms of the indemnification agreements will vary
based on the contract. The nature of the indemnification agreements prevents
management from making a reasonable estimate of the maximum potential amount the
GTAA may be required to pay to or expend on behalf of such counterparties because such
limits are most commonly not set out in the said agreements and the events in question
are themselves highly contingent and variable in nature. Management attempts to limit its
liability in respect of the indemnifications provided to such counterparties through the
purchase of liability and property insurance and the allocation of risk to other contractors.
16. Financial Instruments
Fair Value Hierarchy
Fair value measurements recognized in the statement of financial position must be
categorized in accordance with the following levels:
a) Level 1 – Unadjusted quoted prices in active markets for identical assets or
liabilities;
b) Level 2 – Observable inputs other than quoted prices included in Level 1 such as
quoted prices for similar assets and liabilities in active markets; quoted prices for
identical or similar assets and liabilities in markets that are not active; or other
inputs that are observable or can be corroborated by observable market data;
c) Level 3 – Significant unobservable inputs which are supported by little or no
market activity.

Greater Toronto Airports Authority Notes to the Financial Statements
For the six-month ended June 30, 2011(unaudited) (Unless otherwise stated, all amounts are in thousands of Canadian dollars)
Page 30 of 32
16. Financial Instruments (continued) Cash, restricted funds and security deposits are categorized as Level 1 as the GTAA uses
quoted prices in active markets for identical assets or liabilities to fair value this group.
The OPA derivative is categorized as Level 3 as no observable market exists for this
financial asset. See Note 8, Intangibles and other assets, for additional information on the
valuation technique used to fair value this financial asset.
The following table presents the changes in the Level 3 instrument that is measured at fair
value on a recurring basis:
OPA
(in thousands) ABCP Derivative Total
$ $ $
Balance, January 1, 2011 ‐ 43,274 43,274
Fair value adjustments included in statement of operations
and comprehensive loss ‐ 5,310 5,310
Cash received or receivable ‐ (3,233) (3,233)
Balance, June 30, 2011 ‐ 45,351 45,351
Balance, January 1, 2010 82,876 41,961 124,837
Fair value adjustments included in statement of operations
and comprehensive loss 8,882 6,471 15,353
Loss on redemption (1,131) ‐ (1,131)
Redemptions and cash receipts (90,627) (5,158) (95,785)
Balance, December 31, 2010 ‐ 43,274 43,274
There were no transfers into or out of Level 3 during the period.
Risk Management
In the normal course of business, the GTAA is exposed to a number of financial risks that
can affect its operating performance. The GTAA’s overall risk management program
seeks to minimize potential adverse effects on the GTAA’s financial performance.
The GTAA’s treasury function is responsible for the procurement of the GTAA’s capital
resources and for the management of financial risk. All treasury operations are conducted
within policies and guidelines approved by the Board of Directors and are within the
requirements set out in the Trust Indenture dated December 2, 1997, as supplemented or
amended from time to time. Compliance with these policies is monitored by the regular
reporting of treasury activities to the Audit Committee of the Board.
The GTAA’s operating activities result in financial risks that may arise from changes in
market risk, credit risk and liquidity risk.

Greater Toronto Airports Authority Notes to the Financial Statements
For the six-month period ended June 30, 2011(unaudited) (Unless otherwise stated, all amounts are in thousands of Canadian dollars)
Page 31 of 32
16. Financial Instruments (continued) Market Risk
(a) Interest rate risk
The GTAAʹs exposure to interest rate risk relates to its medium term notes bank
indebtedness as described in Note 11, Credit facility and long‐term debt. It should be
noted that as at June 30, 2011, all of GTAA’s debt at the current time is fixed rate debt and
therefore changes in interest rates do not impact interest payments but may impact the
fair value of this debt.
The GTAA also has exposure to interest rate risk through its short‐term investments in
reserve and other funds (see Note 7, Restricted funds). As at June 30, 2011, all of the
GTAA’s short‐term investment holdings carried a fixed rate during their term and
therefore changes in interest rates did not impact interest income for the period.
The Debt Service Reserve Fund securing bank indebtedness is adjusted annually on
December 2, based on the prevailing Bankersʹ Acceptance rate.
(b) Commodity price risk
The GTAAʹs exposure to commodity price risk primarily relates to its CES Contract with
the OPA. The impact of a 1% increase/decrease in the 2011 average price of electricity
holding natural gas prices constant would result in a $1.0 million decrease/increase in the
fair value of the OPA derivative as at June 30, 2011. The impact of a 1% increase/decrease
in the 2011 average price of natural gas holding the price of electricity constant would
result in a $1.4 million increase/decrease in the fair value of the OPA derivative as at June
30, 2011.
(c) Foreign currency rate risk
The GTAA undertakes certain transactions denominated in foreign currencies, primarily
the U.S. dollar. The GTAA’s exposure, however, to any foreign currency risk is not
significant.
Credit risk
The GTAA is subject to credit risk through its financial assets. The GTAA performs
ongoing credit valuations of these balances and maintains valuation allowances for
potential credit loss.
Liquidity Risk
The GTAA manages liquidity risk by maintaining adequate cash, restricted funds and
available credit facilities. Quarterly cash flow projections are prepared by management
and reviewed by the Audit Committee to ensure a sufficient continuity of funding. To
maintain a flexible program, debt maturities are spread over a range of dates thereby

Greater Toronto Airports Authority Notes to the Financial Statements
For the six-month period ended June 30, 2011 (unaudited) (Unless otherwise stated, all amounts are in thousands of Canadian dollars)
Page 32 of 32
16. Financial Instruments (continued) ensuring that the GTAA is not exposed to excessive refinancing risk in any one year. The
GTAA maintains a line of credit and executes a capital markets platform to meets cash
needs as debt maturities occur (see Note 11, Credit facility and long‐term debt).
The table below analyses the GTAA’s financial liabilities by relevant maturity groupings
based on the remaining period at the balance sheet date to the contractual maturity date.
It does not include pension and post‐retirement benefit obligations as maturities are
variable based on timing of individuals leaving the plan. The table has been prepared
based on the contractual undiscounted cash flows based on the earliest date on which the
GTAA can be required to pay. It includes both principal and interest cash flows.
Less than 1 month to 1 year to
1 month 12 months 5 years Thereafter
$ $ $ $
Accounts payable and accrued liabilities 40,256 15,183 ‐ ‐
Province of Ontario ‐ 4,800 19,200 ‐
Long‐term debt 29,580 918,946 3,525,921 9,092,750
69,836 938,929 3,545,121 9,092,750
Less than 1 month to 1 year to
1 month 12 months 5 years Thereafter
$ $ $ $
Accounts payable and accrued liabilities 53,358 14,306 ‐ ‐
Province of Ontario ‐ 4,800 19,200 ‐
Long‐term debt 29,580 662,183 3,830,041 8,331,758
82,938 681,289 3,849,241 8,331,758
June 30, 2011
December 31, 2010
Additional disclosure about the GTAA’s credit facility, long‐term debt, and OPA
derivative can be found in Note 11, Credit facility and long‐term debt and Note 8,
Intangibles and other assets.
17. Comparative Figures
Certain comparative figures have been reclassified to conform with the current period’s
presentation.