Ancient polymorphisms contribute to genome-wide variation ...
15
RESEARCH Open Access Ancient polymorphisms contribute to genome-wide variation by long-term balancing selection and divergent sorting in Boechera stricta Baosheng Wang 1,2* , Julius P. Mojica 2 , Nadeesha Perera 2 , Cheng-Ruei Lee 3 , John T. Lovell 4 , Aditi Sharma 5 , Catherine Adam 5 , Anna Lipzen 5 , Kerrie Barry 5 , Daniel S. Rokhsar 5 , Jeremy Schmutz 4,5 and Thomas Mitchell-Olds 2* Abstract Background: Genomic variation is widespread, and both neutral and selective processes can generate similar patterns in the genome. These processes are not mutually exclusive, so it is difficult to infer the evolutionary mechanisms that govern population and species divergence. Boechera stricta is a perennial relative of Arabidopsis thaliana native to largely undisturbed habitats with two geographic and ecologically divergent subspecies. Here, we delineate the evolutionary processes driving the genetic diversity and population differentiation in this species. Results: Using whole-genome re-sequencing data from 517 B. stricta accessions, we identify four genetic groups that diverged around 30–180 thousand years ago, with long-term small effective population sizes and recent population expansion after the Last Glacial Maximum. We find three genomic regions with elevated nucleotide diversity, totaling about 10% of the genome. These three regions of elevated nucleotide diversity show excess of intermediate-frequency alleles, higher absolute divergence (d XY ), and lower relative divergence (F ST ) than genomic background, and significant enrichment in immune-related genes, reflecting long-term balancing selection. Scattered across the genome, we also find regions with both high F ST and d XY among the groups, termed F ST - islands. Population genetic signatures indicate that F ST -islands with elevated divergence, which have experienced directional selection, are derived from divergent sorting of ancient polymorphisms. Conclusions: Our results suggest that long-term balancing selection on disease resistance genes may have maintained ancestral haplotypes across different geographical lineages, and unequal sorting of balanced polymorphisms may have generated genomic regions with elevated divergence. This study highlights the importance of ancestral balanced polymorphisms as crucial components of genome-wide variation. Keywords: Genomic diversity, Ancestral polymorphism, Balancing selection, Speciation Background How evolutionary processes drive genetic divergence and eventually lead to speciation is a fundamental ques- tion in evolutionary biology [1]. Taking advantage of next-generation sequencing technologies, heterogeneous genomic variation has been documented in many species [2–8], but disentangling factors shaping genomic land- scapes remain challenging [9]. Balancing selection maintains multiple advantageous polymorphisms in populations and increases genetic diver- sity [10]. In contrast, positive and purifying selection favor single advantageous alleles and reduce genetic diversity [11, 12]. Balancing selection can persist for many generations, and maintains ancient polymorphisms in nascent species pairs, resulting in genomic regions with increased nucleo- tide diversity (π) in descendant species and low relative divergence (F ST ) between species [13]. Alternatively, when © The Author(s). 2019 Open Access This article is distributed under the terms of the Creative Commons Attribution 4.0 International License (http://creativecommons.org/licenses/by/4.0/), which permits unrestricted use, distribution, and reproduction in any medium, provided you give appropriate credit to the original author(s) and the source, provide a link to the Creative Commons license, and indicate if changes were made. The Creative Commons Public Domain Dedication waiver (http://creativecommons.org/publicdomain/zero/1.0/) applies to the data made available in this article, unless otherwise stated. * Correspondence: [email protected]; [email protected] 1 Key Laboratory of Plant Resources Conservation and Sustainable Utilization, South China Botanical Garden, Chinese Academy of Sciences, Guangzhou 510650, China 2 Department of Biology, Duke University, Box 90338, Durham, NC 27708, USA Full list of author information is available at the end of the article Wang et al. Genome Biology (2019) 20:126 https://doi.org/10.1186/s13059-019-1729-9
Transcript of Ancient polymorphisms contribute to genome-wide variation ...

RESEARCH Open Access
Ancient polymorphisms contribute togenome-wide variation by long-termbalancing selection and divergent sortingin Boechera strictaBaosheng Wang1,2* , Julius P. Mojica2, Nadeesha Perera2, Cheng-Ruei Lee3, John T. Lovell4, Aditi Sharma5,Catherine Adam5, Anna Lipzen5, Kerrie Barry5, Daniel S. Rokhsar5, Jeremy Schmutz4,5 and Thomas Mitchell-Olds2*
Abstract
Background: Genomic variation is widespread, and both neutral and selective processes can generate similarpatterns in the genome. These processes are not mutually exclusive, so it is difficult to infer the evolutionarymechanisms that govern population and species divergence. Boechera stricta is a perennial relative of Arabidopsisthaliana native to largely undisturbed habitats with two geographic and ecologically divergent subspecies. Here,we delineate the evolutionary processes driving the genetic diversity and population differentiation in this species.
Results: Using whole-genome re-sequencing data from 517 B. stricta accessions, we identify four genetic groupsthat diverged around 30–180 thousand years ago, with long-term small effective population sizes and recentpopulation expansion after the Last Glacial Maximum. We find three genomic regions with elevated nucleotidediversity, totaling about 10% of the genome. These three regions of elevated nucleotide diversity show excess ofintermediate-frequency alleles, higher absolute divergence (dXY), and lower relative divergence (FST) than genomicbackground, and significant enrichment in immune-related genes, reflecting long-term balancing selection.Scattered across the genome, we also find regions with both high FST and dXY among the groups, termed FST-islands. Population genetic signatures indicate that FST-islands with elevated divergence, which have experienceddirectional selection, are derived from divergent sorting of ancient polymorphisms.
Conclusions: Our results suggest that long-term balancing selection on disease resistance genes may havemaintained ancestral haplotypes across different geographical lineages, and unequal sorting of balancedpolymorphisms may have generated genomic regions with elevated divergence. This study highlights theimportance of ancestral balanced polymorphisms as crucial components of genome-wide variation.
Keywords: Genomic diversity, Ancestral polymorphism, Balancing selection, Speciation
BackgroundHow evolutionary processes drive genetic divergenceand eventually lead to speciation is a fundamental ques-tion in evolutionary biology [1]. Taking advantage ofnext-generation sequencing technologies, heterogeneousgenomic variation has been documented in many species
[2–8], but disentangling factors shaping genomic land-scapes remain challenging [9].Balancing selection maintains multiple advantageous
polymorphisms in populations and increases genetic diver-sity [10]. In contrast, positive and purifying selection favorsingle advantageous alleles and reduce genetic diversity [11,12]. Balancing selection can persist for many generations,and maintains ancient polymorphisms in nascent speciespairs, resulting in genomic regions with increased nucleo-tide diversity (π) in descendant species and low relativedivergence (FST) between species [13]. Alternatively, when
© The Author(s). 2019 Open Access This article is distributed under the terms of the Creative Commons Attribution 4.0International License (http://creativecommons.org/licenses/by/4.0/), which permits unrestricted use, distribution, andreproduction in any medium, provided you give appropriate credit to the original author(s) and the source, provide a link tothe Creative Commons license, and indicate if changes were made. The Creative Commons Public Domain Dedication waiver(http://creativecommons.org/publicdomain/zero/1.0/) applies to the data made available in this article, unless otherwise stated.
* Correspondence: [email protected]; [email protected] Laboratory of Plant Resources Conservation and Sustainable Utilization,South China Botanical Garden, Chinese Academy of Sciences, Guangzhou510650, China2Department of Biology, Duke University, Box 90338, Durham, NC 27708, USAFull list of author information is available at the end of the article
Wang et al. Genome Biology (2019) 20:126 https://doi.org/10.1186/s13059-019-1729-9

selection varies geographically, it may favor locally adaptedalleles in the nascent lineages [13]. In this case, ancestralbalanced polymorphisms could be sorted unequally acrossdescendant lineages by selection, generating genomic re-gions with both elevated FST and absolute divergence (dXY)[3, 7, 13]. Divergent sorting of ancient polymorphisms alsocould be facilitated by enhanced genetic drift as a conse-quence of population bottlenecks during speciation. Otherprocesses can also generate highly differentiated regions(Table 1). During the process of isolation-with-migration,divergence might initiate in the regions with reduced geneflow and further extend to the surrounding areas due tothe linked selection, resulting in genomic islands with ele-vated divergence (both FST and dXY) [3, 8, 11, 13]. Alterna-tively, forces such as background selection and recurrentselective sweeps tend to reduce genetic diversity in regionsof low recombination, leading to elevated FST butunchanged or decreased dXY [2, 4–6, 11]. These processesare difficult to discriminate because they are not mutuallyexclusive and could cause similar patterns in the genome(Table 1) [9]. Additionally, genetic drift and demographicprocesses may also be responsible for observed peaks ofgenomic diversity/divergence, mimicking the patterns pro-duced by selection [14]. Therefore, inferring the evolution-ary mechanisms that influence genomic landscapesrequires detailed information on the speciation history andcomparisons of lineages with contrasting divergence levelsand geographic distribution [9].Boechera stricta (Brassicaceae), a perennial relative of
Arabidopsis thaliana, is native to largely undisturbed sitesin western North America [15–17]. Previous studies iden-tified two subspecies (EAST and WEST) of B. stricta, withfurther subdivision within the EAST subspecies [18–21].While genetic variation within subspecies is driven by geo-graphic isolation [20], the divergence between EAST andWEST is significantly influenced by ecological adaptation[20]. These subspecies occupy different habitats, andWESTERN genotypes are typically found in sites with moreconstant and abundant water supply, suggested that localwater availability may be the selective force underlying
ecological speciation between EAST and WEST subspecies[20]. In addition, greenhouse experiments revealed pheno-logical and morphological traits under divergent selectionbetween subspecies [19], and an EAST-WEST recombinantinbred line population segregates for many quantitativetrait loci (QTLs) for ecologically important traits, includ-ing flowering time, herbivore resistance, fecundity, andlifetime fitness [21–24], which may have contributed toincipient ecological speciation in B. stricta. These charac-teristics, along with the sequenced genome [21], facilitatepopulation genomic studies in B. stricta to understandhow complex evolutionary forces drive divergence andspeciation.To understand how different evolutionary processes
contribute to current genomic variation, we re-sequenced the whole genomes of 517 B. stricta acces-sions representing much of the species range. First, weinvestigated the population structure and history ofspecies divergence. Next, we identified the signatures oflong-term balancing selection influencing ~ 10% of thegenome. Finally, we looked for genomic regions thatdistinguish lineages and assessed the roles of differentevolutionary processes in driving divergence. Our studyprovides an example for disentangling the multitude ofevolutionary processes that may have shaped thepatterns of genetic variation across the genome and im-proves our understanding of the cause and consequenceof genomic divergence during speciation.
Results and discussionWe performed whole-genome resequencing of 517 in-bred B. stricta accessions using Illumina Hiseq2000/2500 short-read technology (Additional file 1: Table S1).Raw reads were mapped to the B. stricta reference gen-ome v1.2 [21]. After quality control, 484 accessions withmean depth 5.05× were retained for subsequent analyses(Fig. 1a; Additional file 1: Table S1). We called SNPsusing HaplotypeCaller in GATK v3.8 [25] and applied aseries of stringent filtering criteria to identify a total of 4,125,395 high-quality SNPs (see “Methods” section for
Table 1 Predicted characteristics of genomic islands of divergence under different evolutionary models
Model FST dXY Polymorphism withinpopulations
Local recombinationrate
More islandsin sympatry
Reproductive isolation, divergencewith gene flow [3, 8, 13]
Elevated Elevated No prediction No prediction Yes
Local adaptation, divergence withoutgene flow [3]
Elevated Not elevated Reduced No prediction No
Recurrent selective sweeps withinpopulations [2, 4–6, 11]
Elevated Reduced Reduced Reduced No
Background selection withinpopulations [2, 4–6, 11]
Elevated Reduced Reduced Reduced No
Sorting of ancestral balancedpolymorphisms [3, 7, 13]
Elevated Elevated No prediction Unchanged or reduced No
Wang et al. Genome Biology (2019) 20:126 Page 2 of 15

details). Comparison to Sanger sequences showed thatthe accuracy of our sequence calls exceeds 99.88%(Additional file 1: Table S2). To account for the uncer-tainty of genotypes called from short-read sequences,we estimated population genetic summary statisticsbased on genotype likelihoods as implemented inANGSD [26].
Discrete population structure and continuous geneticdifferentiationWe used Admixture [27], FastSTRUCTURE [28], sNMF[29], and NGSadmix [30] to infer individual ancestry.These four methods gave very similar results (Fig. 1b;Additional file 1: Figure S1) and detected clear popula-tion structure in B. stricta. The mode with K = 3 and 4gave the highest ΔK values (Additional file 1: FigureS2); thus, we focus our analyses on the four geneticgroups, WES, COL, UTA, and NOR (Fig. 1). With K =4, we assigned each individual to one of the four groupsif more than 50% of its genetic ancestry derived fromthe corresponding cluster (Fig. 1a; Additional file 1:Table S1). Seventeen individuals not matching this cri-terion were classified as “Admixed.” The four geneticgroups showed a clear geographical distribution pattern
(Fig. 1a). There is a little overlap among the groups,although NOR and WES have an area of sympatry inMontana and Idaho [21]. A principal component ana-lysis (PCA) and a neighbor-joining (NJ) tree furtherconfirmed the four genetic groups (Fig. 1c, d). High dif-ferentiation was detected among these four groups(Additional file 1: Table S3), similar to previous esti-mates based on microsatellite and low-copy nuclearDNA sequences [17, 18].Genetic diversity in B. stricta consists not only of
clusters, but also clines. Within groups, the geographicdistribution of genetic variation is generally consistentwith isolation by distance (IBD) models. We found sig-nificant correlations between pair-wise genetic dis-tance and geographical distance within each group(r = 0.19–0.36, P = 0.0001–0.0023, 10,000 permutationsin Mantel test; Additional file 1: Table S4), but the pat-tern of IBD varied among the groups (Additional file 1:Table S4), indicating different colonization or migra-tion histories of these groups. In conclusion, we foundboth discrete population structure and continuous pat-terns of genetic differentiation in B. stricta; similarpatterns have also been reported in humans [31] andA. thaliana [32].
COL
UTA NOR
WES
Admixed
A
C
B
D 120o W 115o W 110o W 105o W
48o N
46o N
44o N
42o N
40o N
38o N
36o N
-0.1
0
-0.
05
0.
00
0.
05
0.1
0
WESUTANORCOLadmix
PC1 (29.9%)
PC2
(28.
9%)
-0.10 -0.05 0.00 0.05
-0.0
5
0.0
0
0
.05
WES COL UTA NOR Admixed
WESUTANORCOLadmix
PC2 (28.9%)
PC3
(18.
4%)
-0.05 0.00 0.05
WES COL UTA NOR Admixed
WESUTANORCOLadmix
WES COL UTA NOR Admixed
WES UTA NOR COL Admixed
K = 2
K = 3
K = 4
(79) (157) (126) (105) (17)
Fig. 1 Geographic distribution and population structure. a Geographic distribution of the 484 Boechera stricta accessions. Each individual wasassigned into one of the four genetic groups, WES (blue), COL (red), UTA (light blue), and NOR (gold), as well as Admixed (gray). b Populationstructure of B. stricta inferred by Admixture. Each vertical bar represents an individual, with different colors representing one of the geneticancestries. The number of individuals in each lineage is also shown. K represents the number of structure groups for each analysis. c Geneticprincipal component analysis (PCA) of B. stricta based on genome-wide SNPs. Percent variation explained by each component is shown inparentheses. d Neighbor-joining (NJ) tree based on SNP data. Color scheme for genetic groups is the same in a–d
Wang et al. Genome Biology (2019) 20:126 Page 3 of 15

Population demographyRecent divergence and long-term small effective populationsize of B. strictaEstimates of demographic history and gene flow pro-vide a sketch of population history and enable demo-graphically informed simulations of population geneticvariation under the assumption of selectively neutralevolution. Accordingly, we inferred the past demo-graphic history of B. stricta from the joint sitefrequency spectrum (SFS) using coalescent simulationin fastsimcoal2 v.2.6.0.3 [33]. To avoid biases when de-termining the ancestral allelic states, we generatedfolded SFS following Excoffier et al. [33]. We used onlyfourfold degenerate sites and intergenic regions, as theyare less affected by selection. Also, we removed thesites within the three genomic regions showing evi-dence of long-term balancing selection (see the “Balan-cing selection in B. stricta genomes” section). Fourteendemographic models were evaluated, considering a var-iety of scenarios for gene flow and population sizechanges (Additional file 1: Figure S3). The best-fitmodel (Model-11, Akaike’s weight of evidence ≈ 1, Add-itional file 1: Table S5) was a four-population isolation-with-migration model, where each group experiencedtwo steps of population size changes after splitting(Fig. 2a; Additional file 1: Figure S4). By using a gener-ation time of 2 years and mutation rate of 7 × 10⁻⁹ sub-stitutions per site per year [34], we estimated the modelparameters and their associated 95% confidence inter-vals (CIs) based on 100 parametric bootstraps (Add-itional file 1: Table S6). Notably, mutation rate andgeneration time are difficult to estimate and may vary
over space and time. Consequently, inferred times andpopulation sizes would need to be revised if these esti-mates were inaccurate.In this best-fit model, the estimated divergence time
between the two subspecies (WES group and ancestorof three EAST subspecies groups) was ~ 179 thousandyears ago (KYA; 95% CI = 154–185 KYA), and diver-gence within the EAST subspecies dates to 30–70 KYA(Fig. 2a; Additional file 1: Figure S4; Additional file 1:Table S6). Historical effective population size (Ne) wassmall in B. stricta; the estimated Ne values for thecommon ancestor of all groups, ancestor of EAST sub-species, and ancestor of UTA and NOR are 2.4 × 104,3.6 × 104, and 3.9 × 10⁴, respectively. After splitting,the WES and NOR groups both had small initial pop-ulations (Ne = 1.9 × 10⁴ and 1.1 × 10⁴, respectively)comparable with their ancestors, while the COL andUTA groups had relatively larger initial populations(Ne = 1.0 × 10⁵ and 1.1 × 10⁵, respectively). The long-term small effective population sizes of WES andNOR are consistent with the relatively high level oflinkage disequilibrium (LD) (Additional file 1: FigureS5) and low level of nucleotide diversity in these twogroups (Additional file 1: Table S7). All groups expe-rienced rapid population expansion at ~ 12 KYA andmore recent exponential growth starting at ~ 7.7 KYA(CI = 5.0–9.7 KYA). Inferred gene flow was lowamong the groups (per generation migration rate =6.8 × 10⁻¹⁰–2.0 × 10⁻⁵; Additional file 1: Table S6),which is expected given frequent inbreeding [17], lowseed dispersal, and substantial geographic distances inB. stricta [15].
A B
NOR UTA COL WES
Past
Present
180
80
60
40
20
Tim
e (K
YA
) 100
Eff
ectiv
e po
pula
tion
size
(10
3 )
Time (KYA) 5 10 20 50 100 200 500
5
10
2
0
50
1
00
200
5
00 1
000
WES COL UTA NOR
Fig. 2 Demographic histories of B. stricta. a Schematic representing divergence processes inferred by fastsimcoal2. Estimated divergence time,population size, and gene flow are indicated here and detailed in Additional file 1: Figure S4 and Tables S6. b Changes of effective populationsize through time in the four groups. Solid lines represent means, and shading represents 95% percentiles of estimates. Vertical dashed lines marktimes of population divergence and expansion estimated by fastsimcoal2
Wang et al. Genome Biology (2019) 20:126 Page 4 of 15
Validation of demographic inferenceEvaluating null hypotheses of neutral evolution requiresrealistic population models, so we used two approachesto validate our demographic inferences. First, we evalu-ated the goodness-of-fit of the best model by comparingSFS and two summary statistics (π and FST) betweenobserved and simulated data. We found that SFS andsummary statistics predicted under neutrality are well-matched to the data (Additional file 1: Figure S6). Sec-ond, to avoid limitations of model-based demographicinference, we also employed a model-flexible Stairwayplot v.2 [35] method to investigate the recent fluctuationof Ne, based on the folded SFS. In general, these resultsare consistent with those from fastsimcoal2. Allgroups showed lower ancestral population size (1 ×10⁴–2 × 10⁴) and recent population expansions within15 KYA (Fig. 2b). In summary, validation analysessuggested that the best-fit model captures major as-pects of the demographic history of our populations
from patterns of genetic diversity. We applied thismodel in testing the significance of the outliers insubsequent analyses.
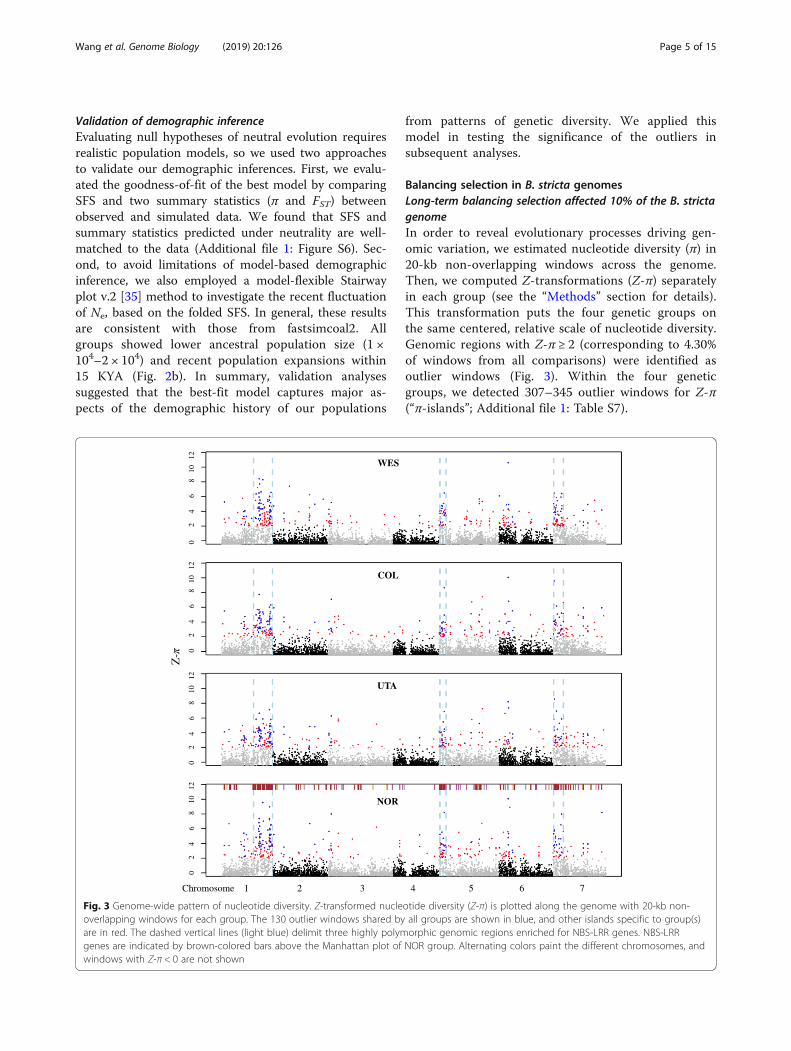
Balancing selection in B. stricta genomesLong-term balancing selection affected 10% of the B. strictagenomeIn order to reveal evolutionary processes driving gen-omic variation, we estimated nucleotide diversity (π) in20-kb non-overlapping windows across the genome.Then, we computed Z-transformations (Z-π) separatelyin each group (see the “Methods” section for details).This transformation puts the four genetic groups onthe same centered, relative scale of nucleotide diversity.Genomic regions with Z-π ≥ 2 (corresponding to 4.30%of windows from all comparisons) were identified asoutlier windows (Fig. 3). Within the four geneticgroups, we detected 307–345 outlier windows for Z-π(“π-islands”; Additional file 1: Table S7).
WES
COL
UTA
NOR
Z-
Chromosome 1 2 3 4 5 6 7
0
2
4
6
8
1
0 1
2
0
2
4
6
8
1
0 1
2
0
2
4
6
8
10
12
0
2
4
6
8
10
12
Fig. 3 Genome-wide pattern of nucleotide diversity. Z-transformed nucleotide diversity (Z-π) is plotted along the genome with 20-kb non-overlapping windows for each group. The 130 outlier windows shared by all groups are shown in blue, and other islands specific to group(s)are in red. The dashed vertical lines (light blue) delimit three highly polymorphic genomic regions enriched for NBS-LRR genes. NBS-LRRgenes are indicated by brown-colored bars above the Manhattan plot of NOR group. Alternating colors paint the different chromosomes, andwindows with Z-π < 0 are not shown
Wang et al. Genome Biology (2019) 20:126 Page 5 of 15

Among these outlier windows, 130 were shared by allgroups (henceforth referred to as shared outliers; Fig. 3),which could be generated by shared evolutionary forcesinfluencing particular genomic regions. These π-islandswere unevenly distributed in the genome and clusteredinto three genomic regions. These three regions werehenceforth referred to as “Balancing selection (BLS) re-gions” (Fig. 3; see the “Methods” section for delimitingthe BLS regions). BLS regions, with a total length of ~20Mb (~ 10% of the 196.5Mb assembled genome) [21],contain about half of the π-islands (46–49%) including91 (70%) shared outliers (Additional file 1: Table S8).All three BLS regions showed nucleotide diversity
2.57–3.88 times higher than the genomic background(P < 10−5, randomization test; Additional file 1: Table S9). Comparison of demographically informed neutral sim-ulations with observed molecular variation suggests thatnon-neutral evolutionary processes have contributed tothe elevated diversity in these regions (Additional file 1:Figure S7). The high diversity in BLS regions could bemaintained by long-term balancing selection [10], butcould also be due to the systematic variation in mutationrate, recombination rate, or gene density [12]. Wechecked each of these possible influences. First, to cor-rect for variation in mutation rate among genomic re-gions, we divided diversity by divergence to an outgroupspecies, Boechera retrofracta [21, 36]. These outgroup-adjusted diversity levels are still higher in the BLS re-gions compared to genomic background (P < 10−5,randomization test; Additional file 1: Table S9). There-fore, the high diversity in genomic islands is not attribut-able to the elevated mutation rates. Second, to assess theimpact of recombination rate on genetic diversity, we es-timated the population-scaled recombination rate (ρ =4Nec) in 20-kb windows across the genome using LDhel-met [37]. Following Wang et al. [4], we divided ρ by gen-etic diversity (π) to account for the confounding effectsof local Ne and compared scaled ρ (ρ/π) between theBLS regions and the rest of the genome. Relative to thegenomic background, we found similar recombinationrate in the BLS regions of groups WES and NOR (scaledρ: 0.25–0.29 vs. 0.24, F3,7221 = 1.03, P = 0.377 in WES;0.16–0.26 vs. 0.36, F3,6676 = 2.42, P = 0.064 in NOR) butsignificant higher and lower recombination in the BLSregions of groups COL and UTA, respectively (scaled ρ:0.73–0.90 vs. 1.15, F3,7198 = 5.76, P = 0.0006 in UTA;0.77–1.13 vs. 0.59, F3,7287 = 34.77, P < 0.0001 in COL;Additional file 1: Table S10). It is possible that otherhistorical factors, such as population structure, mightexplain the patterns in COL and UTA. For example, weestimated the recombination rate in each subgroup ofCOL and found similar estimates of scaled ρ betweenthe BLS regions and background in one subgroup withlow differentiation (0.64–0.81 vs. 0.65, F3,7233 = 2.25, P =
0.080; Additional file 1: Table S10). To further evaluatethe effects of recombination rate on genetic diversity, wesimulated a variety of recombination rates from 0 to250 cM/Mb. We found that estimated diversities in allsimulated data were significantly lower than the observa-tions in the BLS regions (W ranges from 22,399,000 to45,812,000, P < 2e−16, Mann-Whitney U test; Add-itional file 1: Figure S7). These results suggest that therecombination rate might have a little effect on the pat-terns of nucleotide diversity in B. stricta. A previousstudy in A. thaliana also revealed that regions collinearto these BLS regions showed recombination rates closeto the genome-wide average [38]. Third, we comparedgene density (mean length of coding sequences per 20-kb window) in outlier windows versus genome-wide.Gene density in two (LG1p and LG7p) of the BLS re-gions is slightly lower than the genomic background(3.93 kb vs. 4.56 kb, P < 0.001 for LG1p; 3.73 kb vs. 4.56kb, P = 0.0016 for LG7p; randomization test; Add-itional file 1: Table S9) but is not different from the gen-omic background in LG5p (P = 0.253, randomizationtest; Additional file 1: Table S9). Additionally, controllingfor recombination rate and gene density, the scaled di-versity in the BLS regions is still higher than the gen-omic background (F1,6217–6998 = 307.12–1525.90, P <2e−16; Additional file 1: Table S11). These results suggestthat a high recombination rate or low gene density isunlikely to generate genomic islands of high diversity.Therefore, our results suggest that these regions reflectlong-term balancing selection [10]. The hypothesis oflong-term balancing selection was also supported by anexcess of intermediate-frequency alleles (higher Tajima’sD, and Fay and Wu’s H) and lower population differenti-ation (FST) in the BLS regions compared to the genomicbackground (Additional file 1: Table S9). In comparisonwith genome-wide averages, these regions showed higherabsolute divergence (dXY) and also relative node depth(RND [39]; Additional file 1: Table S9), which takes intoaccount varied mutation rate across the genome by div-iding dXY of each group pair with their mean divergenceto an outgroup species, B. retrofracta. These results mayreflect higher levels of ancestral polymorphism prior tothe split of these groups [11].
Long-term balancing selection in disease resistance genesPlant disease resistance genes, such as nucleotide-bindingsite-leucine-rich repeat (NBS-LRR) gene family, can be tar-gets of balancing selection, and genetic variation in thesegene regions could be maintained for long periods by tran-sient or frequency-dependent selection [40]. While NBS-LRR genes have not been functionally characterized in B.stricta, previous studies have found several NBS-LRR genesunder balancing selection in closely related species, e.g., A.thaliana [41, 42] and Capsella [43]. In the B. stricta
Wang et al. Genome Biology (2019) 20:126 Page 6 of 15

genome [21], we identified 378 genes that were homolo-gous to members of NBS-LRR gene family of A. thaliana[44], with 277 (60%) of them located in the BLS regions—asixfold enrichment of NBS-LRR in BLS regions (Add-itional file 1: Table S8). Strong positive correlations (Spear-man’s ρ = 0.19–0.41, P < 0.001; Additional file 1: Figure S8)between density of NBS-LRR genes and scaled diversitysuggest long-term balancing selection on NBS-LRR genesand may have maintained genetic diversity in BLS regions.To avoid ambiguous alignments due to rapid evolution ofNBS-LRR genes [44], we excluded NBS-LRR gene regions(4.8% of the three genomic regions) from the data analysis.Genetic diversity in the BLS regions is elevated, even whenNBS-LRR genes themselves have been removed (Add-itional file 1: Figure S9). Removing π-islands with lowercoverage depth from BLS regions also did not change ourconclusions (Additional file 1: Table S9). These results sug-gest that the high variation was not due to the read-mapping errors in paralogous loci or highly polymorphicregions. Rather, historical balancing selection could act onNBS-LRR genes and maintain ancestral haplotypes withsimilar frequency in different geographical lineages of B.stricta. The high diversity in the BLS regions after exclud-ing NBS-LRR genes suggested that intergenic regionslinked to these genes were affected by selection. The aver-age length of affected haplotypes is ~ 72 kb (20Mb dividedby 277 genes), much longer than the level of LD in thisspecies (Additional file 1: Figure S5). Future studies, takingadvantage of long-read sequencing technologies and func-tional genomic analyses, can reconstruct the ancient haplo-types and examine candidate selected genes.An early population genomic study in A. thaliana found
that regions syntenic to these BLS regions also show en-richment for NBS-LRR genes and elevated nucleotidepolymorphism [45] (also see Additional file 1: Figure S10).This suggests that variation in the BLS regions may havebeen shaped by balancing selection over millions of yearssince these genera diverged [46].
Sorting of ancient polymorphisms in divergence islandsBalanced polymorphisms in ancestral populations couldbe maintained by long-term balancing selection duringspeciation, generating genomic regions with increasedgenetic diversity within and among daughter populations[10]. Also, ancient polymorphisms could be partitionedamong descendant lineages, resulting in genomic regionswith increased divergence. To look for genomic regionswith elevated divergence among groups, we estimatedWeir and Cockerham’s weighted FST in 20-kb non-overlapping windows across the genome and computedZ-transformed FST (Z-FST) scores separately in eachgroup pair [3]. Because the BLS regions were underlong-term balancing selection, they were excluded fromthe data analyses in this section. Genomic regions with
Z-FST ≥ 2, corresponding to 3.04% of windows from allcomparisons, were identified as outlier windows (“FST-islands”; Fig. 4). As previously found in other species [3–7], genetic divergence along the genome was highly het-erogeneous and FST-islands scattered across the genomein all group pairs (Fig. 4; Additional file 1: Figure S11).As expected, increased genome-wide differentiationobscures genomic regions with elevated divergence [5]:we detected fewer FST-islands in comparisons of moredivergent groups. For example, more than 300 islandswere observed in comparisons among groups of EAST
subspecies (e.g., COL, UTA, and NOR, FST = 0.12–0.21),but only 22 in a comparison between sympatrically dis-tributed WES and NOR groups (Additional file 1: TableS12), which showed the highest population differenti-ation (FST = 0.56; Additional file 1: Table S3). The coales-cent simulation showed that the FST values in genomicislands were significantly higher than the simulated re-sults (W ranges from 1,188,900 to 35,200,000, P < 5e−16,Mann-Whitney U test; Additional file 1: Figure S12),suggesting that neutral demographic processes cannotexplain the elevated differentiation in outlier windows.
Relative vs. absolute divergence in divergence islandsTo examine which factors have contributed to the for-mation of FST-islands [3, 11, 13], for each group pair, wecompared the level of dXY and RND in islands versus thegenomic background. We found that both mean dXY andmean RND were significantly higher in FST-islands of allgroup pairs (P < 10−5, randomization test; Fig. 4; Add-itional file 1: Table S3), suggesting the elevated dXY ingenomic islands was not due to the increased substitu-tion rates. Elevated levels of both relative divergence(FST) and absolute divergence (dXY) in FST-islands arecompatible with a model in which these islands were de-rived from divergent sorting of ancient polymorphisms[13, 21]. Consistent with this hypothesis, the coalescenttime between the most divergent haplotypes in genomicislands was ~ 1 million years ago, which is much earlierthan the split of B. stricta groups (Additional file 1: Fig-ure S13). Alternatively, the FST-islands also could resultfrom differential gene flow among genomic regions, i.e.,restricted gene flow in islands versus high gene flowelsewhere in the genome [11]. Under this alternative hy-pothesis, FST-islands would be more pronounced in sym-patric group pairs, since gene flow could be higher thanfor allopatric groups. In contrast, dXY was significantlyhigher in FST-islands of both sympatric and allopatricgroup pairs, and the sympatric group pair (WES andNOR) showed the highest FST and the lowest number ofFST-islands among comparisons (Additional file 1: TablesS3 and S12). This indicates low gene flow between EAST
and WEST subspecies in their zone of sympatry. Coales-cent simulation supported a model with low gene flow
Wang et al. Genome Biology (2019) 20:126 Page 7 of 15

among the groups (Fig. 2; Additional file 1: Figure S4;Additional file 1: Table S6), in agreement with the highinbreeding coefficient [17] and low seed dispersal of Boe-chera [15]. The geographically isolated distribution of B.stricta groups (except WES and NOR) together with thelow frequency of stricta × stricta admixed genotypes,also suggest that gene flow has been limited among thegroups. Therefore, our observations indicate thatreduced levels of recent gene flow are unlikely to be animportant contributor to the formation of FST-islands inB. stricta.We further tested whether FST-islands could be due
to the ongoing background selection or recurrent se-lective sweeps. These two processes tend to reducegenetic polymorphism and to elevate FST in low-recombination regions [11], so we compared the re-combination rate between FST-islands and the rest ofthe genome and tested the correlation between differ-entiation (FST and dXY) and recombination in FST-
islands. Among the 12 comparisons (four group pairs,each containing two tests for two groups), only twocomparisons showed a significant lower recombinationin FST-islands than in background (0.668 vs. 1.037, P =0.031; 0.718 vs. 0.901, P < 0.001; randomization testwith Bonferroni correction; Additional file 1: Table S3). Thus, FST values in FST-islands are significantly higherthan background after controlling for recombinationand/or gene density (F1,6126–6820 = 86.43–5123.27, P <2e−16; Additional file 1: Table S13). For regressiontests, we found two significantly negative relationshipsout of 12 comparisons. It is possible that other histor-ical factors, such as demographic history, might ex-plain this pattern (Additional file 1: Figure S14).Additionally, if FST-islands were mainly produced bybackground selection or recurrent selective sweeps,dXY within islands would be decreased or unaffected[3, 11], which is inconsistent with our observation ofelevated dXY in genomic islands.
Z-F
WES vs. COL
WES vs. NOR
WES vs. UTA
COL vs. NOR
COL vs. UTA
UTA vs. NOR
FST
Den
sity
A B
Chromosome 1 2 3 4 5 6 7 d X
Y
C
4
l l l
0 2
4
6
0
2 4
6
0
2
4 6
0
2
4
6
0 2
4
6
0 2
4
6
0.0 0.2 0.4 0.6 0.8 1.0
0
2
4
6
8
WES vs. COL WES vs. NOR
WES vs. UTA COL vs. NOR
COL vs. UTA
UTA vs. NOR
0
0
.004
0
.008
0
.012
ST
Fig. 4 Heterogeneous genetic divergence along the B. stricta genome. a Manhattan plot of Z-transformed FST (Z-FST) in 20-kb non-overlappingwindows for six group pairs. Alternating colors paint the different chromosomes, and the genomic islands of divergence are shown in red.Windows with low differentiation (Z-FST < 0) are not shown. The vertical lines (light blue) mark the three highly polymorphic genomic regions(see Fig. 3) that were not included in FST analyses. b) Kernel distribution of genome-wide differentiation (FST) for six group pairs. c Box plot ofabsolute divergence (dXY). In each of the six group pairs, mean dXY values in genomic islands (blue) are significantly higher than those in genomicbackground (red) (P < 10−5, randomization test). In these box plots, the median is shown by a horizontal line, while the bottom and top of eachbox represents the first and third quartiles. The whiskers extend to 1.5 times the interquartile range. Outliers are not shown in the plot
Wang et al. Genome Biology (2019) 20:126 Page 8 of 15
Positive selection in divergence islandsWithin groups, FST-islands showed low nucleotide diver-sity (π), excess of low frequency alleles (more negativeTajima’s D) ,and high-frequency derived alleles (morenegative Fay and Wu’s H) in one or both groups of eachcomparison (P < 10−5, randomization test; see details inAdditional file 1: Table S3), consistent with positive se-lection in these regions. It has been found that ancientpolymorphisms under long-term balancing selection alsocould be under recent positive selection and promoteadaption of humans to local environments [47]. To fur-ther infer possible functional influences, we conductedGene Ontology (GO) analyses of these genomic islands.Comparisons showed that multiple GO categories withimportant metabolic processes and molecular functions(e.g., sucrose metabolic processes, catalytic activity) wereoverrepresented for genes located in genomic islands(Additional file 1: Table S14), suggesting a diverse set ofgenes and functional categories may have contributed toadaptive evolution of B. stricta.
ConclusionsWe used population genomic analyses to track the diver-gence processes of B. stricta and to investigate the evo-lutionary forces that have shaped diversity within thisspecies. We found that four genetic groups in B. strictadiverged during the Late Pleistocene. Our results suggestthat long-term balancing selection on disease resistancegenes may have maintained ancestral haplotypes acrossdescendent lineages, resulting in elevated genetic diver-sity in three genomic regions comprising 10% of thegenome. We further demonstrate that genomic regionswith elevated divergence (FST-islands) among the fourlineages may be derived from divergent sorting ofancient polymorphisms, instead of heterogeneous geneflow or recurrent selective sweeps. These findingsprovide evidence that elevated genetic diversity due tobalancing selection also may increase population differ-entiation by sorting balanced polymorphisms during di-vergence processes. This study highlights the importanceof ancestral balanced polymorphisms as crucial constitu-ents of genome-wide variation and incipient speciation.
MethodsSample collection, whole-genome sequencing, mapping,and SNP callingWe analyzed 517 B. stricta accessions across the speciesrange in the western USA (Fig. 1; Additional file 1: TableS1). These accessions are part of the B. stricta ReferencePanel, available from the Arabidopsis Biological ResourceCenter. All accessions have the common, non-invertedhaplotype on chromosome 1 [21]. Seeds were germi-nated and grown in the greenhouse for one generationto produce self-pollinated seeds for this study. Following
the protocol of Lee et al. [21], we extracted genomicDNA of each accession from ~ 0.1 g young leaf tissuesusing Qiagen DNeasy Plant Mini kits (Qiagen, Hilden,Germany) and measured the concentration using aQubit fluorometer (Invitrogen, Carlsbad, CA, USA).Paired-end sequencing libraries were prepared for each
sample, and the sequencing was carried out on theIllumina HiSeq 2000/2500 platform at the Joint GenomeInstitute (JGI). Plate-based DNA library preparation forIllumina sequencing was performed on the PerkinElmerSciclone NGS robotic liquid handling system usingKAPA Biosystems Library Preparation Kit. About 200 ngDNA was sheared to 475–600 bp using a Covaris LE220Focused-ultrasonicator. The sheared DNA fragmentswere size selected by double-SPRI, and then the selectedfragments were end-repaired, A-tailed, and ligated withIllumina compatible sequencing adaptors from IDT con-taining a unique molecular index barcode for each sam-ple library. The prepared libraries were quantified usingKAPA Biosystem’s next-generation sequencing libraryqPCR kit and run on a Roche LightCycler 480 real-timePCR instrument. The quantified libraries were then mul-tiplexed with other libraries, and the pool of librarieswas then prepared for sequencing on the Illumina HiSeqsequencing platform utilizing a TruSeq paired-end clus-ter kit and Illumina’s cBot instrument to generate a clus-tered flowcell for sequencing. Sequencing of the flowcellwas performed on the Illumina HiSeq2000/2500 sequen-cer using a TruSeq SBS sequencing kit, following a 2 ×100 or 2 × 150 indexed run recipe.We used trimmomatic v0.36 [48] to remove adapter
sequences and trim bases from both ends of reads whenthe base quality was < 30. After trimming, reads < 36 bpwere discarded. We then aligned high-quality reads ofeach genotype to the B. stricta reference genome v1.2 [21]with BWA [49]. We used GATK v3.8 [25] for base qualityrecalibration, indel realignment, and simultaneous SNPand indel discovery via HaplotypeCaller. After that, geno-types (in gVCF files) of all individuals were joined togetherby using the default hard filtering parameters as pre-scribed by GATK v3.8 best practices. Only sites with map-ping quality ≥ 30 and base quality ≥ 30 were consideredfor calling variants in HaplotypeCaller.
SNP filtering and validationAs some analyses required called genotypes, we usedstringent filtering criteria to minimize false positivesfrom SNP and genotype calls and further validated theaccuracy of variant calling. We used the following filter-ing criteria: (1) homozygous genotypes were assigned asmissing if supported by less than two reads; (2) heterozy-gous genotypes were assigned as missing if supported byless than 20 reads or reference ratio (number of readssupporting reference allele/number of reads supporting
Wang et al. Genome Biology (2019) 20:126 Page 9 of 15

alternative allele) < 0.25, or > 0.75; and (3) SNPs werediscarded if they met any one of the following criteria:genotyped in fewer than 50% of individuals, mean depth> 20, more than one variant allele was observed, siteswhere the proportion of heterozygous genotypes was >15% (B. stricta is predominantly inbred; hence, highheterozygosity may indicate paralogous loci), or if refer-ence or variant alleles were indels. We further removed20 samples with missing rate > 0.60, five duplicatedsamples from the same inbred family, six samples withdivergent morphology or identified as outliers by PCA,and two samples without geographical information(Additional file 1: Table S1). Finally, we retained 4,125,395 high-quality SNPs and 484 genotypes for the fol-lowing analyses.To gain insight into the variant calling and genotype
accuracy, we compared individual genotypes from thisre-sequencing dataset with genotypes from 129 loci(total 71 kb) previously assayed by Sanger sequencing[18, 50]. Twenty-one inbred lines sequenced by bothIllumina and Sanger methods were used for this com-parison (Additional file 1: Table S2). Each genotype of21 individuals (sequenced at depth 2.7–5.8×) inferred byGATK was compared to the Sanger-sequenced onesfrom the same inbred lines. Genotypes from the re-sequencing data identical to the genotypes from theSanger dataset were considered as true positives, andconflicting genotypes were considered as false. 99.89% ofgenotypes from the re-sequencing data are identical togenotypes from the Sanger dataset, indicating that highconfidence SNPs were genotyped in our dataset.To further monitor the accuracy of genotypes over dif-
ferent coverage depths, we downloaded reads of two ge-notypes that were sequenced at very high depth, ~ 400×(Accession LTM, the genotype used for the referencegenome) and ~ 170× (SAD12, referred to as RP067 inthis study) [21]. Next, we randomly downsampled thesedatasets to sub-datasets with depth from 1 to 40× (Add-itional file 1: Table S15). SNPs were called and filteredfrom these sub-datasets using the same pipelines asdescribed above. For LTM, we compared genotype callsfrom sub-datasets with different depths to the referencegenome. True positives (TP) are positions identical tothe reference, false heterozygotes (FHET) are positionscalled as heterozygous genotypes (all sites are called ashomozygotes in the reference genome), false homozy-gotes (FHOM) are positions called as homozygous geno-types but different from the reference, and missing SNPs(MISS) are non-genotyped sites. For SAD12, we com-pared genotypes called from each sub-dataset to thosecalled from the highest depth data (~ 170×). True posi-tive sites (TP) are defined as positions identical betweenlow- and high-depth datasets; false heterozygotes(FHET) are positions different between datasets, with at
least one heterozygote called; false homozygotes (FHOM)are positions called as different homozygotes betweendatasets; and missing SNPs (MISS) are sites genotyped inhigh-depth data but not called in low-depth data. For bothLTM and SAD12, the true positive rate (TPR) is definedas TP/(TP + FHET + FHOM), false discovery rate (FR) isdefined as (FHET + FHOM)/(TP + FHET + FHOM), andmissing rate (MR) is defined as MISS/(TP + FHET +FHOM+MISS). High TPR was found in LTM (99.90–99.51%) and SAD12 (98.75–99.82%) datasets withdifferent depths (Additional file 1: Table S15). It is not sur-prising to see high accuracy of called genotypes based onrelative low sequencing depth (5.05×) in B. stricta, becauseit is an inbreeding species with extremely low heterozy-gous rate [17, 21]. A similar result was reported in A.thaliana, another inbreeding species [32].
Population structureTo investigate population structure in B. stricta, we (1)conducted admixture analyses using Admixture v1.3.0[27], FastSTRUCTURE v1.0 [28], sNMF [29], andNGSadmix [30]; (2) performed principal componentanalysis (PCA) with EIGENSOFT v6.0 [51]; and (3) con-structed neighbor-joining (NJ) trees using MEGA v7[52] with 1000 bootstrap samples. We ran Admixture,FastSTRUCTURE, sNMF, and NGSadmix with K valuesranging from 1 to 10 and repeated the process 20 timeswith different seeds. The best K (i.e., the number of puta-tive populations) was chosen by the ΔK method [53]. Atenfold cross-validation procedure and a cross-entropycriterion were also used for evaluating the runs with dif-ferent K values in Admixture and sNMF, respectively.Genotype likelihoods estimated by ANGSD [26] wereused as input for NGSadmix, and genotypes called byGATK were used for other methods. For population struc-ture analyses, we discarded SNPs with missing rate > 20%and minor allele frequency (MAF) < 5%. We also excludedhighly correlated SNPs by performing an LD-based SNPpruning process in PLINK v1.90 [54]. To do this, wescanned the genome with sliding windows of 50 SNPs insize, advancing in steps of five SNPs, and removed anySNP with a correlation coefficient > 0.2 with any otherSNP within the window. This yielded 27,765 independentSNPs for the analyses of population structure.
Isolation by distanceTo investigate the pattern of isolation by distance in eachgroup, we calculated genetic and geographic distances be-tween each pair of genotypes and tested the correlation ofgenetic and geographic matrices by Mantel test with 10,000permutations (permuting rows and columns) implementedin the R package VEGAN [55]. We further quantified thestrength of the IBD in each group. To account for unevensampling, we grouped genotype pairs into sequential 10 km
Wang et al. Genome Biology (2019) 20:126 Page 10 of 15

bins (e.g., 0–10 km, 10–20 km) and calculated meangenetic distance from all genotype pairs in each bin. Afterthat, we fit a weighted linear regression by considering thenumber of genotype pairs in each bin and calculated theslope and intercept of genetic distance against geographicdistance. We discarded bins representing geographicdistance less than 20 km or larger than 120 km, due to asubstantial deviation from the regression line. We alsoremoved bins with less than 15 genotype pairs. The ratio ofincrease of pairwise diversity across geographic distancewas estimated by dividing slope by mean pairwise diversityacross all bins within 20–120 km. We estimated the stand-ard error of the ratio based on 1000 bootstraps. We alsotried 20 km bins and got very similar results (data notshown). Ten isolated WES accessions from the Washing-ton Cascades and the Sierra Nevada were excluded fromIBD analyses, because they are located far from the distri-bution center of the WES group.
Linkage disequilibriumWe estimated genome-wide LD species-wide (484 individ-uals), as well as for each group (WES, COL, UTA, andNOR). We extracted common SNPs with MAF above 0.05and calculated the mean-squared correlation (r2) for eachpair of common SNPs within 50-kb windows using plinkv1.90 [54]. The decay of LD with physical distance (bp)was estimated using nonlinear regression using Eq. 1 ofHill and Weir [56].
Population demographyFastsimcoal2 simulationWe inferred the demographic history of B. stricta byusing a coalescent simulation-based method in fastsim-coal v.2.6.0.3 [33]. We tested fourteen demographicmodels (Additional file 1: Figure S3); all models con-tained four contemporary groups and began with thesplitting of the two subspecies (WES vs. the ancestor ofother three groups), followed by splitting of COL withinthe EAST subspecies, and the final split between UTAand NOR groups. These models differed with regard to (1)whether gene flow was present among groups and (2) howpopulation size changed within groups (Additional file 1:Figure S3). Because missing data can lead to biased esti-mates of the site frequency spectrum (SFS), we performeda downsampling procedure following Thome and Carstens[57]. For each individual, we randomly chose one haplo-type, since B. stricta is a largely inbreeding species. Foreach site, we resampled (without replacement) 39, 78, 63,and 52 genotypes from WES, COL, UTA, and NORgroups, respectively, to maximize the number of segregat-ing SNPs. Sites were discarded if the sample size (non-missing genotypes) was less than the threshold in anygroup. We excluded SNPs from three genomic regionsunder long-term balancing selection (see the “Balancing
selection in B. stricta genomes” section) and only usedfourfold degenerate sites and intergenic regions, becausethey are less affected by selection. Finally, 1,455,094 SNPswere retained to estimate SFS. To minimize biases whendetermining the ancestral allelic states, we generatedfolded SFS following the methods described by Excoffier etal. [33]. For each model, we performed 50 independentruns with 100,000 coalescent simulations as well as 10–40conditional maximization algorithm cycles to find theglobal maximum-likelihood parameter estimates. The bestmodel was chosen based on Akaike’s weight of evidencefollowing Excoffier et al. [33]. To obtain the 95% confi-dence interval of the best model, we generated 100 para-metric bootstraps and estimated the parameters on eachbootstrap replicate using the same settings as for the ana-lyses of the original dataset. Generation time of 2 yearsand mutation rate of 7 × 10⁻⁹ substitutions per site peryear in A. thaliana [34] were used to convert the modelparameters to absolute values. To evaluate the goodness-of-fit of demographic models, we performed 100,000coalescent simulations under the maximum likelihoodestimates of population parameters, calculated expectedSFS, and compared with the observed SFS. We alsocompared two summary statistics (π and FST) betweensimulated and observed data.
Stairway plot analysesWe applied the Stairway plot v2 [35] method with foldedSFS (generated as for fastsimcoal2, above) to infer thehistorical changes of Ne over time in each genetic group.We used default settings to run Stairway, including 2/3of the data for training and four random break points at(nseq-2)/4, (nseq-2)/2, (nseq-2)*3/4, and nseq-2. As sug-gested by the authors, we created 200 input files usingthe provided script and estimated the median and 95%confidence interval of demographic parameters based onthese files. We converted estimates to absolute valuesbased on a generation time of 2 years and a mutationrate of 7 × 10⁻⁹ substitutions per site per year.
Genome-wide scans for regions with elevated diversityand/or divergenceWe partitioned scaffolds into 20-kb windows, and calcu-lated the sequence coverage by counting the number ofavailable sites in each window. To obtain all available sites,we used the “-allSites” argument in GATK and filterednon-segregating sites using the same quality thresholds asfor segregating sites (see the “SNP filtering and validation”section). For a window to be included in the downstreamanalyses, we required (1) at least 5000 sites left, after filter-ing steps; (2) at least 20 SNPs, for summary statisticsbased on segregating sites (e.g., Tajima’s D and FST); and(3) at least 2000 bases available from both ingroup and
Wang et al. Genome Biology (2019) 20:126 Page 11 of 15
outgroup species, for outgroup statistics requiring out-group information, such as Fay and Wu’s H and RND.
Intra-population summary statisticsFor each group of B. stricta and the species as a whole,we estimated SFS and related population genetic statis-tics using a probabilistic method implemented inANGSD v0.919 [26]. We filtered the data by (1) remov-ing reads with a minimal mapping quality of 30 andbases with a minimal quality score of 30 (-minMapQand -minQ), (2) removing sites with information fromless than 50% of individuals (-minInd), (3) removingsites with a P value higher than 1 × 10⁻⁴ (-snp_pval), (4)assigning genotypes as missing if the depth was less thantwo for an individual, and (5) removing sites that did notpass filtering criteria above (see the “SNP filtering andvalidation” section). We estimated per-individual in-breeding coefficients in ngsF-HMM [58] and incorpo-rated them into the calculation of SFS in ANGSD. Usinggenotype likelihoods based on the GATK genotypingmodel [59], we estimated folded and unfolded SFS andderived a set of population genetic summary statistics in20-kb windows. We estimated nucleotide diversity (π)and Tajima’s D on the basis of folded SFS and calculatedFay and Wu’s H from the unfolded SFS. We used B.retrofracta [21, 36] as the outgroup species to infer theancestral allelic state to estimate the unfolded SFS.
Inter-population summary statisticsWe used custom Python scripts to calculate the relativegenetic differentiation (Weir and Cockerham’s weightedFST) [60], absolute divergence (dXY) [61], and net pair-wise nucleotide divergence (da) [61] for six pairwisecomparisons among the four genetic groups (Fig. 1). Toaccount for the variable mutation rate across the gen-ome, we also estimated the relative node depth (RND)[39] by dividing dXY of each group pair with their meandivergence to an outgroup species (B. retrofracta) [21,36]. In each pairwise comparison, parameters were esti-mated on sites with at least 50% of individuals success-fully genotyped per population. For FST, we calculatedtwo variance components (the numerator and denomin-ator) for each segregating site, averaged them separately,and obtained the window-based estimates as a “ratio ofaverage” [60]. For dXY and RND, we obtained window-based values by averaging per-site estimates across allsites (both variable and monomorphic) passing the initialquality filters for each window.
Recombination rate and gene densityPopulation-scaled recombination rates (ρ = 4Nec) were esti-mated for each group using the program LDhelmet v.1.10[37]. We ran LDhelmet with default parameters (100,000burn-in iterations, 1000,000 Markov chain iterations, and a
block plenty of 50) to estimate recombination rate betweeneach pair of SNPs and then weight-averaged over each 20-kb window. We only used SNPs with MAF > 5% tominimize the effects of rare variants, and only retainedwindows with at least 10 SNPs left after filtering. Usinglookup tables with θ = 0.001 (close to estimates of genomicbackground) and θ = 0.01 (close to estimates in three gen-omic region with elevated diversity) yielded quantitativelyidentical results (Pearson’s correlation coefficient r = 0.999,P < 2.2e−16); thus, only the results based on θ = 0.001 werereported. To account for the influence of effective popula-tion size on estimated ρ, we divided ρ by diversity (π) ineach 20-kb window following Wang et al. [4] and com-pared ρ/π between islands and the rest of the genome.Gene density was estimated as the total length of codingsequences within each of the 20-kb windows.
Outlier screenTo identify the genome regions with elevated diversity (π),we standardized π in each group for each window andidentified high-diversity windows with Z-π ≥ 2 (π-island,corresponding to 4.30% of windows from all comparisons).Following the same procedure, we standardized per-win-dow FST in each pair of groups to a Z-score based on theformula Z-FST = (FST × FST′)/std-FST [3], where FST is a per-window estimate, and FST′ and std-FST are the mean andstandard deviation of FST across windows. We excluded theBLS regions from the analyses because they show evidenceof long-term balancing selection and defined windows withZ-FST ≥ 2 (corresponding to 3.04% of windows from allcomparisons) as outliers (FST-island). Based on 100,000 per-mutations, we compared genomic islands vs. genome-widebackground for possible differences in multiple summarystatistics, including recombination rate, diversity, and FST.To test whether π-islands or FST-islands could be due
to demographic processes solely, we first simulated 100,000 segments (20 kb each, the same size as the windowsused to scan the genome) using demographic parametersof the best model estimated by fastsimcoal2 (see the“Population demography” section for details). We per-formed simulations with different levels of recombin-ation (0, 1, 5, 10, 30, 50, 100, and 250 cM/Mb) coveringa wide range of recombination rates in plants [62], andgenerated eight datasets in total. For each dataset, we es-timated π and FST for groups and group pairs, respect-ively. Finally, we compared π (for π-islands) and FST (forFST-islands) in islands versus those from simulated databy using the Mann-Whitney U test.We further focused on 130 π-islands shared among all
groups. These islands showed higher diversity and strongersignatures of balancing selection than islands specific toparticular group(s). These islands were clustered into threegenomic regions. We merged shared islands that were sep-arated by less than 1.5Mb into single genomic segments
Wang et al. Genome Biology (2019) 20:126 Page 12 of 15

and delimited these three highly polymorphic genomic re-gions to 15.3–24.4Mb on the short arm of chromosome 1(LG1p), 0.47–3.4Mb on the short arm of chromosome 5(LG5p), and 0.45–5.1Mb on the short arm of chromosome7 (LG7p). To look for patterns of their homologous regionsin A. thaliana genome, we used SyMAP v3.4 [63] to iden-tify the collinear regions between B. stricta [21] and A.thaliana genomes [32] and further blasted sequences ofthe three B. stricta genomic regions onto the A. thalianagenome to delimit the homologous regions. To calculategenetic diversity in A. thaliana, we downloaded SNP datafrom http://1001genomes.org/. Of the 1135 sequenced ac-cessions, we retained 972 non-relicts from the native range[21, 32]. Genotypes supported by less than 2 reads wereassigned as missing. SNPs with indels, more than two al-leles, more than 50% missing data, or located on maskedgenomic regions were further excluded. We partitioned A.thaliana into 10-kb, 20-kb, and 100-kb windows, calcu-lated per-site nucleotide diversity (π) using custom Pythonscripts, and obtained the window-based values by averagingper-site estimates in each window. To correct for variationin mutation rate among genomic regions, we divided diver-sity by divergence to the outgroup species, Arabidopsislyrata.
Gene ontology enrichment analysesWe performed GO analyses to test whether any functionalclasses of genes were over-represented in π-islands or FST-islands. We first calculated P values of Fisher’s test andsubsequently corrected P values for multiple testing withBenjamini-Hochberg FDR [64]. GO terms with FDR <0.05 were considered as significantly enriched. GO ana-lyses were conducted with singular enrichment analysis inagriGO’s Term Enrichment tool [65] and used B. strictagenome [21] as a reference.
Additional file
Additional file 1: Supplementary figures and tables. (PDF 8011 kb)
AbbreviationsANOVA: Analyses of variance; BLS: Balancing selection; GO: Gene ontology;KYA: Thousand years ago; LD: Linkage disequilibrium; MAF: Minor allelefrequency; NBS-LRR: Nucleotide-binding site-leucine-rich repeat; NJ: Neighborjoining; PCA: Principal component analysis
AcknowledgementsWe thank the anonymous reviewers for the valuable comments on aprevious draft, P. Ingvarsson and the Mitchell-Olds Lab for the helpful discus-sion, L. Excoffier for the help in the demographic analyses, and K. Ghattas forthe greenhouse assistance.
Authors’ contributionsBW, JPM, NP, DSR, JS, and TMO designed the research. NP, AS, CA, AL, andKB performed the research. JTL and TMO contributed new reagents andresources. BW, JPM, AL, and TMO analyzed the data. BW, JPM, NP, CRL, JTL,KB, JS, and TMO wrote the paper. All authors read and approved the finalmanuscript.
FundingBW was supported by the Guangdong Natural Science Funds forDistinguished Young Scholar (2018B030306040) and the Swedish ResearchCouncil (VR). TM-O was supported by grant R01 GM086496 from the NationalInstitutes of Health (USA). Work conducted by the US Department of EnergyJoint Genome Institute is supported by the Office of Science of the US De-partment of Energy under Contract No. DE-AC02-05CH11231. No fundingbody played a role in the study design or data collection, analysis, orinterpretation.
Availability of data and materialsThe short reads of each genotype have been deposited under GenBankaccession numbers SRP054739, SRP134356, SRP134462, SRP134522, andSRP134640. All SNPs used in population genetic analyses, locations of allaccessions, and custom scripts are available in the Dryad Data Archive athttps://doi.org/10.5061/dryad.574pc6n [66]. Seeds from these accessions areavailable from the Arabidopsis Biological Resource Center.
Ethics approval and consent to participateNot applicable
Consent for publicationNot applicable
Competing interestsThe authors declare that they have no competing interests.
Author details1Key Laboratory of Plant Resources Conservation and Sustainable Utilization,South China Botanical Garden, Chinese Academy of Sciences, Guangzhou510650, China. 2Department of Biology, Duke University, Box 90338, Durham,NC 27708, USA. 3Institute of Ecology and Evolutionary Biology and Instituteof Plant Biology, National Taiwan University, Taipei 10617, Taiwan, ROC.4HudsonAlpha Institute for Biotechnology, Huntsville, AL 35806, USA.5Department of Energy Joint Genome Institute, Walnut Creek, CA 94598,USA.
Received: 27 October 2018 Accepted: 4 June 2019
References1. Seehausen O, Butlin RK, Keller I, Wagner CE, Boughman JW, Hohenlohe PA,
Peichel CL, Saetre GP, Bank C, Brannstrom A, et al. Genomics and the originof species. Nat Rev Genet. 2014;15:176–92.
2. Burri R, Nater A, Kawakami T, Mugal CF, Olason PI, Smeds L, Suh A, Dutoit L,Bures S, Garamszegi LZ, et al. Linked selection and recombination ratevariation drive the evolution of the genomic landscape of differentiationacross the speciation continuum of Ficedula flycatchers. Genome Res. 2015;25:1656–65.
3. Han F, Lamichhaney S, Grant BR, Grant PR, Andersson L, Webster MT. Gene flow,ancient polymorphism, and ecological adaptation shape the genomic landscapeof divergence among Darwin’s finches. Genome Res. 2017;27:1004–15.
4. Wang J, Street NR, Scofield DG, Ingvarsson PK. Variation in linked selectionand recombination drive genomic divergence during allopatric speciationof European and American aspens. Mol Biol Evol. 2016;33:1754–67.
5. Renaut S, Grassa CJ, Yeaman S, Moyers BT, Lai Z, Kane NC, Bowers JE, BurkeJM, Rieseberg LH. Genomic islands of divergence are not affected bygeography of speciation in sunflowers. Nat Commun. 2013;4:1827.
6. Vijay N, Bossu CM, Poelstra JW, Weissensteiner MH, Suh A, Kryukov AP, WolfJBW. Evolution of heterogeneous genome differentiation across multiplecontact zones in a crow species complex. Nat Commun. 2016;7:10.
7. Ma T, Wang K, Hu Q, Xi Z, Wan D, Wang Q, Feng J, Jiang D, Ahani H,Abbott RJ, et al. Ancient polymorphisms and divergence hitchhikingcontribute to genomic islands of divergence within a poplar speciescomplex. Proc Natl Acad Sci U S A. 2017;115:E236–43.
8. Malinsky M, Challis RJ, Tyers AM, Schiffels S, Terai Y, Ngatunga BP, Miska EA,Durbin R, Genner MJ, Turner GF. Genomic islands of speciation separatecichlid ecomorphs in an East African crater lake. Science. 2015;350:1493–8.
9. Wolf JBW, Ellegren H. Making sense of genomic islands of differentiation inlight of speciation. Nat Rev Genet. 2017;18:87–100.
Wang et al. Genome Biology (2019) 20:126 Page 13 of 15

10. Charlesworth D. Balancing selection and its effects on sequences in nearbygenome regions. PLoS Genet. 2006;2:379–84.
11. Cruickshank TE, Hahn MW. Reanalysis suggests that genomic islands ofspeciation are due to reduced diversity, not reduced gene flow. Mol Ecol.2014;23:3133–57.
12. Ellegren H, Galtier N. Determinants of genetic diversity. Nat Rev Genet. 2016;17:422–33.
13. Guerrero RF, Hahn MW. Speciation as a sieve for ancestral polymorphism.Mol Ecol. 2017;26:5362–8.
14. Nosil P, Funk DJ, Ortiz-Barrientos D. Divergent selection and heterogeneousgenomic divergence. Mol Ecol. 2009;18:375–402.
15. Rushworth CA, Song B-H, Lee C-R, Mitchell-Olds T. Boechera, a modelsystem for ecological genomics. Mol Ecol. 2011;20:4843–57.
16. Mitchell-Olds T. Arabidopsis thaliana and its wild relatives: a model systemfor ecology and evolution. Trends Ecol Evol. 2001;16:693–700.
17. Song BH, Clauss MJ, Pepper A, Mitchell-Olds T. Geographic patterns ofmicrosatellite variation in Boechera stricta, a close relative of Arabidopsis. MolEcol. 2006;15:357–69.
18. Song BH, Windsor AJ, Schmid KJ, Ramos-Onsins S, Schranz ME, Heidel AJ,Mitchell-Olds T. Multilocus patterns of nucleotide diversity, populationstructure and linkage disequilibrium in Boechera stricta, a wild relative ofArabidopsis. Genetics. 2009;181:1021–33.
19. Lee CR, Mitchell-Olds T. Complex trait divergence contributes toenvironmental niche differentiation in ecological speciation of Boecherastricta. Mol Ecol. 2013;22:2204–17.
20. Lee CR, Mitchell-Olds T. Quantifying effects of environmental andgeographical factors on patterns of genetic differentiation. Mol Ecol. 2011;20:4631–42.
21. Lee CR, Wang B, Mojica JP, Mandáková T, Prasad KVSK, Goicoechea JL,Perera N, Hellsten U, Hundley HN, Johnson J, et al. Young inversion withmultiple linked QTLs under selection in a hybrid zone. Nat Ecol Evol. 2017;1:0119.
22. Anderson JT, Lee CR, Mitchell-Olds T. Strong selection genome-wideenhances fitness tradeoffs across environments and episodes of selection.Evolution. 2014;68:16–31.
23. Anderson JT, Lee CR, Mitchell-Olds T. Life-history QTLs and natural selectionon flowering time in Boechera stricta, a perennial relative of Arabidopsis.Evolution. 2011;65:771–87.
24. Prasad K, Song BH, Olson-Manning C, Anderson JT, Lee CR, Schranz ME,Windsor AJ, Clauss MJ, Manzaneda AJ, Naqvi I, et al. A gain-of-functionpolymorphism controlling complex traits and fitness in nature. Science.2012;337:1081–4.
25. DePristo MA, Banks E, Poplin R, Garimella KV, Maguire JR, Hartl C, PhilippakisAA, del Angel G, Rivas MA, Hanna M, et al. A framework for variationdiscovery and genotyping using next-generation DNA sequencing data. NatGenet. 2011;43:491–8.
26. Korneliussen TS, Albrechtsen A, Nielsen R. ANGSD: analysis of nextgeneration sequencing data. BMC Bioinformatics. 2014;15:356.
27. Alexander DH, Novembre J, Lange K. Fast model-based estimation ofancestry in unrelated individuals. Genome Res. 2009;19:1655–64.
28. Raj A, Stephens M, Pritchard JK. fastSTRUCTURE: variational inference ofpopulation structure in large SNP data sets. Genetics. 2014;197:573–89.
29. Frichot E, Mathieu F, Trouillon T, Bouchard G, Francois O. Fast and efficientestimation of individual ancestry coefficients. Genetics. 2014;196:973–83.
30. Skotte L, Korneliussen TS, Albrechtsen A. Estimating individual admixtureproportions from next generation sequencing data. Genetics. 2013;195:693–702.
31. Rosenberg NA, Mahajan S, Ramachandran S, Zhao CF, Pritchard JK, FeldmanMW. Clines, clusters, and the effect of study design on the inference ofhuman population structure. PLoS Genet. 2005;1:660–71.
32. 1001 Genomes Consortium. 1,135 genomes reveal the global pattern ofpolymorphism in Arabidopsis thaliana. Cell. 2016;166:481–91.
33. Excoffier L, Dupanloup I, Huerta-Sanchez E, Sousa VC, Foll M. Robustdemographic inference from genomic and SNP data. PLoS Genet. 2013;9:e1003905.
34. Ossowski S, Schneeberger K, Lucas-Lledo JI, Warthmann N, Clark RM, ShawRG, Weigel D, Lynch M. The rate and molecular spectrum of spontaneousmutations in Arabidopsis thaliana. Science. 2010;327:92–4.
35. Liu XM, Fu YX. Exploring population size changes using SNP frequencyspectra. Nat Genet. 2015;47:555–9.
36. Kliver S, Rayko M, Komissarov A, Bakin E, Zhernakova D, Prasad KVSK,Rushworth C, Baskar R, Smetanin D, Schmutz J, et al. Assembly of the
Boechera retrofracta genome and evolutionary analysis of apomixis-associated genes. Genes. 2018;9:185.
37. Chan AH, Jenkins PA, Song YS. Genome-wide fine-scale recombination ratevariation in Drosophila melanogaster. PLoS Genet. 2012;8:e1003090.
38. Choi K, Reinhard C, Serra H, Ziolkowski PA, Underwood CJ, Zhao XH, HardcastleTJ, Yelina NE, Griffin C, Jackson M, et al. Recombination rate heterogeneitywithin Arabidopsis disease resistance genes. PLoS Genet. 2016;12:30.
39. Feder JL, Xie XF, Rull J, Velez S, Forbes A, Leung B, Dambroski H, Filchak KE,Aluja M. Mayr, Dobzhansky, and Bush and the complexities of sympatricspeciation in Rhagoletis. Proc Natl Acad Sci U S A. 2005;102:6573–80.
40. Fijarczyk A, Babik W. Detecting balancing selection in genomes: limits andprospects. Mol Ecol. 2015;24:3529–45.
41. Bakker EG, Toomajian C, Kreitman M, Bergelson J. A genome-wide survey ofR gene polymorphisms in Arabidopsis. Plant Cell. 2006;18:1803–18.
42. Karasov TL, Kniskern JM, Gao LP, DeYoung BJ, Ding J, Dubiella U, Lastra RO,Nallu S, Roux F, Innes RW, et al. The long-term maintenance of a resistancepolymorphism through diffuse interactions. Nature. 2014;512:436–40.
43. Sicard A, Kappel C, Josephs EB, Lee YW, Marona C, Stinchcombe JR, WrightSI, Lenhard M. Divergent sorting of a balanced ancestral polymorphismunderlies the establishment of gene-flow barriers in Capsella. Nat Commun.2015;6:7960.
44. Guo YL, Fitz J, Schneeberger K, Ossowski S, Cao J, Weigel D. Genome-widecomparison of nucleotide-binding site-leucine-rich repeat-encoding genesin Arabidopsis. Plant Physiol. 2011;157:757–69.
45. Clark RM, Schweikert G, Toomajian C, Ossowski S, Zeller G, Shinn P,Warthmann N, Hu TT, Fu G, Hinds DA, et al. Common sequencepolymorphisms shaping genetic diversity in Arabidopsis thaliana. Science.2007;317:338–42.
46. Huang CH, Sun R, Hu Y, Zeng L, Zhang N, Cai L, Zhang Q, Koch MA, Al-Shehbaz I, Edger PP, et al. Resolution of Brassicaceae phylogeny usingnuclear genes uncovers nested radiations and supports convergentmorphological evolution. Mol Biol Evol. 2016;33:394–412.
47. de Filippo C, Key FM, Ghirotto S, Benazzo A, Meneu JR, Weihmann A, ParraG, Green ED, Andres AM, Program NCS. Recent selection changes in humangenes under long-term balancing selection. Mol Biol Evol. 2016;33:1435–47.
48. Bolger AM, Lohse M, Usadel B. Trimmomatic: a flexible trimmer for Illuminasequence data. Bioinformatics. 2014;30:2114–20.
49. Li H. Aligning sequence reads, clone sequences and assembly contigs withBWA-MEM. Preprint at https://arxiv.org/abs/1303.3997. Accessed 16 Mar 2013.
50. Gossmann TI, Song BH, Windsor AJ, Mitchell-Olds T, Dixon CJ, Kapralov MV,Filatov DA, Eyre-Walker A. Genome wide analyses reveal little evidence foradaptive evolution in many plant species. Mol Biol Evol. 2010;27:1822–32.
51. Patterson N, Price AL, Reich D. Population structure and eigenanalysis. PLoSGenet. 2006;2:2074–93.
52. Kumar S, Stecher G, Tamura K. MEGA7: molecular evolutionary geneticsanalysis version 7.0 for bigger datasets. Mol Biol Evol. 2016;33:1870–4.
53. Evanno G, Regnaut S, Goudet J. Detecting the number of clusters ofindividuals using the software STRUCTURE: a simulation study. Mol Ecol.2005;14:2611–20.
54. Purcell S, Neale B, Todd-Brown K, Thomas L, Ferreira MAR, Bender D, MallerJ, Sklar P, de Bakker PIW, Daly MJ, Sham PC. PLINK: a tool set for whole-genome association and population-based linkage analyses. Am J HumGenet. 2007;81:559–75.
55. Oksanen J, Blanchet FG, Friendly M, Kindt R, Legendre P, McGlinn D,Minchin P, O’Hara R, Simpson G, Solymos P, et al. vegan: communityecology package. R package version 24–1. 2016.
56. Hill WG, Weir BS. Variances and covariances of squared linkage disequilibriain finite populations. Theor Popul Biol. 1988;33:54–78.
57. Thome MTC, Carstens BC. Phylogeographic model selection leads to insightinto the evolutionary history of four-eyed frogs. Proc Natl Acad Sci U S A.2016;113:8010–7.
58. Vieira FG, Albrechtsen A, Nielsen R. Estimating IBD tracts from low coverageNGS data. Bioinformatics. 2016;32:2096–102.
59. McKenna A, Hanna M, Banks E, Sivachenko A, Cibulskis K, Kernytsky A,Garimella K, Altshuler D, Gabriel S, Daly M, DePristo MA. The genomeanalysis toolkit: a MapReduce framework for analyzing next-generation DNAsequencing data. Genome Res. 2010;20:1297–303.
60. Weir BS, Cockerham CC. Estimating F-statistics for the analysis of populationstructure. Evolution. 1984;38:1358–70.
61. Nei M. Molecular evolutionary genetics. New York: Columbia UniversityPress; 1987.
Wang et al. Genome Biology (2019) 20:126 Page 14 of 15

62. Choi K, Henderson IR. Meiotic recombination hotspots - a comparative view.Plant J. 2015;83:52–61.
63. Soderlund C, Bomhoff M, Nelson WM. SyMAP v3.4: a turnkey syntenysystem with application to plant genomes. Nucleic Acids Res. 2011;39:e68.
64. Benjamini Y, Hochberg Y. Controlling the false discovery rate: a practicaland powerful approach to multiple testing. J R Stat Soc Series B StatMethodol. 1995;57:289–300.
65. Tian T, Liu Y, Yan HY, You Q, Yi X, Du Z, Xu WY, Su Z. agriGO v2.0: a GOanalysis toolkit for the agricultural community, 2017 update. Nucleic AcidsRes. 2017;45:W122–9.
66. Wang B, Mojica JP, Perera N, Lee CR, Lovell JT, Sharma A, Adam C, Lipzen A,Barry K, Rokhsar DS, Schmutz J, Mitchell-Olds T. Ancient polymorphismscontribute to genome-wide variation by long-term balancing selection anddivergent sorting in Boechera stricta. Datasets SNPs, Samples and Scripts;2019. https://doi.org/10.5061/dryad.574pc6n.
Publisher’s NoteSpringer Nature remains neutral with regard to jurisdictional claims inpublished maps and institutional affiliations.
Wang et al. Genome Biology (2019) 20:126 Page 15 of 15