G REGORY T HOMPSON, R OY M . R ASMUSSEN, AND K EVIN M ANNING

Anchors Away A New Approach for Estimating Ideal Points Comparable
across Time and Chambers
Nicole Asmussen and Jinhee Jo
University of Rochester
Work in progress. Ask permission before citing.
Existing methods for estimating ideal points of legislators that are comparable across time
and chambers make restrictive assumptions regarding how legislators’ ideal points can
move over time, either by fixing some legislators’ ideal points or constraining their
movement over time. These assumptions are clearly contradictory to some theories of
congressional responsiveness to election dynamics and changes in constituency. Instead of
using legislators as anchors, our approach relies on matching roll calls in one chamber and
session with roll calls or cosponsorship decisions on identical bills introduced in a different
chamber or session. By using these “bridge decisions” to achieve comparability, we can
remove any assumptions about the movement of legislators’ ideal points. We produce
these estimates for both chambers of the 107th (2001-2002) and 108th (2003-2004)
Congresses, and we show that our estimates provide interesting insights into the nature of
legislative behavior change in response to electoral dynamics.

1
The ideal point estimation techniques developed in the last two decades have added
significantly to our understanding of the ideology of members of Congress, partisan
cleavages, and the dimensionality of the issue space. The microfoundation of these
estimation techniques in the spatial model has also given researchers the confidence that
these estimates, based on explicit and defensible assumptions, are suitable for quantitative
analyses of legislators’ behavior. However, in contrast to the theoretically grounded
assumptions needed to generate ideal points within a single session of Congress, the
assumptions normally made to allow for comparability of ideal points across time and
chambers are not well grounded in theory, and in most cases are clearly contradictory to
theories of congressional responsiveness to electoral dynamics and changes in
constituency. This is particularly troubling because most uses of ideal point estimates for
empirical testing or even simple description involve comparisons over time.
Existing methods for estimating ideal points across time and chambers make
restrictive assumptions regarding how legislators’ ideal points can move over time, either
by fixing some legislators’ ideal points or by constraining their movement, usually by
restricting them to linear movement in one direction.1 These restrictions present two
problems. First, they preclude the finding of the sort of abrupt behavior changes we would
expect from members of Congress responding to electoral dynamics (e.g., a primary
challenge) or changes in constituency (e.g., redistricting). Second, they obscure the effect of
national trends that involve many members moving in the same direction (for example, in
1 One exception is Treier (2010a). Although there are no restrictions on the movement of legislators’ ideal
points, the ADA, the ACU, and the president are treated as if they are members of Congress, and their ideal
points are assumed to be constant.
2
response to a national crisis), because the shift in ideal points coincides with a shift in the
scale on which the ideal points are measured. As a consequence, existing ideal point
estimation techniques are not adequate for testing theories of legislative behavior change
because the findings (or lack thereof) are an artifact of the estimation technique.
Moreover, existing estimates muddle our understanding of Congress. By depending on
legislators as anchors, who may themselves be drifting, they present us with a description
of Congress that has too many moving parts. Neither the members’ ideal points, nor the
meaning of the scales can be said to be truly stationary.
The approach presented in this paper does not depend on the use of legislators or
any other actors as anchors, as all existing methods do. Instead, we make the agendas
comparable across time and chambers by matching roll calls in one chamber and session
with roll calls or cosponsorship decisions on identical bills in a different chamber or
session, making use of the fact that many bills are introduced in identical form in both
chambers and over multiple sessions, a subset of which receive a floor vote. By identifying
the bills common to more than one chamber or session to use as anchors, we can remove
any assumptions about the movement of legislators’ ideal points. Furthermore, the
meaning of these ideal points is easier to interpret because the scale on which they lie is
stationary.
This paper demonstrates the utility of this approach by presenting ideal point
estimates for both chambers of the 107th (2001-2002) and 108th (2003-2004) Congresses.
We show that these estimates provide interesting insights into the nature of legislative
behavior change in response to electoral dynamics. Specifically, we find that following the
Republican Party’s surprisingly strong showing in the 2002 midterm elections, Republicans
3
moved to the right while the behavior of Democrats was more mixed, with moderate
Democrats less likely to shift to the left than extremists. Also, senators who were reelected
in 2002 had more extreme ideal points in the session following their reelection than in the
preceding two years, suggesting that elections have a moderating effect on candidates.
Before presenting these results, we examine the assumptions underlying existing methods.
Existing Methods
The techniques used to make estimates comparable across time and chamber can be
separated into three categories: those which hold all legislators’ ideal points fixed over
their careers, those which hold some fixed and allow others to float, and those which allow
legislators’ ideal points to move along a trendline. We discuss methods falling into each of
these categories as well as their susceptibility to two major problems: the inability to
account for abrupt behavior changes and the obscuring of shifts in ideal points that move
many members in the same direction.
Fixed Career Method
One assumption that ensures comparability is that legislators maintain the same
ideal point for their entire career; even members who serve in both chambers are assumed
to have the same ideal point in the House and the Senate. This is the assumption that
underlies Poole and Rosenthal’s Common Space scores.2 Although the most restrictive
2 These are the only ideal point estimates in the NOMINATE family that are comparable across chambers. For
Poole’s explanation of the differences between D-NOMINATE, DW-NOMINATE, W-NOMINATE and Common
Space scores, see http://voteview.com/page2a.htm.

4
assumption, these estimates are commonly used to compare levels of polarization in the
House and Senate and to calculate gridlock intervals. Obviously the assumption that ideal
points are fixed means that these estimates are useless for studying changes in individual
behavior, since the estimated ideal point of each legislator is simply an average of their
voting behavior over their entire career. Neither can these ideal points capture shifts in
ideology that move many members in the same direction since they can only measure a
member’s ideology relative to the other members serving at the same time. As Bailey
(2007) points out, this deficiency leads to the substantively questionable result that pro-
segregationist members of Congress from the 1950’s have ideal point estimates in the same
neighborhood as moderate Democrats of the 1990’s.
Related to the “fixed career” estimation strategy, the “shift and stretch” method of
Groseclose, Levitt and Snyder (1999) assumes that each legislator has an unobserved
constant ideal point throughout their career, but that this ideal point is measured with
error. The task of making session- and chamber-specific ideology scores comparable is
accomplished by minimizing these errors.3 Although allowing for movement across time,
the fundamental assumption of time-invariant ideal points militates against uncovering
changes in legislators’ voting behavior between sessions, and the authors readily admit
that their method cannot pick up on universal shifts in members’ preferences because this
would coincide with a shift in the ideological scale (47).
3 Groseclose, Levitt and Snyder (1999) are concerned with generating comparable ADA scores. Ansolabehere,
Snyder and Stewart (2001) apply the “shift and stretch” technique to ideal point estimates constructed with
the Heckman and Snyder (1997) method, and Ensley, Tofias and de Marchi (2010) apply the technique to
Poole and Rosenthal’s (1997) static W-NOMINATE scores.
5
Fix and Float Methods
A less restrictive approach to making estimates comparable is to fix the ideal points
of some legislators, while allowing all other legislators to “float.” A classic example of this
involves fixing the ideal points of two extremists, say Senators Ted Kennedy and Robert
Byrd, to -1 and 1, and estimating a separate ideal point for each legislator for each session
relative to the career ideal points of these two legislators. The “fix and float” method is also
used by Poole and Rosenthal in computing NOMINATE scores for legislators who switch
parties within a session: a pre-switch and post-switch ideal point is estimated for the party-
switcher, while all other members’ ideal points are held constant. Treier’s (2010b)
overlapping constraints method makes use of this technique to make senators’ ideal points
comparable across time, by fixing members’ ideal points in the first four years of the term,
but estimating a separate ideal point for the last two years. Because of the staggering of
elections in the Senate, it is always the case that one-third of Senators and held fixed while
the other two-thirds are allowed the change. While “fix and float” methods usually are only
applicable to over-time comparisons, cross-chamber comparability can be achieved by
fixing the ideal points of actors who take positions on roll calls in both chambers, such as
the president and interest groups, as in Treier (2010a).
Estimates produced by the “fix and float” method seem well suited for capturing
abrupt changes in legislative voting behavior since no restrictions are placed on the
movement of the ideal points of the floating legislators. However, two caveats are in order.
First, much hinges on the assumption that the fixed legislators’ ideal points are actually
constant. Treier (2010b) finds that even such firm ideologues as Kennedy and Byrd have
shifted their ideological positions in response to electoral cycles—a cautionary example
6
that should make researchers wary of establishing comparability from a small number of
fixed legislators. A second difficulty is establishing a baseline with which to compare
changes in legislators’ ideal points. For example, if only legislators suspected of changing
ideal points (e.g., party-switchers) are allowed to float, while all others are fixed, then the
finding of a significant change in the ideal point of the floaters lacks a relevant reference
point because the change in all other members’ ideal points is by assumption required to be
zero.4
Furthermore, the “fix and float” method cannot properly account for universal shifts
in members’ ideal points. Since these shifts in preference can only be registered as changes
in the ideal points of the floating members, the cause of the movement of ideal points may
be erroneously attributed to the characteristic that separates the floating legislators from
the fixed legislators. Consider the following example in which we wish to determine the
effect of redistricting on legislators’ voting behavior. We estimate legislators’ ideal points
pre- and post-redistricting, and to ensure comparability across time, we fix the ideal points
of the legislators whose district boundaries remained the same. Suppose that in the true
data generating process, redistricting has no effect, but there is a national trend that pulls
all legislators two units to the right. We would estimate the non-redistricted members as
having an ideal point at the average of their pre- and post-redistricting ideal point (that is,
4 This is the shortcoming that Clinton, Jackman and Rivers (2004) identify in McCarty, Poole and Rosenthal’s
(2001) analysis of party-switchers. While their criticism is conceptually right, their reanalysis of the effect of
Jeffords’s party-switching sidesteps the issue of cross-time comparability altogether by simply assuming that
the distribution of pre-switch and post-switch ideal points both have mean zero and unit variance—in
essence implying that no anchors are needed to make the estimates comparable.

7
one unit to the right of their initial ideal point), while redistricted members’ second period
ideal points are estimated to be two units to the right of their first period ideal points.
Therefore, what appears to be an effect of redistricting is simply an artifact of the
estimation technique.
Trendline Methods
A final category of estimation techniques restricts legislators’ movements across
time to a specific functional form. The most common restriction, used in Poole and
Rosenthal’s D-NOMINATE and DW-NOMINATE scores, allows for only a linear time trend in
legislators’ ideal points. Poole and Rosenthal dismiss estimations with higher order
polynomials as not worthwhile given the low gains in classification success at the cost of
computational time (1997, 28-29). Bailey (2007) also makes use of time trends, allowing
members serving 7-14 years to move with a linear time trend, those serving 15-20 years to
move with a quadratic trend, and those serving more than 20 years to move with a
polynomial trend of degree five.
One might think that the inclusion of polynomial trends would allow these estimates
to capture abrupt changes in legislative behavior. However, as Treier (2010b) points out,
neither a linear nor a quadratic trend can imitate the kind of oscillating behavior we might
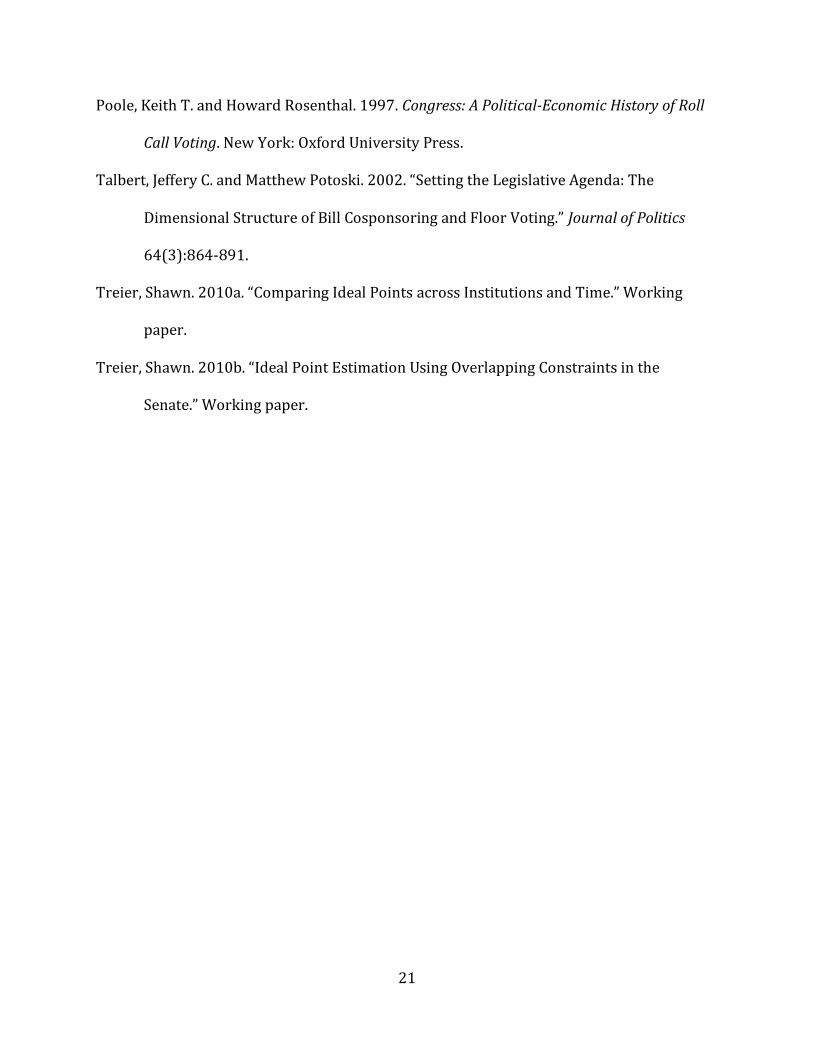
associate with Senate election cycles. Figures 1 and 2 illustrate this point further by
depicting situations in which legislators are commonly hypothesized to change their voting
behavior, such as redistricting, moving from the House to the Senate, a primary challenge,
retirement or senatorial election cycles. In Figure 1, the colored lines represent the true
ideal points of these hypothesized members, while the black lines are the best-fitting linear
trendlines, which are obviously inadequate to capture these types of movements. In Figure

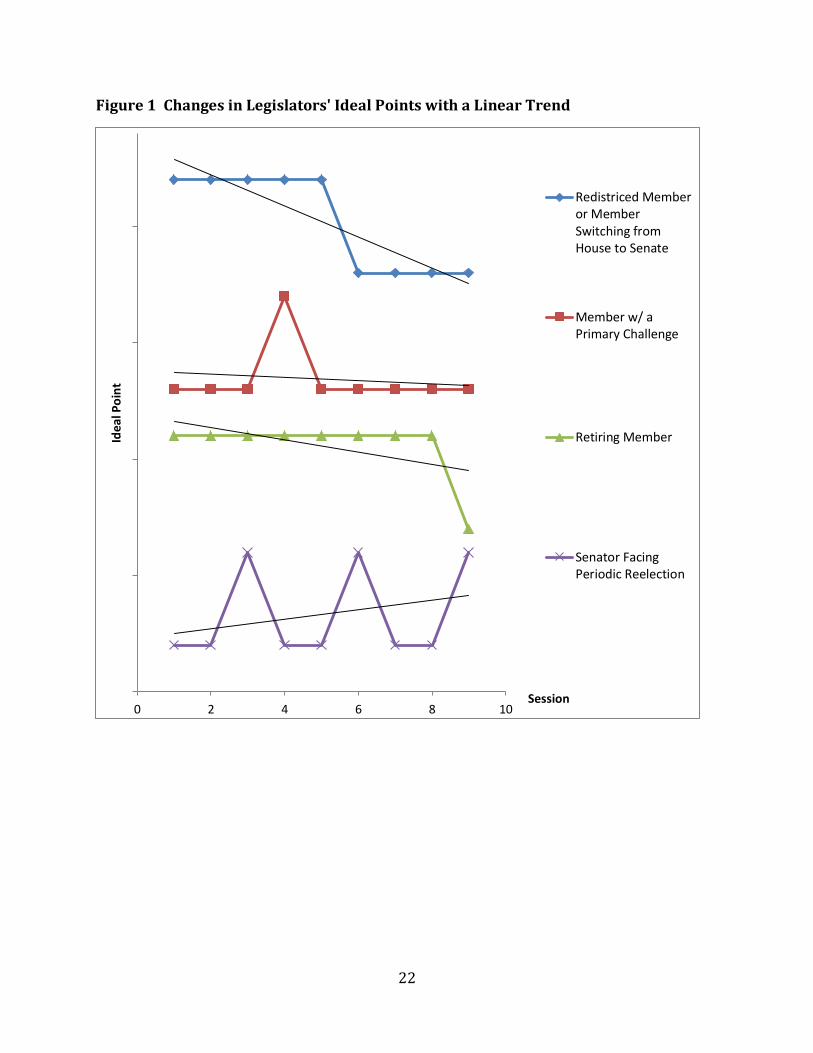
8
2, we fit trendlines based on polynomials of degree five. Surprisingly, even such a complex
trendline is not able to mimic these hypothesized movements. Except in the case of the
retiring member, the change in estimated ideal points based on the trendline greatly
understates the effect of the “treatment.” It is no wonder, then, that Poole and Rosenthal
(1997) find minimal benefits to upping the degree of the polynomial. Furthermore, even
though polynomial trends are more suited to picking up on gradual rather than sudden
changes in ideal points, trendline methods, like fixed career methods, still fail to capture
universal shifts in legislators’ ideal points because they can only account for relative
changes.
Although Martin and Quinn’s (2002) dynamic ideal point estimation technique does
not rely on trendlines, we address it here because it has a flavor similar to trendline
methods. Specifically, in Martin and Quinn’s estimation, the current period’s ideal point is
modeled as a random walk from the previous period’s ideal point, which means that the
expectation of one’s ideal point in the current period is one’s ideal point in the previous
period. However, the amount of movement detected over time depends entirely on the
choice of the prior distribution of the evolution variance parameters which determine the
amount of smoothing, as the authors readily admit (2002, 147). Thus, while we can use
this method to see whether there is some solid evidence showing that people really change
their ideological positions over time, by assuming very small evolution variance parameter,
it is not appropriate to measure how big such movements are.
Our Approach
The common denominator of all existing methods for making ideal points
9
comparable across time and chambers is the focus on the actors as anchors. The problems
of accounting for abrupt changes in legislative behavior and identifying universal shifts in
members’ ideal points cannot simply be solved by more computational power, higher order
polynomials, or cleverer fix and float arrangements. Instead, the focus must shift from
fixing the actors to fixing the agendas. Recent analyses have incorporated bridge votes,
usually votes on identical versions of conference reports, as a means to make House and
Senate estimates comparable (Bailey 2007, Treier 2010a), yet the lack of votes that bridge
across time means that the sole use of roll call votes as anchors is not enough to allow for
the dropping of all restrictions on the movement of legislators’ ideal points.
Our approach connects the agendas over time by including legislators’ decisions to
cosponsor legislation. We make use of the fact that many bills are introduced in identical
form in both chambers and in multiple sessions of congress, a subset of which receive a
floor vote in at least one session of a chamber. By matching the roll call votes on bills in a
particular chamber and session with cosponsorship decisions on identical bills introduced
in another session or chamber, we can achieve comparability of agendas and do away with
using legislators as anchors.
Although Mayhew (1974) once claimed that cosponsorship is a costless and
therefore inherently symbolic activity, more recent studies have considered cosponsorship
to be indicative of legislators preferences and have employed cosponsorship data to
characterize social networks in Congress and identify influential members (Fowler 2006),
to estimate status quo positions of roll call votes (Peress 2009), and test theories of
position-taking and party effects (Kessler and Krehbiel 1996, Krehbiel 1995). Moreover,
Aleman, Calvo, Jones and Kaplan (2009) and Talbert and Potoski (2002) both use
10
cosponsorship data to estimate ideal points of members of Congress and find that
cosponsorship-based estimates correlate roughly with roll-call-based measures, although
neither of these studies exploits identical, multiply introduced bills as a way to make
comparisons across time and institutions as we do in this analysis, nor do they attempt to
scale cosponsorship and roll-call decisions together.
The question of whether cosponsorship data can be treated in the same way as roll
call data is a challenging one. Bernhard and Sulkin (2010) give support for the notion that
cosponsorship decisions ought to be taken seriously—members of Congress rarely renege
(only about 1.5% of cosponsors vote no on final passage), and reneging members are
subject to punishment. On the other hand, Howard and Moffett (2010) point out the
paradox that roll call support on final passage usually far exceeds number of cosponsors,
and Desposato, Kearney and Crisp (2008) caution against using cosponsorship data to
estimate ideal points because of the difficulty of determining the meaning of non-
cosponsorship.
We deal with this challenge by interpreting the decision to cosponsor (or sponsor) a
bill as equivalent to voting “yes,” but we treat non-cosponsorship as missing information.
This means that the cosponsorship decisions on a bill in a particular chamber and session
are not by themselves informative because the estimation procedure would treat the
decisions the same as a unanimous vote. But if an identical bill receives a non-unanimous
floor vote in another chamber or session, then the locations of the bill’s cosponsors also
help determine where the cutline falls (and vice versa) and hence how the ideal point
estimates of each chamber-sessions fit on the same scale. By matching roll calls with
cosponsorship decisions we can estimate comparable ideal points even while making

11
minimal assumptions about what non-cosponsorship means.
Data
To demonstrate the utility of our method, we restricted our data-collection efforts to
the 107th (2001-2002) and 108th Congresses (2003-2004), with plans to expand the
timeframe in future research. We identified identical bills5 introduced in the House and
Senate of the same congress by browsing the Bill Summary & Status reports on the Library
of Congress’s THOMAS website (http://thomas.loc.gov), and collecting the “related bills”
information. We identified identical bills introduced over multiple sessions in the same
chamber by comparing bill descriptions in the Congressional Bills Project files (Adler and
Wilkerson 2001-2004). To make data collection more manageable, we excluded: 1)
resolutions and amendments, 2) bills that received fewer than 10 (co)sponsors in the
Senate and 20 (co)sponsors in the House, and 3) bills that had no identical companion in
another chamber or congress that also met the above thresholds.
Of the 17,414 bills introduced in the four “chambers” (the 107th House, the 107th
Senate, the 108th House and the 108th Senate), we identify 38 bills identically introduced in
all four chambers, 48 introduced in three of the four chambers, and 526 introduced in two
of the four chambers. Of these 612 bills, 60 received a recorded floor vote in at least one
chamber. Eliminating unanimous votes, 39 “bridge decisions” (i.e., combinations of roll call
and cosponsorship decisions that span more than one chamber) remain. In addition to
these, we also include 57 “bridge votes” (i.e., roll call votes on identical bills, usually
5 In practice, we only checked if bill descriptions were identical, and in the case of small discrepancies in bill
descriptions, the bill texts were compared.
12
conference reports), 30 occurring in the 107th Congress and 27 in the 108th.
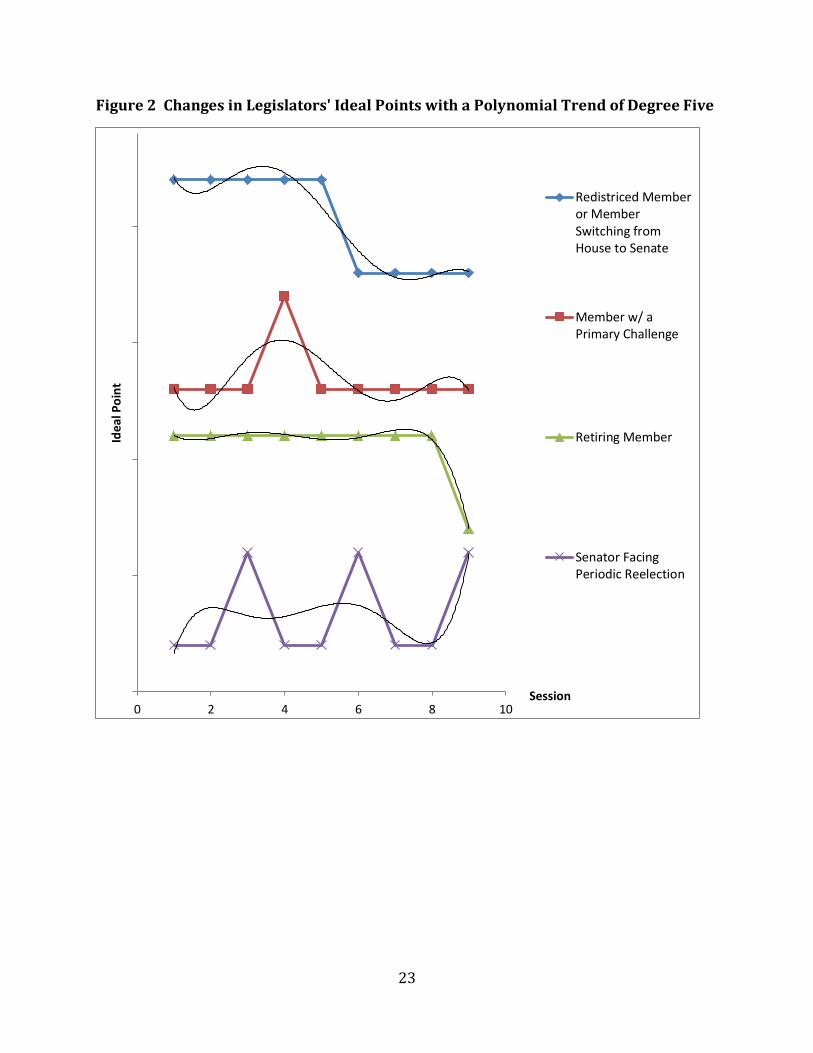
The roll call/cosponsorship matrix is constructed as follows. The rows of the matrix
are the members of Congress, with a separate row for each session that the member
served. The columns of the matrix contain three types of items: the unique roll call votes
for each chamber for each session, and the “bridge votes” which span both chambers of a
single session, and the “bridge decisions” which span multiple chambers. The roll call
entries take the values 1 for yea, 0 for nay, and NA otherwise. The cosponsorship decisions
take the values 1 for sponsorship or cosponsorship, NA for non-cosponsorship, and NA if
the bill was not introduced in the member’s chamber. We also include the president’s
position on roll calls in the House and Senate as recorded by Congressional Quarterly. The
resulting matrix, depicted in Figure 3, has 1099 legislators and 3488 items.
Method
One advantage of our approach is that once this matrix is constructed, ideal points
can be estimated using any of the techniques appropriate for the estimation of static ideal
points. We use the Bayesian simulation approach of Clinton, Jackman, and Rivers (2004),
which fits roll call data with an item response model via Markov Chain Monte Carlo
(MCMC) methods. This is easily implementable by anyone with a basic knowledge of R
using the package pscl and the command ideal. We estimated a one-dimensional
model, running 25,000 iterations, with a burn-in of 10,000, and a thinning interval of 100.
The estimation time was approximately 5 hours.
Results
Figure 4 presents the density plots of the posterior means of the members of each
13
chamber. The dotted line indicates the chamber median. Note that although we present
each chamber on a separate graph for visual clarity, the scales are directly comparable. For
instance, we can see that the median shifted to the right in both chambers in the 108th
Congress and that the House median is to the right of the Senate median in both
Congresses.
Figure 5 plots our ideal point estimates against Poole and Rosenthal’s Common
Space scores, which assume that each member has a fixed ideal point throughout their
entire career. While highly correlated, important differences are apparent. First, our
estimates are able to pick up on members’ changing preference throughout their careers.
Note, for instance, that we estimate Senator Zell Miller (D-GA) and Representative James
Traficant (D-OH) as behaving much more conservatively in their final terms, and President
Bush as less extreme in the first two years of his presidency. Also, our estimates place
Common Space extremists like Russ Feingold and Ron Paul closer to the center of their
parties. Finally, our estimates are able to discriminate more among Democrats than
Common Space scores, as can be seen by the greater vertical spread in Democrats’ ideal
points.
Our estimates are also particularly useful for determining if and in what direction
legislators’ ideal points are moving. Unlike other methods of making ideal points
comparable across time, which can only claim to capture relative changes, our technique of
holding the agenda fixed means that differences in legislators’ ideal points from one period
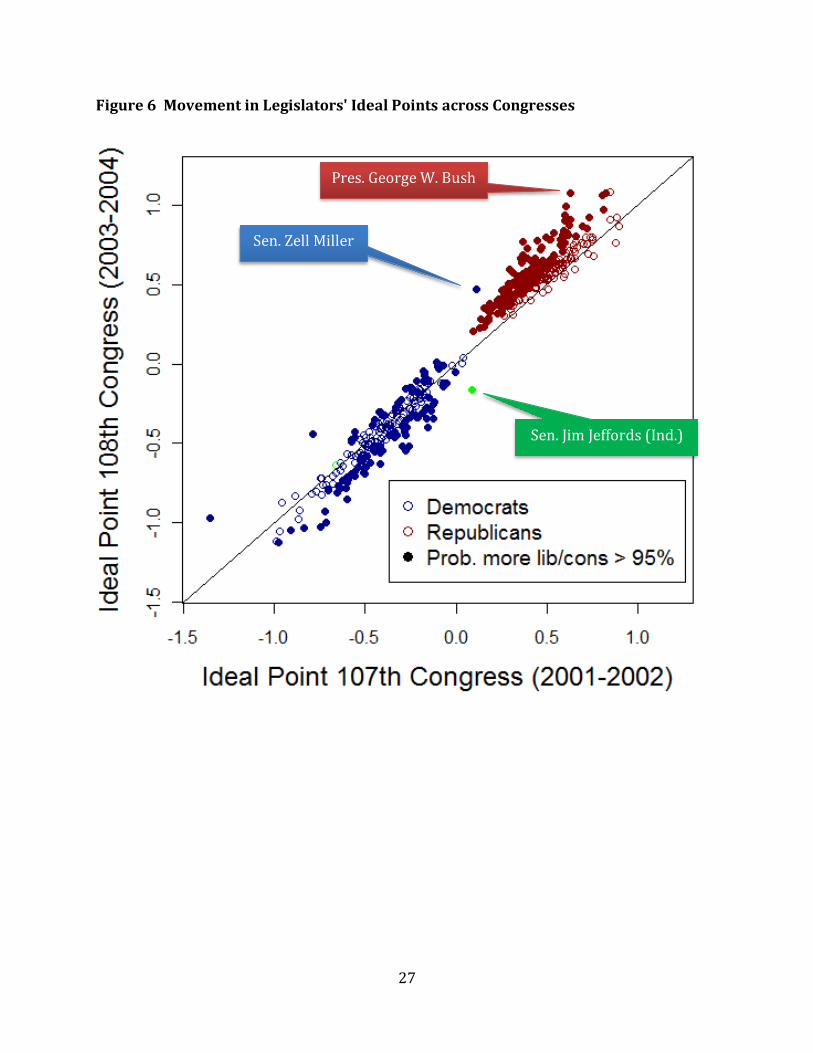
to another can be interpreted as absolute changes. Figure 6 plots the ideal point of each
member of the 107th Congress against their ideal point in the 108th Congress for those who
served in both sessions. The 45 degree line divides the members who became more

14
conservative (above the line) from those who became more liberal (below the line). Solid
circles indicate that the posterior probability that the member became more conservative
(or more liberal) is greater than 95 percent. Note that nearly all Republicans moved to the
right, but that Democrats exhibit mixed behavior, with moderate Democrats slightly more
likely to have moved to the right, but more liberal Democrats mostly moving to the left.
These patterns are not surprising given the electoral context: The 2002 midterm elections
provided the Republicans with a rare midterm victory for the president’s party, in which
they picked up eight House seats, two Senate seats and regained partisan control of the
Senate. This victory, combined with Bush’s rising popularity and post-9/11 hawkishness
may have emboldened Republicans—both moderates and extremists—to behave more
conservatively. Indeed, Bush himself shows the greatest change between the 107th and
108th Congresses.
It is also clear from Figure 5 that movements in the ideal points of continuing
members between these two sessions are contributing to the long-term phenomenon of
party polarization, with more Republicans above the 45 degree line and more Democrats
below. In this time period, Republicans are the major contributors to polarization—the
mean posterior probability that members serving in both congresses became more
extreme in the second session is higher for Republicans than Democrats (0.91 versus
0.63)—and regardless of party, the effect is more pronounced in the Senate, where the
probability that members became more extreme is 0.97 for Republicans and 0.88 for
Democrats (versus 0.90 and 0.56 for House Republicans and Democrats, respectively).
Two noteworthy Senators are highlighted in Figure 5. Senator Zell Miller (D-GA),
already the most conservative Democrat in the 107th Congress, moved even further to the
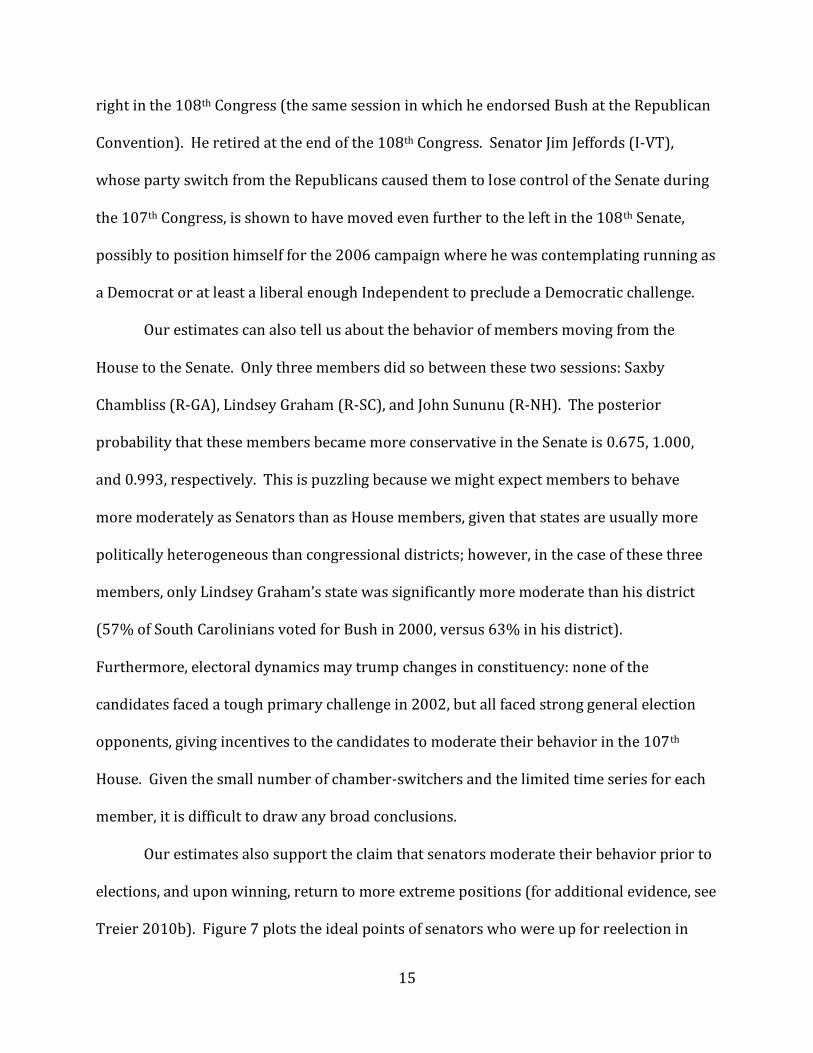
15
right in the 108th Congress (the same session in which he endorsed Bush at the Republican
Convention). He retired at the end of the 108th Congress. Senator Jim Jeffords (I-VT),
whose party switch from the Republicans caused them to lose control of the Senate during
the 107th Congress, is shown to have moved even further to the left in the 108th Senate,
possibly to position himself for the 2006 campaign where he was contemplating running as
a Democrat or at least a liberal enough Independent to preclude a Democratic challenge.
Our estimates can also tell us about the behavior of members moving from the
House to the Senate. Only three members did so between these two sessions: Saxby
Chambliss (R-GA), Lindsey Graham (R-SC), and John Sununu (R-NH). The posterior
probability that these members became more conservative in the Senate is 0.675, 1.000,
and 0.993, respectively. This is puzzling because we might expect members to behave
more moderately as Senators than as House members, given that states are usually more
politically heterogeneous than congressional districts; however, in the case of these three
members, only Lindsey Graham’s state was significantly more moderate than his district
(57% of South Carolinians voted for Bush in 2000, versus 63% in his district).
Furthermore, electoral dynamics may trump changes in constituency: none of the
candidates faced a tough primary challenge in 2002, but all faced strong general election
opponents, giving incentives to the candidates to moderate their behavior in the 107th
House. Given the small number of chamber-switchers and the limited time series for each
member, it is difficult to draw any broad conclusions.
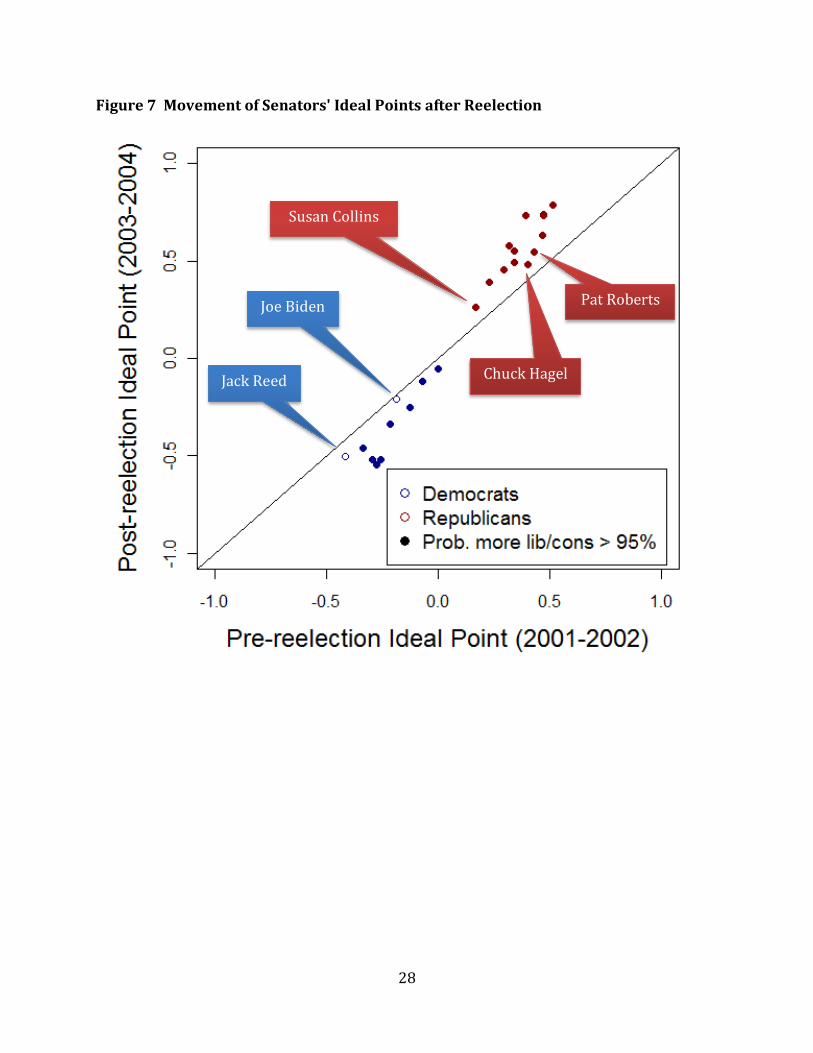
Our estimates also support the claim that senators moderate their behavior prior to
elections, and upon winning, return to more extreme positions (for additional evidence, see
Treier 2010b). Figure 7 plots the ideal points of senators who were up for reelection in
16
2002 and won. The horizontal axis is their ideal point in the fifth and sixth year of their
pre-reelection term, and the vertical axis is their ideal point in the first and second year of
their new term. Every Republicans’ ideal point moves substantially to the right. The three
smallest shifters were Senators Susan Collins (R-ME), Pat Roberts (R-KS), who faced no
Democratic challenger, and Chuck Hagel (R-NE), whose Democratic opponent was so poor
he could not afford the filing fee (Barone and Cohen 2004). In the latter two cases, the lack
of electoral competition could mean they did not need to moderate their behavior prior to
the election. This could also be the case for Senator Jack Reed (D-RI), one of the two
Democrats who did not move to the left. His general election competition was a casino pit
manager who raised no money (Barone and Cohen 2004). The other stationary Democrat
was Sen. Joe Biden (D-DE). Although senators not up for reelection also moved toward
their parties’ extremes, members reelected in 2002 moved more than those originally
elected in 2000 (0.169 average movement compared with 0.108), and more than those
seeking reelection in 2004 (whose average movement was 0.103 toward their parties’
extremes).6
Finally, Table 1 provides a list of the members who moved the farthest to the right
or to the left, along with possible explanations for their behavior changes, as gleaned from
descriptions of members’ careers and electoral contests in the Almanac of American Politics
(Barone and Cohen 2002, Barone and Cohen 2004). Primary competition, ambitions for
higher office, redistricting concerns, retirements, and first reelection attempts seem to be
6 We exclude retirees in calculating the average movement. Those retiring in 2004 moved 0.089 toward their
parties’ extremes. Excluding Sen. Zell Miller (D-GA), who bucked the trend by moving substantially to the
right, retirees moved an average of 0.153 toward their parties’ extremes.
17
important factors in explaining shifting preferences, but more work remains to be done in
explaining more generally which factors motivate behavior change and when.
Conclusion and Future Research
Many of the ways that political scientists use ideal point estimates involve making
comparisons across time and chambers. To date, the techniques for achieving
comparability have focused on using legislators as anchors, a practice which artificially
limits the movement of legislators’ ideal points and can only give insight into the
movement of ideal points relative to other members. Our approach does away with these
anchors. Instead, we make the agendas comparable by exploiting a feature of
cosponsorship data: bills introduced in identical form in both chambers or in multiple
sessions that receive a floor vote in at least one chamber and session. Using data from the
107th and 108th Congresses, we demonstrate that the assumptions are plausible, the data
collection is doable, the estimation is simple, and the results are believable.
The insights we have gained from observing just one period of change encourages
us to believe that future work on this project will bear much fruit. Extending the scope of
this analysis by identifying identically introduced bills across more sessions of Congress is
a next step which would allow us to observe the movement of legislators’ ideal points over
a longer period of time. Also, by merging our estimates with data on legislators’ retirement
decisions, electoral vulnerability, primary challenges, and redistricting history, we can
make sense of the patterns we observe and even engage in theory testing.
We are looking forward to learning what our approach can tell us about the big
picture of congressional politics. Ideal point estimates have given us a general

18
understanding of how party allegiances and issues have shifted over the course of
American history, but we still view these phenomena through the confusing prism of
shifting scales, relative changes and collapsing dimensions. We eagerly anticipate being
able to view congressional politics played out on a stable stage, rather than floating
between drifting anchors.
19
References
Adler, E. Scott and John Wilkerson. 2001-2004. Congressional Bills Project. NSF 00880066
and 00880061.
Aleman, Eduardo, Ernesto Calvo, Mark P. Jones and Noah Kaplan. 2009. “Comparing
Cosponsorship and Roll-Call Ideal Points.” Legislative Studies Quarterly 34(1):87-
116.
Ansolabehere, Stephen, James M. Snyder, Jr., and Charles Stewart, III. 2001. “Candidate
Positioning in U.S. House Elections.” American Journal of Political Science 45(1):136-
159.
Bailey, Michael A. 2007. “Comparable Preference Estimates across Time and Institutions for
the Court, Congress and Presidency.” American Journal of Political Science 51 (3):
433-448.
Barone, Michael and Richard E. Cohen. 2004. Almanac of American Politics, 2004. National
Journal Group.
Barone, Michael and Richard E. Cohen. 2006. Almanac of American Politics, 2006. National
Journal Group.
Bernhard, William and Tracy Sulkin. 2010. “Commitment and Consequences: Reneging on
Cosponsorship Pledges in the U.S. House.” Paper presented at the annual meeting of
the Midwest Political Science Association, April 2010.
Clinton, Joshua, Simon Jackman, and Douglas Rivers. 2004. “The Statistical Analysis of Roll
Call Data.” American Political Science Review 98(2):355-370.
Desposato, Scott, Matt Kearney, and Brian Crisp. 2008. “Using Cosponsorship to Estimate

20
Ideal Points.” Working paper.
Ensley, Michael J., Michael W. Tofias, and Scott de Marchi. 2010. “Are These Boots Made for
Walking? Ideological Change among U.S. House Members.” Paper presented at the
Annual Meeting of the Midwest Political Science Association 2010.
Groseclose, Tim, Steven D. Levitt and James M. Snyder, Jr. 1999. “Comparing Interest Group
Scores across Time and Chambers: Adjusted ADA Scores for the U.S. Courts”
American Political Science Review 93(1):33-50.
Heckman, James J. and James M. Snyder, Jr. 1997. “Linear Probability Models of the Demand
for Attributes with an Empirical Application to Estimating the Preferences of
Legislators.” Rand Journal of Economics 28:S142-S189.
Harward, Brian M. and Kenneth W. Moffett. 2010. “The Calculus of Cosponsorship in the
U.S. Senate.” Legislative Studies Quarterly 35 (1): 117-143.
Kessler, Daniel and Keith Krehbiel. 1996. “Dynamics of Cosponsorship.” American Political
Science Review 90(3):555-566.
Krehbiel, Keith. 1995. “Cosponsors and Wafflers from A to Z.” American Journal of Political
Science 39(4):906-923.
Martin, Andrew D. and Kevin M. Quinn. 2002. “Dynamic Ideal Point Estimation via Markov
Chain Monte Carlo for the U.S. Supreme Court, 1953-1999.” Political Analysis
10(2):134-153.
McCarty, Nolan, Keith T. Poole and Howard Rosenthal. 2001. “The Hunt for Party Discipline
in Congress.” American Political Science Review 95(3):672-687.
Peress, Michael. 2009. “Estimating Proposal and Status Quo Locations Using Voting and
Cosponsorship Data.” Working paper.
21
Poole, Keith T. and Howard Rosenthal. 1997. Congress: A Political-Economic History of Roll
Call Voting. New York: Oxford University Press.
Talbert, Jeffery C. and Matthew Potoski. 2002. “Setting the Legislative Agenda: The
Dimensional Structure of Bill Cosponsoring and Floor Voting.” Journal of Politics
64(3):864-891.
Treier, Shawn. 2010a. “Comparing Ideal Points across Institutions and Time.” Working
paper.
Treier, Shawn. 2010b. “Ideal Point Estimation Using Overlapping Constraints in the
Senate.” Working paper.
22
Figure 1 Changes in Legislators' Ideal Points with a Linear Trend
0 2 4 6 8 10
Idea
l Po
int
Session
Redistriced Memberor MemberSwitching fromHouse to Senate
Member w/ aPrimary Challenge
Retiring Member
Senator FacingPeriodic Reelection
23
Figure 2 Changes in Legislators' Ideal Points with a Polynomial Trend of Degree Five
0 2 4 6 8 10
Idea
l Po
int
Session
Redistriced Memberor MemberSwitching fromHouse to Senate
Member w/ aPrimary Challenge
Retiring Member
Senator FacingPeriodic Reelection
24
Figure 3 Representation of Roll Call/Cosponsorship Matrix

25
Figure 4 Estimated Ideal Points (Posterior Means)
-1.0 -0.5 0.0 0.5 1.0
01
23
4
107th House
Ideal points
Density
-1.0 -0.5 0.0 0.5 1.0
01
23
4
Density
Democrats
Republicans
Median
Democrats
Republicans
Median
-1.0 -0.5 0.0 0.5 1.0
0.6
0.8
1.0
1.2
1.4
01
Democrats
Republicans
Median
-1.0 -0.5 0.0 0.5 1.0
0.6
0.8
1.0
1.2
1.4
0
1
Democrats
Republicans
Median

26
Figure 5 Comparison with Common Space Scores
Sen. Zell Miller 108
Rep. Ron Paul
Rep. James Traficant 107
Sen. Russ Feingold
Pres. Bush 107
27
Figure 6 Movement in Legislators' Ideal Points across Congresses
Pres. George W. Bush
Sen. Zell Miller
Sen. Jim Jeffords (Ind.)
28
Figure 7 Movement of Senators' Ideal Points after Reelection
Pat Roberts
Chuck Hagel
Susan Collins
Joe Biden
Jack Reed

29
Table 1 Members Who Moved the Most Between the 107th and 108th Sessions
Biggest Movers to the Right
Avg. Change
Initial Ideal Point Explanation for Movement
1 Pres. George W. Bush (R) 0.446 0.627 strengthened by Republican midterm victories and post-9/11 popularity
2 Rep. Nick Smith (R-MI) 0.399 0.370 retired in 2004 (announced decision in December 2002)
3 Rep. Jeff Miller (R-FL) 0.389 0.603 2002 was first election after winning seat in a 2001 special election
4 Rep. Bob Filner (D-CA) 0.384 -1.353 redistricting threat and possible Latino primary challenge in maj.-min. district in 2002
5 Sen. Zell Miller (D-GA) 0.362 0.110 retired in 2004 (announced decision in January 2003)
6 Rep. Peter DeFazio (D-OR) 0.341 -0.786 considered running for the Senate in 2002 7 Sen. Jeff Sessions (R-AL) 0.340 0.390 reelected for the first time in 2002 after a close
race in 1996 8 Rep. Nathan Deal (R-GA) 0.340 0.600
9 Rep. Johnny Isakson (R-GA) 0.325 0.448 ran for the Senate in 2004, facing competition from conservatives in the primary
10 Rep. Ernest Istook (R-OK) 0.320 0.368 redistricting threat in 2002; considered running for the Senate in 2004
Biggest Movers to the Left Avg.
Change
Initial Ideal Point Explanation for Movement
1 Rep. Lynn Woolsey (D-CA) 0.287 -0.743 faced a primary challenge from a moderate in 2002 2 Rep. John Lewis (D-GA) 0.287 -0.713
3 Sen. Tom Harkin (D-IA) 0.268 -0.278 faced a strong general election challenger in 2002 4 Sen. John Kerry (D-MA) 0.264 -0.257 ran for president in 2004 (missed a lot of votes in
the 108th) 5 Rep. Jesse Jackson, Jr. (D-IL) 0.256 -0.598
6 Sen. Jim Jeffords (I-VT) 0.247 0.085 post-party-switch positioning to run as a Democrat or liberal independent in 2006
7 Sen. John Edwards (D-NC) 0.243 -0.154 ran for president in 2004 (missed a lot of votes in the 108th)
8 Sen. Dick Durbin (D-IL) 0.223 -0.296 reelected for the first time in 2002 9 Sen. Robert Byrd (D-WV) 0.217 -0.125
10 Rep. Lois Capps (D-CA) 0.209 -0.418 faced a well-financed general election opponent in 2002