Anatomy of the Italian occupational structure
36
Anatomy of the Italian occupational structure: organization, knowledge and power beyond RBTC Armanda Cetrulo, Phd student at Scuola Superiore Sant’Anna Dario Guarascio, National Istitute for Public Policies Analysis Maria Enrica Virgillito, Assistant Professor at University of Milano La Cattolica International conference INAPP, 29-30 November 2018 The socio-economic impact of technological change Project under the research agreement between INAPP and Scuola Superiore Sant’Anna
Transcript of Anatomy of the Italian occupational structure
Anatomy of the Italian occupational structure:
organization, knowledge and power beyond RBTC
Armanda Cetrulo, Phd student at Scuola Superiore Sant’Anna
Dario Guarascio, National Istitute for Public Policies Analysis
Maria Enrica Virgillito, Assistant Professor at University of Milano La Cattolica
International conference INAPP, 29-30 November 2018
The socio-economic impact of technological change
Project under the research agreement between INAPP and Scuola Superiore Sant’Anna
This work intends to present an anatomy of the Italian occupational structure addressing the question of which factors determine wages.
This will be done accounting for differences across occupational groups and trying to disentagle the role played by technological change, exploiting the rich and highly detailed amount of data of ICP, both in terms of quantitative and qualitative information.
Aim of the (on-going) work
• The debate goes back to Smith, Ricardo and Marx.
• Schumpeter claims that : “The fundamental impulse that sets and keeps the capitalist engine in motion comes from the new consumers goods, the new methods of production or transportations, the new markets, the new form of industrial organization that capitalist enterprise creates” (Schumpeter, The theory of economic development (1961, p.82-83)
• Neoclassical approach initially looks at technological change as an “exogenous factor” (Solow,1956), gradually revised by the endogenous growth theory.
• Evolutionary scholars offer a different analysis of technological change, seen as a complex phenomenon intrinsically embedded in economic dynamics, shaped by institutions, capabilities and interactions among agents (Nelson and Winter,1982; Dosi ,1988).
TECHNOLOGICAL CHANGE AND LABORTHEORETICAL BACKGROUND (1)
THEORETICAL BACKGROUND (2) TECHNOLOGICAL CHANGE, LABOR AND WAGE
• According to mainstream perspective, wages are determined in equilibrium, given by the marginal contribution of individual productivity to the production.
• Relaxing some of the neoclassical assumptions (i.e. perfect competition of the labor market, identical workers), a still exogenous technology can produce different outcomes, favouring the more skilled (SBTC) or the workers employed in jobs with a low degree of routinariety (RBTC). This process will be reflected in employment and wage dynamics.
• From an evolutionary perspective, wages are not simply the result of individual productivity. They depend on the degree of knowledge workers have, their position inside the organization, the control they exert vs others. From a heterodox viewpoint wages reflect power relations among classes and strenght of institutions.

CURRENT DEBATE on JOB POLARIZATION
Employment shares grow among high skill-high wage jobs and low skills-low wage jobs (SBTC).
Jobs with repetitive tasks are being substituted by technology, whereas jobs with abstract (i.e. creativity) or non routine manual tasks (i.e. with high physical dexterity) are less likely to be displaced by new technology (RBTC).
While high wage jobs and low wage jobs are increasing, the number of middle wage jobs decreases.

9.81
6.80047
17.6724
-1.93127
-5.57343-5
05
1015
20Em
ploy
men
t gro
wth
201
1-20
16
1 2 3 4 5
Employment growth over RTI quintiles
12.555
-3.80114
-2.37612
3.98764
13.7856
-50
510
15Em
ploy
men
t gro
wth
201
1-20
16
1 2 3 4 5
Employment growth over wage quintiles
Employment dynamics over the period 2011-2016 seem partly consistent with RBTC (see Guarascio et al. 2018)
What about Italy?
𝑅𝑇𝐼j,t = 𝑅𝐶j,t + 𝑅𝑀j,t − (𝑁𝑅𝐶𝐴j,t + 𝑁𝑅𝐶𝐼j,t + 𝑁𝑅𝑀j,t + 𝑁𝑅𝑀𝐼𝐴j,t )
from Autor and Dorn (2013)
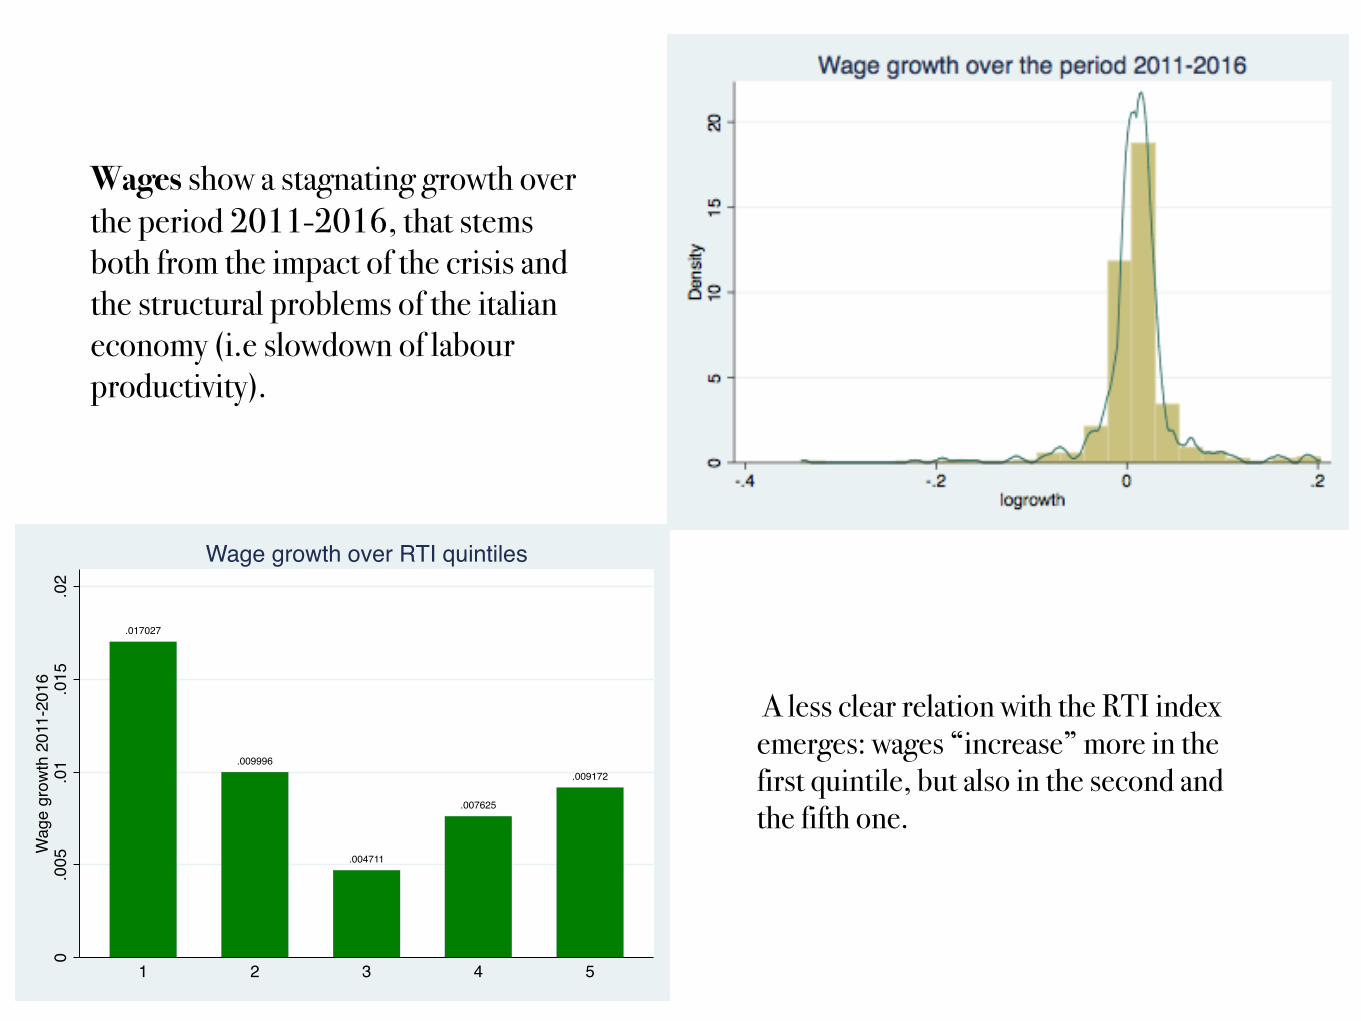
Wages show a stagnating growth over the period 2011-2016, that stems both from the impact of the crisis and the structural problems of the italian economy (i.e slowdown of labour productivity).
.017027
.009996
.004711
.007625
.009172
0.0
05.0
1.0
15.0
2W
age
grow
th 2
011-
2016
1 2 3 4 5
Wage growth over RTI quintiles
A less clear relation with the RTI index emerges: wages “increase” more in the first quintile, but also in the second and the fifth one.
59.228
66.4171
54.8671
44.3317
50.4179
36.5266
25.3206
22.2806
0 20 40 60 80RTI index
8-Elementary occupation
7-Plant & machine operators
6-Crafts, agric. & specialised workers
5-Service & sale workers
4-Clerical support workers
3-Technicians professionals
2-Intellectual & scientific workers
1-Legislators,managers,entrepreneurs
RTI across occupational groups-1
00
1020
30gr
owth
rate
1 2 3 4 5 6 7 8
Employment growth rate 2011-2016
0.0
1.0
2.0
3.0
4gr
owth
rate
1 2 3 4 5 6 7 8
Wage growth rate 2011-2016
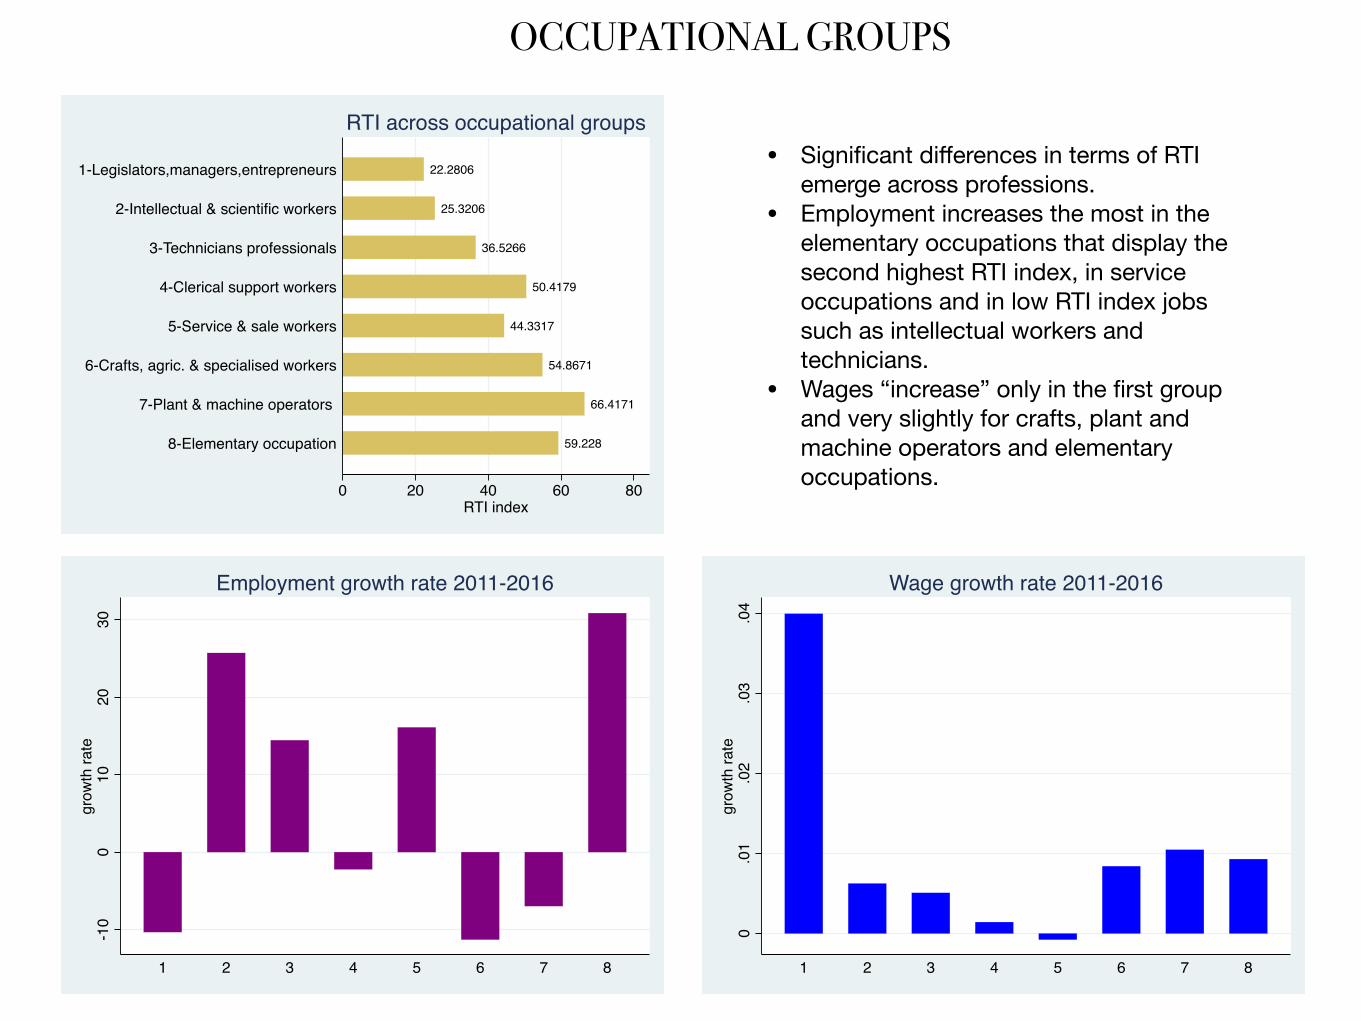
• Significant differences in terms of RTI emerge across professions.
• Employment increases the most in the elementary occupations that display the second highest RTI index, in service occupations and in low RTI index jobs such as intellectual workers and technicians.
• Wages “increase” only in the first group and very slightly for crafts, plant and machine operators and elementary occupations.
OCCUPATIONAL GROUPS
11 111 1
1 1 1 111
11 11 1
1 1 1 111
1 1 1 11 11 111 1 11 1111 1
1111 1 1
111 1 11
1 1111 1
11 1 11 111 11 11
11 11 11
1 11 11 1
1 1111 1
111 11 1
1111 11
1 111 1 1
111 1
11 11 1 1
11 111 111 1 11 1
1 111 1 1
1 11111 1 11 11 11 111 1 1
111 11 11 11 1 1 1
11 1 1 1 1
11 1 11 1
111 11 1
1 1 1 11 1
11 11 1 1
1 11 11 1
1 111 1 1
1 11 11 111 1 11 111 1 1 1 1
111 1 11
1 11 11 1
11 11 1 1
11 1 1 11
11 1 1 1 1
1 11111
1 1111 1
11 1 11 1
1 111 11
1 11 11 1
11 11 11
22 222 2
22222 2
222 22 2
2 22 2222 2 2 22 2
22222 2
2 222 2222 222 2
22 2 2222 22222
22 222 22 22 22 2
2 22222
22 222 222 2 222
2 222 22
2 222 22
2 2222 2
22 2 222 2 2 2222
22 2222 222 2 22
22 2 222222 222
22 2222
2 222 22
2 2 22 22
2 22 2 2 2
222222
2 22222
22 2222
22 2 22 2
22 2 222
22 2222
2 222 22
22 2 222
2 2 2 22 2222 2
22 2 222
2 22 22 2
2222222 22 2 22
2 2222 2
2 2 222 2
22 2 22 2
22 222 2
2 2 222 2
22 222 2 2 222 2 2
2222 22
222 22
2 2 2 222
22 22 2 2
22222 2
2 222 22
222 222
22 2 22 22 2222 2
2 2 22 2222 2 222
22 22 22
22 2 2 2222 2 2 22 22 2 222
222 222
2 22 2222222 22
2 2222 22222 22
222222
222 222
222222
22222222222 2
222 222
2 2222 2
222222
2 22 222
333 3 33
333 333
33 3 33 3
333 33333 33 33
33 3 33333 3 33 3
333 333
333 33 333 333 3
3 33 3 33
3333 33
3 3 3333
3333 33333 3 33
333 333
3 33333
3 3333 33 3 33 3 3
33 33 3 3
333 333
3333 33
33 333 33 33 333
333 333
3 333 33
33 333 3
3 3 3333
3 3 3 3 33
3333 33
33 33 33
3 333 33
3 3 33 33
333333
3 33333
333333
333333
333 3 33
3 33 3 33
3 33333
33 3 33 3
3333 33
3 3 33 33
33 3333
3 3 33 33
333 333
333 333
3 3333 3
3 3 3333
3333 33
333333
33 3 33 3
33 3333
3 3333 3
3 33 33 33 333 33
333333
3 33333
333333
3 333 3 3
33333 3
33333 3
333333
3 33 3 33
3 3 3 333
3 333 33
33 3333
3 33 33
333 33 3
3 333333 333 33
3333 33
33 3333
3 33333
3 33 333
33 3 333333 333 3 33 333
33 333 3
3 33 333
3 3 33 33
33 333 3
33 33 3 33 333 33
333 33 333 33 33
3333 33
33 33 33
33333 3
3 333 33333 333
333 33 3
333 333
3 33 333
333333 33 33 33
33 333 3
333 3 33
444444
444 444
4444 44
444444
4 4444 4444444
444 44 4444 444
44444444444 4
44 4444
444444
4 444 44
444444
4444 44
44444 4
4444 44
4444 44
444 444
4444 44444 444
444 444
44 4444
4 444 44
4 4 4444
444 4 4 4
44444 4
444444
444 444
44444 4
5 55 555
555 555
55 5 55
555555
555555
5 5 5555
5 55 555
555555
5 555 55555 5
555 555
5 555 5 5
555 5 55
55 55 5 5
55555 5
5555 55 55555555 5555
55 5555
5 5 5555
55 55 5 5
55555 5
5555 55 5 55 555
5 555 5 5
55 5 5
555 5 55
555 555
5 555 55555 5 55
555555
555555
555 555 555 5 5
5 555 5 5
555 5 55
55 55
5 55 5 55
55 5 55 5
55555 5
555 5 55
555555
555555
555555
555 555
55
666 6 66
66666 66 66
66666 6666666
6666 66
6 66 66 6
6 66 6 6666 6 666
6666 66
6666 66
666666
66 666 6
66 6 666
666666
6 666 6 6666666
66 666 6
666666
6 666 66
666 6 66
6 66 6666 666 66
666 66 6
66 6 66 666 666 6
666 66 6
6 6 6 666
6 66 66 6
6666 6 6
6 66666 666 6 6 6
6 666 66
666666
66 6 6 66
66 666 6
6 6 66 66
66 66666666 66
6666 66
6 66 666
666 66 6
66 66 66
666666 6666 66
66 66 66
6 66 66 6
666 6 66
666 66 6
6666 66
6 66 6 66
66 66 66
66 66666 666 66
6 6666 66
66 666 6
66 6666
6 66 66 6
6 66 666
66 66 6 6
6666
666 66 6
6 6 66 66
6666 66666 6 66
66666 6
666 666
66 6 666
6 6 66 66
6 6 6666
666 66 6
6666 6 6
66 666 6666 66 66666
666 6666 666 66
6666 66
666 666
66 6
666 666
666666
66 6666
66 66 6
66 6 666
66 666 6
66 6666
6 66 666
6666 6 6
666 6 6 6
6 6666 6
666 6 66
6 66666
6666 6 6
6666 66
66 6 6666 666666 6666 6
66 66 6 6
6 6 66 66
777777777 7 77
7 77 7 77
77777 7
77 7 777
77 7 77 7
777 777
777 77 7
7 77 777
77 777 7
777 77 7
77 7 77 7
7 77 7777777 77
7 7 77 777 7 77 77
7 77 777
77777 7
777 7 777777 77
777 7 77
77 777 7
7 7 7 77 7
7777 77
77 7777
7 7 77 77
77 7 77 7
77 7 77 7
7777 77
777 777
7 77 7 77
7 77777
77 777 777 7 7 77
7777 77
77 777777 777 7
777 777
777 7 77
7777 77
77777 7
7 77 777
777 7 7 7
7 77777
7777 77
777 777
777777
7 77 777
77 7 7 77
777 77 7
77 7 777
777 777 7 7777 77777 77 777 7777777 77
7 77 777
7 77 7 77
77 77 77
777 7
77 77 7 7
777 77 77 77 777
77 7777
7777 77
777777
777 77 7
77 7777
77
777 777
7 7 777 7
7 77 777
77777 7
777 7 7777 7777
777 777
777 7 77
77 7777
7777 778888 88
8
88888 88 8 8888
888888
888 888
888888
888 8 88
8 888 88
8888 88
888888
88 8888
888 888
8888 88
888 888
8 888 8 8
888888 888888
888 888 88888 8
88888 8
88 88 8 8
8 8 888 8
8 88 888
8888 88
88888 8
020
4060
8010
0R
TI
0 1000 2000 3000 4000 5000Median wage
RTI and wages
xTechnicians and associate professionals
Clerical support workers
Legislators, Managers, Entrepreneurs
Intellectual and scientific workers
Craft workers, agriculture and specialised workers
Plant and machine operators
Elementary occupations
Service and sales workers++
RTI INDEX AND WAGES BY OCCUPATIONAL GROUPS
Which are the important factors we should take into account in order to study the impact of
technological change (and the key mediating role of skills, knoweledge and organisational elements) on
work and wages distribution?
- very preliminary stage -
Our research question
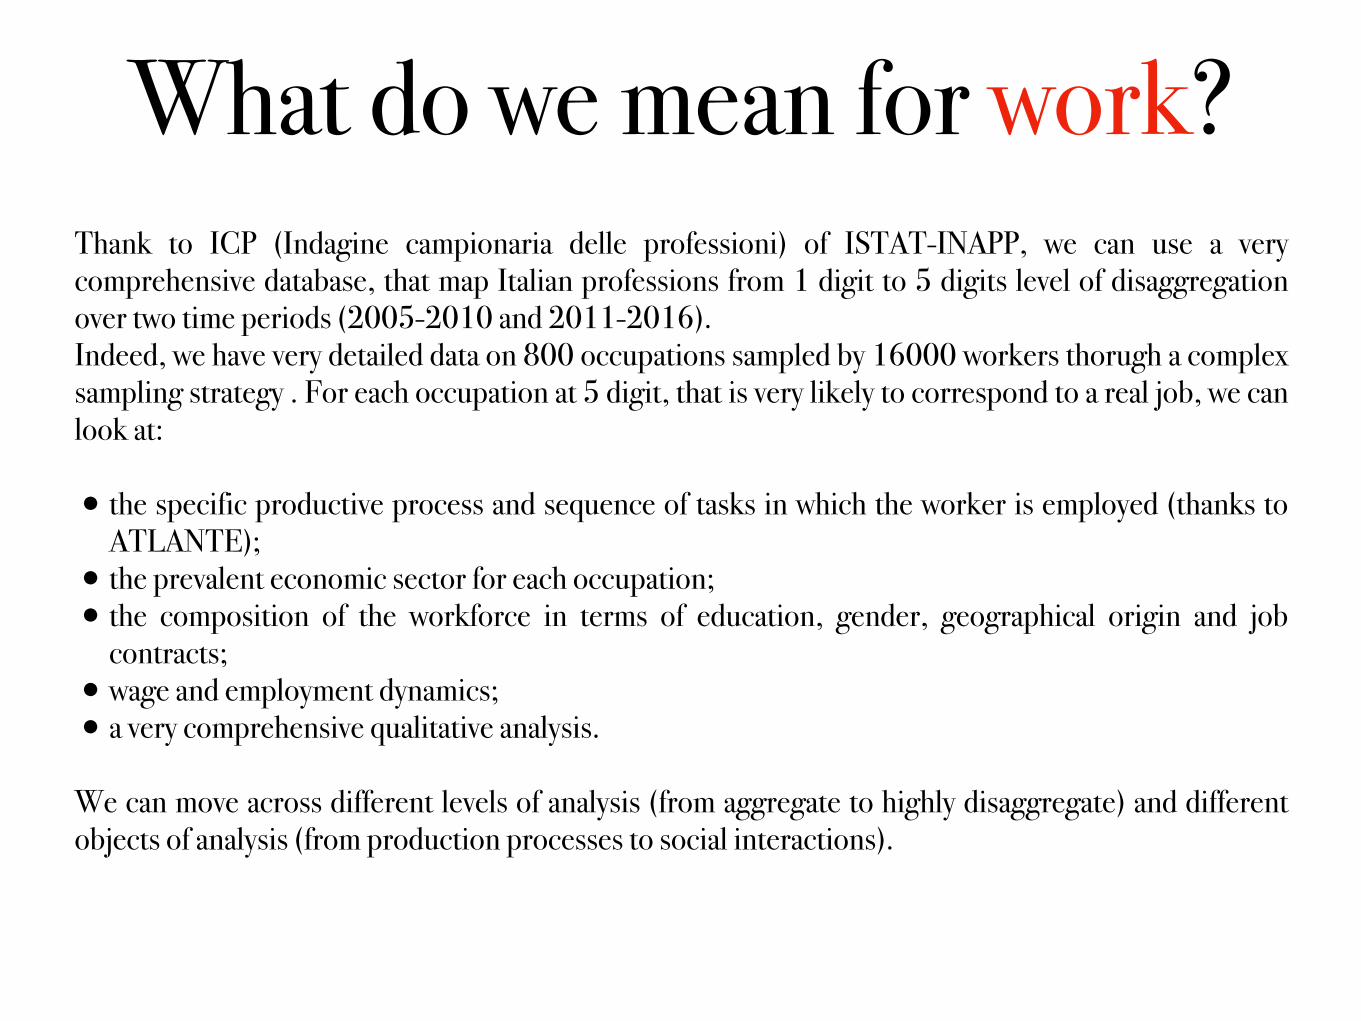
What do we mean for work?Thank to ICP (Indagine campionaria delle professioni) of ISTAT-INAPP, we can use a very comprehensive database, that map Italian professions from 1 digit to 5 digits level of disaggregation over two time periods (2005-2010 and 2011-2016). Indeed, we have very detailed data on 800 occupations sampled by 16000 workers thorugh a complex sampling strategy . For each occupation at 5 digit, that is very likely to correspond to a real job, we can look at:
•the specific productive process and sequence of tasks in which the worker is employed (thanks to ATLANTE);
•the prevalent economic sector for each occupation; •the composition of the workforce in terms of education, gender, geographical origin and job
contracts; •wage and employment dynamics; •a very comprehensive qualitative analysis.
We can move across different levels of analysis (from aggregate to highly disaggregate) and different objects of analysis (from production processes to social interactions).
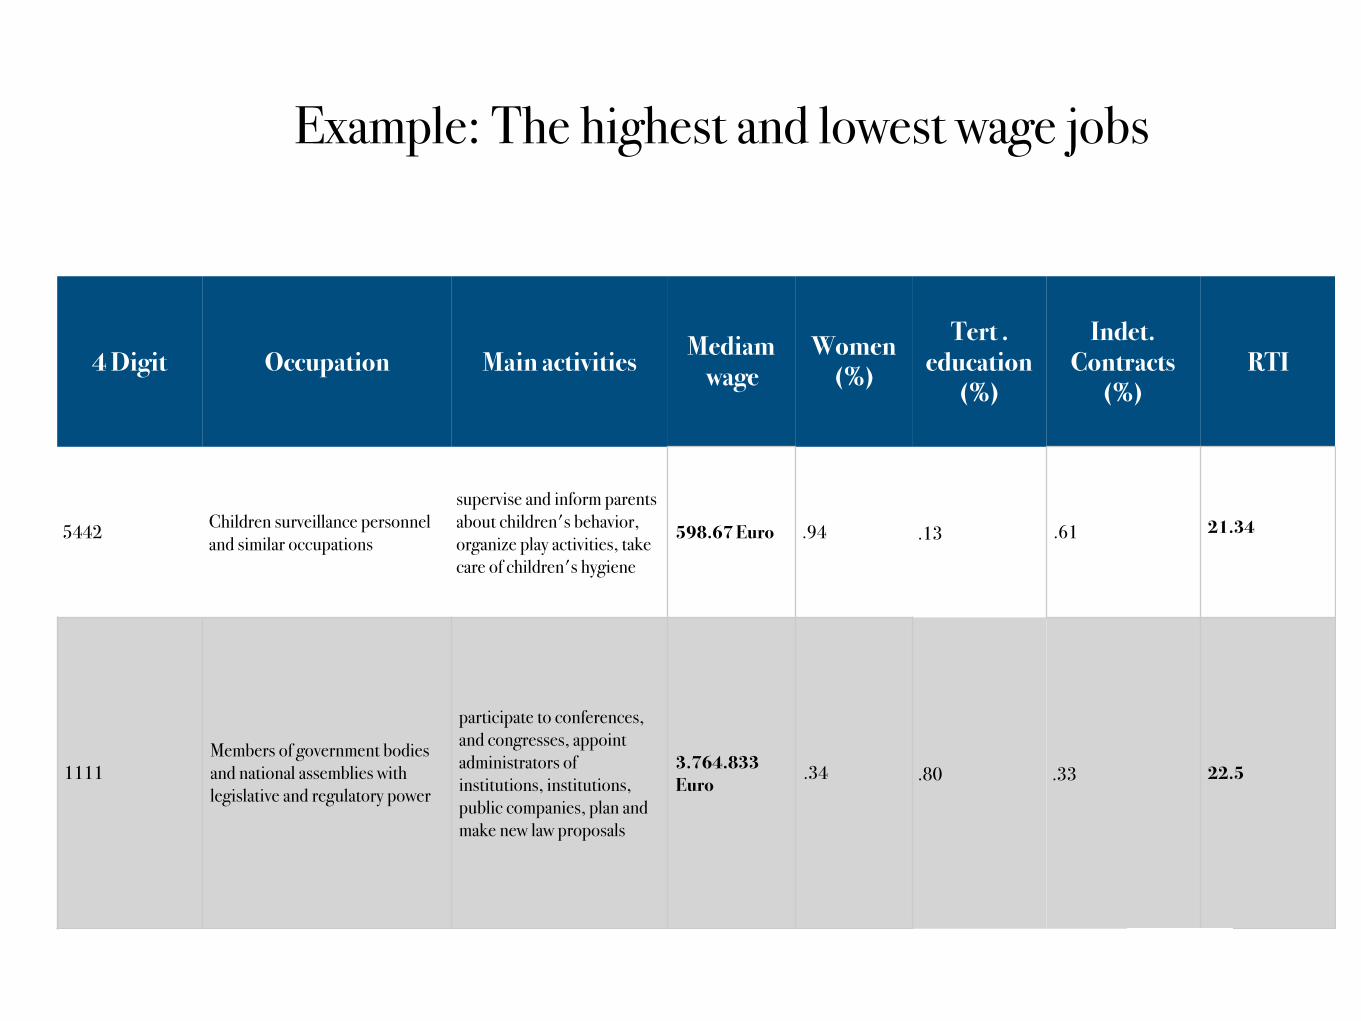
Example: The highest and lowest wage jobs
4 Digit Occupation Main activities Mediam wage
Women (%)
Tert . education
(%)
Indet. Contracts
(%)RTI
5442 Children surveillance personnel and similar occupations
supervise and inform parents about children's behavior, organize play activities, take care of children's hygiene
598.67 Euro .94 .13 .61 21.34
1111Members of government bodies and national assemblies with legislative and regulatory power
participate to conferences, and congresses, appoint administrators of institutions, institutions, public companies, plan and make new law proposals
3.764.833 Euro .34 .80 .33 22.5

We look at the concept of innovation as directly reported by the workers, thanks to a specific question present in ICP and a vast amount of micro information.
“Have external factors occurred in the last three years that have changed the way in which you work?”
Which kind of innovation has taken place? 1. Change in the used technologies 2. Change in the legislation 3. New goods or services made 4. Change in the work organisation 5. Change in the materials used
TECHNOLOGICAL CHANGE SEEN AS INNOVATION
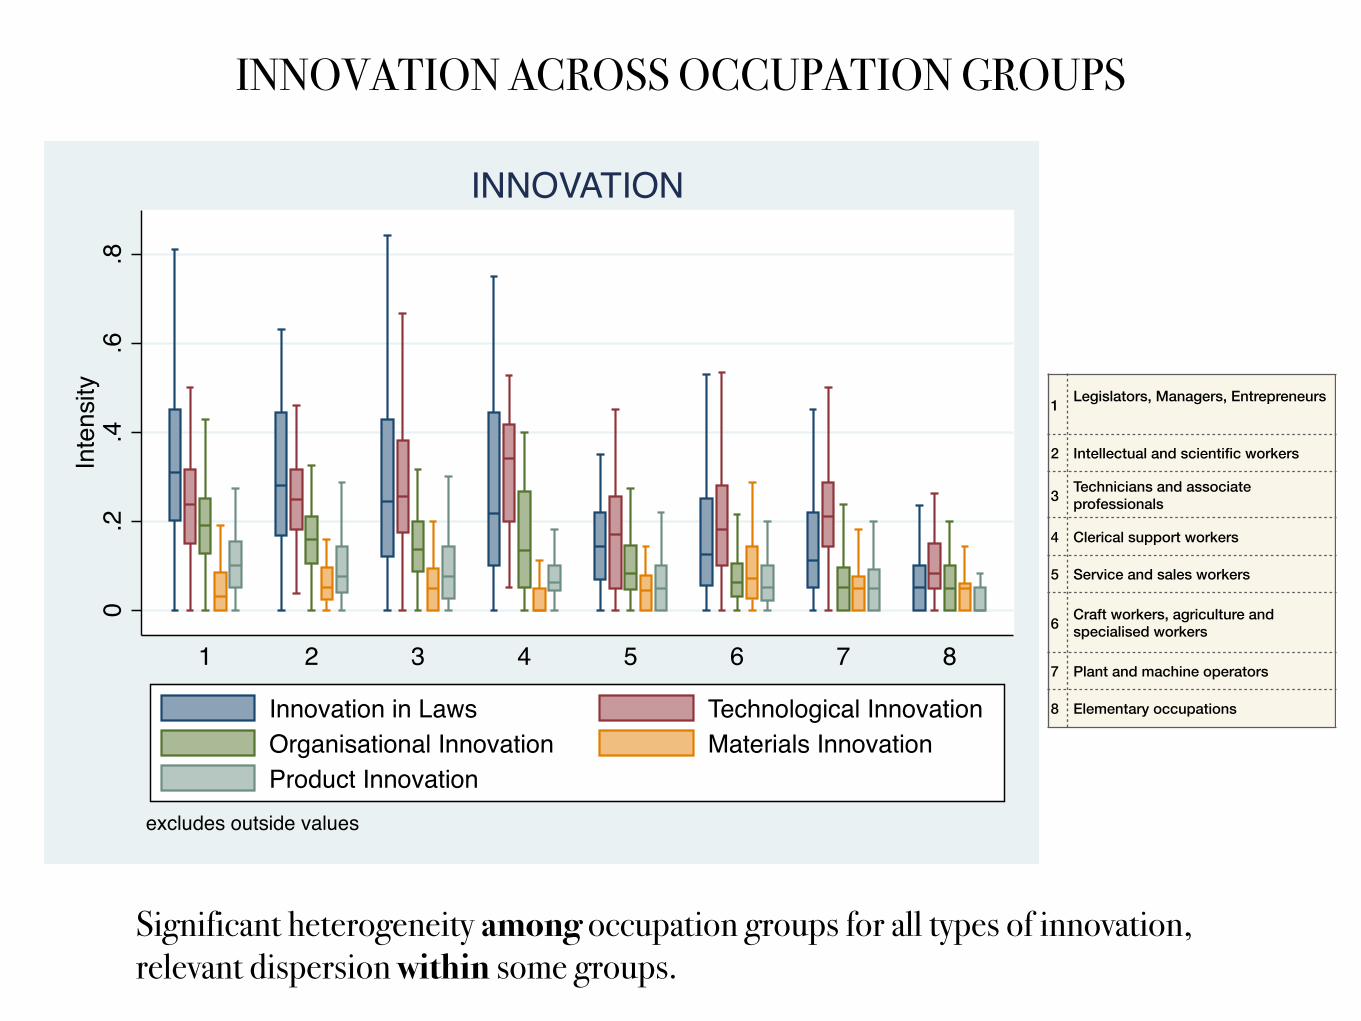
Significant heterogeneity among occupation groups for all types of innovation, relevant dispersion within some groups.
INNOVATION ACROSS OCCUPATION GROUPS0
.2.4
.6.8
Inte
nsity
1 2 3 4 5 6 7 8
excludes outside values
INNOVATION
Innovation in Laws Technological InnovationOrganisational Innovation Materials InnovationProduct Innovation
1 Legislators, Managers, Entrepreneurs
2 Intellectual and scientific workers
3 Technicians and associate professionals
4 Clerical support workers
5 Service and sales workers
6 Craft workers, agriculture and specialised workers
7 Plant and machine operators
8 Elementary occupations
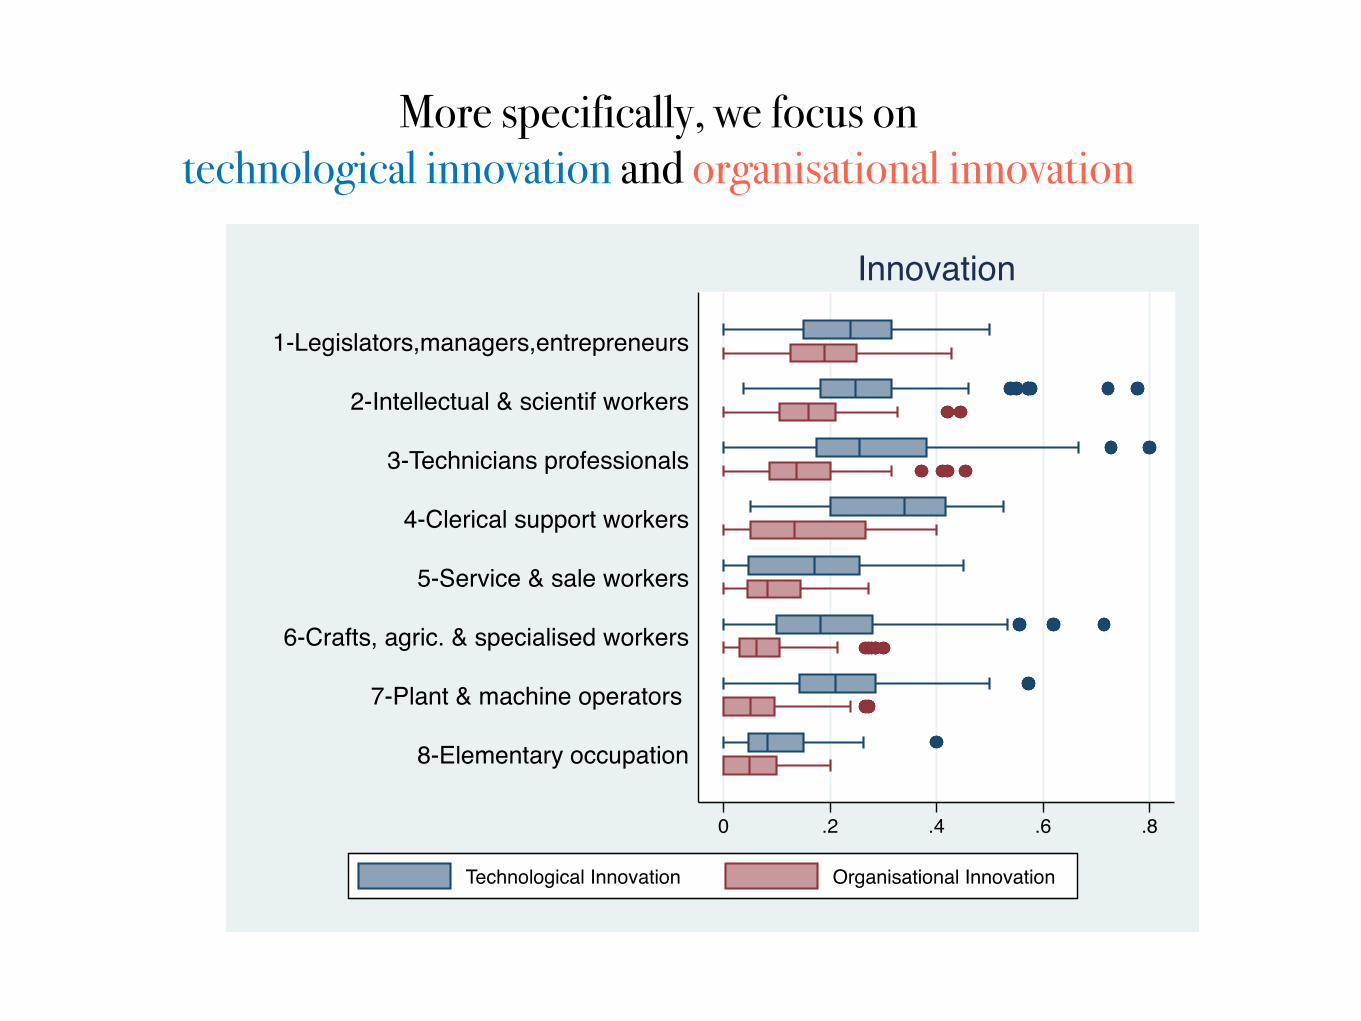
More specifically, we focus on technological innovation and organisational innovation
0 .2 .4 .6 .8
8-Elementary occupation
7-Plant & machine operators
6-Crafts, agric. & specialised workers
5-Service & sale workers
4-Clerical support workers
3-Technicians professionals
2-Intellectual & scientif workers
1-Legislators,managers,entrepreneurs
Innovation
Technological Innovation Organisational Innovation
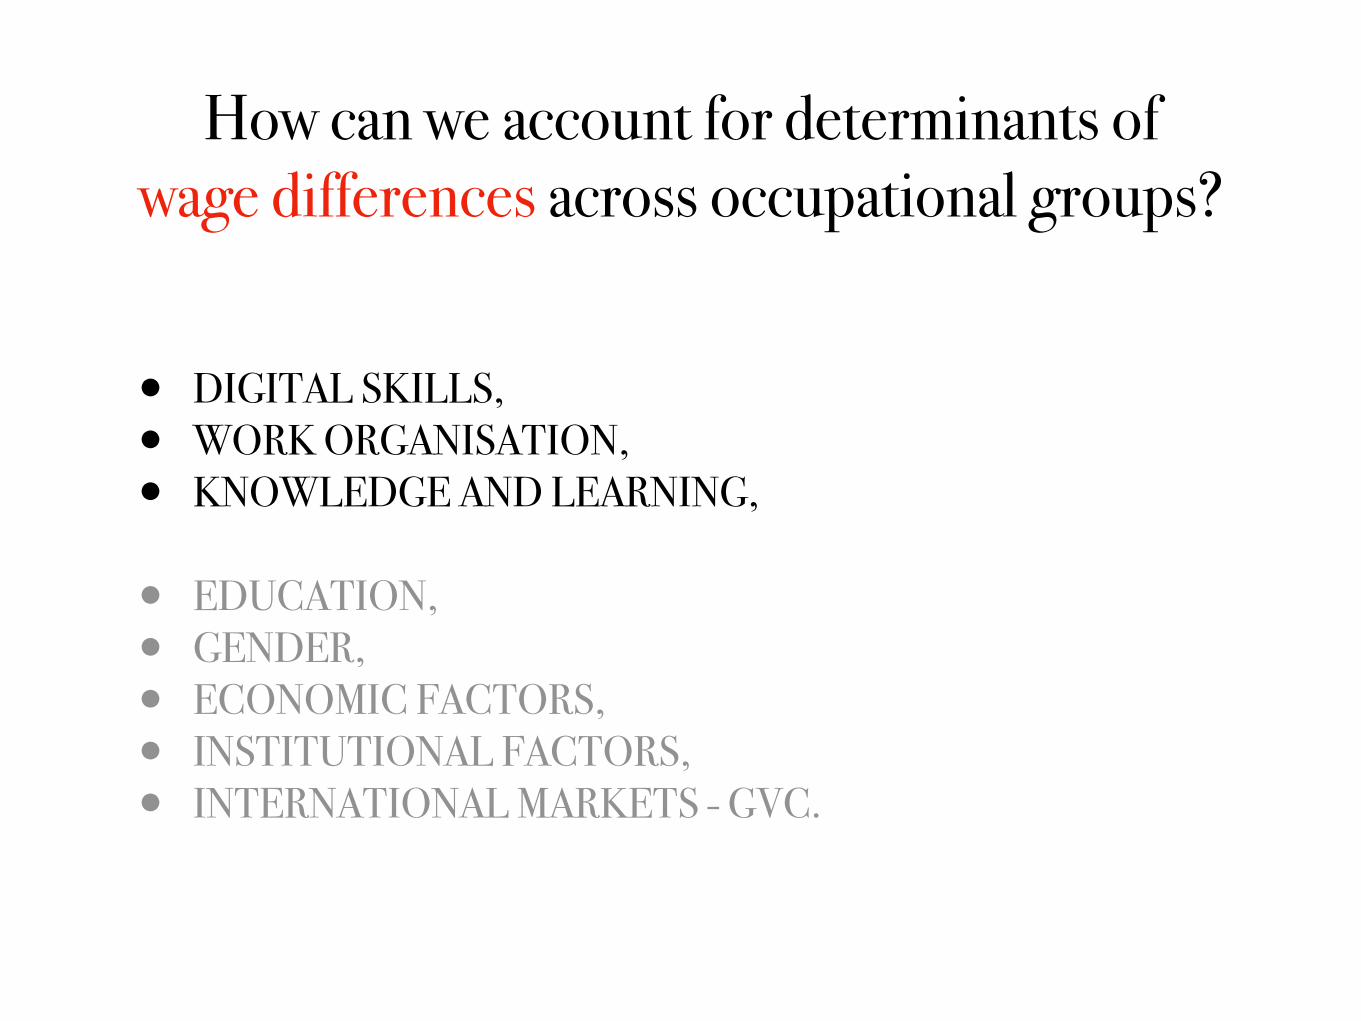
How can we account for determinants of wage differences across occupational groups?
• DIGITAL SKILLS, • WORK ORGANISATION, • KNOWLEDGE AND LEARNING,
• EDUCATION, • GENDER, • ECONOMIC FACTORS, • INSTITUTIONAL FACTORS, • INTERNATIONAL MARKETS - GVC.

DIGITAL SKILLS*
KNOWLEDGE OF INFORMATICS AND
ELECTRONICS - from normal user to expert
USE OF PERSONAL COMPUTER AND
SOFTWARES - from normal user to expert
USE OF MAIL ADDRESS required by the job
Correlation matrix *significance at 1%Median wage Tech Innovation Org Innovation ICTknow ICTknowC PCuse PCuseC Mailuse
Median wage 1.0000
Tech Innovation 0.1480* 1.0000
Org Innovation 0.3605* 0.3283* 1.0000
ICTknow 0.3210* 0.4280* 0.2802* 1.0000
ICTknowC 0.3496* 0.4354* 0.2892* 0.9791* 1.0000
PCuse 0.4465* 0.4380* 0.4518* 0.8004* 0.8085* 1.0000
PCuseC 0.4847* 0.4242* 0.4369* 0.7975* 0.8301* 0.9686* 1.0000
Mailuse 0.4867* 0.3418* 0.4916* 0.6332* 0.6653* 0.8523* 0.8498* 1.0000
*Consistent with Eurostat definition of “e-skills”, see DESI
All digital skills correlate positively with technological, organisational innovation and wages. In particular, the use of personal computer (especially if for complex tasks) shows the highest correlation values in line with RBTC theory.
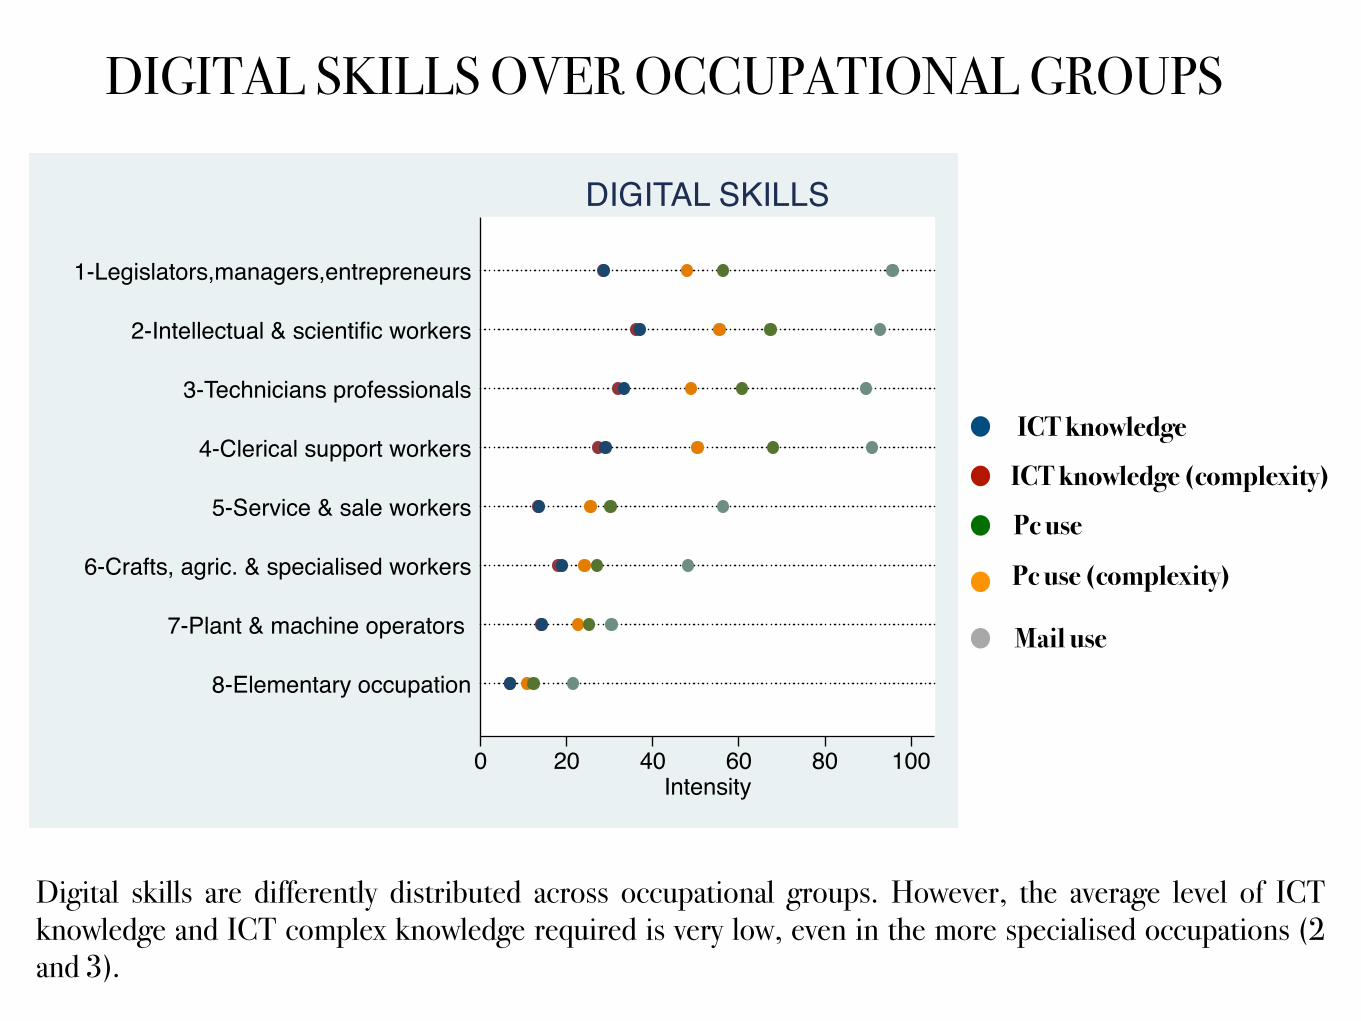
Digital skills are differently distributed across occupational groups. However, the average level of ICT knowledge and ICT complex knowledge required is very low, even in the more specialised occupations (2 and 3).
0 20 40 60 80 100Intensity
8-Elementary occupation
7-Plant & machine operators
6-Crafts, agric. & specialised workers
5-Service & sale workers
4-Clerical support workers
3-Technicians professionals
2-Intellectual & scientific workers
1-Legislators,managers,entrepreneurs
DIGITAL SKILLS
Pc use (complexity)
Pc use
ICT knowledge (complexity)
ICT knowledge
Mail use
DIGITAL SKILLS OVER OCCUPATIONAL GROUPS
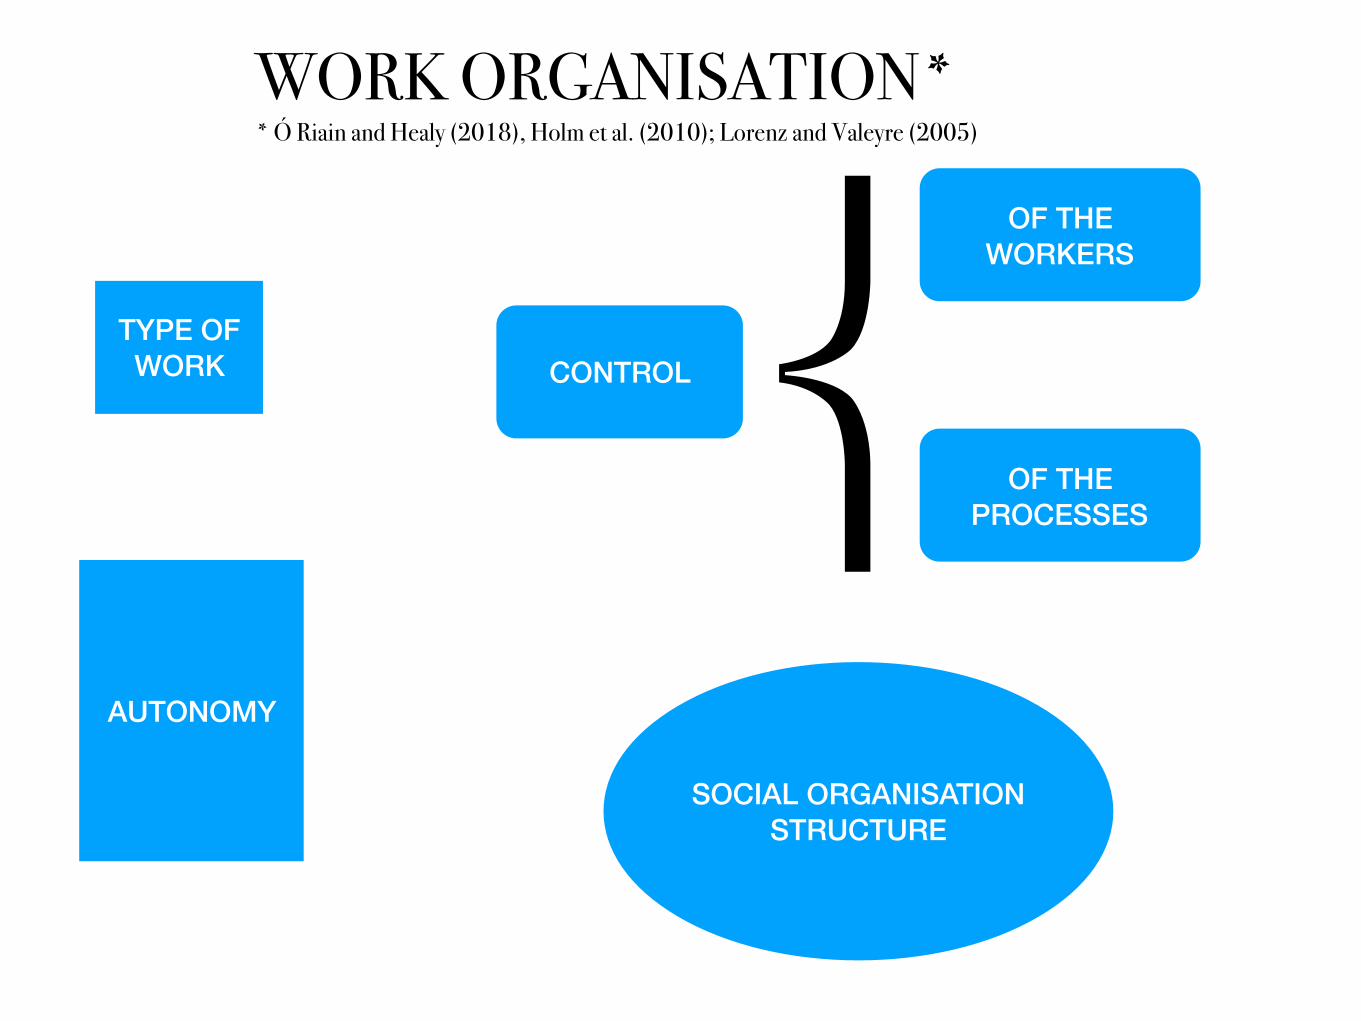
WORK ORGANISATION* * Ó Riain and Healy (2018), Holm et al. (2010); Lorenz and Valeyre (2005)
AUTONOMY
CONTROL ⎨OF THE
WORKERS
OF THE PROCESSES
SOCIAL ORGANISATION STRUCTURE
TYPE OF WORK

WORK ORGANISATION
CONTROL ⎨OF THE
WORKERS
OF THE PROCESSES
Control, and more specifically control of the workers, can be seen as a dimension of power, following the definition of Dosi and Marengo (2015, p.4) according to which power: 1. “is the ability of ruler to determine the set of actions available to the other agents (the “ruled”)”;
2. “involves the possibility of the authority to veto the decisions or intentions of the ruled ones.”
3. “relates to the ability of the authority to influence or command the choice within the “allowed” choice set (i.e. the span of control of the “ruled”), according to the deliberations of the ruler himself”
Median wage
Tech innovation
Org innovation
Leadership
Guiding others
Guiding others
(complexity)Monitoring
other workers
Monitoring other workers (complexity)
Responsability on others
health
Responsability on others
output
Median wage 1.0000
Tech innovation 0.1480* 1.0000
Org innovation 0.3605* 0.3283* 1.0000
Leadership 0.6133* 0.2019* 0.4764* 1.0000
Guiding and motivating
others0.6528* 0.2048* 0.4557* 0.8676* 1.0000
Guiding others(compl
exity)0.6807* 0.2074* 0.4656* 0.8641* 0.9778* 1.0000
Monitoring other workers 0.5536* 0.2348* 0.4411* 0.8195* 0.8370* 0.8169* 1.0000
Monitoring other
workers(complexity)
0.5998* 0.2390* 0.4568* 0.8382* 0.8315* 0.8534* 0.9326* 1.0000
Responsability on others
health0.3040* 0.0796* 0.0701* 0.4122* 0.5468* 0.4973* 0.4128* 0.3501* 1.0000
Responsability on others
output0.4986* 0.2084* 0.2764* 0.6501* 0.8136* 0.7887* 0.6571* 0.6303* 0.7528* 1.0000
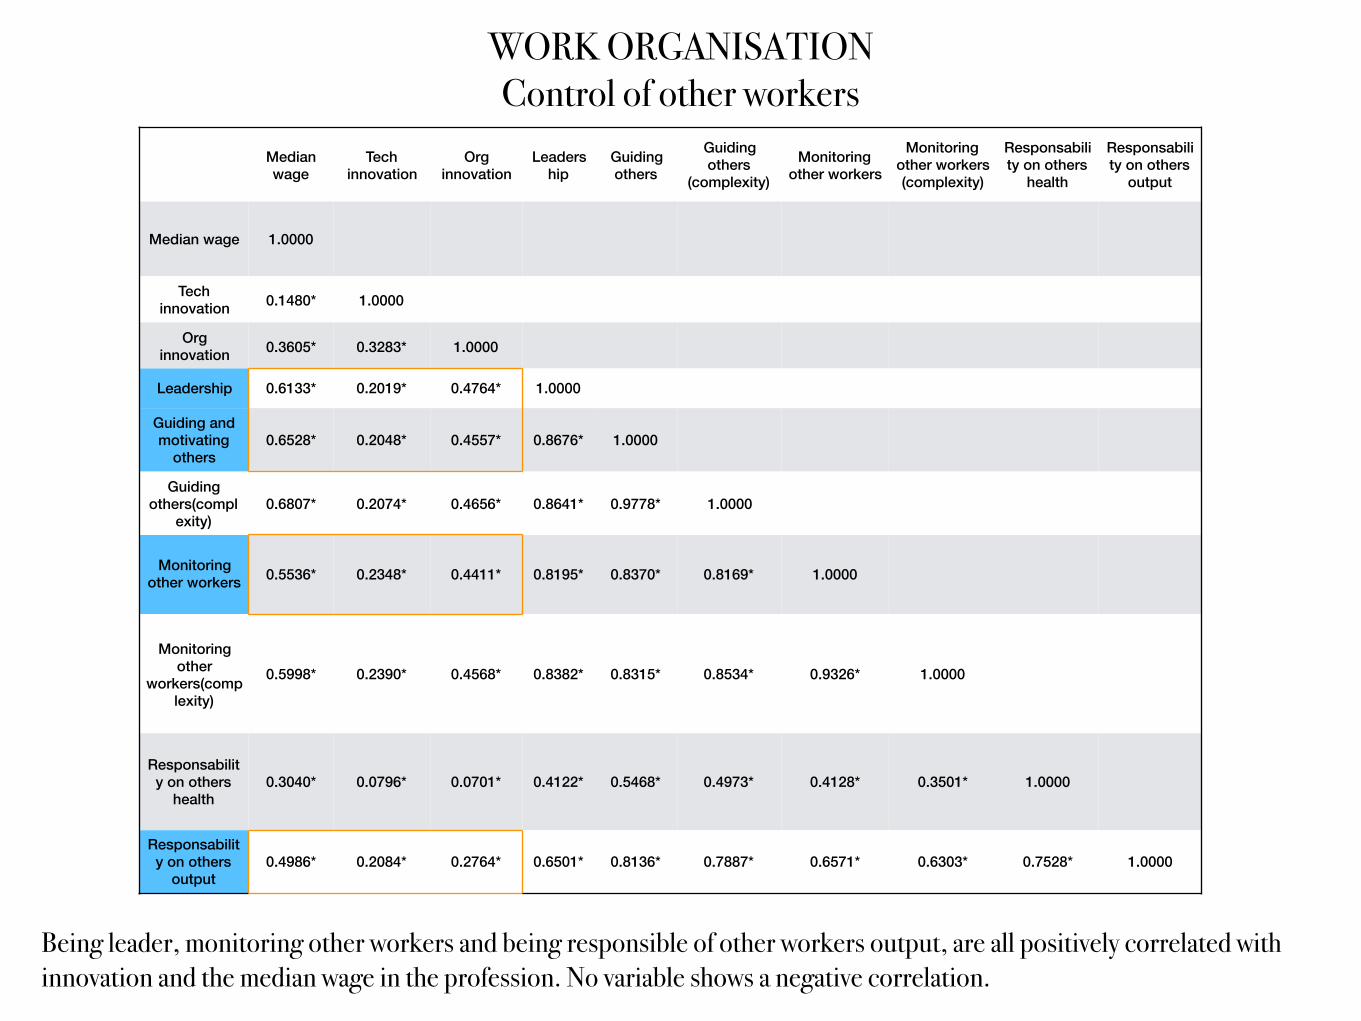
Being leader, monitoring other workers and being responsible of other workers output, are all positively correlated with innovation and the median wage in the profession. No variable shows a negative correlation.
WORK ORGANISATION Control of other workers
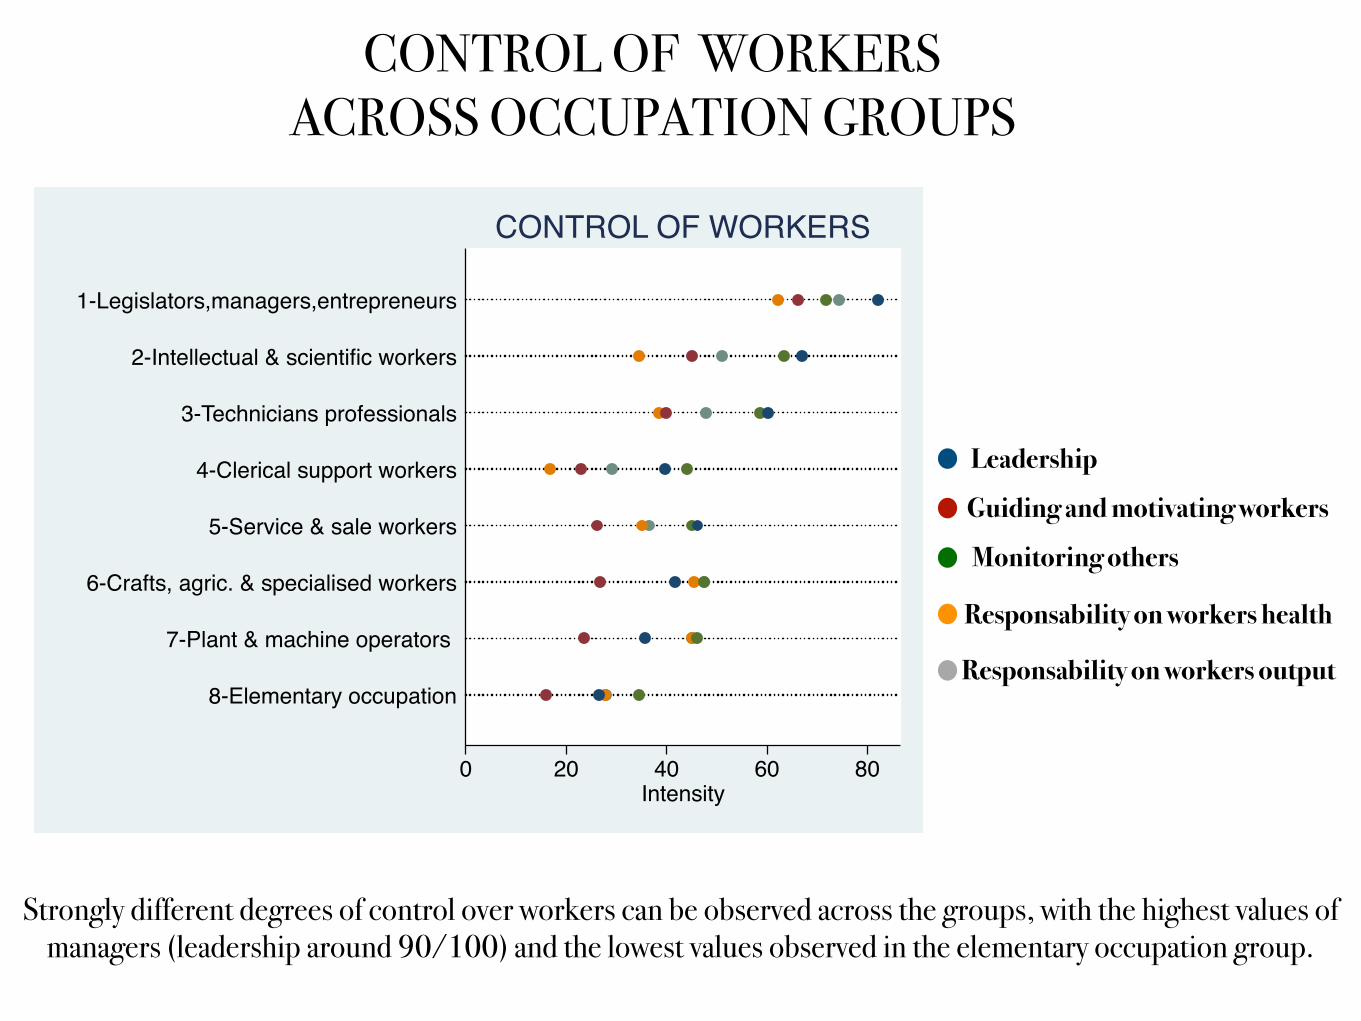
Leadership
Guiding and motivating workers
Monitoring others
Responsability on workers health
Responsability on workers output
CONTROL OF WORKERS ACROSS OCCUPATION GROUPS
0 20 40 60 80Intensity
8-Elementary occupation
7-Plant & machine operators
6-Crafts, agric. & specialised workers
5-Service & sale workers
4-Clerical support workers
3-Technicians professionals
2-Intellectual & scientific workers
1-Legislators,managers,entrepreneurs
CONTROL OF WORKERS
Strongly different degrees of control over workers can be observed across the groups, with the highest values of managers (leadership around 90/100) and the lowest values observed in the elementary occupation group.
median wage tech innovation Org innovationControlling
process and materials
Controlling process and
materials(complexity)
Operational analysis
Operational analysis(compelxi
ty)Repetitiveness Degree of
automatisation
median wage 1.0000
Tech innovation 0.1480* 1.0000
Org innovation 0.3605* 0.3283* 1.0000
Controlling process and
materials0.1996* 0.1104* 0.0897* 1.0000
Controlling process and
materials(complexity)
0.2734* 0.1263* 0.1564* 0.9362* 1.0000
Operational analysis 0.4499* 0.2351* 0.3416* 0.5867* 0.6575* 1.0000
Operational analysis(compelxi
ty)0.5086* 0.2480* 0.3591* 0.5124* 0.6366* 0.9547* 1.0000
Repetitiveness -0.5110* -0.1744* -0.4584* -0.0747* -0.1640* -0.4677* -0.5243* 1.0000
Degree of automatisation -0.1718* 0.1584* -0.1489* 0.1454* 0.0803* -0.1625* -0.1799* 0.4661* 1.0000
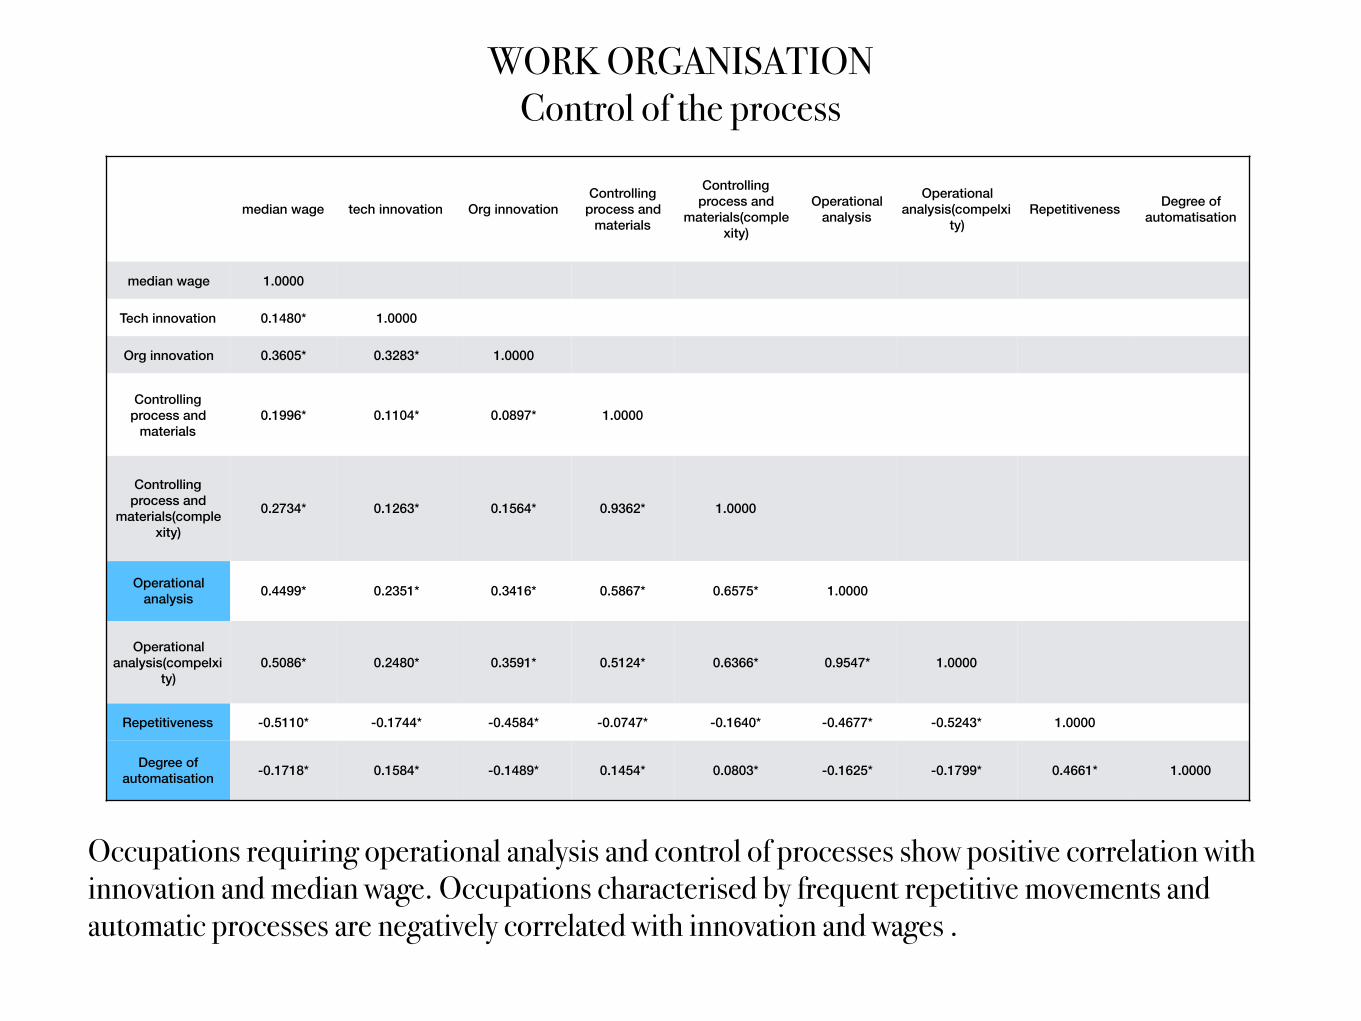
WORK ORGANISATION Control of the process
Occupations requiring operational analysis and control of processes show positive correlation with innovation and median wage. Occupations characterised by frequent repetitive movements and automatic processes are negatively correlated with innovation and wages .

CONTROL OF THE PROCESS ACROSS OCCUPATION GROUPS
Controlling processes, materials or external environments
Repetitive movementsAutomated process
Operational analysis
0 20 40 60Intensity
8-Elementary occupation
7-Plant & machine operators
6-Crafts, agric. & specialised workers
5-Service & sale workers
4-Clerical support workers
3-Technicians professionals
2-Intellectual & scientific workers
1-Legislators,managers,entrepreneurs
CONTROL OF THE PROCESS
Doing repetitive movements and working in automated processes is more frequent for plant and machine operators and very less likely for intellectual and scientific workers.
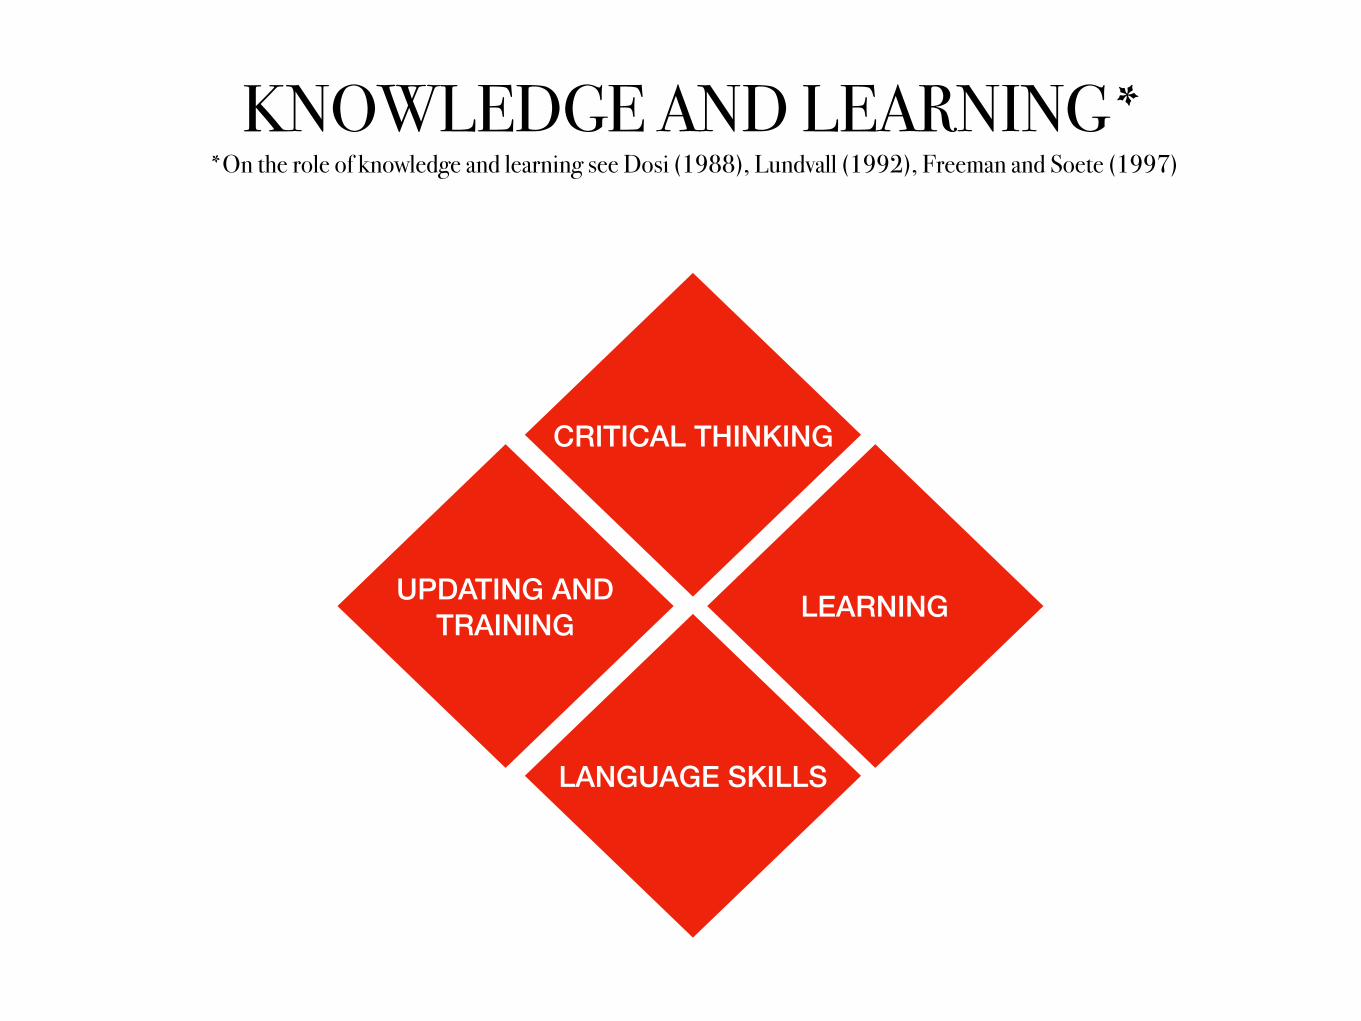
KNOWLEDGE AND LEARNING* *On the role of knowledge and learning see Dosi (1988), Lundvall (1992), Freeman and Soete (1997)
CRITICAL THINKING
UPDATING AND TRAINING LEARNING
LANGUAGE SKILLS
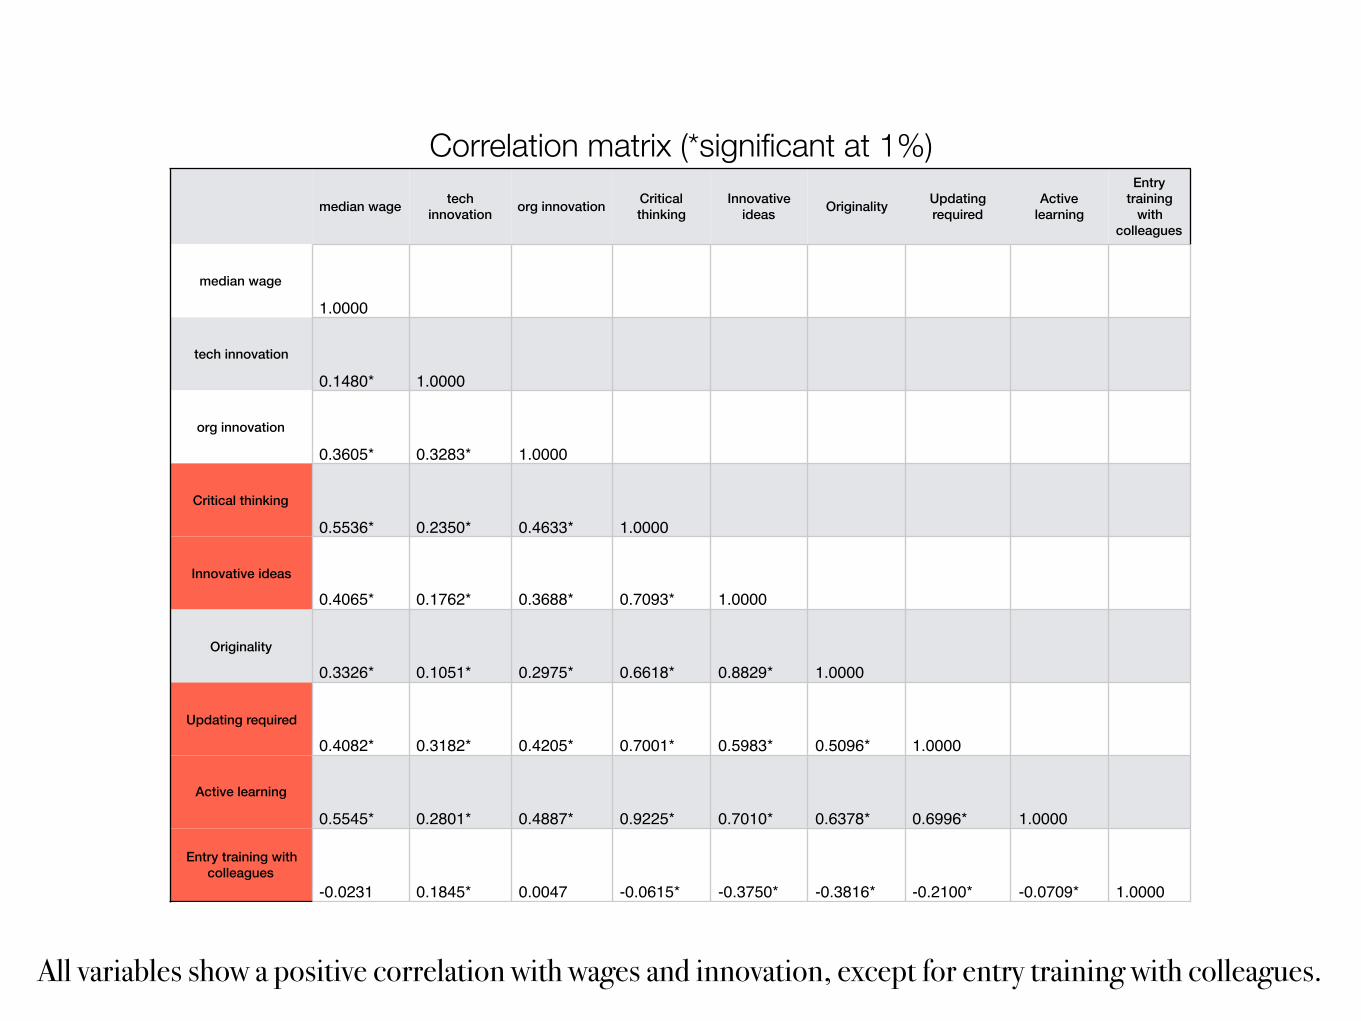
Correlation matrix (*significant at 1%)median wage tech
innovation org innovation Critical thinking
Innovative ideas Originality Updating
requiredActive
learning
Entry training
with colleagues
median wage
1.0000
tech innovation
0.1480* 1.0000
org innovation
0.3605* 0.3283* 1.0000
Critical thinking
0.5536* 0.2350* 0.4633* 1.0000
Innovative ideas
0.4065* 0.1762* 0.3688* 0.7093* 1.0000
Originality
0.3326* 0.1051* 0.2975* 0.6618* 0.8829* 1.0000
Updating required
0.4082* 0.3182* 0.4205* 0.7001* 0.5983* 0.5096* 1.0000
Active learning
0.5545* 0.2801* 0.4887* 0.9225* 0.7010* 0.6378* 0.6996* 1.0000
Entry training with colleagues
-0.0231 0.1845* 0.0047 -0.0615* -0.3750* -0.3816* -0.2100* -0.0709* 1.0000
All variables show a positive correlation with wages and innovation, except for entry training with colleagues.
Critical Thinking
Innovative ideas Originality
Active learning
Updating
Training with colleagues
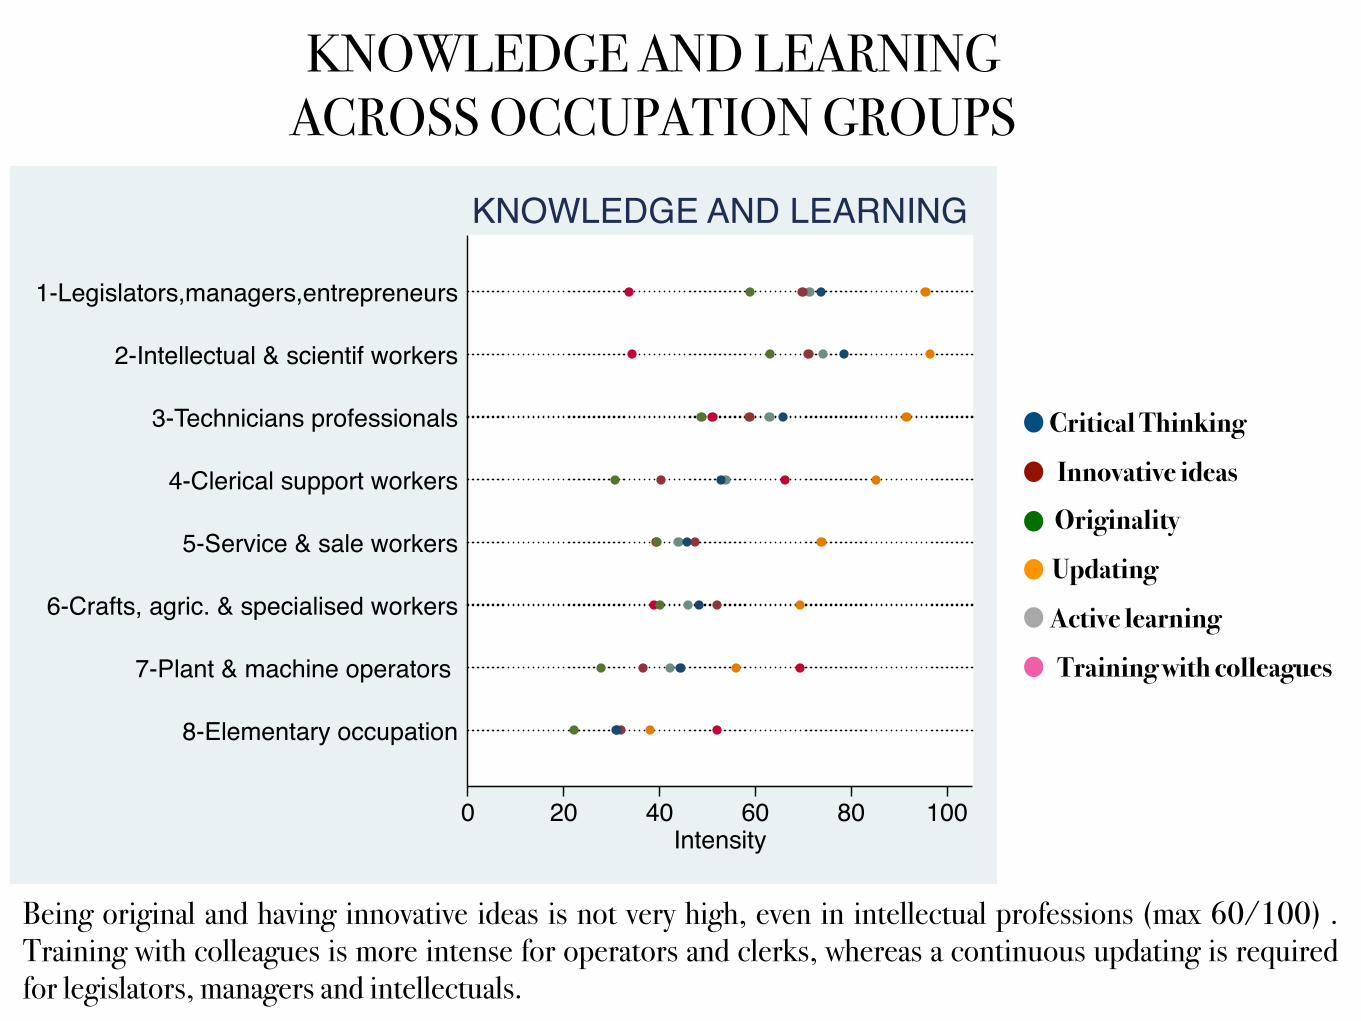
KNOWLEDGE AND LEARNING ACROSS OCCUPATION GROUPS
0 20 40 60 80 100Intensity
8-Elementary occupation
7-Plant & machine operators
6-Crafts, agric. & specialised workers
5-Service & sale workers
4-Clerical support workers
3-Technicians professionals
2-Intellectual & scientif workers
1-Legislators,managers,entrepreneurs
KNOWLEDGE AND LEARNING
Being original and having innovative ideas is not very high, even in intellectual professions (max 60/100) . Training with colleagues is more intense for operators and clerks, whereas a continuous updating is required for legislators, managers and intellectuals.
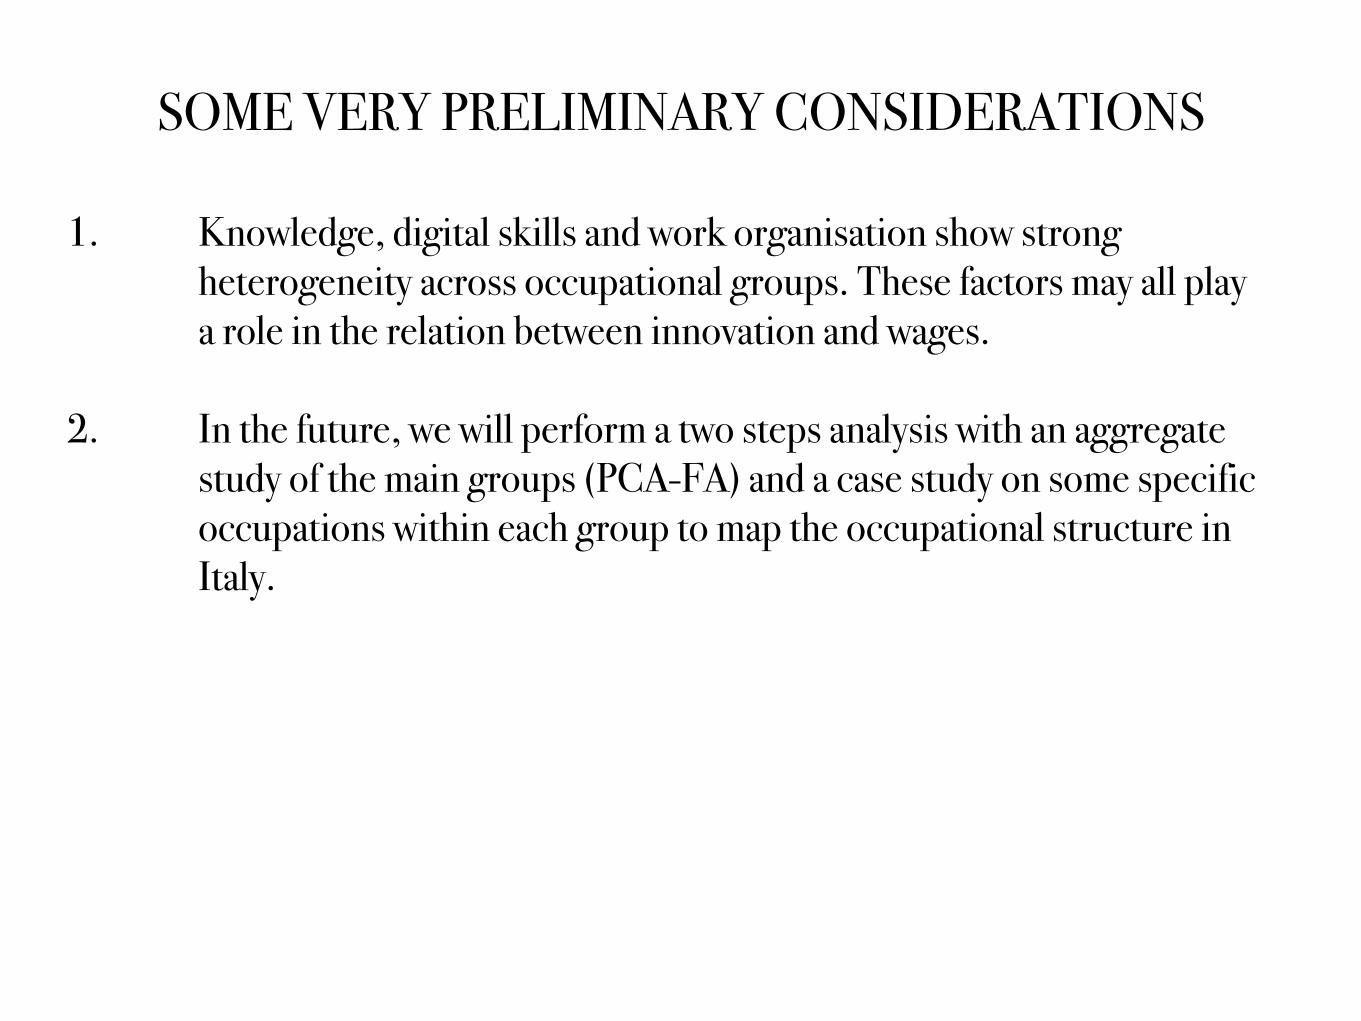
SOME VERY PRELIMINARY CONSIDERATIONS
1. Knowledge, digital skills and work organisation show strong heterogeneity across occupational groups. These factors may all play a role in the relation between innovation and wages.
2. In the future, we will perform a two steps analysis with an aggregate study of the main groups (PCA-FA) and a case study on some specific occupations within each group to map the occupational structure in Italy.

Log (median wage)i,t = β0 + β1 RTIj + β3Zj,t + β4DSj + β6 Cj+ β6K&Lj + εj,t
REGRESSION MODEL
a very preliminary econometric exploration of the relative role of routinarity, work organisation and knowledge on wage differentials across occupations.
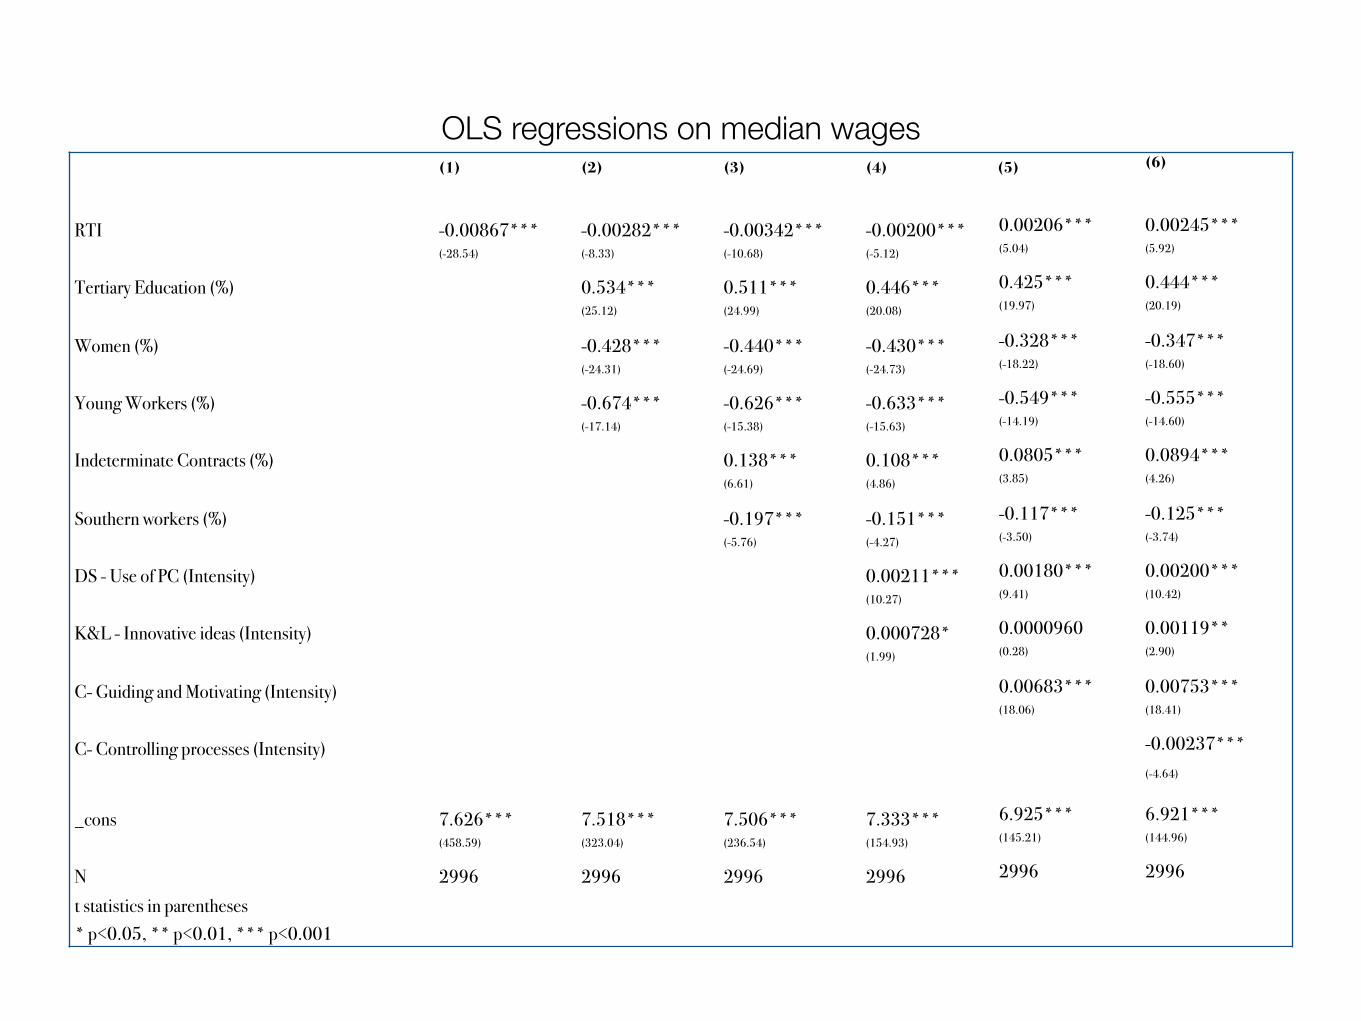
OLS regressions on median wages(1) (2) (3) (4) (5) (6)
RTI -0.00867*** -0.00282*** -0.00342*** -0.00200*** 0.00206*** 0.00245***(-28.54) (-8.33) (-10.68) (-5.12) (5.04) (5.92)
Tertiary Education (%) 0.534*** 0.511*** 0.446*** 0.425*** 0.444***(25.12) (24.99) (20.08) (19.97) (20.19)
Women (%) -0.428*** -0.440*** -0.430*** -0.328*** -0.347***(-24.31) (-24.69) (-24.73) (-18.22) (-18.60)
Young Workers (%) -0.674*** -0.626*** -0.633*** -0.549*** -0.555***(-17.14) (-15.38) (-15.63) (-14.19) (-14.60)
Indeterminate Contracts (%) 0.138*** 0.108*** 0.0805*** 0.0894***(6.61) (4.86) (3.85) (4.26)
Southern workers (%) -0.197*** -0.151*** -0.117*** -0.125***(-5.76) (-4.27) (-3.50) (-3.74)
DS - Use of PC (Intensity) 0.00211*** 0.00180*** 0.00200***(10.27) (9.41) (10.42)
K&L - Innovative ideas (Intensity) 0.000728* 0.0000960 0.00119**(1.99) (0.28) (2.90)
C- Guiding and Motivating (Intensity) 0.00683*** 0.00753***(18.06) (18.41)
C- Controlling processes (Intensity) -0.00237***(-4.64)
_cons 7.626*** 7.518*** 7.506*** 7.333*** 6.925*** 6.921***(458.59) (323.04) (236.54) (154.93) (145.21) (144.96)
N 2996 2996 2996 2996 2996 2996
t statistics in parentheses* p<0.05, ** p<0.01, *** p<0.001

SOME VERY PRELIMINARY CONSIDERATIONS
1. Knowledge, digital skills and work organisation show strong heterogeneity across occupational groups. These factors may all play a role in the relation between innovation and wages.
2. We will perform a two steps analysis with an aggregate study of the main groups (PCA-FA) and a case study on some specific occupations within each group to map the occupational structure in Italy.
3. Not new: Knowledge and digital skills always correlate positively with innovation and wages.
4. ?: The role of RTI is partly downsized. 5. New: The higher is the control over other workers, the higher seems
to be the correlation with wages and organisational innovation.
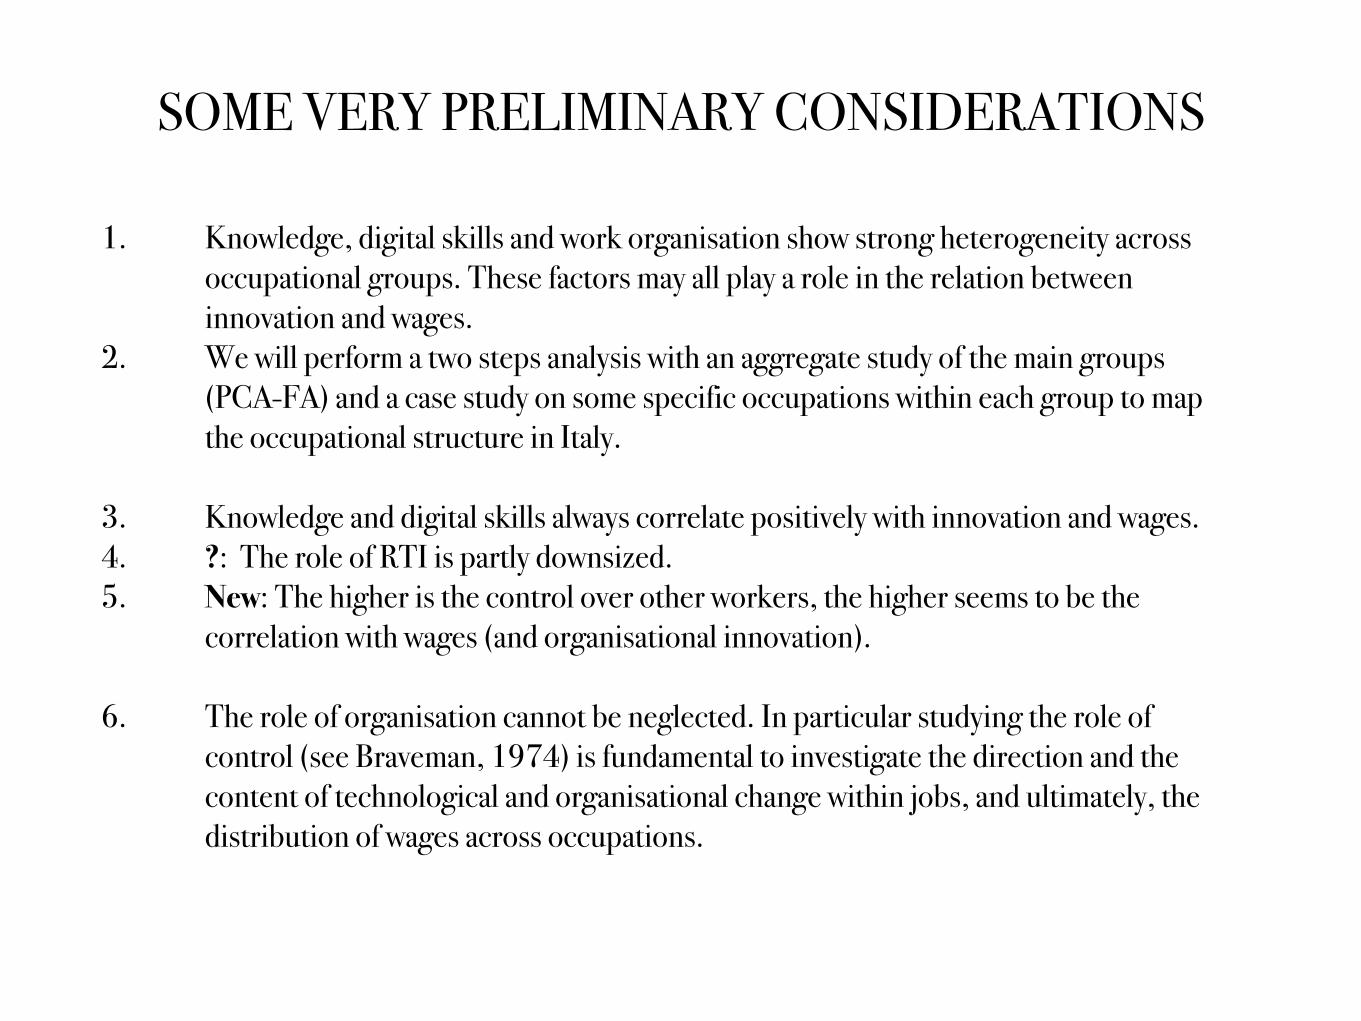
SOME VERY PRELIMINARY CONSIDERATIONS
1. Knowledge, digital skills and work organisation show strong heterogeneity across occupational groups. These factors may all play a role in the relation between innovation and wages.
2. We will perform a two steps analysis with an aggregate study of the main groups (PCA-FA) and a case study on some specific occupations within each group to map the occupational structure in Italy.
3. Knowledge and digital skills always correlate positively with innovation and wages. 4. ?: The role of RTI is partly downsized. 5. New: The higher is the control over other workers, the higher seems to be the
correlation with wages (and organisational innovation).
6. The role of organisation cannot be neglected. In particular studying the role of control (see Braveman, 1974) is fundamental to investigate the direction and the content of technological and organisational change within jobs, and ultimately, the distribution of wages across occupations.
Harry Braverman (1998, p. 12, 1st ed. 1974)
“The problem can be fruitfully attacked, it seems to me, only by way of concrete and historically specific analysis of technology and machinery on the one side and social relations on the other, and of the manner in which these two come together in existing
societies. Such an analysis could well start with the possibility that the present mode of the
organization and control of labor arose in capitalist society for reasons specific to that society…"

Additional material

.016139
.010008
.006088
.0068
.00867
0.0
05.0
1.0
15w
age
grow
th in
log
1 2 3 4 5
2011-2016Wage growth over wage quintiles
.031504
-.002675
.010036.008745
.007818
.001603
.00725.005941
.014899
.0024410
.01
.02
.03
wag
e gr
owth
in lo
g
1 2 3 4 5 6 7 8 9 10
2011-2016Wage growth wage deciles

12.555
-3.80114
-2.37612
3.98764
13.7856
-50
510
15po
pula
tion
grow
th
1 2 3 4 5
2011-2016Population growth over wage quintiles
8.3189
17.742
-3.92184
1.56989
3.60891
-18.1145
-3.5264
18.352719.4171
8.1542
-20
-10
010
20po
pula
tion
grow
th
1 2 3 4 5 6 7 8 9 10
2011-2016Population growth over wage deciles