Anatomical Pathology Profile - CMA
19
1 Anatomical Pathology Profile Updated December 2019
Transcript of Anatomical Pathology Profile - CMA

1
AnatomicalPathology
Profile
Updated December 2019
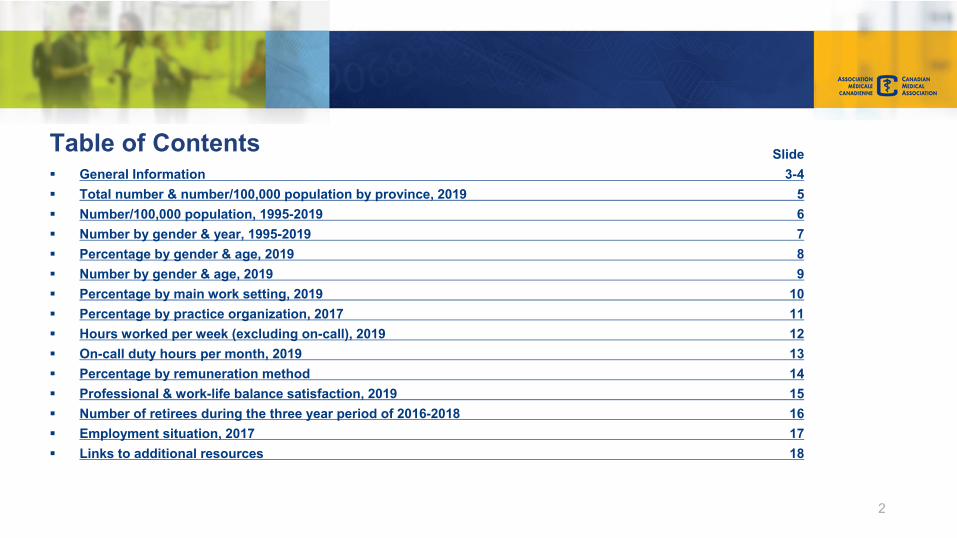
Table of Contents Slide General Information 3-4 Total number & number/100,000 population by province, 2019 5 Number/100,000 population, 1995-2019 6 Number by gender & year, 1995-2019 7 Percentage by gender & age, 2019 8 Number by gender & age, 2019 9 Percentage by main work setting, 2019 10 Percentage by practice organization, 2017 11 Hours worked per week (excluding on-call), 2019 12 On-call duty hours per month, 2019 13 Percentage by remuneration method 14 Professional & work-life balance satisfaction, 2019 15 Number of retirees during the three year period of 2016-2018 16 Employment situation, 2017 17 Links to additional resources 18
2
Source: Pathway evaluation program
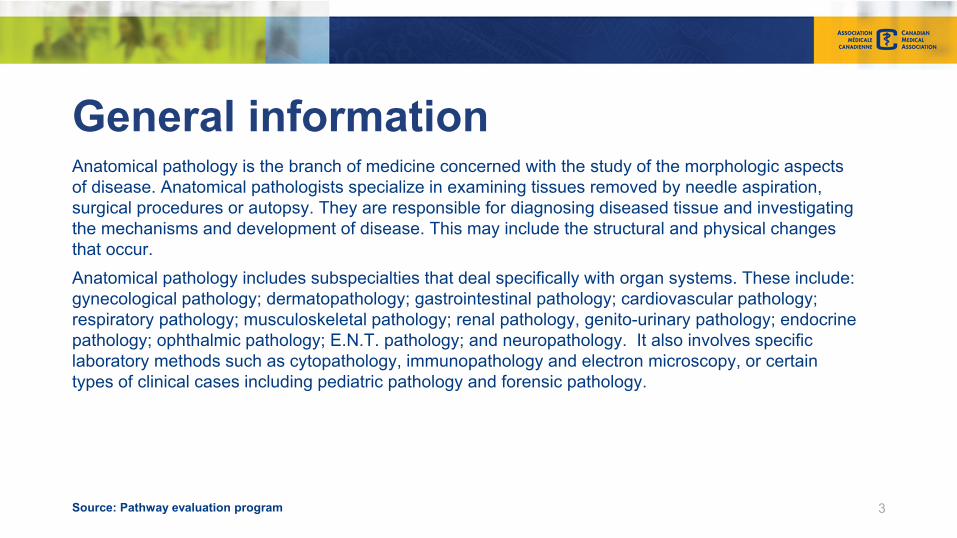
General informationAnatomical pathology is the branch of medicine concerned with the study of the morphologic aspects of disease. Anatomical pathologists specialize in examining tissues removed by needle aspiration, surgical procedures or autopsy. They are responsible for diagnosing diseased tissue and investigating the mechanisms and development of disease. This may include the structural and physical changes that occur. Anatomical pathology includes subspecialties that deal specifically with organ systems. These include: gynecological pathology; dermatopathology; gastrointestinal pathology; cardiovascular pathology; respiratory pathology; musculoskeletal pathology; renal pathology, genito-urinary pathology; endocrine pathology; ophthalmic pathology; E.N.T. pathology; and neuropathology. It also involves specific laboratory methods such as cytopathology, immunopathology and electron microscopy, or certain types of clinical cases including pediatric pathology and forensic pathology.
3

General informationUpon completion of medical school, to become certified in this specialty requires an additional 5 years of approved residency training. This training includes: 1 year of basic clinical training; 3 years of approved residency training in anatomical pathology (including training in surgical pathology and autopsy pathology); a minimum of 3 months' training in cytopathology; and training in forensic pathology and pediatric pathology. A further year of approved residency is also required.For further details on training requirements please go to:Royal College of Physicians and Surgeons of CanadaCanadian Association of Pathologists
4Source: Pathway evaluation program
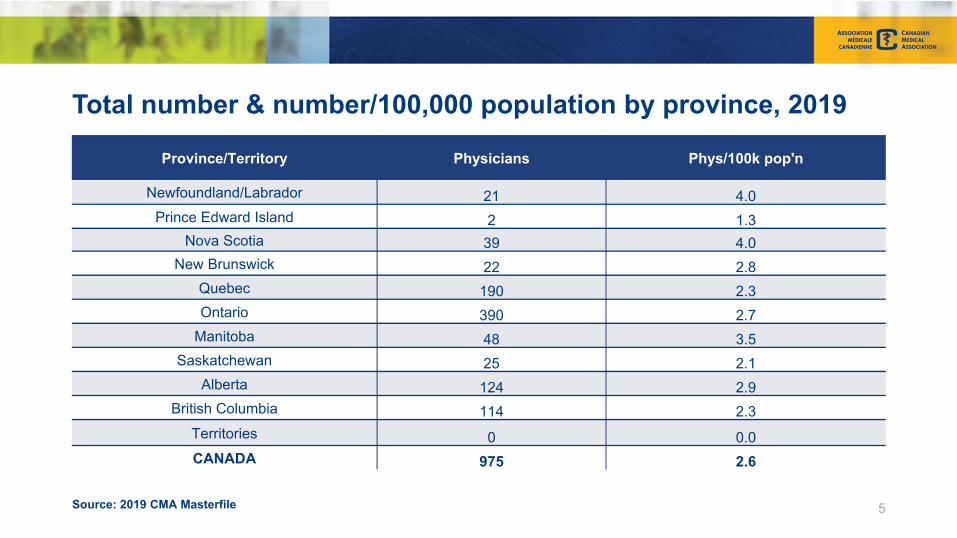
Total number & number/100,000 population by province, 2019
5
Province/Territory Physicians Phys/100k pop'n
Newfoundland/Labrador 21 4.0Prince Edward Island 2 1.3
Nova Scotia 39 4.0New Brunswick 22 2.8
Quebec 190 2.3Ontario 390 2.7
Manitoba 48 3.5Saskatchewan 25 2.1
Alberta 124 2.9British Columbia 114 2.3
Territories 0 0.0CANADA 975 2.6
Source: 2019 CMA Masterfile
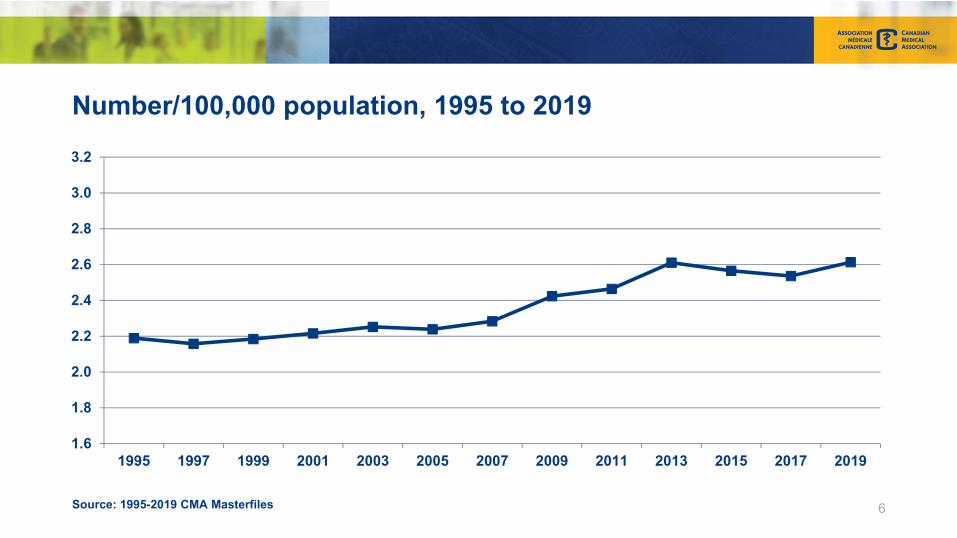
Number/100,000 population, 1995 to 2019
6
1.6
1.8
2.0
2.2
2.4
2.6
2.8
3.0
3.2
1995 1997 1999 2001 2003 2005 2007 2009 2011 2013 2015 2017 2019
Source: 1995-2019 CMA Masterfiles

Number by gender & year, 1995 to 2019
7
0
200
400
600
800
1000
1200
1995 1997 1999 2001 2003 2005 2007 2009 2011 2013 2015 2017 2019
Total Males Females
Source: 1995-2019 CMA Masterfiles

Percentage by gender & age, 2019
Gender
55%
45%
Male Female
Age Group19%
31%26%
20%
4%
65+ 55 - 64 45 - 54 35 - 44 < 35
8
Excludes those where gender or age is unknown.
Source: 2019 CMA Masterfile

Number by gender & age, 2019
14
99
111
124
61
17
86
129
162
115
<35
35-44
45-54
55-64
65+
Female Male
Excludes those where gender or age is unknown.
Source: 2019 CMA Masterfile 9
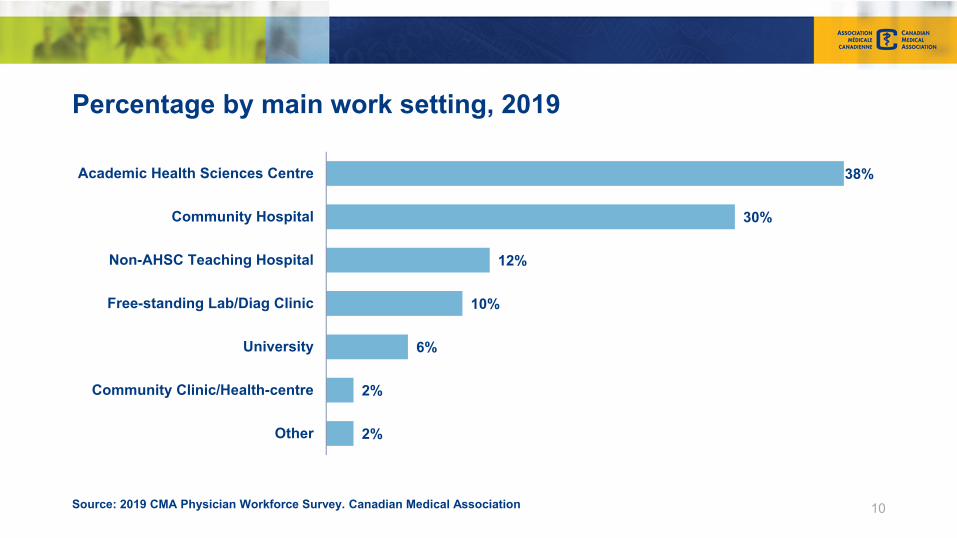
Percentage by main work setting, 2019
10
38%
30%
12%
10%
6%
2%
2%
Academic Health Sciences Centre
Community Hospital
Non-AHSC Teaching Hospital
Free-standing Lab/Diag Clinic
University
Community Clinic/Health-centre
Other
Source: 2019 CMA Physician Workforce Survey. Canadian Medical Association

Percentage by practice organization, 2017*
11
90%
5% 5% 0%
Solo Practice
Group Practice
Interprofessional Practice
Hospital-based Practice
NR
*Most recent available data for this specialty
Source: 2017 CMA Workforce Survey. Canadian Medical Association
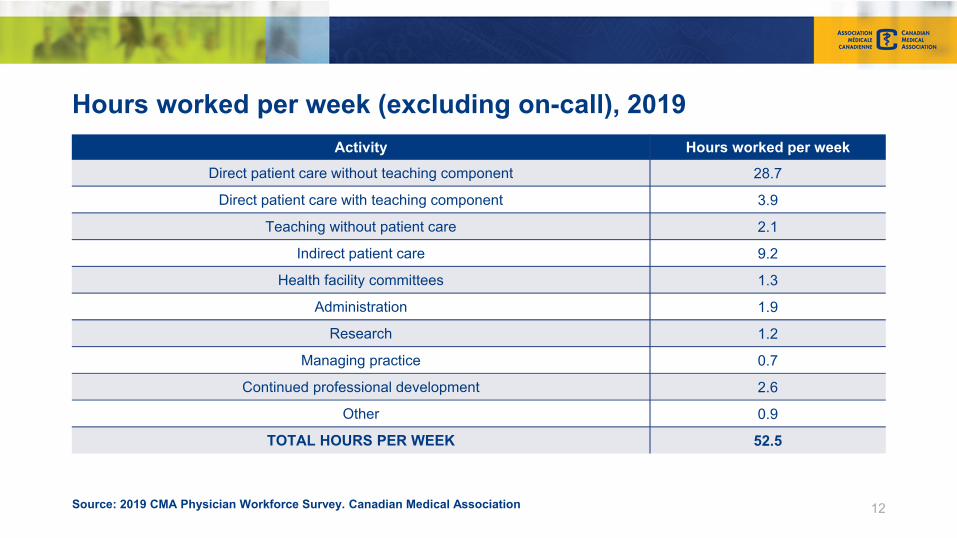
Hours worked per week (excluding on-call), 2019
12
Activity Hours worked per week
Direct patient care without teaching component 28.7
Direct patient care with teaching component 3.9
Teaching without patient care 2.1
Indirect patient care 9.2
Health facility committees 1.3
Administration 1.9
Research 1.2
Managing practice 0.7
Continued professional development 2.6
Other 0.9
TOTAL HOURS PER WEEK 52.5
Source: 2019 CMA Physician Workforce Survey. Canadian Medical Association
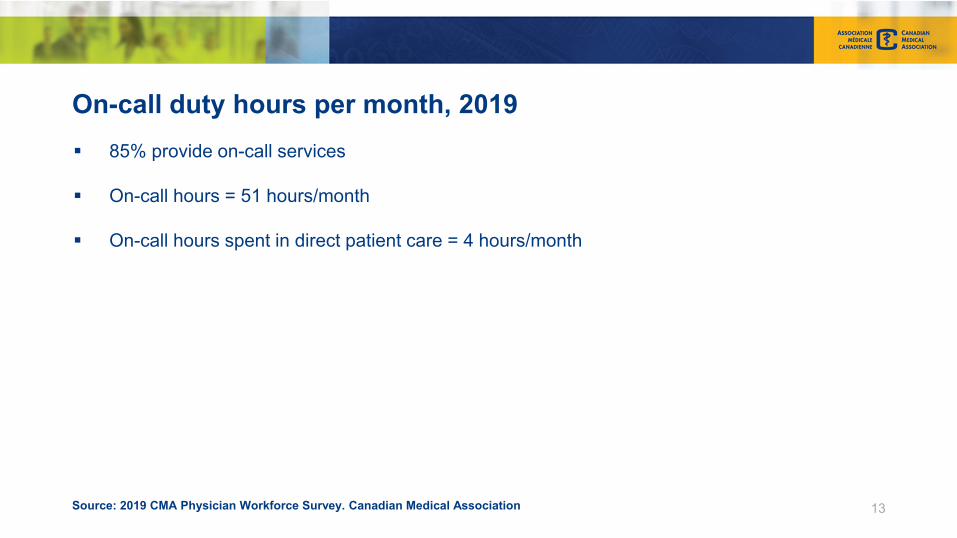
On-call duty hours per month, 2019
13
85% provide on-call services
On-call hours = 51 hours/month
On-call hours spent in direct patient care = 4 hours/month
Source: 2019 CMA Physician Workforce Survey. Canadian Medical Association

Percentage by remuneration methodPrimary payment method1 in 2017
14
28%
27%
32%
10%2%
90% + fee-for-service90% + salary90% + other*BlendedNR
* Other includes capitation, sessional, contract or other methodsSource: 2017 CMA Workforce Survey. Canadian Medical Association
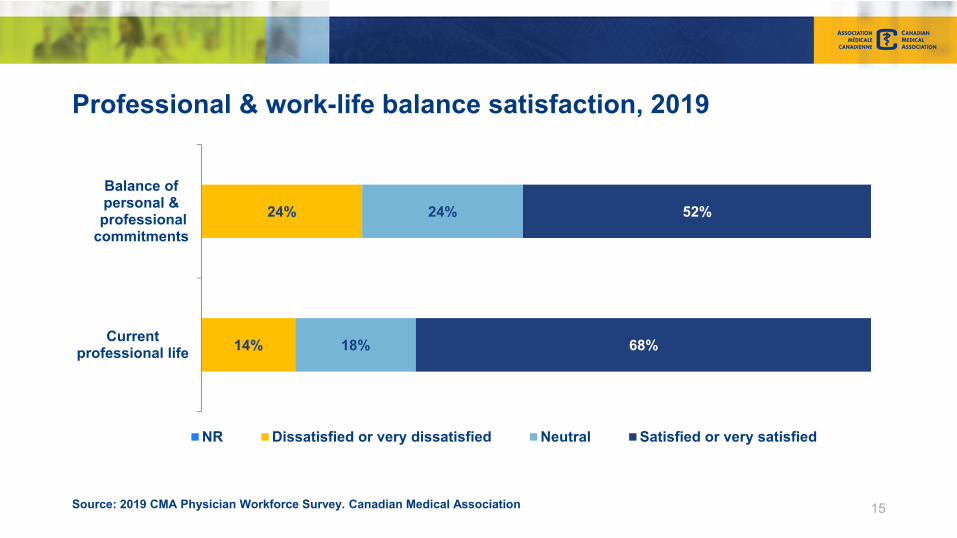
Professional & work-life balance satisfaction, 2019
15
14%
24%
18%
24%
68%
52%
Currentprofessional life
Balance ofpersonal &
professionalcommitments
NR Dissatisfied or very dissatisfied Neutral Satisfied or very satisfied
Source: 2019 CMA Physician Workforce Survey. Canadian Medical Association
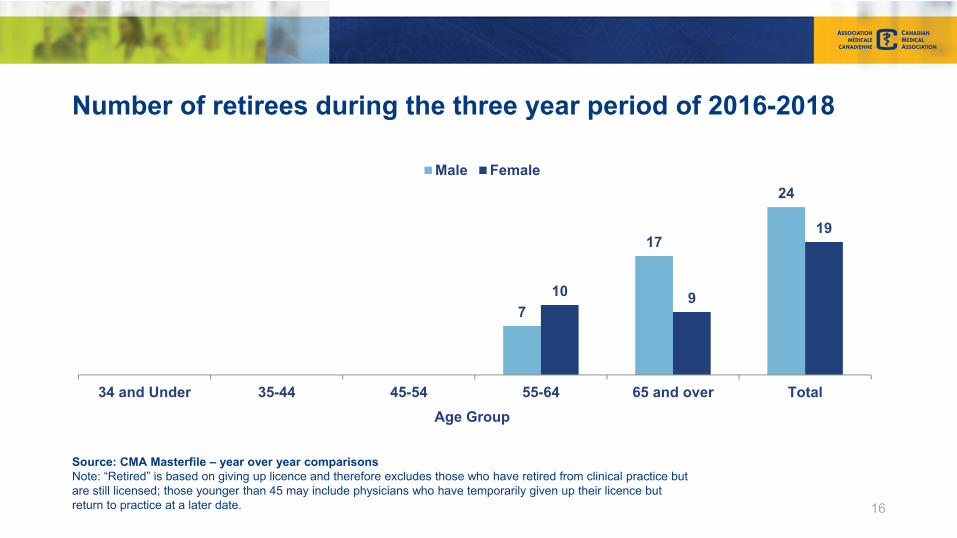
Number of retirees during the three year period of 2016-2018
7
17
24
10 9
19
34 and Under 35-44 45-54 55-64 65 and over TotalAge Group
Male Female
Source: CMA Masterfile – year over year comparisonsNote: “Retired” is based on giving up licence and therefore excludes those who have retired from clinical practice but are still licensed; those younger than 45 may include physicians who have temporarily given up their licence but return to practice at a later date. 16

Employment situation, 2017
17
40%
58%
2%
Overworked in my discipline
Employed in my discipline to my satisfaction
Underemployed in my discipline
Not employed in my discipline
No response
Source: 2017 CMA Workforce Survey. Canadian Medical Association
Links to additional resources
18
Association of Faculties of Medicine of Canada
Canadian Institute for Health Information
Canadian Medical Association’s Physician Data Centre
Canadian Post-MD Education Registry (CAPER)
College of Family Physicians of Canada
National Physician Survey (2004-2014)
Royal College of Physicians and Surgeons of Canada