ANASYS V6 02 000 · 2019-06-21 · INSTRUCTION MANUAL Data Analysis software for H2S Data Logger...
38
INSTRUCTION MANUAL Data Analysis software for H2S Data Logger ANASYS Ver6.2 GHS-PC-3 GASTEC CORPORATION 8-8-6 Fukayanaka, Ayase-city, Kanagawa, Japan 252-1195 TEL (0467)79-3910 FAX (0467)79-3979 IM15GHSPC3E4
Transcript of ANASYS V6 02 000 · 2019-06-21 · INSTRUCTION MANUAL Data Analysis software for H2S Data Logger...
INSTRUCTION MANUAL
Data Analysis software for H2S Data Logger
ANASYS Ver6.2
GHS-PC-3
GASTEC CORPORATION
8-8-6 Fukayanaka, Ayase-city,
Kanagawa, Japan 252-1195
TEL (0467)79-3910
FAX (0467)79-3979
IM15GHSPC3E4
1
Contents
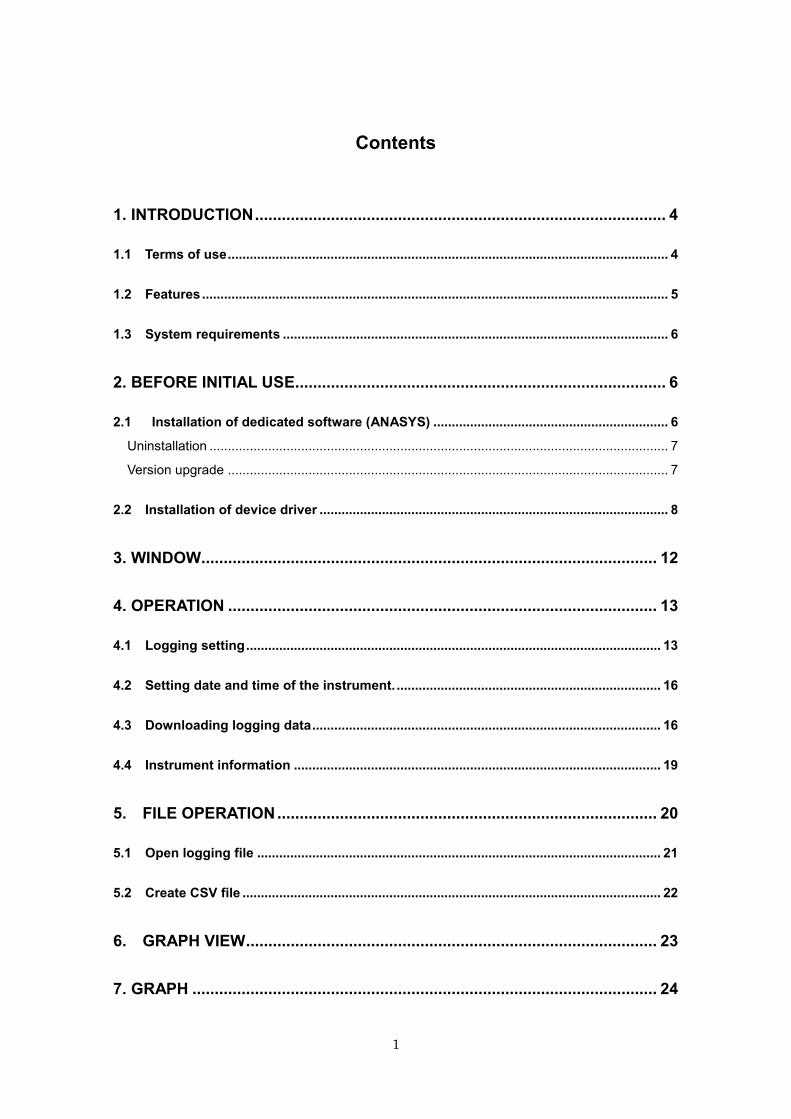
1. INTRODUCTION ............................................................................................ 4
1.1 Terms of use ........................................................................................................................ 4
1.2 Features ............................................................................................................................... 5
1.3 System requirements ......................................................................................................... 6
2. BEFORE INITIAL USE ................................................................................... 6
2.1 Installation of dedicated software (ANASYS) ................................................................ 6
Uninstallation ............................................................................................................................. 7
Version upgrade ........................................................................................................................ 7
2.2 Installation of device driver ............................................................................................... 8
3. WINDOW ...................................................................................................... 12
4. OPERATION ................................................................................................ 13
4.1 Logging setting ................................................................................................................. 13
4.2 Setting date and time of the instrument. ........................................................................ 16
4.3 Downloading logging data ............................................................................................... 16
4.4 Instrument information .................................................................................................... 19
5. FILE OPERATION ..................................................................................... 20
5.1 Open logging file .............................................................................................................. 21
5.2 Create CSV file .................................................................................................................. 22
6. GRAPH VIEW ............................................................................................ 23
7. GRAPH ........................................................................................................ 24
2
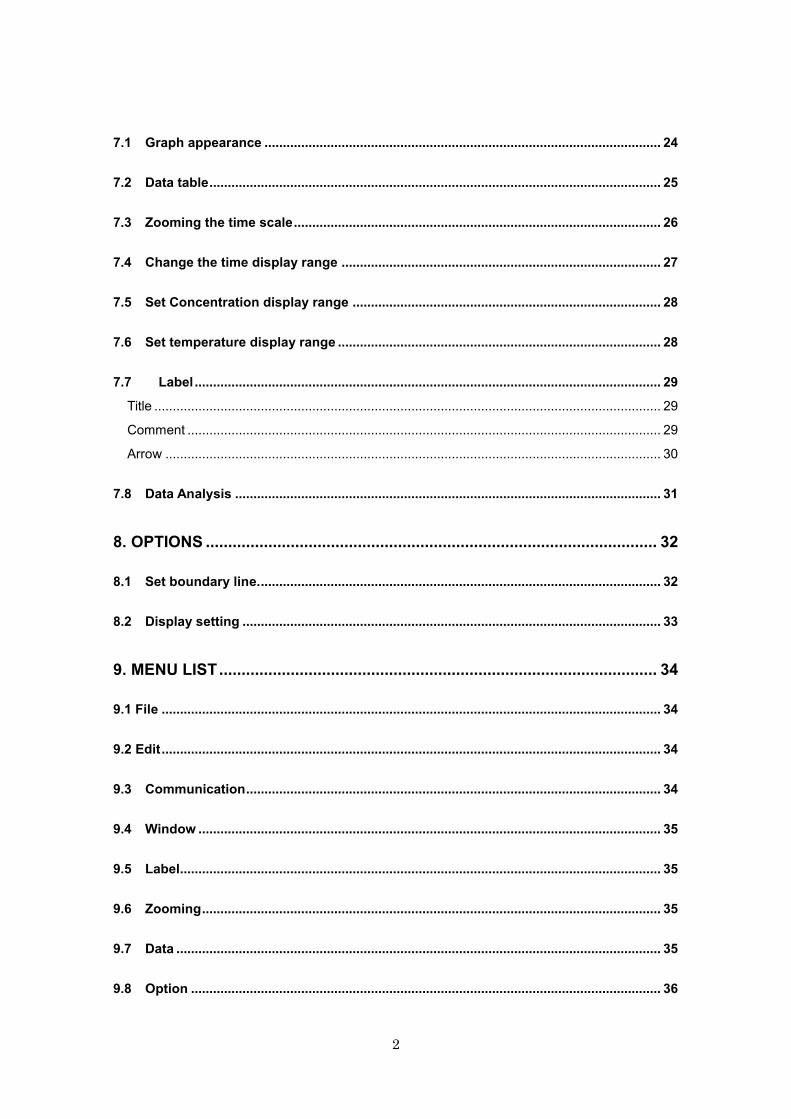
7.1 Graph appearance ............................................................................................................ 24
7.2 Data table ........................................................................................................................... 25
7.3 Zooming the time scale .................................................................................................... 26
7.4 Change the time display range ....................................................................................... 27
7.5 Set Concentration display range .................................................................................... 28
7.6 Set temperature display range ........................................................................................ 28
7.7 Label ............................................................................................................................... 29
Title .......................................................................................................................................... 29
Comment ................................................................................................................................. 29
Arrow ....................................................................................................................................... 30
7.8 Data Analysis .................................................................................................................... 31
8. OPTIONS ..................................................................................................... 32
8.1 Set boundary line. ............................................................................................................. 32
8.2 Display setting .................................................................................................................. 33
9. MENU LIST .................................................................................................. 34
9.1 File ........................................................................................................................................ 34
9.2 Edit ........................................................................................................................................ 34
9.3 Communication ................................................................................................................. 34
9.4 Window .............................................................................................................................. 35
9.5 Label ................................................................................................................................... 35
9.6 Zooming ............................................................................................................................. 35
9.7 Data .................................................................................................................................... 35
9.8 Option ................................................................................................................................ 36

3
9.9 Help .................................................................................................................................... 36
10. SPECIFICATIONS ...................................................................................... 36
10.1 Specifications ................................................................................................................ 36
11. TROUBLE SHOOTING .............................................................................. 37
4
1. Introduction
Thank you very much for purchasing ANASYS.
This software is dedicated software for Gastec H2S data logger Model GHS-8AT
and GHS-8AT-EX. This software enables downloading logging data from the
instrument to analyze environmental conditions on the computer. Carefully read and
understand the manual before use of this software.
Pictures and illustrations in this manual may be different from the actual instruments.
Windows appearances are different by operation systems.
Software or contents of this manual are subject to change without notice.
In this manual, precaution symbols are used as defined below:
NOTE This indicates advice for proper use of this instrument.
1.1 Terms of use
[Disclaimer]
・ Gastec Corporation assumes no warranties whatsoever for any direct or indirect
damages, loss, prejudice or emotional distress caused by use of ANASYS.
・ Gastec Corporation may at any time, for any reason modify or discontinue the
availability of ANASYS which shall not be liable to you for any direct or indirect
damages, loss, prejudice or emotional distress caused by modifications or
discontinuation.
[Copyright]
・ ANASYS software and its relative documents are the copy right of Gastec
Corporation.
・ Do not modify ANASYS software.

5
1.2 Features
Comminucation
Downloading logging data and save the configuration to the instrument from your computer
via USB 2.0 interface.
Create graph
You can create graph from logging data. You can zoom the scales, add title, arrow symbols,
and comment to the graph.
Saving the data
You can save and read the logging data and graph data.
Printout
The graph can be printed out.
Display two graphs
Two graphs can be displayed one above the other to compare them. For example, two weeks
of continuous data can de devided into two graphs, and the graph of the first week data can
be above the graph of second week data to compare them easily.
Layer graphs
Up to 10 logging data graph can be shown in one graph area. The data from different site
can be compared easily.
Create CSV file
Logging data can be converted into CSV file which is editable by speard file software.
6
1.3 System requirements
Operation system Microsoft Windows 7 SP1 32bit/64bit Microsoft Windows 8.1 32bit/64bit Microsoft Windows 10 32bit/64bit
Required items for the software environment other than Windows OS
Microsoft .NET Framework 4.5 or later
CPU >1GHz
Memory >512MB
Hard drive >850MB of free space(32bit) >2GB of free space(64bit)
Interface USB2.0
Optical drive CD-ROM drive
2. Before initial use
To convert the logged data to graph or chart, dedicated software “ANASYS” is
needed to be installed to your computer. Data is downloaded via USB 2.0 interface.
Before connecting the instrument and a computer, install device driver on the
computer. Refer to the instruction manual of the instrument to prepare the
instrument.
<Requisite materials>
・ Computer (with USB 2.0 interface and CD-ROM drive)
・ USB connection cable (accessory of the instrument)
・ Install CD (accessory of the instrument)
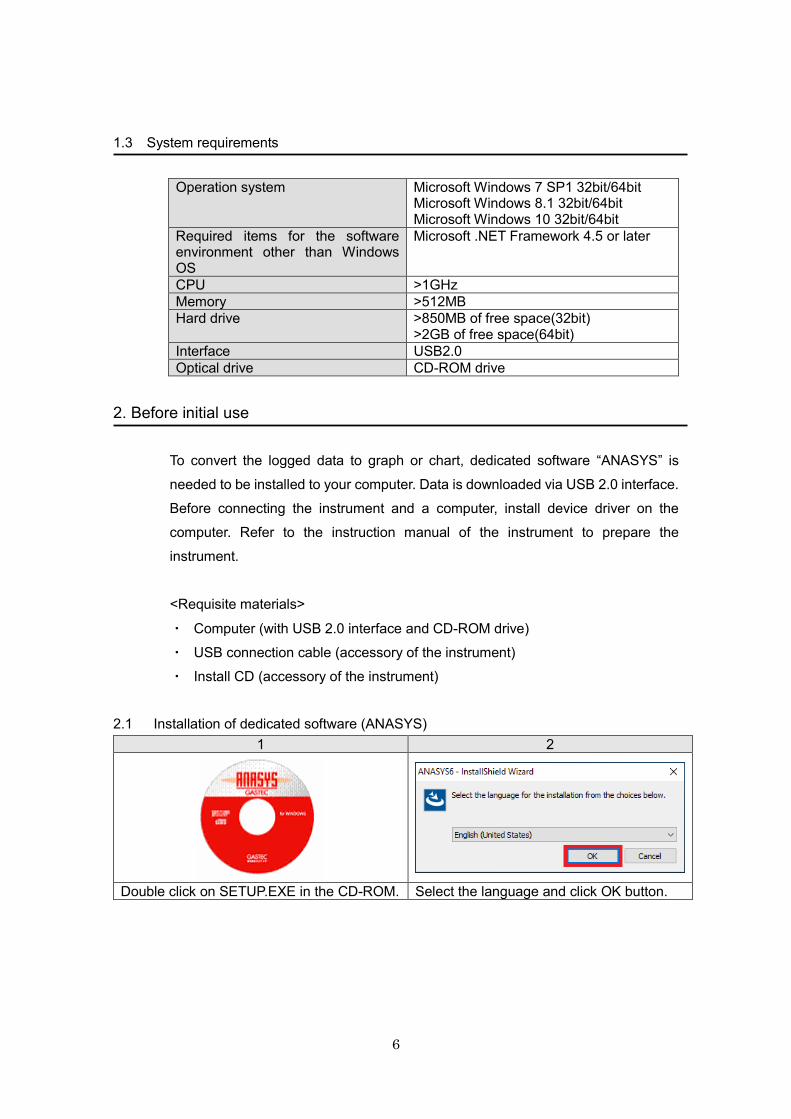
2.1 Installation of dedicated software (ANASYS)
1 2
Double click on SETUP.EXE in the CD-ROM. Select the language and click OK button.
7
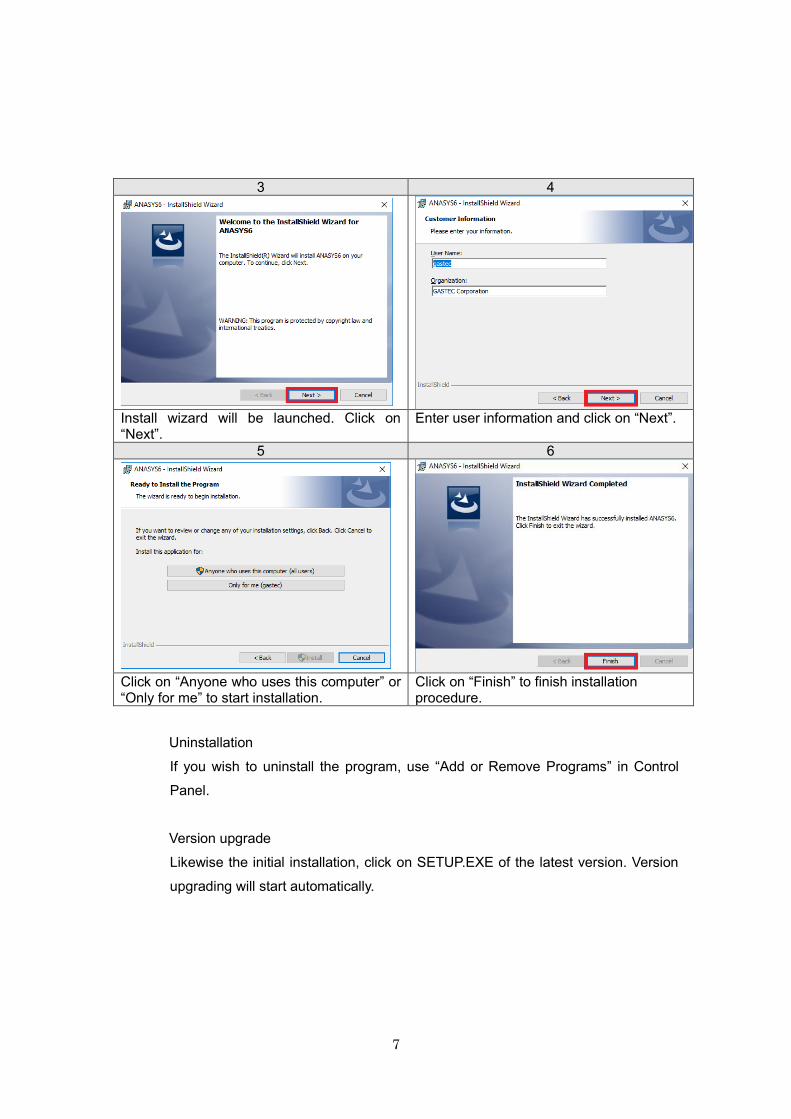
3 4
Install wizard will be launched. Click on “Next”.
Enter user information and click on “Next”.
5 6
Click on “Anyone who uses this computer” or “Only for me” to start installation.
Click on “Finish” to finish installation procedure.
Uninstallation
If you wish to uninstall the program, use “Add or Remove Programs” in Control
Panel.
Version upgrade
Likewise the initial installation, click on SETUP.EXE of the latest version. Version
upgrading will start automatically.
8
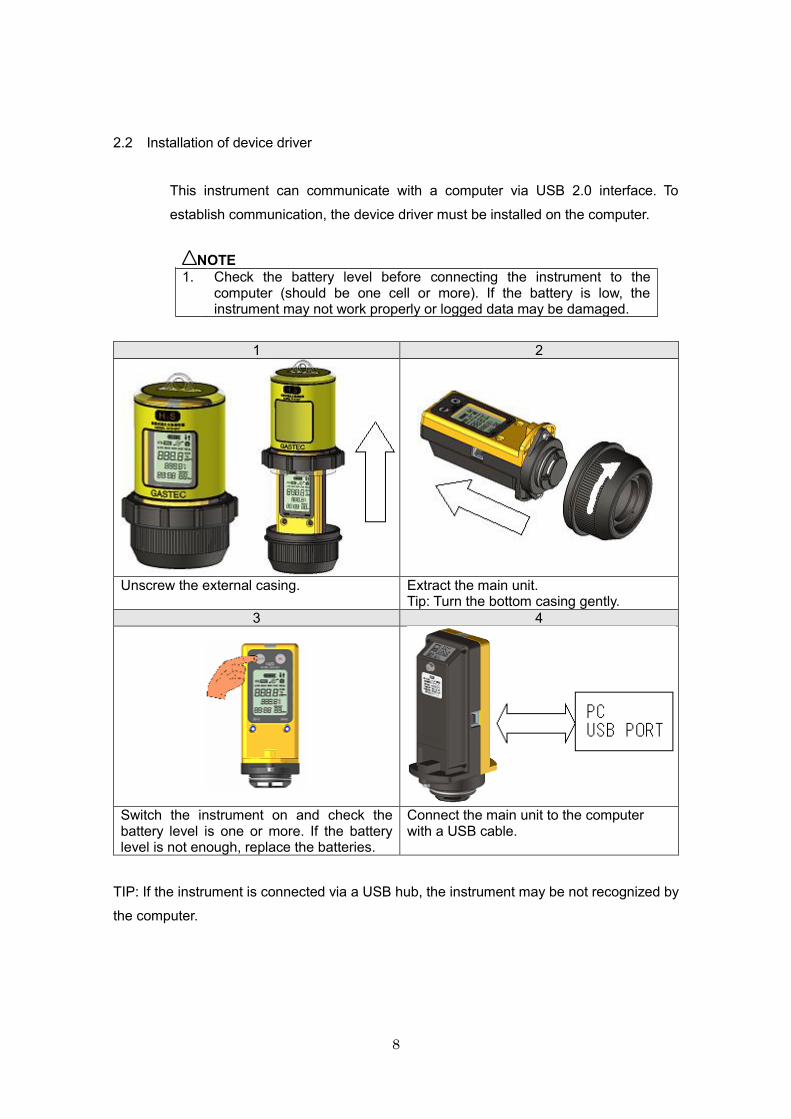
2.2 Installation of device driver
This instrument can communicate with a computer via USB 2.0 interface. To
establish communication, the device driver must be installed on the computer.
NOTE
1. Check the battery level before connecting the instrument to the computer (should be one cell or more). If the battery is low, the instrument may not work properly or logged data may be damaged.
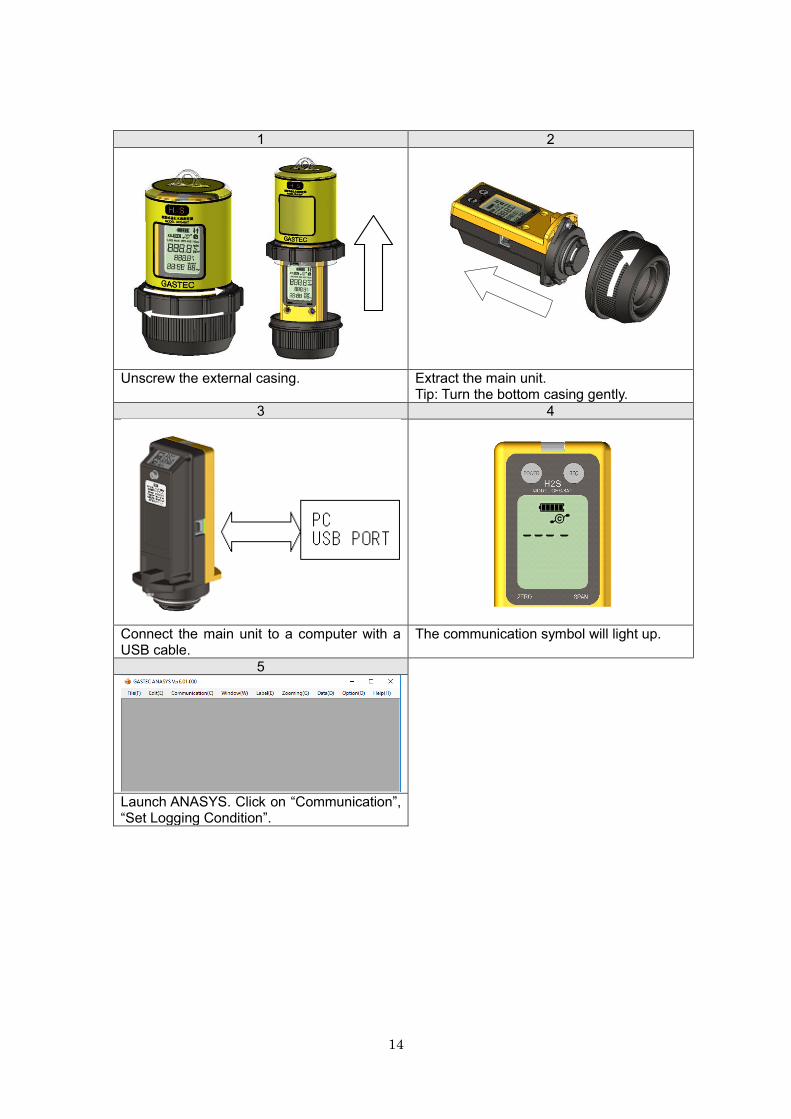
1 2
Unscrew the external casing. Extract the main unit. Tip: Turn the bottom casing gently.
3 4
Switch the instrument on and check the battery level is one or more. If the battery level is not enough, replace the batteries.
Connect the main unit to the computer with a USB cable.
TIP: If the instrument is connected via a USB hub, the instrument may be not recognized by
the computer.
9
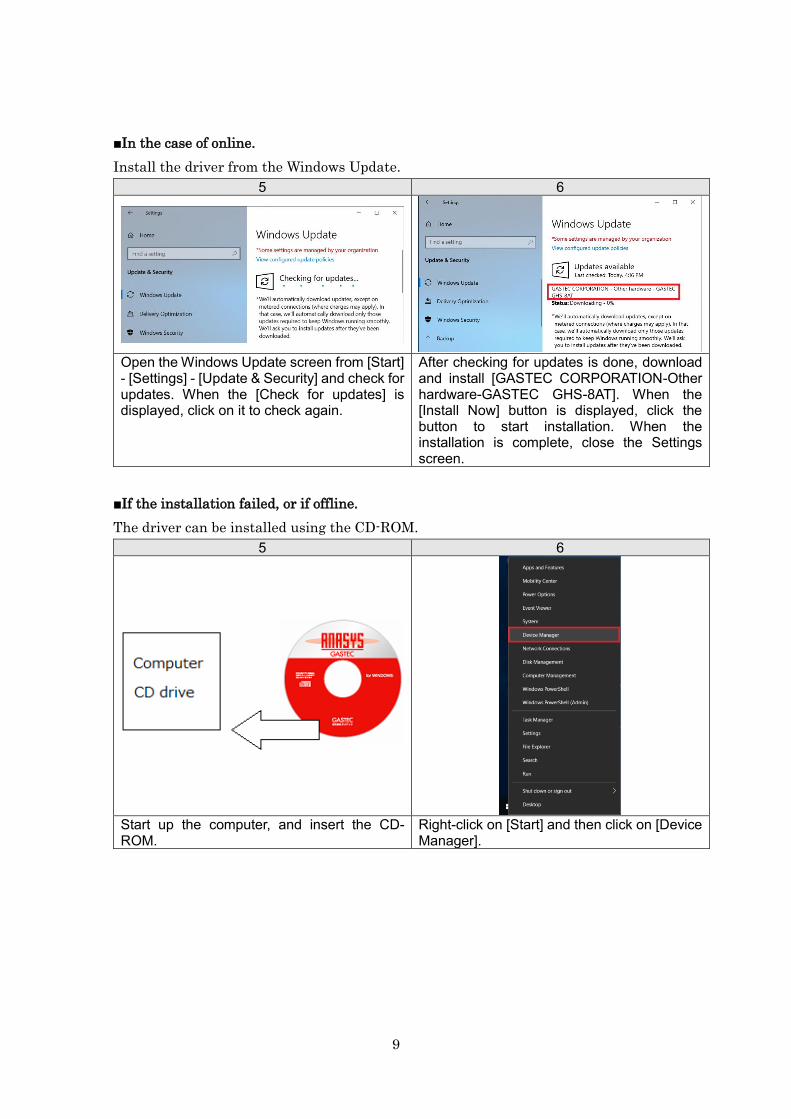
■In the case of online.
Install the driver from the Windows Update.
5 6
Open the Windows Update screen from [Start] - [Settings] - [Update & Security] and check for updates. When the [Check for updates] is displayed, click on it to check again.
After checking for updates is done, download and install [GASTEC CORPORATION-Other hardware-GASTEC GHS-8AT]. When the [Install Now] button is displayed, click the button to start installation. When the installation is complete, close the Settings screen.
■If the installation failed, or if offline.
The driver can be installed using the CD-ROM.
5 6
Start up the computer, and insert the CD-ROM.
Right-click on [Start] and then click on [Device Manager].
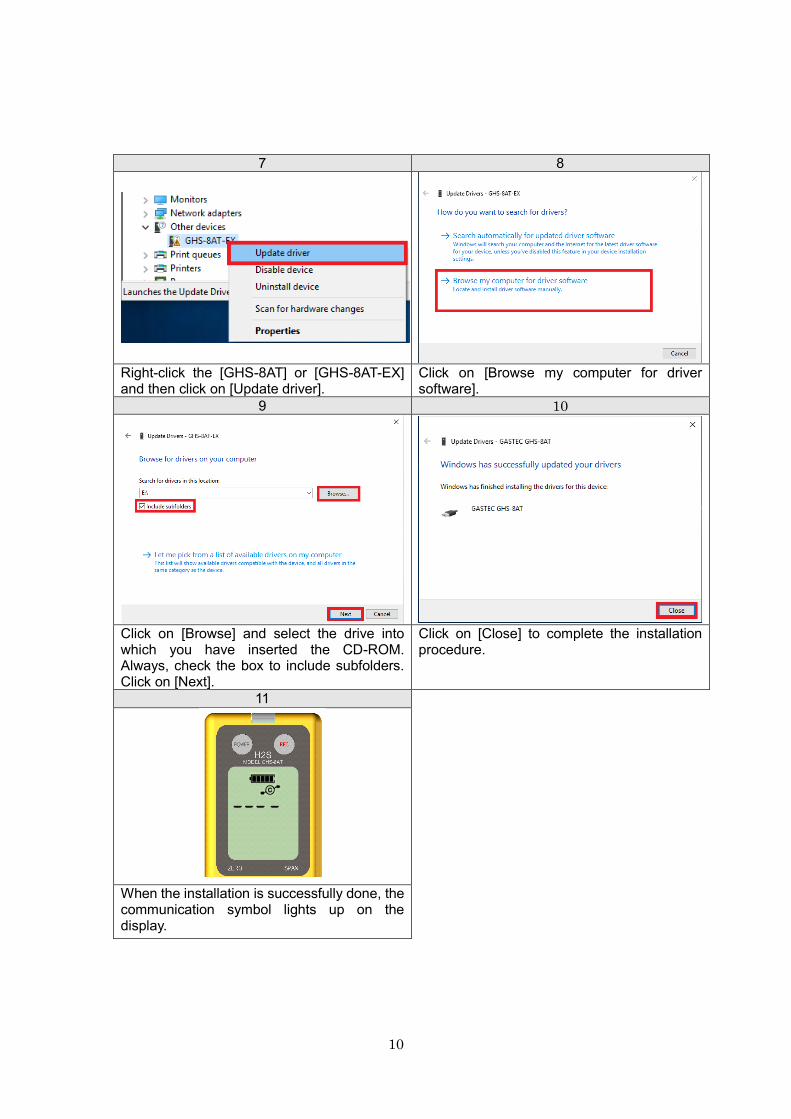
10
7 8
Right-click the [GHS-8AT] or [GHS-8AT-EX] and then click on [Update driver].
Click on [Browse my computer for driver software].
9 10
Click on [Browse] and select the drive into which you have inserted the CD-ROM. Always, check the box to include subfolders. Click on [Next].
Click on [Close] to complete the installation procedure.
11
When the installation is successfully done, the communication symbol lights up on the display.
11
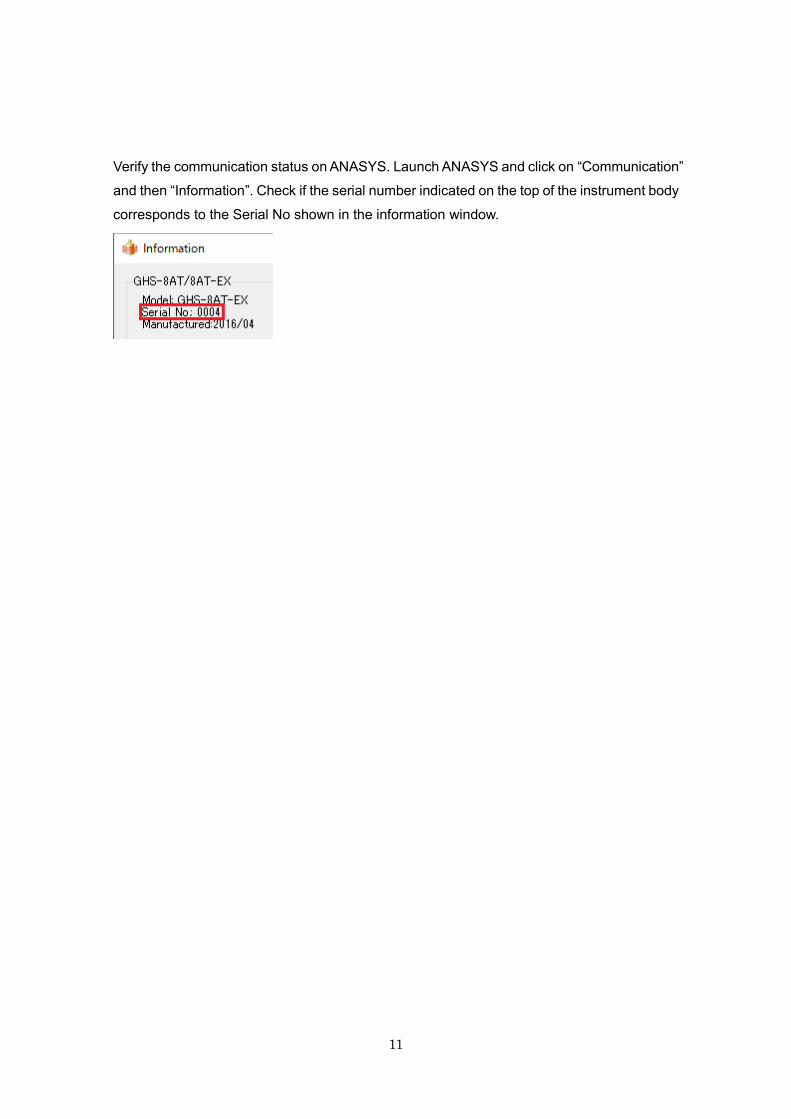
Verify the communication status on ANASYS. Launch ANASYS and click on “Communication”
and then “Information”. Check if the serial number indicated on the top of the instrument body
corresponds to the Serial No shown in the information window.
12
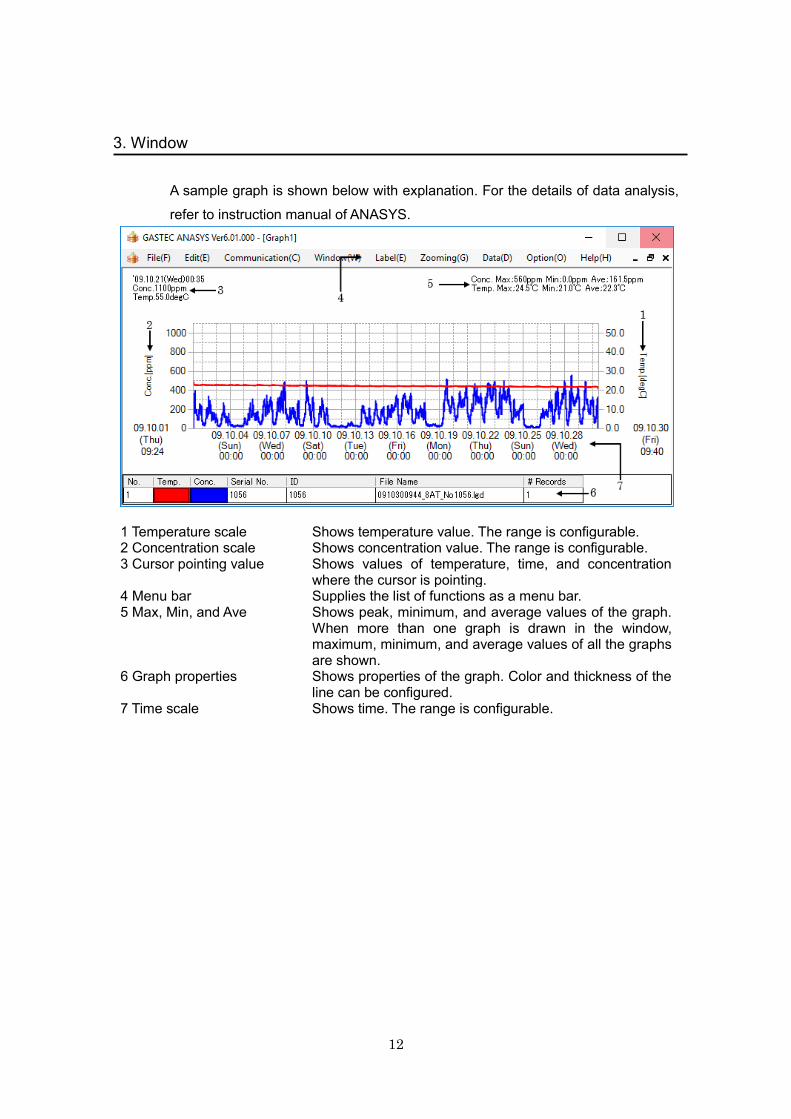
3. Window
A sample graph is shown below with explanation. For the details of data analysis,
refer to instruction manual of ANASYS.
1 Temperature scale Shows temperature value. The range is configurable. 2 Concentration scale Shows concentration value. The range is configurable. 3 Cursor pointing value Shows values of temperature, time, and concentration
where the cursor is pointing. 4 Menu bar Supplies the list of functions as a menu bar. 5 Max, Min, and Ave Shows peak, minimum, and average values of the graph.
When more than one graph is drawn in the window, maximum, minimum, and average values of all the graphs are shown.
6 Graph properties Shows properties of the graph. Color and thickness of the line can be configured.
7 Time scale Shows time. The range is configurable.

13
4. Operation
4.1 Logging setting
The logging interval and other instrument settings can be configured from the
computer.
■ Logging interval
The logging interval is selectable from 1, 5, 10, 15, 30, and 60 minutes. The
maximum logging duration is 31 days by 1 minute intervals, 153 days by 5 minute
intervals. Choose appropriate configuration in accordance with your application and
the remaining memory capacity.
■ Log type
The LCD displays H2S concentration at every 2 seconds while data logging. The
preferable type of data can be selected at the time of recording.
Below is the list of log types.
Log type
(REAL) Instant value of logging interval.
(AVE) Average value of logging interval.
(MAX) Peak value for the logging interval.
(MIN) Minimum value for the logging interval.
Likewise, the temperature logging data type can be selected. The temperature
logging can also be disabled.
NOTE
1. Duration of data logging may be limited by battery level. Be sure there is a full battery level displayed for long-term data logging.
2. Even if the temperature logging is disabled, H2S concentration data logging capacity is not increased.
14
1 2
Unscrew the external casing. Extract the main unit. Tip: Turn the bottom casing gently.
3 4
Connect the main unit to a computer with a USB cable.
The communication symbol will light up.
5
Launch ANASYS. Click on “Communication”, “Set Logging Condition”.
15
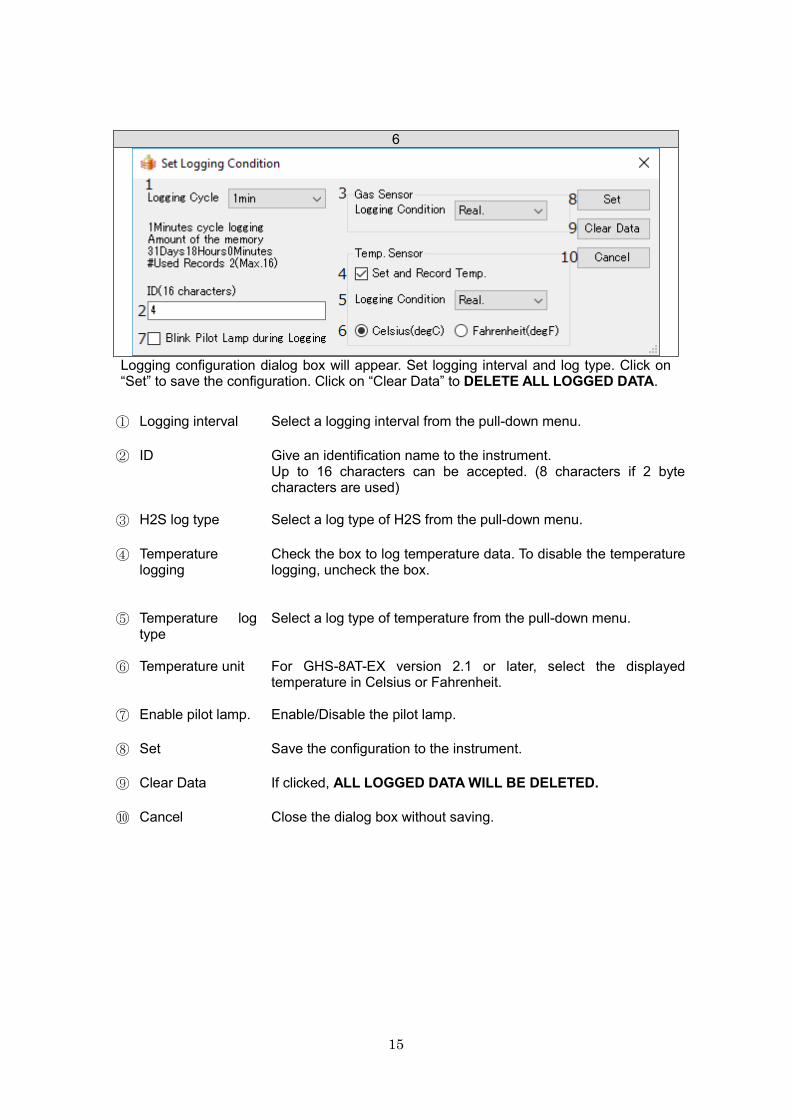
6
Logging configuration dialog box will appear. Set logging interval and log type. Click on “Set” to save the configuration. Click on “Clear Data” to DELETE ALL LOGGED DATA.
① Logging interval Select a logging interval from the pull-down menu.
② ID Give an identification name to the instrument. Up to 16 characters can be accepted. (8 characters if 2 byte characters are used)
③ H2S log type Select a log type of H2S from the pull-down menu.
④ Temperature logging
Check the box to log temperature data. To disable the temperature logging, uncheck the box.
⑤ Temperature log type
Select a log type of temperature from the pull-down menu.
⑥ Temperature unit For GHS-8AT-EX version 2.1 or later, select the displayed temperature in Celsius or Fahrenheit.
⑦ Enable pilot lamp. Enable/Disable the pilot lamp.
⑧ Set Save the configuration to the instrument.
⑨ Clear Data If clicked, ALL LOGGED DATA WILL BE DELETED.
⑩ Cancel Close the dialog box without saving.

16
4.2 Setting date and time of the instrument.
Click on [Communication] and [Set Date/Time]. The dialog box will appear.
① Date Click on the down-arrow button and select the date from the calendar.
② Time Adjust time. Click and highlight hour, minute, and second. Enter digits or use the up-down arrows to adjust the value.
③ Set Date/Time Save the date and time to the instrument.
④ Get the
instrument time
Display the date and time of the instrument.
⑤ Get PC time Display the date and time of the computer. This date and time can be saved to the instrument by clicking “Set Date/Time”.
⑥ Cancel Exit without saving the settings.
4.3 Downloading logging data
Before downloading the data, install ANASYS and device driver to the computer.
1 2
Connect the main unit to the computer with a USB cable.
The communication symbol will light up.
17
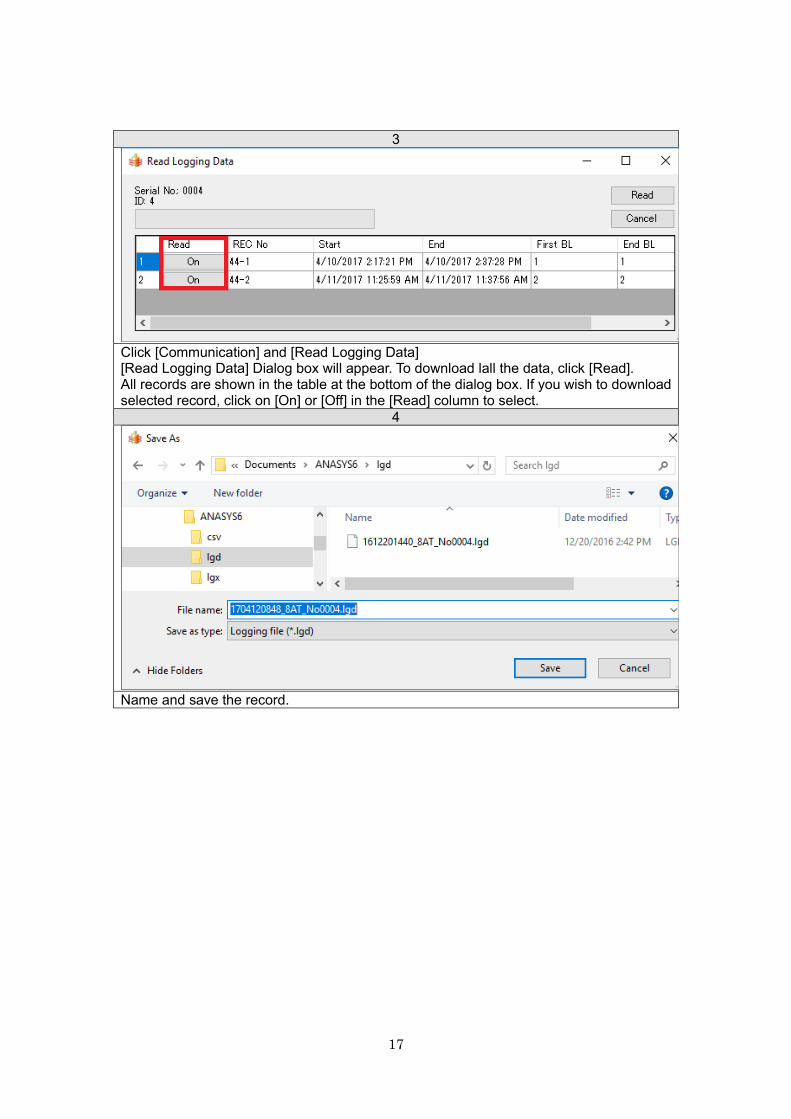
3
Click [Communication] and [Read Logging Data] [Read Logging Data] Dialog box will appear. To download lall the data, click [Read]. All records are shown in the table at the bottom of the dialog box. If you wish to download selected record, click on [On] or [Off] in the [Read] column to select.
4
Name and save the record.

18
Records
Logged data is composed of the date and time, logged concentrations, and temperatures.
This continuous data is bundled as one record by every logging session. Up to 16 records
can be saved to the instrument. Be sure to check the number of records saved in the
instrument before starting/stopping the data logging.
A record is terminated when;
・ Data logging is stopped by pressing the REC button.
・ Data logging is automatically stopped due to a low battery.
・ Data logging is automatically stopped when the instrument is connected to the
computer.
・ Data logging is automatically stopped due to running out of the memory.
When data logging is automatically stopped, a status message will be recorded.
Example: Data example when the record is terminated due to a low battery.
Data No. Date Conc. [ppm] Temp. [degC]
258 2008/06/05 15:04 125 24.5
259 2008/06/05 15:04 120 24.6
260 2008/06/05 15:05 Low battery -
If the record is terminated by connecting to a PC, [Connected PC] will be recorded.
If the record is terminated due to insufficient memory, [Data Full] will be recorded.
19
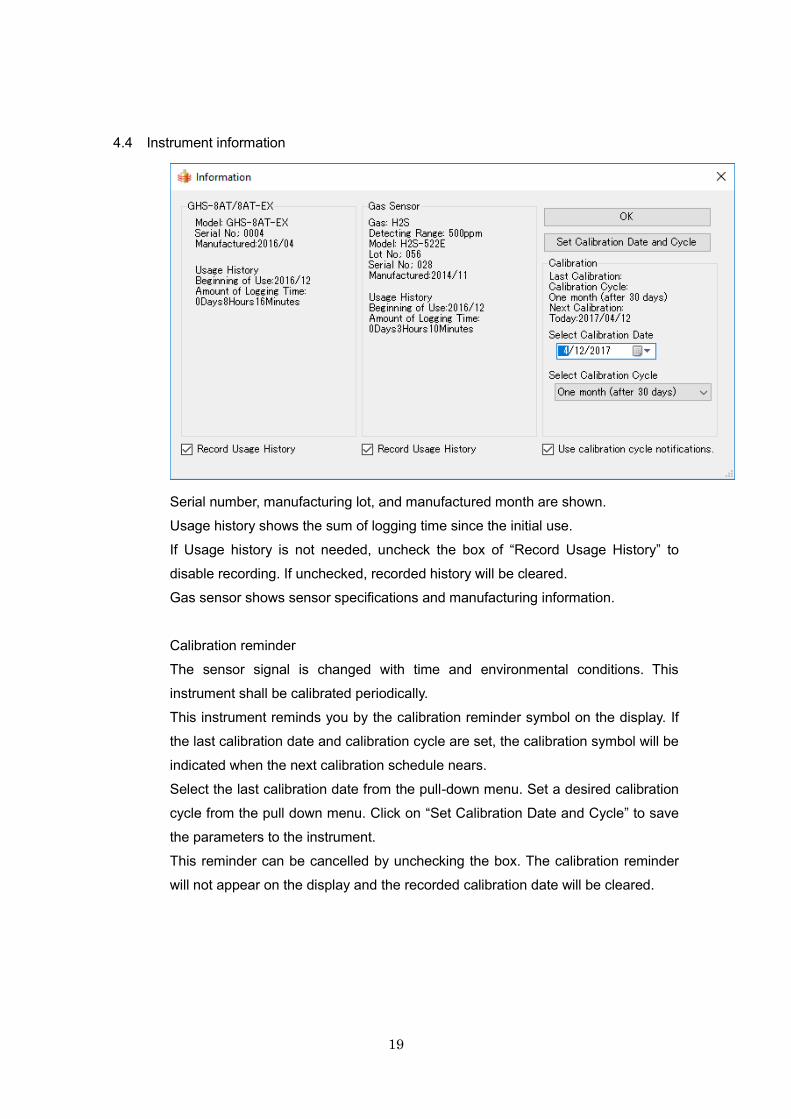
4.4 Instrument information
Serial number, manufacturing lot, and manufactured month are shown.
Usage history shows the sum of logging time since the initial use.
If Usage history is not needed, uncheck the box of “Record Usage History” to
disable recording. If unchecked, recorded history will be cleared.
Gas sensor shows sensor specifications and manufacturing information.
Calibration reminder
The sensor signal is changed with time and environmental conditions. This
instrument shall be calibrated periodically.
This instrument reminds you by the calibration reminder symbol on the display. If
the last calibration date and calibration cycle are set, the calibration symbol will be
indicated when the next calibration schedule nears.
Select the last calibration date from the pull-down menu. Set a desired calibration
cycle from the pull down menu. Click on “Set Calibration Date and Cycle” to save
the parameters to the instrument.
This reminder can be cancelled by unchecking the box. The calibration reminder
will not appear on the display and the recorded calibration date will be cleared.
20
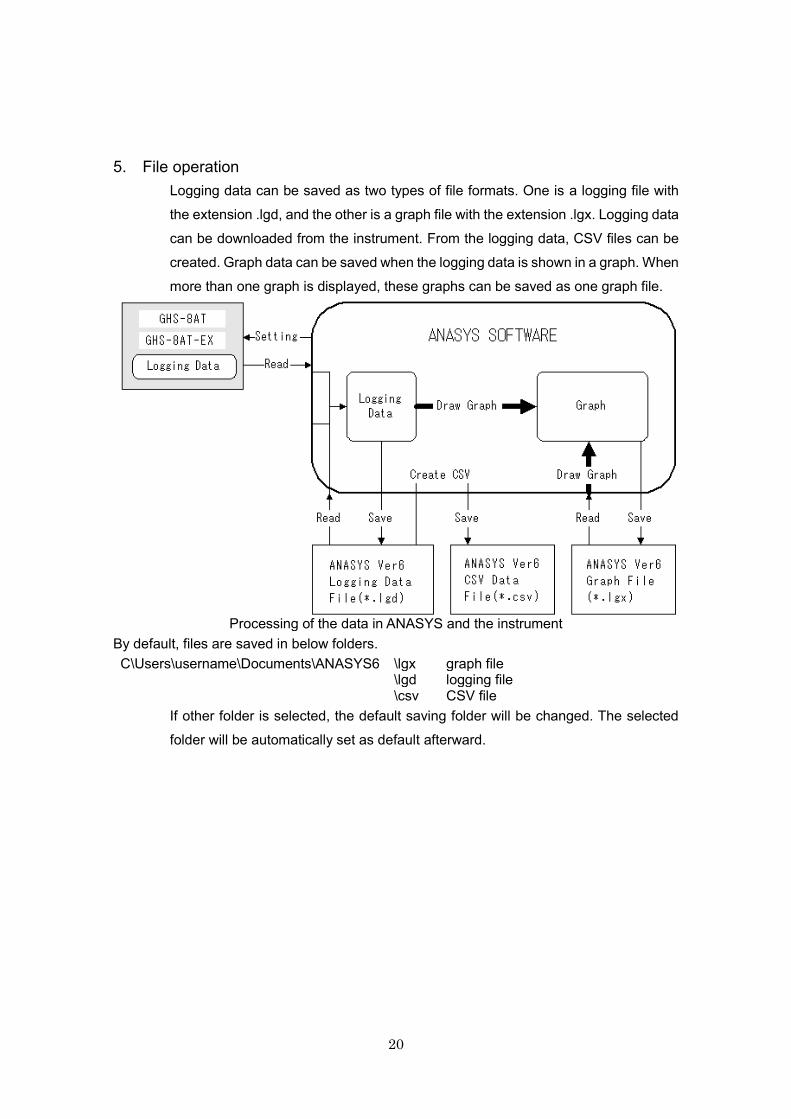
5. File operation
Logging data can be saved as two types of file formats. One is a logging file with
the extension .lgd, and the other is a graph file with the extension .lgx. Logging data
can be downloaded from the instrument. From the logging data, CSV files can be
created. Graph data can be saved when the logging data is shown in a graph. When
more than one graph is displayed, these graphs can be saved as one graph file.
Processing of the data in ANASYS and the instrument
By default, files are saved in below folders.
C\Users\username\Documents\ANASYS6 \lgx graph file \lgd logging file \csv CSV file
If other folder is selected, the default saving folder will be changed. The selected
folder will be automatically set as default afterward.
21
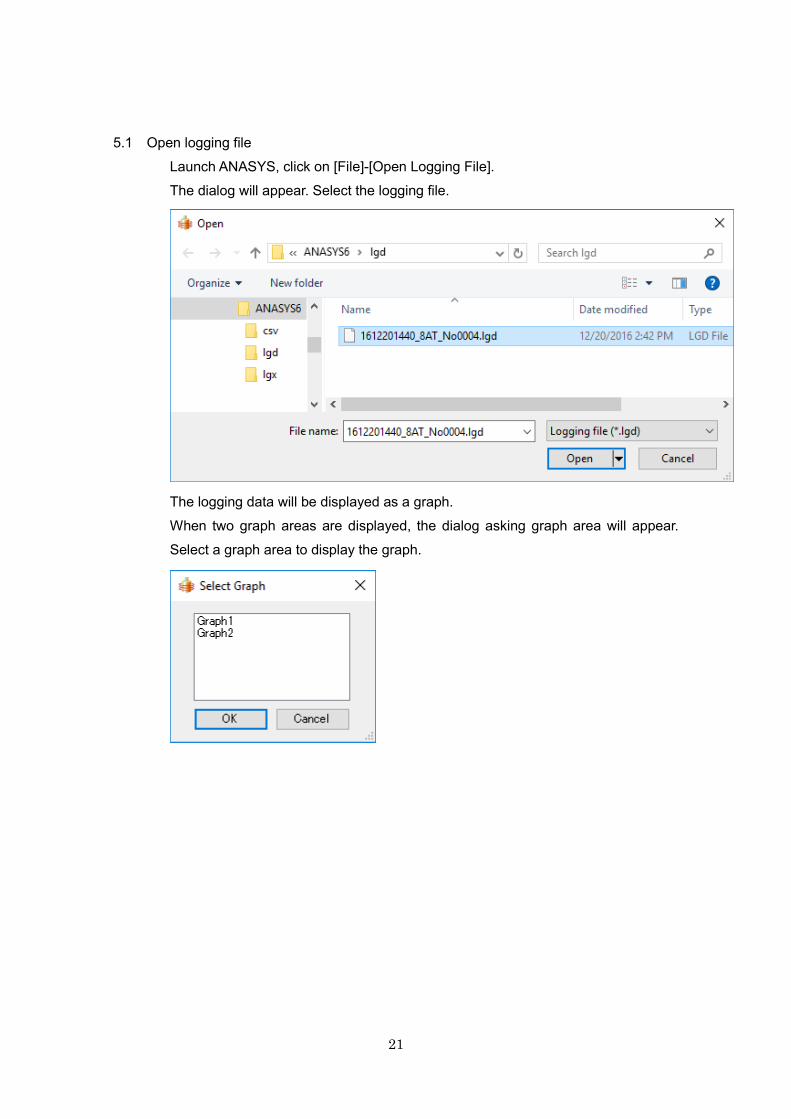
5.1 Open logging file
Launch ANASYS, click on [File]-[Open Logging File].
The dialog will appear. Select the logging file.
The logging data will be displayed as a graph.
When two graph areas are displayed, the dialog asking graph area will appear.
Select a graph area to display the graph.
22
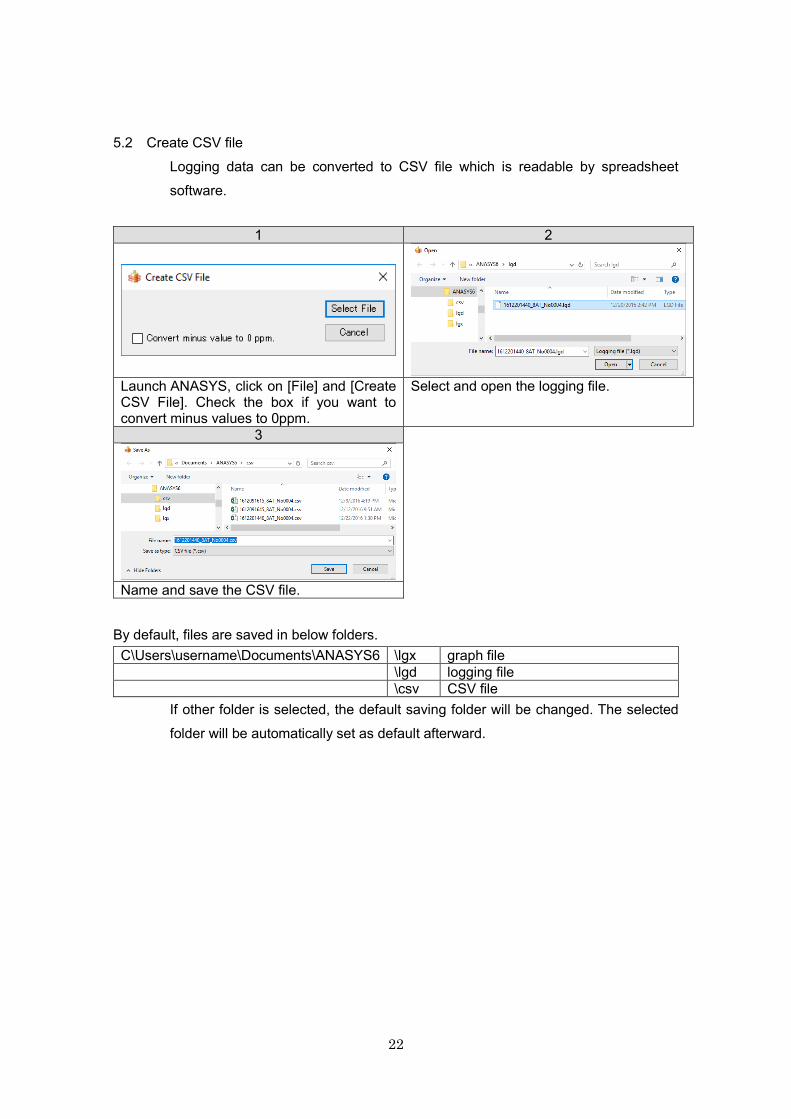
5.2 Create CSV file
Logging data can be converted to CSV file which is readable by spreadsheet
software.
1 2
Launch ANASYS, click on [File] and [Create CSV File]. Check the box if you want to convert minus values to 0ppm.
Select and open the logging file.
3
Name and save the CSV file.
By default, files are saved in below folders.
C\Users\username\Documents\ANASYS6 \lgx graph file
\lgd logging file
\csv CSV file
If other folder is selected, the default saving folder will be changed. The selected
folder will be automatically set as default afterward.
23
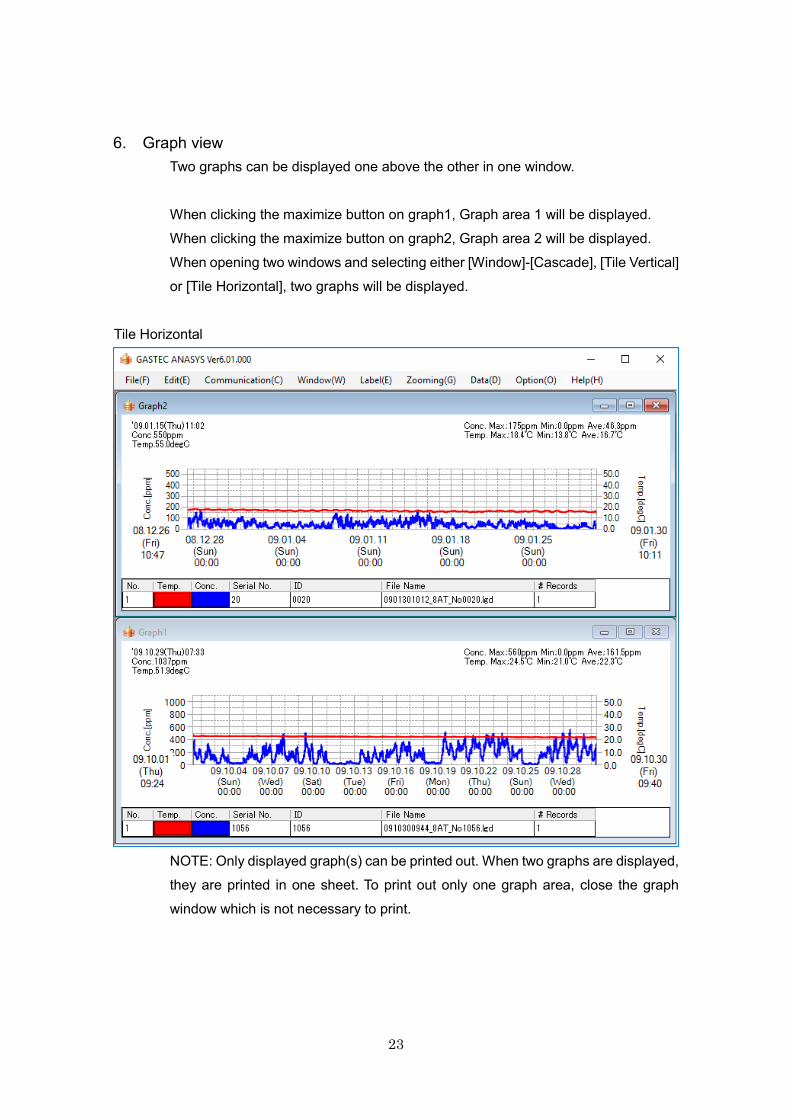
6. Graph view
Two graphs can be displayed one above the other in one window.
When clicking the maximize button on graph1, Graph area 1 will be displayed.
When clicking the maximize button on graph2, Graph area 2 will be displayed.
When opening two windows and selecting either [Window]-[Cascade], [Tile Vertical]
or [Tile Horizontal], two graphs will be displayed.
Tile Horizontal
NOTE: Only displayed graph(s) can be printed out. When two graphs are displayed,
they are printed in one sheet. To print out only one graph area, close the graph
window which is not necessary to print.
24
7. Graph
7.1 Graph appearance
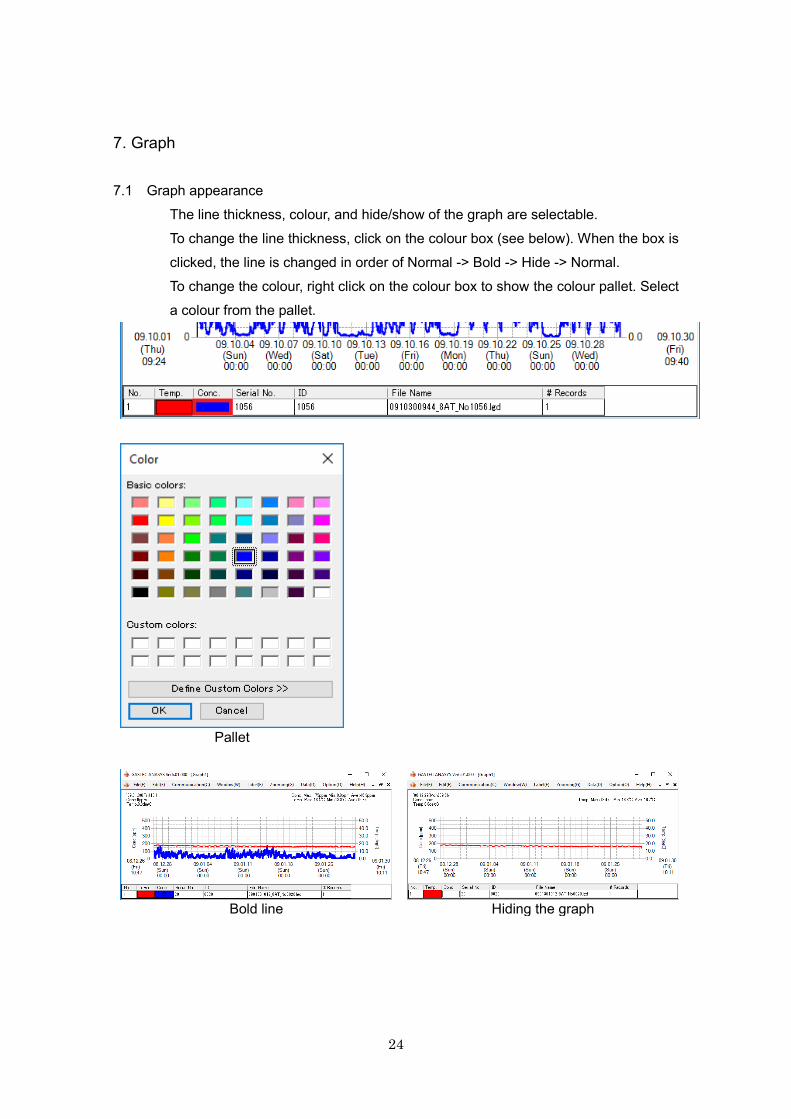
The line thickness, colour, and hide/show of the graph are selectable.
To change the line thickness, click on the colour box (see below). When the box is
clicked, the line is changed in order of Normal -> Bold -> Hide -> Normal.
To change the colour, right click on the colour box to show the colour pallet. Select
a colour from the pallet.
Pallet
Bold line Hiding the graph
25
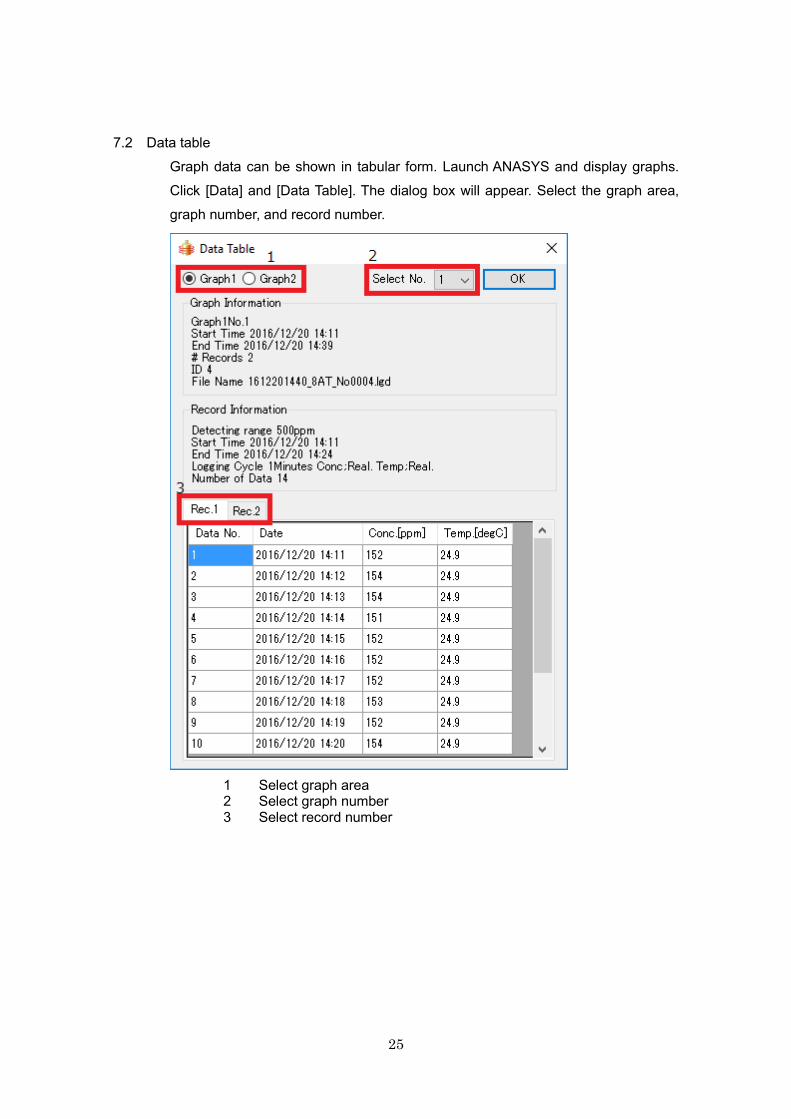
7.2 Data table
Graph data can be shown in tabular form. Launch ANASYS and display graphs.
Click [Data] and [Data Table]. The dialog box will appear. Select the graph area,
graph number, and record number.
1 Select graph area 2 Select graph number 3 Select record number
26
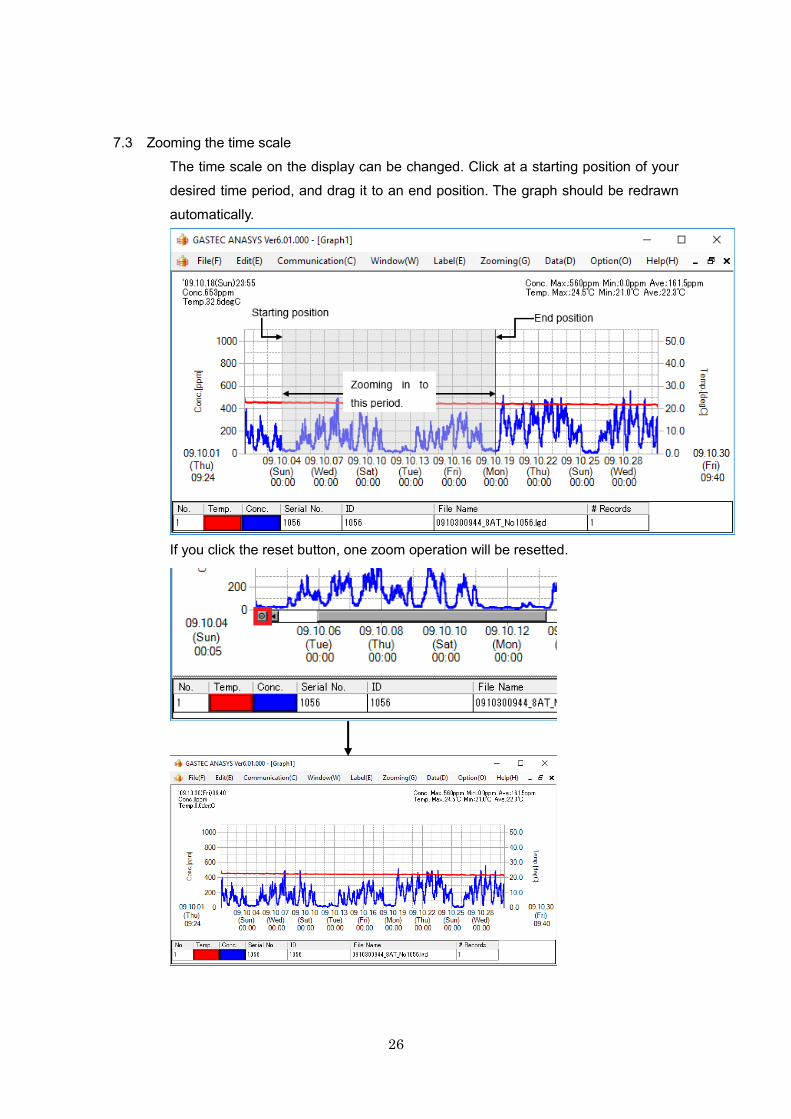
7.3 Zooming the time scale
The time scale on the display can be changed. Click at a starting position of your
desired time period, and drag it to an end position. The graph should be redrawn
automatically.
If you click the reset button, one zoom operation will be resetted.
27
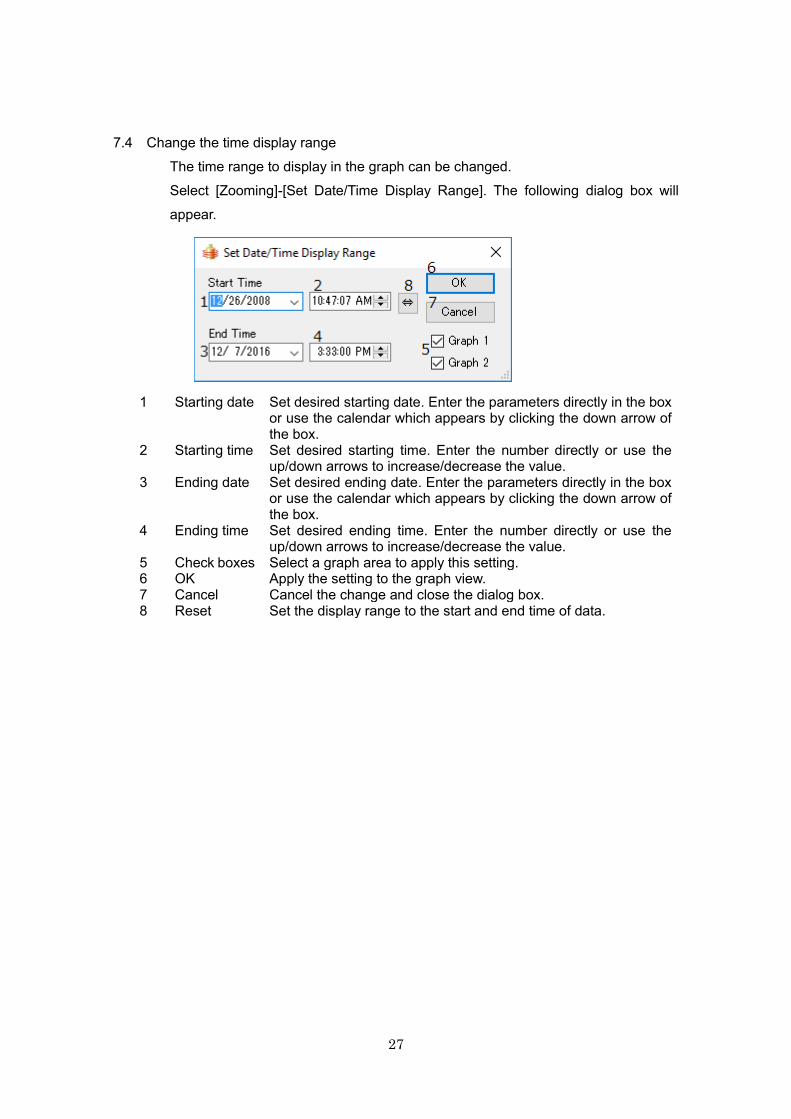
7.4 Change the time display range
The time range to display in the graph can be changed.
Select [Zooming]-[Set Date/Time Display Range]. The following dialog box will
appear.
1 Starting date Set desired starting date. Enter the parameters directly in the box or use the calendar which appears by clicking the down arrow of the box.
2 Starting time Set desired starting time. Enter the number directly or use the up/down arrows to increase/decrease the value.
3 Ending date Set desired ending date. Enter the parameters directly in the box or use the calendar which appears by clicking the down arrow of the box.
4 Ending time Set desired ending time. Enter the number directly or use the up/down arrows to increase/decrease the value.
5 Check boxes Select a graph area to apply this setting. 6 OK Apply the setting to the graph view. 7 Cancel Cancel the change and close the dialog box. 8 Reset Set the display range to the start and end time of data.
28
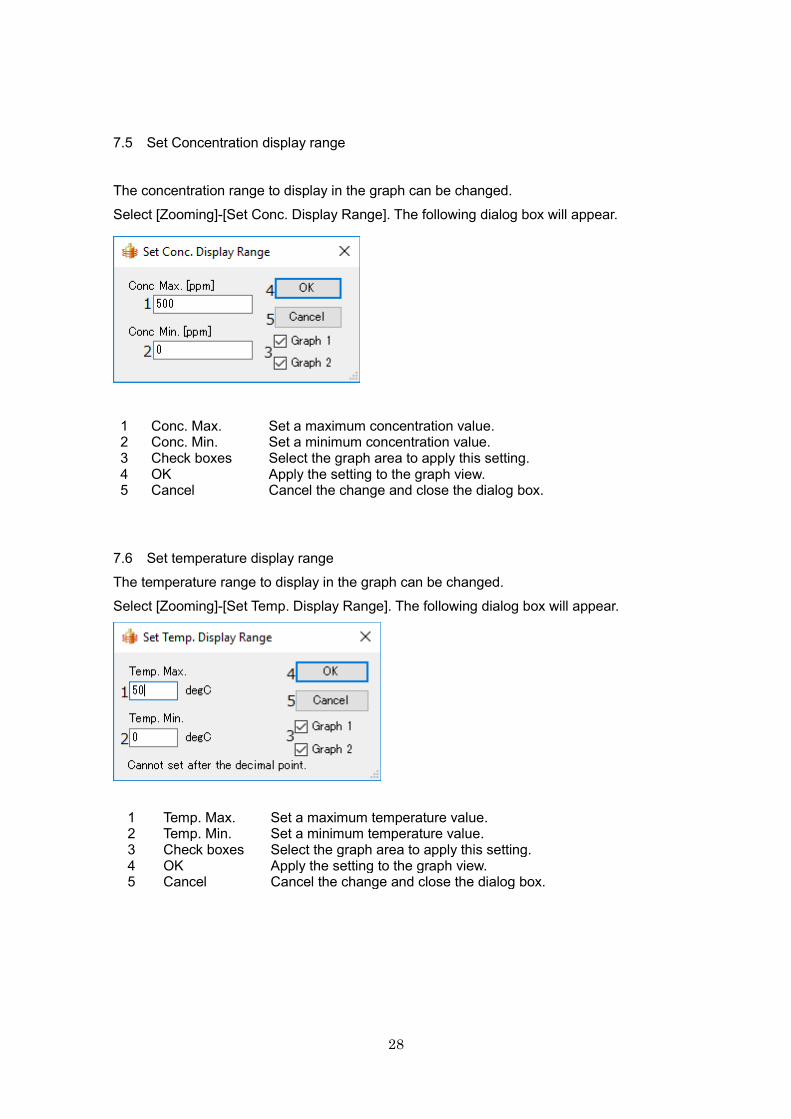
7.5 Set Concentration display range
The concentration range to display in the graph can be changed.
Select [Zooming]-[Set Conc. Display Range]. The following dialog box will appear.
1 Conc. Max. Set a maximum concentration value. 2 Conc. Min. Set a minimum concentration value. 3 Check boxes Select the graph area to apply this setting. 4 OK Apply the setting to the graph view. 5 Cancel Cancel the change and close the dialog box.
7.6 Set temperature display range
The temperature range to display in the graph can be changed.
Select [Zooming]-[Set Temp. Display Range]. The following dialog box will appear.
1 Temp. Max. Set a maximum temperature value. 2 Temp. Min. Set a minimum temperature value. 3 Check boxes Select the graph area to apply this setting. 4 OK Apply the setting to the graph view. 5 Cancel Cancel the change and close the dialog box.

29
7.7 Label
Title, Comment, or arrow can be added to the graph.
Title
Select [Label]-[Title]-[New, Edit]. The following dialog box will appear.
Enter the title and then click on OK.
Comment
Select [Label]-[Comment]-[New]. The following dialog box will appear.
Enter comment and then click on OK. The comments can be moved by click and
drag.
Select [Label]-[Comment]-[Edit]. The following dialog box will appear.
The comments can be editted.
30
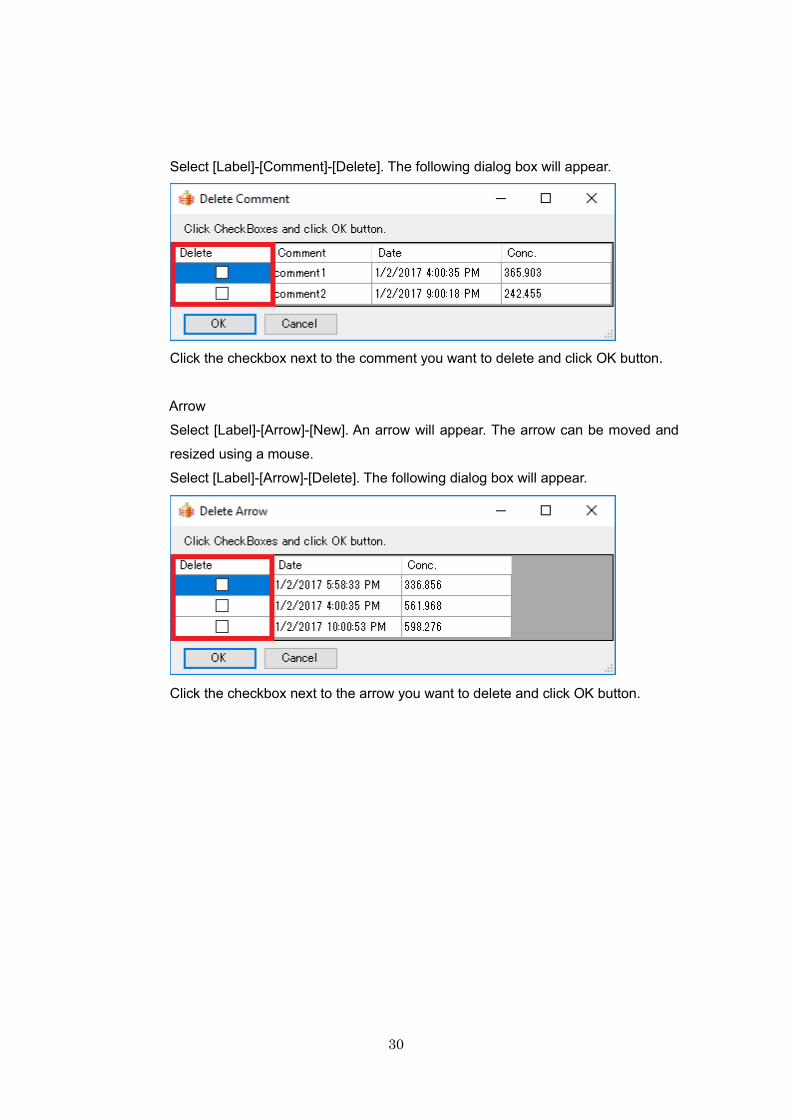
Select [Label]-[Comment]-[Delete]. The following dialog box will appear.
Click the checkbox next to the comment you want to delete and click OK button.
Arrow
Select [Label]-[Arrow]-[New]. An arrow will appear. The arrow can be moved and
resized using a mouse.
Select [Label]-[Arrow]-[Delete]. The following dialog box will appear.
Click the checkbox next to the arrow you want to delete and click OK button.
31
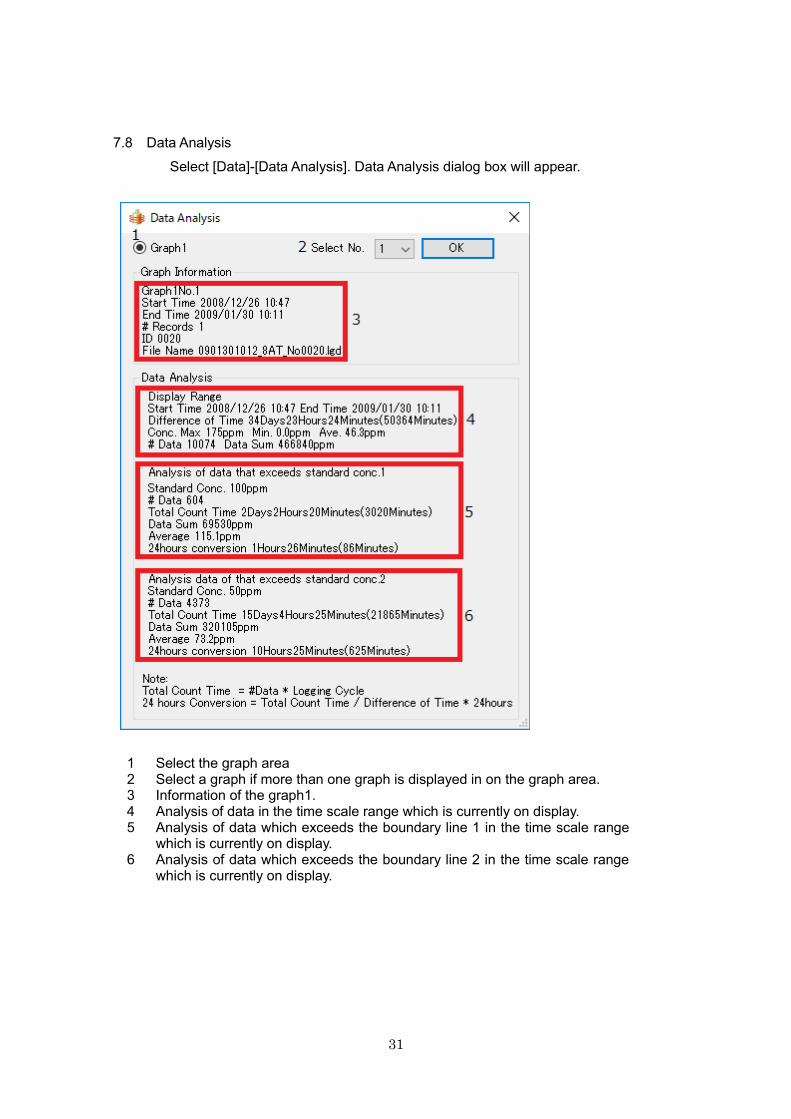
7.8 Data Analysis
Select [Data]-[Data Analysis]. Data Analysis dialog box will appear.
1 Select the graph area 2 Select a graph if more than one graph is displayed in on the graph area. 3 Information of the graph1. 4 Analysis of data in the time scale range which is currently on display. 5 Analysis of data which exceeds the boundary line 1 in the time scale range
which is currently on display. 6 Analysis of data which exceeds the boundary line 2 in the time scale range
which is currently on display.
32
8. Options
8.1 Set boundary line.
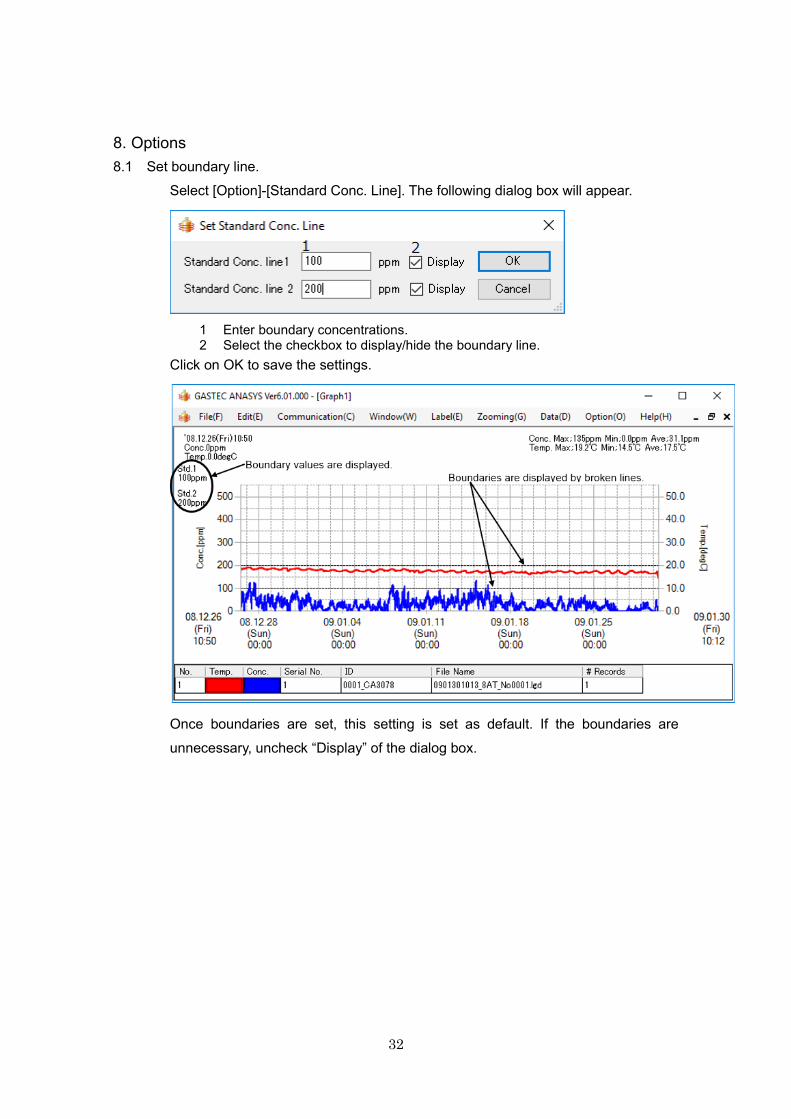
Select [Option]-[Standard Conc. Line]. The following dialog box will appear.
1 Enter boundary concentrations. 2 Select the checkbox to display/hide the boundary line.
Click on OK to save the settings.
Once boundaries are set, this setting is set as default. If the boundaries are
unnecessary, uncheck “Display” of the dialog box.

33
8.2 Display setting
Select [Option]-[Set Display]. The following dialog box will appear.
1 Cursor value Display/hide the cursor pointing value which appears on the
upper left of the graph area. 2 Not display
temperature Display/Hide temperature information.
3 Temperature Set the unit of temperature displayed in the graph and CSV file.
4 Maximum concentration value
Display/Hide the maximum concentration value which appears on the upper right of the graph area.
5 Minimum concentration value
Display/Hide the minimum concentration value which appears on the upper right of the graph area.
6 Average concentration value.
Display/Hide the average concentration value which appears on the upper right of the graph area.
7 0ppm or less is displayed as 0ppm
When checked, minus values are displayed as 0ppm.
8 Average line Display/Hide the average line on the graph. 9 Maximum
temperature value Display/Hide the maximum temperature value which appears on the upper right of the graph area.
10 Minimum temperature value
Display/Hide the minimum temperature value which appears on the upper right of the graph area.
11 Average temperature value
Display/Hide the average temperature value which appears on the upper right of the graph area.
Once the above settings are set, the settings will be default.
34
9. Menu list
From the menu bar of the window, the following operations can be selected.
9.1 File
New Open a new graph window. Open Graph File Open a graph file (*.lgx) to display it. Save graph File Save the graph displayed as a graph file. Close Graph File Close all the graphs on the display. Open Logging File
Open a logging file (*.lgd) to draw a graph. When two graph areas are displayed, select a graph area to draw the graph.
Create CSV File Convert the logging data to a CSV format file. Print Print out the graph. When two graphs are displayed, they are printed
in one sheet. To print out only one graph area, close the graph window which is not necessary to print.
Open lgg File Open the data which is saved by older ANASYS (Version 5.6 or older). Exit Quit ANASYS
9.2 Edit
Copy Copy the image of the window to the clipboard. Save Bitmap File Save the image of the window as bitmap file.
9.3 Communication
Read Logging Data
Download data from the instrument.
Set Logging Condition
Configure the settings of the instrument.
Set Date/Time Set the time and date of the instrument. Information Display the information of the main unit, sensor information, and
calibration cycle.
35
9.4 Window
New Window Open a new graph window. Cascade Pile up graph windows. Tile Vertical Tile graph windows vertically. Tile Horizontal Tile graph windows horizontally. Close All Close all graph windows.
9.5 Label
Title New, Edit
Add/Edit the title.
Title Delete
Delete the title.
Comment New
Add a comment text box.
Comment Edit
Edit the comment text box.
Comment Delete
Delete the comment text box.
Arrow New
Draw an arrow on Graph.
Arrow Delete
Delete the arrow on Graph.
9.6 Zooming
Set Date/Time Display Range
Change time ranges to display.
Set Conc. Display Range
Change concentration ranges to display.
Set Temp. Display Range
Change temperature ranges to display.
9.7 Data
Data Table Display the graph data in tabular form. Data Analysis Display data analysis of all the graphs.
36
9.8 Option
Set standard Conc. line
Set the boundary line on the graph area.
Set Display Set display settings.
9.9 Help
Help Launch the help function of the software. ANASYS6 Version
Version information of the software
10. Specifications
10.1 Specifications
Product name Data Analysis software for H2S Data Logger ANASYS
Product code GHS-PC-3
Operating system Microsoft Windows 7 SP1 32bit/64bit Microsoft Windows 8.1 32bit/64bit Microsoft Windows 10 32bit/64bit
Required items for the software environment other than Windows OS
Microsoft .NET Framework 4.5 or later
Communication interface USB2.0
CPU >1GHz
Memory >512MB
Hard Drive >850MB of free space(32bit) >2GB of free space(64bit)
Features Downloading the data from instrument, setting logging settings, setting time of the instrument, saving log and graph data, display graph (maximum 10 in one window), creating CSV file.
37
11. Trouble shooting
Connection failure
Possible cause Action to be taken
Using USB hub Connect the instrument directly to the computer.
Can not install the device driver Get the latest device driver and try again
Cable failure Replace the USB cable
Contact failure Use other USB port of the computer.
Installing device driver is required again after installation procedure
Possible cause Actions to be taken
Other USB port is used Device driver needs to be installed with respect to each USB port. Use the USB port which driver is already installed or install the driver again.
Cannot install device driver Try again with the latest device driver.
Characters lap over the graph
Possible cause Actions to be taken
Wrong DPI value is set Set DPI of the display to default.
17I/MP


![INDEX [metalagencies.com] · EN 1057 Quality Marks BSI, AFNOR, NSAI, AENOR, RAL / DVGW, KIWA / GASTEC-QA, SITAC, STF VTT, GOST, VIK. Mechanical Properties 06 • WATER SUPPLY •](https://static.fdocuments.us/doc/165x107/5f0ad1247e708231d42d7c8a/index-en-1057-quality-marks-bsi-afnor-nsai-aenor-ral-dvgw-kiwa-gastec-qa.jpg)