Anand Rathi Jan 11
44
Anand Rathi Financial Services, its affiliates and subsidiaries, do and seek to do business with companies covered in its research reports. Thus, investors should be aware that the firm may have a conflict of interest that could affect the objectivity of this report. Investors should consider this report as only a single factor in making their investment decision. Disclosures and analyst certifications are located in Appendix 1. Anand Rathi Research India Equities India I Equities Property Report 28 January 2011 Property Mumbai Property – Demand high, but uncertain milieu We lower our estimates owing to prevailing uncertainty, local regulatory & political changes, and price correction (already factored in). We revisit our construction cost estimates for high- rises in Mumbai. Also, we lower our NAVs and factor in only paid-for projects as well as projects where land is already in possession. We remove some projects, given uncertainty. Although redevelopment entails long gestation, the current regulatory environment in the state increases uncertainty. To incorporate this, we remove projects won but where payment is pending and land is not yet in possession, along with some other projects (SRS, virgin land etc). Revisit construction costs. Based on our interaction with market participants (architects, consultants, developers and contractors), developers have under-estimated construction costs of high-rises in Mumbai and are likely to raise such costs in due course. Plan changes during execution, labor issues, equipment shortages and inexperience with high-rise constructions are key reasons for the rise in costs. We estimate a 7-12% negative impact on NAVs of real estate companies in our coverage. Sales order book high, but credit may get acute. In the past six quarters, Mumbai-based developers in our coverage have sold stock worth +`140bn and received +`38bn. However, they have big-ticket land/project acquisition plans, which is likely to make cash-flow management acute. Price corrections of 15-20% in Mumbai are imminent owing to the RBI’s current stance to increase cost of debt and risk weights on commercial realty, as well as the high selling prices. Valuation and risks. Although we reduce our NAVs and price targets for Mumbai-based developers, we are positive on them on account of higher entry barriers, lower acquisition costs and mounting demand. Risks: political uncertainty, credit availability. Overweight Nifty/Sensex: 5604/18684 BSE Realty vs Sensex BSE Realty Sensex 70 80 90 100 110 120 130 Jan-10 Mar-10 May-10 Jul-10 Sep-10 Nov-10 Jan-11 Source: Bloomberg Sector valuation matrix Company Rating Price (`) Sep'11 Target (`) Mar'12 Target (`) PE(x) FY12e PBV (x) FY12e Mar'12 NAV Option value `/Share HDIL Buy 156.0 377.0 234.0 6.8 0.6 288.0 151.6 DB Realty Buy 157.0 564.0 299.0 5.1 0.9 374.0 158.4 Ackruti City Buy 238.0 831.0 421.0 7.3 0.9 566.0 329.0 Peninsula Land Buy 59.5 78.0 81.0 5.5 1.0 81.0 - Source: Bloomberg, Anand Rathi Research Prices as of 27 Jan ’11
Transcript of Anand Rathi Jan 11
Anand Rathi Financial Services, its affiliates and subsidiaries, do and seek to do business with companies covered in its research reports. Thus, investors should be aware that the firm may have a conflict of interest that could affect the objectivity of this report. Investors should consider this report as only a single factor in making their investment decision. Disclosures and analyst certifications are located in Appendix 1. Anand Rathi Research India Equities
India I Equities Property
Report
28 January 2011
Property
Mumbai Property – Demand high, but uncertain milieu
We lower our estimates owing to prevailing uncertainty, local regulatory & political changes, and price correction (already factored in). We revisit our construction cost estimates for high-rises in Mumbai. Also, we lower our NAVs and factor in only paid-for projects as well as projects where land is already in possession.
We remove some projects, given uncertainty. Although redevelopment entails long gestation, the current regulatory environment in the state increases uncertainty. To incorporate this, we remove projects won but where payment is pending and land is not yet in possession, along with some other projects (SRS, virgin land etc).
Revisit construction costs. Based on our interaction with market participants (architects, consultants, developers and contractors), developers have under-estimated construction costs of high-rises in Mumbai and are likely to raise such costs in due course. Plan changes during execution, labor issues, equipment shortages and inexperience with high-rise constructions are key reasons for the rise in costs. We estimate a 7-12% negative impact on NAVs of real estate companies in our coverage.
Sales order book high, but credit may get acute. In the past six quarters, Mumbai-based developers in our coverage have sold stock worth +`140bn and received +`38bn. However, they have big-ticket land/project acquisition plans, which is likely to make cash-flow management acute. Price corrections of 15-20% in Mumbai are imminent owing to the RBI’s current stance to increase cost of debt and risk weights on commercial realty, as well as the high selling prices.
Valuation and risks. Although we reduce our NAVs and price targets for Mumbai-based developers, we are positive on them on account of higher entry barriers, lower acquisition costs and mounting demand. Risks: political uncertainty, credit availability.
Overweight
Nifty/Sensex: 5604/18684
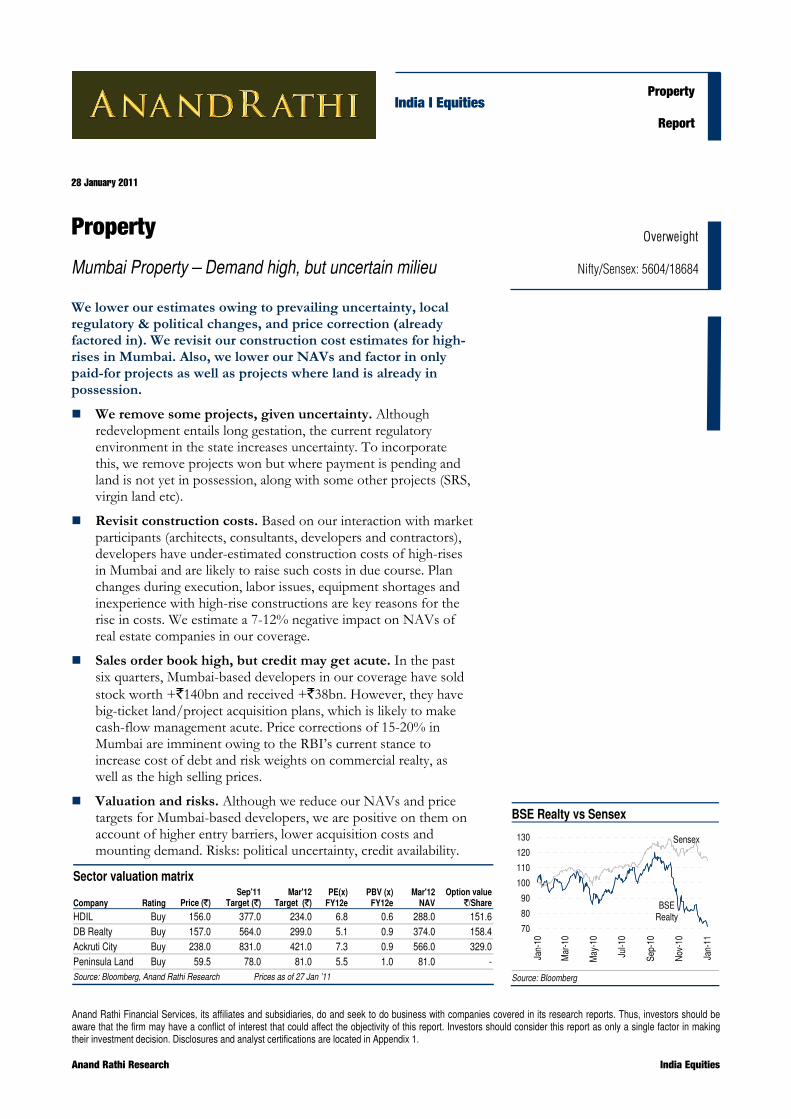
BSE Realty vs Sensex
BSE Realty
Sensex
70
80
90
100
110
120
130
Jan-
10
Mar
-10
May
-10
Jul-1
0
Sep-
10
Nov
-10
Jan-
11
Source: Bloomberg
Sector valuation matrix
Company Rating Price (`) Sep'11
Target (`) Mar'12
Target (`) PE(x) FY12e
PBV (x) FY12e
Mar'12 NAV
Option value `/Share
HDIL Buy 156.0 377.0 234.0 6.8 0.6 288.0 151.6 DB Realty Buy 157.0 564.0 299.0 5.1 0.9 374.0 158.4 Ackruti City Buy 238.0 831.0 421.0 7.3 0.9 566.0 329.0 Peninsula Land Buy 59.5 78.0 81.0 5.5 1.0 81.0 -Source: Bloomberg, Anand Rathi Research Prices as of 27 Jan ’11

28 January 2011 Mumbai Property – Demand high, but uncertain milieu
Anand Rathi Research 2
We remove some projects, given uncertainty Mumbai property developers, unlike peers in NCR and Bangalore, primarily use the rehabilitation/redevelopment route for development of property. This involves greater dependence on the regulatory and political machinery. Hence, project durations are lengthened and policy-dependent. Although we estimate longer gestation periods for such projects, given the current changes, we introduce further discounts in certain projects till clarity emerges on policies. Also, we remove from our valuation projects won but where payment is pending and land is not yet in possession, along with some other projects (SRS, virgin land etc). Such changes impact our NAVs and estimates for companies in our coverage.
Introduce discounts
On developable area
Mumbai-centered property developers largely follow the rehabilitation and redevelopment routes to property development – As many as 53% of regulated developers follow this. Although developers are using different routes/schemes for the maximum possible developable area on a plot, approvals for some projects with the same area would be difficult to obtain, given changes in government stance and infrastructure bottlenecks. Such projects could decrease in future or higher premiums would require to be paid. Such delays are likely to increase costs.
Given opaqueness in the sector and changes in recent government policies, we introduce a discount till further clarity emerges regarding disclosed projects of the developers.
On projects
We alter our position on development projects announced. We remove from our valuation projects won but where payment is pending and land is not yet in possession, given the potential for delays in land acquisition or in clearances/encroachments. Also, delay in some projects under construction, which could delay/affect rights to land parcels in future, have been removed from our project valuations.
Further, for virgin-land projects, where land has already been acquired but launch visibility is distant, we alter our position to include a certain premium to book value vs. initial development schedules assumed, as done for non-Mumbai developers.
53% of the organized developers in Mumbai follow the rehabilitation/
redevelopment route to property development
Fig 1 – Change in stance – SRS / re-development / PPP projects Company Project Earlier Now Remark
DB Realty Bandra (E) Gov Colony Development Value Removed LoA got, premium not paid yet
Ackruti City Bandra (E) Gov Colony Development Value Removed LoA got, premium not paid yet
HDIL Airport 65 acres Development Value Removed Delay in shifting, visibility on land not clear
Unitech Various Mumbai projects Development Value Removed Little movement (Ex Golibar, Andheri, Jogeshwari projects)
DB Realty PCMC Development Value Development Value Land under possession; approval delayed
Ackruti City Gujrat Biotech phase 3 Development Value Removed Phase 2 work slow; no visibility on Phase 3
Orbit Corp Kilachand House Development Value Removed Acquisition to be completed, under llegal process
Source: Anand Rathi Research

28 January 2011 Mumbai Property – Demand high, but uncertain milieu
Anand Rathi Research 3
Slum-rehabilitation projects and redevelopment projects in Mumbai also entail more litigation/legal cases than virgin-land projects in Mumbai or other cities. Although property development involves legal hassles, timely clearances are also an issue.
Recent regulatory changes
Suburban FSI likely to go up
The government of Maharashta in its winter session in Dec ’10 gave in-principle clearance to increased FSI in suburban Mumbai, from 1 to 1.33. At the same time, it kept the cap of 2 on total development. Although, the official regulation paper has yet to come, this reduces demand for TDR (assuming same construction) by 0.33x.
In addition to dependence on construction activity in Mumbai, prices of TDR would depend on the premium charged on FSI in micro-markets. We await clarity on this.
Developers affected: HDIL, DB Realty
Rethinking on public parking schemes - DCR 33(24)
The government is also rethinking the higher FSI given in lieu of providing public parking to MCGM (Municipal Corporation of Greater Mumbai) free of cost. This re-consideration takes into account the infrastructure bottlenecks in south-central Mumbai, where most such schemes were cleared. Although projects in the approval stage are likely to be cleared, the area cleared and FSI awarded could change.
Tax exemption for FSI sales, post-rehabilitation
As per an amendment to Finance Bill 2010, slum-rehab projects cleared before Mar ’08 and post-rehab FSI sales falling under Sec 80 I(B) would get complete tax benefits. Developers who could avail of such benefits are HDIL and Ackruti City.
Fig 2 – Change in stance: virgin land projects Company Project Earlier Now Remark
DB Realty Mira Road Development Premium to book value Land conversion to be done; launch likely to be delayed
DB Realty Sangamwadi Development Book Value Land acquisition still on; land conversion to be done
Ackruti City Panvel, Uran Khalapur Premium to book value Premium to book value in line with land sold recently
HDIL Vasai - Virar Premium to book value Premium to book value in line with land sold recently
HDIL Kochi, Hyd Book Value Book Value JDA projects, money paid nil, minimum
DLF HSIDC Development Book Value paid Land change to be done; 10% of total money paid
Source: Anand Rathi Research

28 January 2011 Mumbai Property – Demand high, but uncertain milieu
Anand Rathi Research 4
Construction costs: underestimated We re-visit our construction-cost estimates for high-rises planned in the city. Our interaction with architects, consultants, contractors and developers lead us to believe that most present project costs have been under-estimated by developers and are likely to be raised, as in the past. Plan changes during execution, labor issues, equipment shortages and lack of experience in high-rise constructions are the key reasons for rise in construction costs. Our NAVs for Mumbai developers, therefore, drop 7-12%.
Evaluating cost pressures
Looking at construction-cost hikes by developers recently and in the past two years, we met contractors, consultants, architects and developer teams to evaluate construction timelines and costs for proposed high-rises planned or to be constructed in the next few years. We believe developers today have under-estimated construction costs, which would need to be increased 40-90% in coming years.
Fig 3 – Increase in construction costs as one goes higher No of Floors Const Cost (`/ sqft)
30 3,000
50 4,750
70 6,500
90 8,250
110 10,000
130 11,750
Source: Industry, Anand Rathi Research
Key reasons for increase in costs
Regulatory approvals are the biggest hindrance to starting construction. Equally, the time to finalize plans also leads to delays in construction and rise in prices. Lately, most large developers in Mumbai, particularly those with land parcels in South and South-Central Mumbai, have aimed at developing high-rises (towers of 60 floors and more). These require larger plots and an additional set of clearances. With limited space but higher FSI from other schemes, developers are planning higher developable area and high-rises. Although sellable area is likely to go up, costs of construction would also be higher.
According to our interactions, key variables to construction are:
Consultancy. For high-rise construction, architects and consultants charge more, given the other issues such as wind-funnel tests, lifts, infrastructure needs (fire-fighting, water treatment etc) that come into play.
Labor. Experienced and equipped labor is required but is scarce. Developers attract ex-pat workers, but these work on a single-project basis.
Contractors. Since most developers outsource construction, given the more-than-a-dozen new projects, execution capacity of contractors has to be ramped up, notwithstanding capability. A few developers plan to secure foreign contractors.
Construction-cost estimates could rise 40-90% in the next few years
Smaller plot size and large developable area are causing delay
in obtaining approvals

28 January 2011 Mumbai Property – Demand high, but uncertain milieu
Anand Rathi Research 5
Equipment/technology. Although new processes are being introduced to replace traditional structural work, their greater efficiency has yet to be proven. This would raise cost effectiveness. With the greater amount of work, such techniques are cheaper.
Fig 4 – High-rises coming up in South-Central Mumbai Company Project Height Proposed (mtrs) Floors Proposed Units
DB Realty Crown 374 56 450
DB Realty Heights 394 85 264
DB Realty Turf View 385 60 300
DB Realty Views 350 60 NA
DB Realty Enclave 2 350 60 NA
DB Realty Park 350 60 260
DB Realty Enclave 3 365 72 189
DB Realty Skyz 350 60 180
DB Realty Splendour 350 64 246
DB Realty Central 362 62 164
Orbit Corp Terraces 360 60 120
Oberoi Realty Oasis 329 80 300
Lodha Developers World One 501 111 993
DLF NTC Mills 375* 85 1,102
Ackruti City H Mills 250 90 NA
IBREL Sky 365* 75 110
IBREL Sky Suites 365* 75 300
IBREL Forest 365* 75 315
Lokhandwala Minerva 360* 65* 334
Prakash Mills NA 370* 80 320
Sri Ram Urban Palace Royale 370* 80* NA
IBREL Sky Blue NA 90* 180
Source: Industry, Anand Rathi Research *estimated

28 January 2011 Mumbai Property – Demand high, but uncertain milieu
Anand Rathi Research 6
Sales order-book high, but acquisitions to tighten purse In the past six quarters, the top 4 Mumbai-based listed developers have sold stock worth +`140bn, with receivables of +`38bn. These developers have big-ticket land/project acquisition plans, which are likely to lead to acute cash-flow management. The current RBI stance to increase the cost of debt and risk weights on commercial realty would lessen liquidity. Higher selling prices have hit volumes, and corrections (15-20% in certain micro-markets) are imminent.
Sales order book – In comfortable zone
With the uptake in the market and lower prices in 1QFY10, most launched projects then were readily absorbed in the suburbs, with absorption in the island city being investor-led. Across markets, developers have been able to sell projects with higher level of investors in South-Central Mumbai than in Mumbai suburbs.
Fig 5 – Sales order book of key Mumbai developers Developer Sales Value (`m) -
Till 2QFY11 Cash Received (`m) 3QFY11e Sales Value
(`m)
DB Realty 54,582.0 14,820.0 9,000.0
HDIL 50,000.0 9,820.0 7,500.0
Sunteck Realty 8,618.0 3,430.0 3,500.0
Ackruti City 16,800.0 5,395.0 1,500.0
Orbit Corp 11,335.0 4,957.0 1,500.0
Source: Anand Rathi Research.
Although we reiterate that there is little ready inventory in South-Central Mumbai at present and for the next two years, given the numerous high-ticket launches offering more units, we estimate prices in the region to correct the most vs. other sub-regions of the city. Although the western and central suburbs have also seen high price increases, the correction could be less, given differences in ticket size, and shifting of commercial activity towards the suburbs.
Fig 6 – Blended average price rises across Mumbai micro-markets Area (Mumbai) Price rise from March'09 to Dec'10
South 15%
South- Central 33%
Western Suburbs 21%
Central Suburbs 29%
Source: Anand Rathi Research
Although the breakeven of Mumbai developers comes earlier than others (given low land costs), most developers are into land/project acquisitions. With credit becoming harder to come by, developers are likely to correct prices/arrest price hikes.
Comfortable balance sheets – At least till 2QFY11
With the equity raised in the past few quarters, and with good sales recoverables, the balance sheets of most Mumbai developers have been light, till recently. With the recent bribery issue naming property companies, the RBI’s stance on raising weights on commercial loans and
Larger Mumbai-based developers have sold stock worth +`140bn;
with receivables of +`38bn

28 January 2011 Mumbai Property – Demand high, but uncertain milieu
Anand Rathi Research 7
rates, credit to developers could be difficult. Also, disbursements for sanctioned loans could be delayed.
Fig 7 – Comfortable balance sheets – at least till date Developer Gross Debt - 2QFY11 (`bn) Net D/E (x) Repayment in 2HFY11 (`bn)
DB Realty 7.0 0.1 -
HDIL 41.3 0.3 2.2
Sunteck Realty 5.7 0.9 -
Ackruti City 18.1 1.0 1.3
Orbit Corp 9.2 1.0 1.1
Oberoi Realty - NA -
Source: Anand Rathi Research.
Fig 8 – Developers Developer Announced land acquisitions
DB Realty Land Acquisitions worth `80bn planned
Ackruti City Land Acquisitions worth `3.33bn planned
HDIL Land acquisition for MIAL project worth `6bn planned
Orbit Corp Kilachand House
HDIL Project investments worth `9bn
Source: Anand Rathi Research

28 January 2011 Mumbai Property – Demand high, but uncertain milieu
Anand Rathi Research 8
Company Section

Anand Rathi Financial Services Limited does and seeks to do business with companies covered in its research reports. Thus, investors should be aware that the firm may have a conflict of interest that could affect the objectivity of this report. Investors should consider this report as only a single factor in making their investment decision. Disclosures and analyst certifications are located in Appendix 1 Anand Rathi Research India Equities
India I Equities
Key financials
Year end 31 Mar FY09 FY10 FY11e FY12e FY13e
Sales (`m) 17,284 15,021 22,991 26,262 22,560
Net profit (`m) 7,866 5,666 7,188 10,094 9,565
EPS (`) 15.4 13.0 16.3 22.9 21.7
Growth (%) (52.0) (15.5) 25.6 40.4 (5.2)
PE (x) 10.5 12.4 9.9 7.0 7.4
PBV (x) 1.6 1.0 0.8 0.6 0.6
RoE (%) 16.8 10.0 8.7 9.9 8.4
RoCE (%) 10.1 7.3 8.0 10.3 8.9
Dividend yield (%) - - - - -
Net gearing (%) 92.0 47.0 27.9 19.4 21.3
Source: Company, Anand Rathi Research Prices as of 27 Jan ’11
Property
Update
28 January 2011
HDIL
Looking beyond MIAL; maintain Buy
Though MIAL redevelopment has been steady, shifting of families has been delayed, raising risk for the 65 acres and phases 2&3. Of the funds raised from QIP, and land & FSI sales, we believe HDIL invested ~`9bn in three projects to further de-risk MIAL. We rollover our NAV to Mar 12e, lowering it to `255; we trim our price target to `228, at 10% discount to NAV. Buy.
MIAL project. Shifting of families in phase 1 is likely to lag due to issues at the government level (undecided cut-off dates of tenants) and resistance to shifting by some sections. This raises risk on the 65acre airport land and development of phases 2&3.
Utilizing cash, de-risking business. The +`15bn cash built up on the balance sheet was used to acquire projects, investing `9bn in three projects. This would add another 47-50m sqft land bank (of which, 29m sqft would be in Mumbai City). As projects are large, we await further clarity before assigning value to them.
Change estimates. Our NAV is impacted by removal of 65 acres of free-sale land in MIAL, part of phase 2, and phase 3 from valuation due to lack of land visibility and adding a discount to some under-construction slum-rehab projects in Mumbai. For now, the new acquisitions are taken at cost.
Valuation and risks. Our Mar ’12e NAV is `274 and target price is `247, which is at 10% discount to NAV. At CMP, the stock trades at 0.7x Mar ’12e PBV. Key risk: slowdown in execution.
Rating: Buy Target Price: `228 Share Price: `156
Key data HDIL IN/HDIL.BO
52-week high/low `345/`152 Sensex/Nifty 18684/56043-m average volume US$27m Market cap `64bn/US$1405m
Shares outstanding 415mFree float 61.4%Promoters 38.6%Foreign Institutions 39.3%Domestic Institutions 0.5%Public 21.6%
Relative price performance
HDIL
Sensex
150
200
250
300
350
400
450
Jan-
10
Mar
-10
May
-10
Jul-1
0
Sep-
10
Nov
-10
Jan-
11
Source: Bloomberg
Change in Estimates Target Reco

28 January 2011 HDIL – Looking beyond MIAL; maintain Buy
Anand Rathi Research 10
Quick Glance – Financials and Valuations Fig 1 – Income statement (`m)
Year end 31 Mar FY09 FY10 FY11e FY12e FY13e
Net sales 17,284 15,021 22,991 26,262 22,560 Sales growth (%) (27.4) (13.1) 53.1 14.2 (14.1)- Op. expenses 8,358 6,186 11,660 10,449 7,510 EBITDA 7,797 7,893 9,722 14,238 13,696 EBITDA margins (%) 45.1 52.5 42.3 54.2 60.7 - Interest 582 462 724 1,166 1,170 - Depreciation 25 724 76 109 273 + Other income 540 345 414 497 500 - Tax 943 1,330 2,147 3,365 3,188 PAT 6,772 5,722 7,188 10,094 9,565 PAT growth (%) (52.0) (15.5) 25.6 40.4 (5.2)Consolidated PAT 7,866 5,666 7,188 10,094 9,565 FDEPS (`/share) 15.4 13.0 16.3 22.9 21.7 CEPS (`/share) 17.9 14.5 16.5 23.1 22.3 DPS (`/share) - - - - -Source: Company, Anand Rathi Research
Fig 2 – Balance sheet (`m) Year end 31 Mar FY09 FY10 FY11e FY12e FY13e
Share capital 2,755 3,588 4,150 4,410 4,410 Reserves & surplus 41,463 66,840 89,731 104,928 114,493 Shareholders’ fund 44,218 70,429 93,881 109,338 118,903 Debt 41,433 41,017 36,217 35,562 36,423 Def Tax Liab (net) 30 63 63 63 63 Minority interests 0 0 0 0 0 Capital employed 85,682 111,509 130,161 144,963 155,389 Fixed assets 1,228 4,638 5,050 6,323 14,050 Investments 2,491 2,429 2,429 2,429 2,429 Working capital 81,202 96,513 112,684 121,856 127,779 Cash 755 7,918 9,998 14,355 11,131 Capital deployed 85,682 111,509 130,161 144,963 155,389 No. of shares (m) 275.5 358.8 415.0 441.0 441.0 Net Debt/Equity (%) 92.0 47.0 27.9 19.4 21.3 Source: Company, Anand Rathi Research
Fig 3 – Cash flow statement (`m) Year end 31 Mar FY09 FY10 FY11e FY12e FY13e
Consolidated PAT 7,866 5,666 7,188 10,094 9,565 + Non Cash Items 635 690 88 109 273 Cash profit 8,501 6,355 7,276 10,203 9,838 - Incr/(Decr) in WC 19,775 15,311 16,171 9,172 5,923 Operating cash flow (11,274) (8,956) (8,895) 1,032 3,915 - Capex 566 4,134 489 1,382 8,000 Free cash flow (11,840) (13,090) (9,384) (350) (4,085)- Dividend - - - - -+ Equity raised (63) 20,545 16,264 5,363 (0)+ Debt raised 10,306 (416) (4,800) (655) 861 - Investments 576 (62) - - -- Misc. items (24) 0 0 - -Net cash flow (2,750) 7,163 2,081 4,357 (3,224)+ Opening cash 3,505 755 7,918 9,998 14,355 Closing cash 755 7,918 9,998 14,355 11,131 Source: Company, Anand Rathi Research
Fig 4 – PE Band
HDIL
8x
16x
24x
32x
40x
0
200
400
600
800
1,000
1,200
1,400
Jul-0
7
Oct
-07
Jan-
08
Apr-0
8
Jul-0
8
Oct
-08
Jan-
09
Apr-0
9
Jul-0
9
Oct
-09
Jan-
10
Apr-1
0
Jul-1
0
Oct
-10
Jan-
11
Source: Bloomberg, Anand Rathi Research
Fig 5 – Price-to-Book Band
HDIL
0.5x
1.0x
1.5x
2.0x
2.5x
0
200
400
600
800
1,000
1,200
Jul-0
7
Oct
-07
Jan-
08
Apr-0
8
Jul-0
8
Oct
-08
Jan-
09
Apr-0
9
Jul-0
9
Oct
-09
Jan-
10
Apr-1
0
Jul-1
0
Oct
-10
Jan-
11Source: Bloomberg, Anand Rathi Research
Fig 6 – HDIL vs BSE Realty
HDIL
BSE Realty
150
200
250
300
350
400
Jan-
10
Feb-
10
Mar
-10
Apr-1
0
May
-10
Jun-
10
Jul-1
0
Aug-
10
Sep-
10
Oct
-10
Nov
-10
Dec
-10
Jan-
11
Source: Bloomberg

28 January 2011 HDIL – Looking beyond MIAL; maintain Buy
Anand Rathi Research 11
MIAL: Shifting worries Shifting of families in phase 1 is likely to lag due to issues at the government level (undecided cut-off dates of tenants etc) and resistance to shifting of families by some sections. This raises risk on the 65acre airport land and development of phases 2&3. Hence, we remove the aforementioned projects from our valuation.
MIAL project
Phase 1: Shifting of families
Shifting of families in phase 1 of the MIAL project has been delayed by over a year. Initially to be completed before Feb ’10, shifting of families has been since delayed to Apr ’11 for want of water connections by local government agencies, legitimacy of families staying on MIAL land and conflict among government agencies regarding this, and resistance of certain societies to shift.
We understand that shifting of the families is the responsibility of the MMRDA (a Government body). On the part of HDIL, it has handed over more than 9,000 units at its Kurla site (phase 1) to shift the tenants. Units under construction for phase 1 and part of phase 2 are 33,000. The delay is mainly owing to undecided cut-off dates of tenants and resistance to shifting by some sections.
TDR generation; right on 65 acres of land
TDR generation of up to 98% depends on construction milestones; 2% depends on defect liability, up to six months after shifting of families to rehab buildings. Hence, generation of TDR is largely independent of the shifting of families.
Although the official ‘government rule’ has yet to come, we believe that the state government clearance in Dec ’10 to amend FSI in suburban Mumbai from 1 to 1.33 would have little impact on TDR pricing. The cost of additional FSI (0.33x) would depend on how the government charges it with respect to the ongoing ready reckoner rates in each micro-market. We re-iterate that TDR prices depend on construction activity in Mumbai.
Fig 7 – TDR generation and sales FY09 FY10 FY11e FY12e FY13e FY14e
Generated 5.6 4.8 4.3 3.3 7.3 2.9
Sold 2.0 6.8 4.7 2.5 4.9 5.1
Avg SP 1,100.0 2,150.0 2,700.0 2,400.0 2,200.0 2,500.0
Source: Anand Rathi Research
In FY12, TDR sales would also depend on the amount of construction required for MIAL phase 2 and land conveyed to the SRA for subsequent locations. On the company selling the Andheri (E) land parcel recently, we await more clarity on phase 2 projects. We estimate that HDIL, post-construction-commencement at Mahul, may also start rehab construction in the eastern suburbs, provided it gets some clarity regarding shifting of families in MIAL project.
The 65 acres to be allotted to HDIL, on which it plans to develop 10m sqft of commercial space, depends on families shifting from encroached airport land. Given the delay/uncertainty in shifting, we exclude the 10m sqft development potential from our NAV.
Shifting of families is the responsibility of the MMRDA
TDR prices, we believe, depend on construction activity
We exclude value assigned to 65 acres of leasehold land since land
has yet to be transferred to HDIL
28 January 2011 HDIL – Looking beyond MIAL; maintain Buy
Anand Rathi Research 12
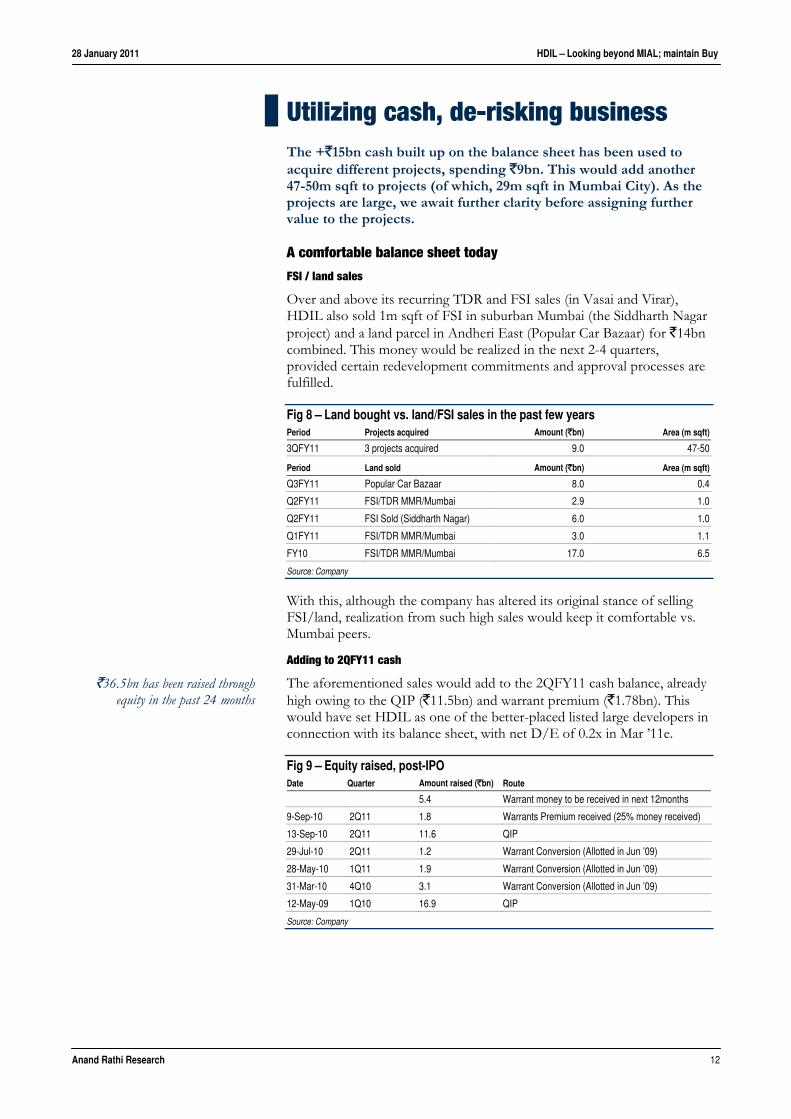
Utilizing cash, de-risking business The +`15bn cash built up on the balance sheet has been used to acquire different projects, spending `9bn. This would add another 47-50m sqft to projects (of which, 29m sqft in Mumbai City). As the projects are large, we await further clarity before assigning further value to the projects.
A comfortable balance sheet today
FSI / land sales
Over and above its recurring TDR and FSI sales (in Vasai and Virar), HDIL also sold 1m sqft of FSI in suburban Mumbai (the Siddharth Nagar project) and a land parcel in Andheri East (Popular Car Bazaar) for `14bn combined. This money would be realized in the next 2-4 quarters, provided certain redevelopment commitments and approval processes are fulfilled.
Fig 8 – Land bought vs. land/FSI sales in the past few years Period Projects acquired Amount (`bn) Area (m sqft)
3QFY11 3 projects acquired 9.0 47-50
Period Land sold Amount (`bn) Area (m sqft)
Q3FY11 Popular Car Bazaar 8.0 0.4
Q2FY11 FSI/TDR MMR/Mumbai 2.9 1.0
Q2FY11 FSI Sold (Siddharth Nagar) 6.0 1.0
Q1FY11 FSI/TDR MMR/Mumbai 3.0 1.1
FY10 FSI/TDR MMR/Mumbai 17.0 6.5
Source: Company
With this, although the company has altered its original stance of selling FSI/land, realization from such high sales would keep it comfortable vs. Mumbai peers.
Adding to 2QFY11 cash
The aforementioned sales would add to the 2QFY11 cash balance, already high owing to the QIP (`11.5bn) and warrant premium (`1.78bn). This would have set HDIL as one of the better-placed listed large developers in connection with its balance sheet, with net D/E of 0.2x in Mar ’11e.
Fig 9 – Equity raised, post-IPO Date Quarter Amount raised (`bn) Route
5.4 Warrant money to be received in next 12months
9-Sep-10 2Q11 1.8 Warrants Premium received (25% money received)
13-Sep-10 2Q11 11.6 QIP
29-Jul-10 2Q11 1.2 Warrant Conversion (Allotted in Jun ’09)
28-May-10 1Q11 1.9 Warrant Conversion (Allotted in Jun ’09)
31-Mar-10 4Q10 3.1 Warrant Conversion (Allotted in Jun ’09)
12-May-09 1Q10 16.9 QIP
Source: Company
`36.5bn has been raised through equity in the past 24 months

28 January 2011 HDIL – Looking beyond MIAL; maintain Buy
Anand Rathi Research 13
Focusing on suburban residential projects
From Mar ’09 to Dec ’10e, HDIL launched and sold stock in Mumbai suburbs worth `57bn. Its focus has been on suburban locations (as against the major focus of listed peers, of South-Central Mumbai) at a discount to its competitors. Its recent launch of entry-level housing in Palghar (the Mumbai Metropolitan Region) saw sales of ~`7bn (over 6,000 units).
Fig 10 – Launched residential projects Project Location Area (sq ft) Remark
Premier Residency Kurla (W) 100,000 Const on; majority sold out Galaxy Kurla (E) 475,000 Const on; majority sold out Metropolis Andheri (W) 650,000 Const on; majority sold out Majestic Bhandup 1,300,000 Const on; 40% sold Residency Park Virar (W) 1,250,000 Const on; majority sold out Harmony Goregaon (W) 43,568 Const on; majority sold out Meadows Goregaon (W) 1,000,000 Const on; 70% sold Whispering Towers Mulund (W) 800,000 Const on; 40% sold Paradise City 1 Palghar 290000* Const to start; 95% sold Paradise City 2 Palghar 290000* Const to start; 20% sold
Source: Company *Estimated
According to its 2QFY11 presentation, HDIL plans to launch 27m sqft of residential projects in the next 2-3 quarters. Residential projects, usually requiring negative working capital, would add to its cash book.
Fig 11 – Planned project launches Project Location Area (sq ft) Remark
Ekta Nagar Kandivili 1,500,000 Approvals Stage
Palghar P3/4 Palghar 5000000* Approvals Stage
Whispering Towers P2 Mulund 800,000 Post substantial Phase 1 sales
Meadows P2 Goregaon (W) 3,600,000 Post substantial Phase 1 sales
Daulat Santacruz 800,000 Rehab on; legal issues
Premier Residency 2 Kurla 800,000
Ghatkopar Ghatkopar (E) 509,457
Kochi Kochi 6,299,640
Source: Company
New mega projects acquired
HDIL has recently acquired three projects (one slum rehab, one redevelopment and one virgin land). Investment in the acquisition is `9bn as of date.
Fig 12 – New projects acquired: ~`9bn paid Project Location Free-sale Redevelopment Remark
Malvani SRS Malad (W) 25-28m sqft 25,000 families 3K' approval; 25% land premium paid; 67% stake acquired
SVP Nagar Andheri (W) 4m sqft 98 buildings Prime western suburb property
Biosar Biosar 18-20m sqft - Affordable, Entry level housing to be launched
Source: Company
In the Malvani project at Malad, HDIL acquired a 67% stake in Lashkariya Construction. The project is to be developed over 70-80 acres, rehabilitating ~25,000 families. We understand the project has already received “3K” approval from the state government and HDIL has paid a 25% premium to the SRA. It has estimated sellable area of 25-28m sqft.

28 January 2011 HDIL – Looking beyond MIAL; maintain Buy
Anand Rathi Research 14
HDIL has also acquired redevelopment rights to SVP Nagar in Andheri (W) for 98 buildings and ~3,200 and 3,500 families. Management expects this to generate ~4m sqft of saleable area.
The third land parcel acquired is ~400 acres at Boisar, a distant suburb in the MMR on the western side. We believe HDIL would launch an affordable/entry-level housing project here on the lines of the Palghar project launched in 3QFY11. We estimate this project to have a potential sellable area of 18-20m sqft. Management intends to launch it in the next six months.
With these three acquisitions, the company has maintained its focus on slum rehabilitation and the Mumbai suburban mass market.
Although the aforementioned projects add between 47m and 50m sqft of sellable area, we await further clarity on launch plans and status of the SRS and redevelopment projects. Both are huge and could take 7-9 years.

28 January 2011 HDIL – Looking beyond MIAL; maintain Buy
Anand Rathi Research 15
Change in estimates Our NAV is impacted by removal of 65 acres of free-sale land in MIAL, part of phase 2, and phase 3 from valuation due to lack of land visibility and adding a discount to some under-construction slum-rehab projects in Mumbai. For now, the new acquisitions are taken at cost
Valuation
We have removed the 10m sqft development (from the 65 acres of MIAL land) from our development schedule, owing to delays or uncertainties in shifting pf families. The impact on our NAV would be 18%
We remove MIAL phase 3 development schedule value on account of ongoing land acquisition (land payment) and clarity regarding phase 2 rehab construction. The impact on our NAV would be 13%
Fig 13 – Valuation: Mar’12e NAV Mar’12 (`m) (`/share)
Slum Rehab 39,860 90
MIAL Project 32,716 74
Rental Housing 10,664 24
MMR (incl Mumbai) 18,819 43
Other Cities 7,435 17
Residual Land 14,272 32
Hotels 821 2
Net Debt (21,207) (48)
3 new projects still considered at cost 9,000 21
Total 120,881 255
Source: Anand Rathi Research
Fig 14 – Optional value as of Mar '12 NAV Mar’12 (`m) (`/share)
MIAL - part pf P2 9,785.0 22.2
MIAL P3 23,914.0 54.2
65 acre of MIAL 33,163.3 75.2
Source: Anand Rathi Research
We have assumed development schedules for slum rehab schemes/ redevelopment schemes. To take into account uncertainties in certain projects, e.g., Bandra (E) SRS 1, we introduce a discount of 15%.
For valuation, we have considered only visible projects in SRS
Fig 15 – Slum projects with development uncertainty Project Location Area (sqft) Value Discount Remark
Bandra (E) SRS 1 Bharat Nagar 1,882,756.0 13,200.0 Environment clearance done, shifting issues
Bandra (E) SRS 2 159,074.0 1,186.0 Environment clearance done, shifting issues
Malad (E) Malad (E) 117,205.0 479.0 NA
BKC Dev Off WE highway 350,000.0 1,780.0 LoI received
Kammanwar Nagar Vikroli 350,000.0 490.0 Redevelopment ongoing
Daulat Nagar Santacruz 800,000.0 4,106.0
15%
Transit const on
Source: Company Anand Rathi Research

28 January 2011 HDIL – Looking beyond MIAL; maintain Buy
Anand Rathi Research 16
For planned (announced) launches in 2QFY11, we assume a development schedule other than JDAs, and JDAs where deposit has been paid.
For its land bank in Vasai, Virar, and other cities, we assign a certain premium to book value of acquisition (as taken before).
For our valuation, we have taken cost of equity as 19%, cost of debt as 13% and WACC of 15%.
Risks
Although we have taken into account delays in our MIAL assumptions, a change in government policy could affect the project and, hence, value.
A slowdown in construction in Mumbai could affect the TDR market (9% contribution)
Slowdown in sales

28 January 2011 HDIL – Looking beyond MIAL; maintain Buy
Anand Rathi Research 17
Financials HDIL follows the project-completion method of accounting. It is shifting to the percentage-completion method 1QFY12 onwards. We await further clarity on the threshold limit, and on percent of work on projects completed, in order to effect changes in our reporting format.
FY11 – Revenue recognized. In addition to TDR and FSI sales, we have estimated that HDIL would recognize revenue from the sale of FSI (of 1m sqft) in Siddharth Nagar, Goregaon (W) and from the sale of the Andheri (E) land parcel in FY11.
Inventory. Given the company’s accounting policy, all costs on projects not delivered would show in inventories. Besides, we believe HDIL has paid for other projects/land to be acquired and in acquisition/sanitization phases; e.g., BKC Developers, Novinon Land parcels’ acquisition, redevelopment project in Vikhroli etc., still to be announced for sale. Investment in this is likely to be over `15bn. Although such projects are likely to add more value, further clarity is required.
Fig 16 – Inventories vs. customer advances
0
20,000
40,000
60,000
80,000
100,000
120,000
140,000
FY09
FY10
FY11
e
FY12
e
FY13
e
0
5,000
10,000
15,000
20,000
25,000
30,000
Inventory Cust Advances Cash (RHS)
(`m) (`m)
Source: Company, Anand Rathi Research
HDIL is changing to the percentage-completion method of
accounting from 1QFY12
Cash increase is assuming no further land acquisition than
announced

28 January 2011 HDIL – Looking beyond MIAL; maintain Buy
Anand Rathi Research 18
Fig 17– Income statement (`m) Year end 31 Mar FY09 FY10 FY11e FY12e FY13e
Revenue 17,284 15,021 22,991 26,262 22,560
- Op. expenses 8,358 6,186 11,660 10,449 7,510
- Employee Costs 221 285 345 525 451
- Other Administrative 908 658 1,264 1,050 902
EBIDTA 7,797 7,893 9,722 14,238 13,696
- Interest 582 462 724 1,166 1,170
- Depreciation 25 724 76 109 273
+ Other income 540 345 414 497 500
- Tax 943 1,330 2,147 3,365 3,188
PAT 6,787 5,722 7,188 10,094 9,565
+ Minority Interests 0 0 - - -
+ Share of profit from Associates - - - - -
Consolidated PAT 7,866 5,666 7,188 10,094 9,565
Dividend - - - - -
FDEPS (` / share) 15.4 13.0 16.3 22.9 21.7
CEPS (` / share) 17.9 14.5 16.5 23.1 22.3
DPS (` / share) - - - - -
BV (` / share) 100.3 159.7 212.9 247.9 269.6
Shares outstanding 275.5 358.8 415.0 441.0 441.0
Growth Rates
Revenue (%) (27.4) (13.1) 53.1 14.2 (14.1)
EBIDTA (%) (49.9) 1.2 23.2 46.5 (3.8)
Net PAT (%) (51.9) (15.5) 25.6 40.4 (5.2)
Diluted EPS (%) (52.0) (15.5) 25.6 40.4 (5.2)
FY10-13e Revenue CAGR (%) 14.5
FY10-13e EBITDA CAGR (%) 20.2
FY10-13e EPS CAGR (%) 19.1
Margins
EBIDTA (%) 45.1 52.5 42.3 54.2 60.7
EBIT (%) 45.0 47.7 42.0 53.8 59.5
Net Profit (%) 45.5 37.7 31.3 38.4 42.4
Source: Company, Anand Rathi Research

28 January 2011 HDIL – Looking beyond MIAL; maintain Buy
Anand Rathi Research 19
Fig 18– Balance sheet (`m) Year end 31 Mar FY09 FY10 FY11e FY12e FY13e
Sources of Funds
Share capital 2,755 3,588 4,150 4,410 4,410
Reserves & surplus 41,463 66,840 89,731 104,928 114,493
Shareholders’ fund 44,218 70,429 93,881 109,338 118,903
Debt 41,433 41,017 36,217 35,562 36,423
Deferred Tax Liab (net) 30 63 63 63 63
Minority interests 0 0 0 0 0
Capital employed 85,682 111,509 130,161 144,963 155,389
Application of Funds
Gross Fixed Assets 654 1,937 2,426 3,808 11,807
Less: Depreciation 56 107 183 292 565
Net Fixed Assets 598 1,830 2,243 3,516 11,242
Capital Work in Progress 152 217 217 217 217
Investments 2,491 2,429 2,429 2,429 2,429
Goodwill 478 2,591 2,591 2,591 2,591
Current Assets
Inventories 69,128 87,567 97,823 108,908 122,791
Debtors 1,669 2,030 6,897 7,879 3,384
Loans and Advances 17,077 15,649 30,711 34,039 37,803
Current Liab and Provisions 6,693 8,761 22,775 28,998 36,227
Net Current Assets 81,957 104,431 122,682 136,211 138,910
Working Capital 81,202 96,513 112,684 121,856 127,779
Cash 755 7,918 9,998 14,355 11,131
Capital deployed 85,682 111,509 130,161 144,963 155,389
No. of shares (m) 275.5 358.8 415.0 441.0 441.0
Net Debt/Equity (%) 92.0 47.0 27.9 19.4 21.3
Source: Company, Anand Rathi Research
Fig 19– Cash flow statement (`m) Year end 31 Mar FY09 FY10 FY11e FY12e FY13e
Consolidated PAT 7,866 5,666 7,188 10,094 9,565
+ Depreciation 41 724 76 109 273
+ Deferred Tax 9 27 12 - -
+ Other non cash 585 (62) - - -
Cash profit 8,501 6,355 7,276 10,203 9,838
- Incr/(Decr) in WC 19,775 15,311 16,171 9,172 5,923
Operating cash flow (11,274) (8,956) (8,895) 1,032 3,915
- Capex 566 4,134 489 1,382 8,000
Free cash flow (11,840) (13,090) (9,384) (350) (4,085)
- Dividend - - - - -
+ Equity raised (63) 20,545 16,264 5,363 (0)
+ Debt raised 10,306 (416) (4,800) (655) 861
- Investments 576 (62) - - -
- Misc. items (24) 0 0 - -
Net cash flow (2,750) 7,163 2,081 4,357 (3,224)
+ Opening cash 3,505 755 7,918 9,998 14,355
Closing cash 755 7,918 9,998 14,355 11,131
Source: Company, Anand Rathi Research

28 January 2011 HDIL – Looking beyond MIAL; maintain Buy
Anand Rathi Research 20
Fig 20 - Ratio analysis @`156 Year end 31 Mar FY09 FY10 FY11e FY12e FY13e
Valuations
P / E 10.5 12.4 9.9 7.0 7.4
P / BV 1.6 1.0 0.8 0.6 0.6
M Cap / Sales 2.6 3.8 2.9 2.7 3.1
EV / Sales 4.8 5.9 3.9 3.4 4.2
EV / EBIDTA 10.6 11.2 9.3 6.3 6.9
Dividend
Dividend yield (%) - - - - -
Dividend payout (%) - - - - -
Leverage
Net Debt / Equity 92 47 28 19 21
Int Coverage 13 16 13 12 11
Return Ratios
ROE (%) 16.8 10.0 8.7 9.9 8.4
ROCE (%) 10.1 7.3 8.0 10.3 8.9
Source: Company, Anand Rathi Research
Anand Rathi Financial Services Limited does and seeks to do business with companies covered in its research reports. Thus, investors should be aware that the firm may have a conflict of interest that could affect the objectivity of this report. Investors should consider this report as only a single factor in making their investment decision. Disclosures and analyst certifications are located in Appendix 1 Anand Rathi Research India Equities
India I Equities
Key financials
Year end 31 Mar FY09 FY10 FY11e FY12e FY13e
Sales (`m) 4,644 9,512 14,630 30,746 43,141
Net profit (`m) 1,417 2,520 3,912 7,516 13,097
EPS (`) 5.8 10.4 16.1 30.9 53.8
Growth (%) NA 77.9 55.2 92.1 74.3
PE (x) NA 15.2 9.8 5.1 2.9
PBV (x) NA 1.3 1.1 0.9 0.7
RoE (%) 18.7 14.1 13.2 20.7 32.9
RoCE (%) 12.9 15.1 16.7 26.9 42.6
Dividend yield (%) - - 0.3 0.6 0.6
Net gearing (%) 142.8 16.7 40.1 28.3 21.5
Source: Company, Anand Rathi Research Prices as of 27 Jan ’11
Property
Update
28 January 2011
DB Realty
A non-real-estate quarter; maintain Buy
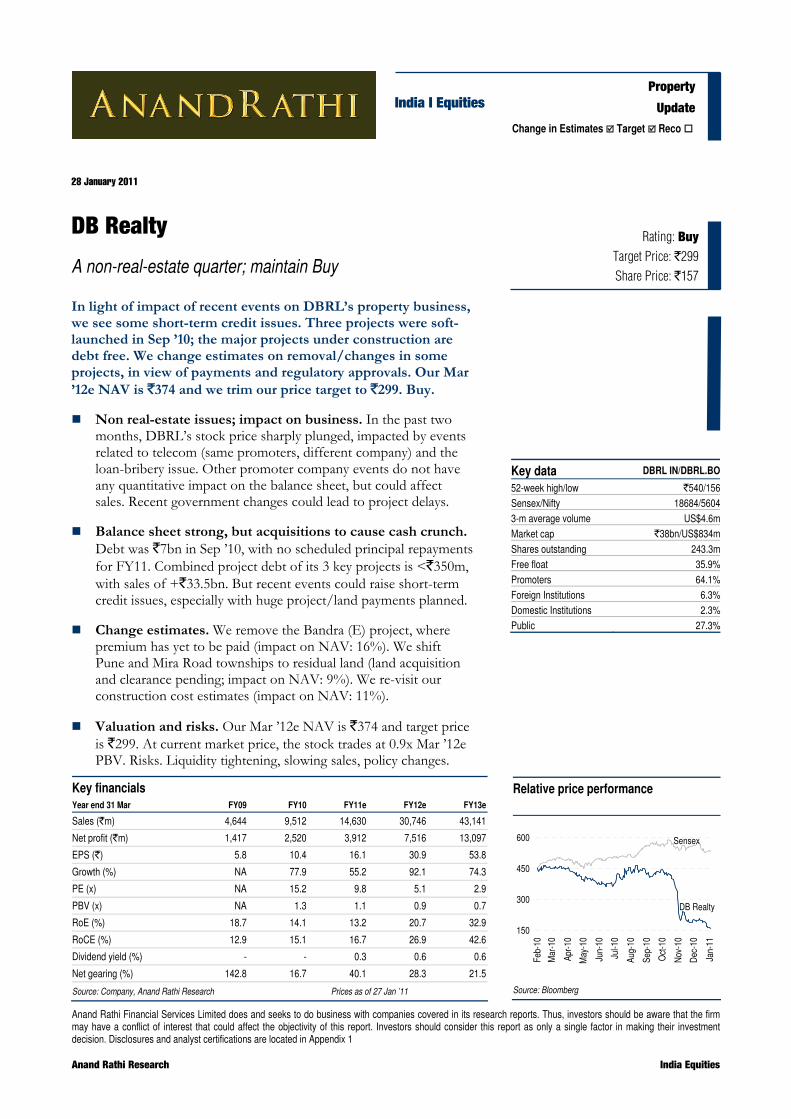
In light of impact of recent events on DBRL’s property business, we see some short-term credit issues. Three projects were soft-launched in Sep ’10; the major projects under construction are debt free. We change estimates on removal/changes in some projects, in view of payments and regulatory approvals. Our Mar ’12e NAV is `374 and we trim our price target to `299. Buy.
Non real-estate issues; impact on business. In the past two months, DBRL’s stock price sharply plunged, impacted by events related to telecom (same promoters, different company) and the loan-bribery issue. Other promoter company events do not have any quantitative impact on the balance sheet, but could affect sales. Recent government changes could lead to project delays.
Balance sheet strong, but acquisitions to cause cash crunch. Debt was `7bn in Sep ’10, with no scheduled principal repayments for FY11. Combined project debt of its 3 key projects is <`350m, with sales of +`33.5bn. But recent events could raise short-term credit issues, especially with huge project/land payments planned.
Change estimates. We remove the Bandra (E) project, where premium has yet to be paid (impact on NAV: 16%). We shift Pune and Mira Road townships to residual land (land acquisition and clearance pending; impact on NAV: 9%). We re-visit our construction cost estimates (impact on NAV: 11%).
Valuation and risks. Our Mar ’12e NAV is `374 and target price is `299. At current market price, the stock trades at 0.9x Mar ’12e PBV. Risks. Liquidity tightening, slowing sales, policy changes.
Rating: Buy Target Price: `299 Share Price: `157
Key data DBRL IN/DBRL.BO
52-week high/low `540/156Sensex/Nifty 18684/56043-m average volume US$4.6mMarket cap `38bn/US$834m
Shares outstanding 243.3mFree float 35.9%Promoters 64.1%Foreign Institutions 6.3%Domestic Institutions 2.3%Public 27.3%
Relative price performance
DB Realty
Sensex
150
300
450
600
Feb-
10
Mar
-10
Apr-1
0
May
-10
Jun-
10
Jul-1
0
Aug-
10
Sep-
10
Oct
-10
Nov
-10
Dec
-10
Jan-
11
Source: Bloomberg
Change in Estimates Target Reco

28 January 2011 D B Realty – A non-real-estate quarter; maintain Buy
Anand Rathi Research 22
Quick Glance – Financials and Valuations Fig 1 – Income statement (`m)
Year end 31 Mar FY09 FY10 FY11e FY12e FY13e
Net sales 4,644 9,512 14,630 30,746 43,141 Sales growth (%) NA 104.8 53.8 110.1 40.3 - Op. expenses 2,064 5,470 7,521 17,008 17,205 EBITDA 2,258 3,655 6,583 12,847 24,729 EBITDA margins (%) 48.6 38.4 45.0 41.8 57.3 - Interest 747 726 571 861 764 - Depreciation 74 96 88 94 120 + Other income 68 291 - - - - Tax 67 413 1,659 4,043 8,107 PAT 1,438 2,712 4,265 7,849 15,738 PAT growth (%) NA 88.5 57.3 84.0 100.5 Consolidated PAT 1,417 2,520 3,912 7,516 13,097 FDEPS (`/share) 5.8 10.4 16.1 30.9 53.8 CEPS (`/share) 6.1 10.7 16.4 31.3 54.3 DPS (`/share) - - 0.5 1.0 1.0 Source: Company, Anand Rathi Research
Fig 2 – Balance sheet (`m) Year end 31 Mar FY09 FY10 FY11e FY12e FY13e
Share capital 91 2,433 2,433 2,433 2,433 Reserves & surplus 8,023 28,054 31,823 39,055 51,868 Shareholders’ fund 8,114 30,486 34,256 41,488 54,301 Debt 12,357 5,948 13,748 11,748 11,655 Def Tax Liab (net) 4 (2) (2) (2) (2)Minority interests 553 745 745 745 745Capital employed 21,028 37,177 48,747 53,979 66,698 Fixed assets 223 219 180 234 219 Investments 2 8,941 5,191 5,191 5,191 Working capital 20,028 27,157 36,376 37,770 42,771 Cash 769 860 7,000 10,784 18,518 Capital deployed 21,028 37,177 48,747 53,979 66,698No. of shares (m) 9 243 243 243 243 Net Debt/Equity (%) 142.8 16.7 40.1 28.3 21.5 Source: Company, Anand Rathi Research
Fig 3 – Cash flow statement (`m) Year end 31 Mar FY09 FY10 FY11e FY12e FY13e
Consolidated PAT 1,417 2,520 3,912 7,516 13,097 +Non Cash Items 77 90 88 94 120 Cash profit 1,494 2,609 4,000 7,611 13,217 - Incr/(Decr) in WC 9,131 7,130 9,219 1,394 5,001 Operating cash flow (7,637) (4,520) (5,219) 6,217 8,216 -Capex 150 91 49 149 104 Free cash flow (7,787) (4,611) (5,268) 6,068 8,112 -Dividend - - 142 285 285 + Equity raised (585) 19,853 (0) - - + Debt raised 6,327 (6,409) 7,800 (2,000) (93) -Investments (1,783) 8,938 (3,750) - - -Misc. items 5 (5) (0) - - Net cash flow (268) 92 6,140 3,784 7,734 +Opening cash 1,037 769 860 7,000 10,784 Closing cash 769 860 7,000 10,784 18,518 Source: Company, Anand Rathi Research
Fig 4 – PE Band
5x
10x
15x
20x
25x
0
100
200
300
400
500
600
700
800
Mar
-10
Apr-1
0
May
-10
Jun-
10
Jul-1
0
Aug-
10
Sep-
10
Oct
-10
Nov
-10
Dec
-10
Jan-
11
Source: Bloomberg, Anand Rathi Research
Fig 5 – Price-to-Book Band
DBRL
1x
2x
3x
4x
5x
0
100
200
300
400
500
600
700
800
900
Mar
-10
Apr-1
0
May
-10
Jun-
10
Jul-1
0
Aug-
10
Sep-
10
Oct
-10
Nov
-10
Dec
-10
Jan-
11
Source: Bloomberg, Anand Rathi Research
Fig 6 – DB Realty vs BSE Realty
DB Realty
BSE Realty
100
200
300
400
500
600
Feb-
10
Mar
-10
Apr-1
0
May
-10
Jun-
10
Jul-1
0
Aug-
10
Sep-
10
Oct
-10
Nov
-10
Dec
-10
Jan-
11
Source: Bloomberg, Anand Rathi Research

28 January 2011 D B Realty – A non-real-estate quarter; maintain Buy
Anand Rathi Research 23
Non-real-estate issues; evaluating business impact In the past two months, DBRL’s stock price has reacted sharply to events related to telecommunications (same promoters, different company) and the loan-bribery issue. Other promoter company events, we believe, do not have any quantitative impact on the company’s balance sheet, but could affect sales. Recent government changes in the state could result in project delays (as with other developers in Mumbai).
Key events
Probe in 2G spectrum allotment – DB Realty link
DBRL promoters run/own three businesses through separate entities – real-estate under DB Realty, hospitality under D B Hospitality, and telecoms, a JV with Etisalat under Etisalat DB Telecoms (Pvt). DB Realty has provided corporate guarantees for loans taken by its group companies, of `14.7bn. These guarantees have been provided since the last two years, also pointed out as risks in our report “Mumbai Property: The old order changeth, yielding place to new” dated 4 Oct ’10. Over and above this, the company has a minority stake in a hospitality project in DIAL.
Fig 7 – Etilisat DB: Extract from FY10 balance sheet (`m) Liabilities FY09 FY10
Shareholders Funds 2,527 2,527
Reserves & Surplus 40,792 40,780
Net Worth 43,318 43,307
Gross Debt 3 575
D/E 0.00 0.01
Net D/E (0.58) (0.37)
Assets
Fixed Assets 17,933 43,033
Investments 1,095 -
Cash & Equivalents 25,340 16,458
Net CA 43,321 43,882
Source: Registrar of Companies (RoC)
In addition to the guarantee provided by the company, both managing directors have provided personal guarantees of `16.57bn and US$138m each in the telecoms and hospitality businesses respectively. The net worth of the telecoms company is `40bn and cash on its books is ~`15bn.The hospitality company has a net worth of `5.5bn, with debt of ~`1.5bn.
DBRL’s link with other promoter companies is only the corporate
guarantees provided by it
The promoters in their personal capacity have provided guarantees of
`16.75bn and US$138m each
Fixed assets include license fees of `15.7bn, while liability to creditors
is `19.8bn

28 January 2011 D B Realty – A non-real-estate quarter; maintain Buy
Anand Rathi Research 24
Fig 8 – DB Hospitality: Extract from FY10 balance sheet (`m) Liabilities FY09 FY10
Shareholders Funds 494 494
Reserves & Surplus 5,044 5,018
Net Worth 5,538 5,512
Gross Debt 1,321 3,904
D/E 0.24 0.71
Net D/E 0.23 0.69
Assets
Fixed Assets 2,456 4,608
Investments 1,469 1,623
Cash & Equivalents 28 112
Net CA 2,908 3,185
Source: RoC
Although the corporate guarantees provided by DBRL are huge, given its balance sheet, we believe there would be no material impact on the performance of the company nor a strain on its balance sheet.
Loan bribery case
DBRL’s name also came up in the recent loan bribery event, for `1.88bn drawn from LIC Housing Finance through a market intermediary. The company has clarified its position regarding the issue.
We believe this to be a non-event for DBRL. But, given the present environment, we believe credit would turn expensive and sanctions and disbursals would be difficult in the near term. Although the balance sheet is net cash (2QFY11) and DBRL has a sales order book of over `40bn, its huge project/land acquisition spending would slow down, given the low availability of credit and requirement of cash in hand for working capital.

28 January 2011 D B Realty – A non-real-estate quarter; maintain Buy
Anand Rathi Research 25
Balance Sheet Debt stood at `7bn as of Sep ’10, with no scheduled principal repayments in FY11 and `1.96bn in FY12. The balance sheet in Nov ’10 was largely net cash, and three key projects – Orchid Crown, Orchid Heights and Orchid Turf View – have combined project debt of less than `350m, with sales of over `35.2bn. Recent events could lead to near-term credit issues, given the huge project/land payments planned.
Balance sheet not strained, but credit flow important
With the `15bn raised though its IPO in 4QFY10, the company was net cash in Sep ’10. Although it had no scheduled debt repayments in FY11 (after repaying `800m to IDFC as stated as the object of the IPO), it has, in addition, already repaid ~`3bn of debt as of Nov ’10. Scheduled repayment in FY12 is ~`1.96bn.
Fig 9 – Debt details Project Debt on books (`m) From
Heights 344.7 Public Sector Banks
Woods 1,300.0 Private Sector Bank
Corporate 2,431.5 MNCs, PSBs
Sanctioned to draw 7,090.0
Source: Company *as of Nov '10
Sales order book good
In the past six quarters, till Sep ’10, DBRL launched and sold stock worth ~`64bn. It also soft launched/launched a few projects in 3QFY11. We estimate DBRL to have sold stock worth +`9bn in 3QFY11.
Fig 10 – Sales value vs. value realized Project Value Sold (`m) Amount Received (`m) (%) Received
Mahul Nagar 11,784.0 9,504.0 81%
Orchid Woods 7,500.0 4,790.0 64%
Orchid Suburbia 3,615.0 1,343.0 37%
Orchid Ozone 8,734.0 1,717.0 20%
Orchid Crown 14,821.0 2,957.0 20%
Orchid Hills 1,535.0 1,500.0 98%
Orchid Heights 11,122.0 1,636.0 15%
Orchid Turf View 5,095.0 1,452.0 28%
Source: Company
In 3QFY11, DBRL soft-launched/launched five projects in Pune and Mumbai. Certain projects are subsequent phases of the under-construction projects.
Receivables from sold stock are ~`40bn; the current value of
unsold stock is `86.5bn

28 January 2011 D B Realty – A non-real-estate quarter; maintain Buy
Anand Rathi Research 26
We revise our sales and sales duration estimates for a few projects, as the launched prices are above our estimated average selling prices.
Fig 12 – Changes in project assumptions Project Previous avg SP (`/sqft) New Avg SP (`/ sqft) Remark
Turf View 35,315 37,500 Prolonged project sales; to sell till FY18
Golf View 5,870 9,740 Launched at higher price and less units; project divided into phases
Source: Anand Rathi Research
Fig 11 – 3QFY11: New projects launched Project Location Launch price (`/ sqft)) ARG Estimate of Avg price (`/ sqft) Remark
Orchid Turfview - Wing D Mahalaxmi 40,000 35,315 Tower A&B - const started
Paradise Bandra (E) 17,000 20,950 Project acquired recently
View Mumbai Central 17,900 17,520 Rehab shifting to start
Golf View Pune 9,000 9,740 Excavation started
Centre Pune - - Construction started
Source: Company
28 January 2011 D B Realty – A non-real-estate quarter; maintain Buy
Anand Rathi Research 27
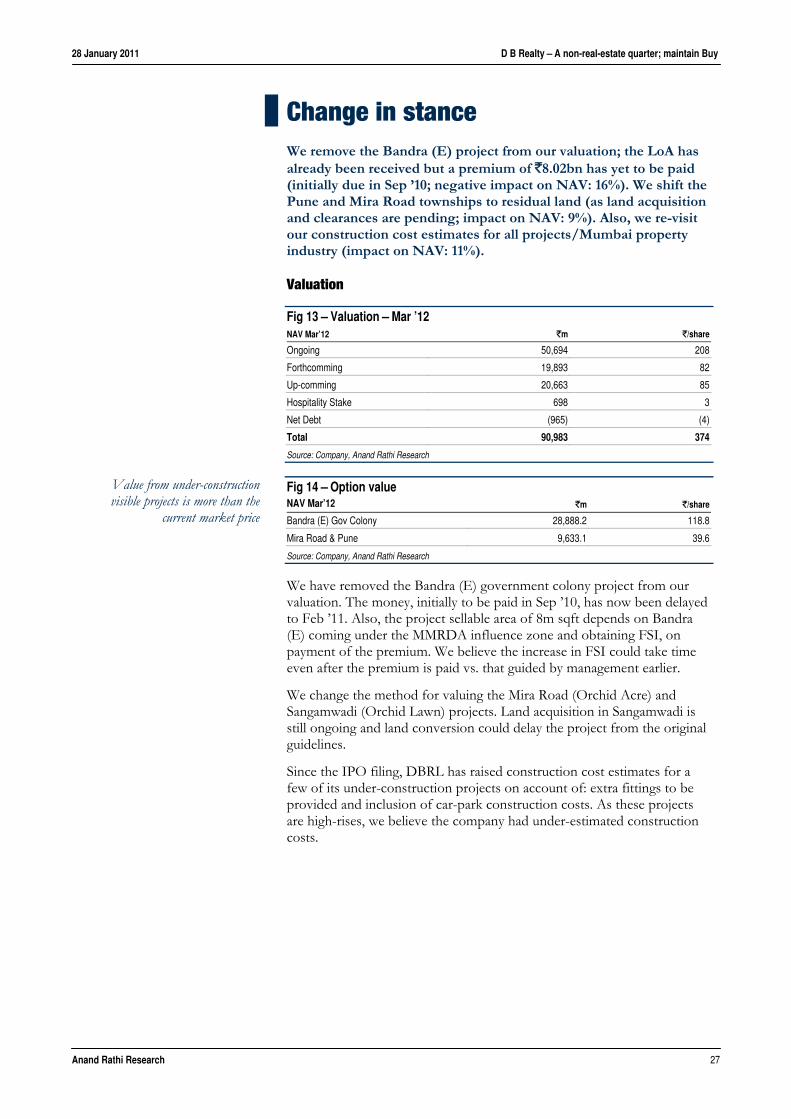
Change in stance We remove the Bandra (E) project from our valuation; the LoA has already been received but a premium of `8.02bn has yet to be paid (initially due in Sep ’10; negative impact on NAV: 16%). We shift the Pune and Mira Road townships to residual land (as land acquisition and clearances are pending; impact on NAV: 9%). Also, we re-visit our construction cost estimates for all projects/Mumbai property industry (impact on NAV: 11%).
Valuation
Fig 13 – Valuation – Mar ’12 NAV Mar’12 `m `/share
Ongoing 50,694 208
Forthcomming 19,893 82
Up-comming 20,663 85
Hospitality Stake 698 3
Net Debt (965) (4)
Total 90,983 374
Source: Company, Anand Rathi Research
Fig 14 – Option value NAV Mar’12 `m `/share
Bandra (E) Gov Colony 28,888.2 118.8
Mira Road & Pune 9,633.1 39.6
Source: Company, Anand Rathi Research
We have removed the Bandra (E) government colony project from our valuation. The money, initially to be paid in Sep ’10, has now been delayed to Feb ’11. Also, the project sellable area of 8m sqft depends on Bandra (E) coming under the MMRDA influence zone and obtaining FSI, on payment of the premium. We believe the increase in FSI could take time even after the premium is paid vs. that guided by management earlier.
We change the method for valuing the Mira Road (Orchid Acre) and Sangamwadi (Orchid Lawn) projects. Land acquisition in Sangamwadi is still ongoing and land conversion could delay the project from the original guidelines.
Since the IPO filing, DBRL has raised construction cost estimates for a few of its under-construction projects on account of: extra fittings to be provided and inclusion of car-park construction costs. As these projects are high-rises, we believe the company had under-estimated construction costs.
Value from under-construction visible projects is more than the
current market price

28 January 2011 D B Realty – A non-real-estate quarter; maintain Buy
Anand Rathi Research 28
Fig 15 - Increase in construction costs (`m) Management guidance on est costs AR estimates
Project RHP Aug'10 Nov'10 (%) Increase Avg Const costs (`/sqft)*
Ozone 6,254.3 7,375.0 6,852.0 9.6 2,589.6
Woods 5,421.0 7,331.0 6,435.0 18.7 5,084.3
Heights 5,064.5 11,215.0 10,031.0 98.1 8,455.9
Suburbia 4,709.5 5,514.0 4,986.0 5.9 5,433.7
Mahul Nagar 8,538.6 8,539.0 8,539.0 0.0 940.9
Turf 6,753.7 12,870.0 10,760.0 59.3 6,410.5
Corporate Park 4,724.8 4,725.0 4,725.0 0.0 3,901.0
Centre 1,348.8 1,349.0 1,349.0 0.0 2,615.2
Crown 5,670.6 12,069.0 10,615.0 87.2 6,433.3
Source: Company, Anand Rathi Research *on total costs, including rehab, car parks construction
In our report “Mumbai Property: The old order changeth, yielding place to new” dated 4 Oct ’10, our construction cost estimates were 7% more than the estimates of the company. With more high-rises using different development schemes, differentiated product offerings and our interaction with different market participants, we have increased our construction costs estimates for under-construction and planned projects. We believe that management could revise its construction cost estimates upwards after construction commences, as it has done recently.
Fig 16 - Difference between DB Realty and ARG estimated construction costs RHP (`m) Nov'10 (`m) Increase in costs (%)
DB Realty Estimates 167,766 183,572 9%
Oct'10 (`m) Jan'11 (`m) Increase in cost (%)
ARG Estimates 179,991 213,943 19%
Difference between estimates 7% 17%
Source: Anand Rathi Research
Nine projects are being developed by securing higher FSI through the public parking schemes. Recently, the government of Maharastra decided to re-think DCR 33(24) relating to public parking schemes, especially for allotment in south-central Mumbai. Although DB Realty has secured primary approvals for all its projects and cancellation is unlikely, in certain projects the area could come down. We introduce a discount to account for this, till further clarity emerges.
Fig 17 - Status of public parking schemes Project Status
Turf View Approved by MCGM
Heights Approved by MCGM
Crown Approved by MCGM
Views With MCGM for Final approval
West View With MCGM for Final approval
Splendour With MCGM for Final approval
Central With MCGM for Final approval
Corporate Park With MCGM for Final approval
Park With MCGM for Final approval
Skyz With MCGM for Final approval
Enclave Approved by MCGM
Source: Company, Anand Rathi Research

28 January 2011 D B Realty – A non-real-estate quarter; maintain Buy
Anand Rathi Research 29
Certain projects depend on securing higher FSI through the PPP format. Till approvals are obtained, we introduce a discount.
Fig 18 - PPP schemes yet to be cleared Project Remark
Centre P2 Police Station clearance to be done; P1 (Golf View) and Centre 1 started
Hill Park Police housing - to be cleared
Mahal Pictures Police Housing - to apply for it
Gov Colony Premium yet to be paid
Orchid Town Rental Housing; approval stage, some premium paid
Source: Company
We raise cost of debt by 100bps, resulting in an increase in WACC to 16%.

28 January 2011 D B Realty – A non-real-estate quarter; maintain Buy
Anand Rathi Research 30
Financials Fig 19 – Income statement (`m) Year end 31 Mar FY09 FY10 FY11e FY12e FY13e
Revenue 4,644 9,512 14,630 30,746 43,141
- Op. expenses 2,064 5,470 7,521 17,008 17,205
- Employee Costs 36 53 88 123 129
- Other Administrative 286 334 439 769 1,079
EBITDA 2,258 3,655 6,583 12,847 24,729
- Interest 747 726 571 861 764
- Depreciation 74 96 88 94 120
+ Other income 68 291 - - -
- Tax 67 413 1,659 4,043 8,107
PAT 1,438 2,712 4,265 7,849 15,738
+ Minority Interests 22 192 353 332 2,641
+ Share of profit from Associates 0 (0) - - -
Consolidated PAT 1,417 2,520 3,912 7,516 13,097
Dividend - - 142 285 285
FDEPS (` / share) 5.8 10.4 16.1 30.9 53.8
CEPS (` / share) 6.1 10.7 16.4 31.3 54.3
DPS (` / share) - - 0.5 1.0 1.0
BV (` / share) 33.4 125.3 140.8 170.6 223.2
Shares outstanding 9.1 243.3 243.3 243.3 243.3
Growth Rates
Revenue (%) NA 104.8 53.8 110.1 40.3
EBITDA (%) (1,869.5) 61.9 80.1 95.2 92.5
Net PAT (%) (752.0) 77.9 55.2 92.1 74.3
Diluted EPS (%) (752.0) 77.9 55.2 92.1 74.3
FY10-13e Revenue CAGR(%) 65.5
FY10-13e EBITDA CAGR (%) 89.1
FY10-13e EPS CAGR (%) 73.2
Margins
EBITDA (%) 48.6 38.4 45.0 41.8 57.3
EBIT (%) 47.0 37.4 44.4 41.5 57.0
Net Profit (%) 30.5 26.5 26.7 24.4 30.4
Source: Company, Anand Rathi Research

28 January 2011 D B Realty – A non-real-estate quarter; maintain Buy
Anand Rathi Research 31
Fig 20 – Balance sheet (`m) Year end 31 Mar FY09 FY10e FY11e FY12e FY13e
Sources of Funds
Share capital 91 2,433 2,433 2,433 2,433
Reserves & surplus 8,023 28,054 31,823 39,055 51,868
Shareholders’ fund 8,114 30,486 34,256 41,488 54,301
Preference Share Capital - - - - -
Debt 12,357 5,948 13,748 11,748 11,655
Deferred Tax Liab (net) 4 (2) (2) (2) (2)
Minority interests 553 745 745 745 745
Capital employed 21,028 37,177 48,747 53,979 66,698
Application of Funds
Gross Fixed Assets 301 310 397 545 650
Less: Depreciation 92 129 217 311 431
Net Fixed Assets 208 181 180 234 219
Capital Work in Progress 15 37 - - -
Goodwill - - - - -
Investments 2 8,941 5,191 5,191 5,191
Current Assets
Inventories 10,578 13,195 17,418 19,710 25,034
Debtors 426 3,058 4,478 5,142 12,765
Loans and Advances 12,442 18,554 24,284 26,854 27,289
Other Current Assets - - - - -
Current Liab and Provisions 3,418 7,649 9,803 13,936 22,317
Net Current Assets 20,797 28,018 43,376 48,554 61,289
Working Capital 20,028 27,157 36,376 37,770 42,771
Cash 769 860 7,000 10,784 18,518
Capital deployed 21,028 37,177 48,747 53,979 66,698
No. of shares (m) 9.1 243.3 243.3 243.3 243.3
Net Debt/Equity (%) 142.8 16.7 19.7 2.3 (12.6)
Source: Company, Anand Rathi Research
Fig 21 – Cash flow statement (`m) Year end 31 Mar FY09 FY10e FY11e FY12e FY13e
Consolidated PAT 1,417 2,520 3,912 7,516 13,097
+ Non cash exp 77 90 88 94 120
Cash profit 1,494 2,609 4,000 7,611 13,217
- Incr/(Decr) in WC 9,131 7,130 9,219 1,394 5,001
Operating cash flow (7,637) (4,520) (5,219) 6,217 8,216
- Capex 150 91 49 149 104
Free cash flow (7,787) (4,611) (5,268) 6,068 8,112
- Dividend - - 142 285 285
+ Equity raised (585) 19,853 (0) - -
+ Debt raised 6,327 (6,409) 7,800 (2,000) (93)
+ Minority interests (1) 192 - - -
-Investments (1,783) 8,938 (3,750) - -
- Misc. items 5 (5) (0) - -
Net cash flow (268) 92 6,140 3,784 7,734
+ Opening cash 1,037 769 860 7,000 10,784
Closing cash 769 860 7,000 10,784 18,518
Source: Company, Anand Rathi Research

28 January 2011 D B Realty – A non-real-estate quarter; maintain Buy
Anand Rathi Research 32
Fig 22 – Ratio Analysis @ `157 Year end 31 Mar FY09 FY10e FY11e FY12e FY13e
Valuations
P E NA 15.2 9.8 5.1 2.9
P/BV NA 1.3 1.1 0.9 0.7
M Cap/Sales NA 4.0 2.6 1.2 0.9
EV/Sales NA 3.6 2.7 1.1 0.6
EV/EBIDTA NA 9.4 6.0 2.6 1.1
Dividend
Dividend yield (%) - - 0.3 0.6 0.6
Dividend payout (%) - - 2.9 3.1 1.5
Leverage
Net Debt/Equity 142.8 16.7 19.7 2.3 (12.6)
Int Coverage 1.8 1.9 2.5 2.2 2.2
Return Ratios
ROE (%) 18.7 14.1 13.2 20.7 32.9
ROCE (%) 12.9 15.1 16.7 26.9 42.6
Source: Company, Anand Rathi Research

Anand Rathi Financial Services Limited does and seeks to do business with companies covered in its research reports. Thus, investors should be aware that the firm may have a conflict of interest that could affect the objectivity of this report. Investors should consider this report as only a single factor in making their investment decision. Disclosures and analyst certifications are located in Appendix 1 Anand Rathi Research India Equities
India I Equities
Key financials
Year end 31 Mar FY09 FY10 FY11e FY12 e FY13 e
Sales (`m) 4,348 5,796 10,236 12,478 19,602
Net profit (`m) 2,647 1,649 2,302 2,349 3,017
EPS (`) 36.4 22.7 31.6 32.3 41.5
Growth (%) (12) (38) 40 2 28
PE (x) 6.5 10.4 7.5 7.3 5.7
PBV (x) 1.5 1.2 1.0 0.9 0.8
RoE (%) 28.3 13.1 14.5 13.0 14.6
RoCE (%) 21.7 15.4 17.2 16.5 20.9
Dividend yield (%) 0.4 2.1 0.4 0.4 0.4
Net gearing (%) 100.5 80.1 101.7 78.8 59.0
Source: Company, Anand Rathi Research Prices as of 27 Jan ’11
Property
Update
28 January 2011
Ackruti City
Premium land, but needs to be developed; retain Buy
Ackruti’s project portfolio is premium among peers. Post a good FY10, launches slowed. Though collections from pre-sales have been good, 1HFY11 has seen debt rising by ~`5bn, largely used for stake additions and working capital. We now value the stock at Mar ’12e NAV of `566 and trim our target price to `421. Buy.
Premium land – Execution is key. Compared with Mumbai peers, Ackruti’s projects have an edge as regards location (Mumbai island city) and spread (Mumbai suburbs). We believe successful and timely project development would drive value.
Growing debt may be a concern. In the past six quarters, Ackruti has sold property worth `16bn, realized debtors of `4bn, raised equity of `3bn and sold FSI/TDR of `3.1bn. But, debt also rose, by `5bn, mainly due to larger project additions and rehab construction. Although sanctioned debt for projects is `14.4bn, new project payments and stalling market volume are concerns.
Change in estimates. Our NAV is impacted by removal of the Bandra (E) project (premium yet to be paid), the Gujarat Biotech Park phase-3 (nil progress), and SRS/virgin land projects. We also increase discount to 25% from 20%, accounting for recent events and their medium-term impact.
Valuation and risks. Our Mar ’12e NAV stands at `566 and price target at `421, which is at 25% discount to NAV. At CMP, the stock trades at 0.9x Mar ’12e PBV. Key risk: Slowdown in sales.
Rating: Buy Target Price: `421 Share Price: `236
Key data AKCL IN/ ACKR.BO
52-week high/low `560/232Sensex/Nifty 18684/56043-m average volume US$1.6mMarket cap `17bn/US$373m
Shares outstanding 72.7mFree float 17.5%Promoters 82.5%Foreign Institutions 2.2%Domestic Institutions 0.8%Public 14.5%
Relative price performance
Ackruti City
Sensex
200
300
400
500
600
700
Jan-
10
Mar
-10
May
-10
Jul-1
0
Sep-
10
Nov
-10
Jan-
11
Source: Bloomberg
Change in Estimates Target Reco

28 January 2011 Ackruti City – Premium land, but needs to be developed; retain Buy
Anand Rathi Research 34
Quick Glance – Financials and Valuations Fig 1 – Income statement (`m)
Year end 31 Mar FY09 FY10 FY11 e FY12 e FY13 e
Net sales 4,348 5,796 10,236 12,478 19,602 Sales growth (%) (2) 33 77 22 57- Op. expenses (258) 1,314 3,720 5,269 9,824 EBITDA 4,095 3,825 5,526 5,961 7,720 EBITDA margins (%) 94.2 66.0 54.0 47.8 39.4 - Interest 1,402 1,680 2,240 2,456 2,204 - Depreciation 57 71 114 150 180 + Other income 200 385 200 200 -- Tax 232 817 1,147 1,209 1,814 PAT 2,603 1,641 2,226 2,346 3,521 PAT growth (%) (13.1) (37.0) 35.6 5.4 50.1Consolidated PAT 2,647 1,649 2,302 2,349 3,017 FDEPS (`/share) 36.39 22.67 31.65 32.30 41.47 CEPS (`/share) 37.20 24.37 33.21 34.36 43.95 DPS (`/share) 1.00 5.00 1.00 1.00 1.00 Source: Company, Anand Rathi Research
Fig 2 – Balance sheet (`m) Year end 31 Mar FY09 FY10 FY11 e FY12 e FY13 e
Share capital 667 727 727 727 727 Reserves & surplus 9,741 14,060 16,270 18,528 21,585 Shareholders’ fund 10,408 14,787 16,997 19,255 22,312 Debt 10,569 13,055 18,055 16,055 14,555 Def Tax Liab (net) (104) (50) (50) (50) (50)Minority interests 2 1 1 1 1 Capital employed 20,875 27,793 35,004 35,261 36,818 Fixed assets 982 2,400 3,360 3,863 4,400 Investments 3,025 3,563 3,563 3,563 3,563 Working capital 15,135 19,644 27,308 26,957 27,243 Cash 110 1,216 772 878 1,632Capital deployed 20,932 27,793 35,004 35,261 36,818No. of shares (m) 72.7 72.7 72.7 72.7 72.7 Net Debt/Equity (%) 99.9 80.1 101.7 78.8 59Source: Company, Anand Rathi Research
Fig 3 – Cash flow statement (`m) Year end 31 Mar FY09 FY10 FY11 e FY12 e FY13 e
Consolidated PAT 2,647 1,649 2,302 2,349 3,149+ Depreciation (53) 125 114 150 180 Cash profit 2,594 1,774 2,416 2,499 3,329- Incr/(Decr) in WC 2,683 4,510 7,663 (351) 266Operating cash flow (89) (2,736) (5,248) 2,850 3,063- Capex 1,515 835 105 653 718 Free cash flow (1,605) (3,571) (5,353) 2,197 2,345- Dividend 84 425 91 91 91 + Equity raised (78) 3,098 0 0 0+ Debt raised 2,277 2,486 5,000 (2,000) (1,500)- Investments 747 538 - - -- Misc. items 56 (56) - - -Net cash flow (293) 1,107 (444) 106 754+ Opening cash 403 110 1,216 772 878 Closing cash 110 1,216 772 878 1,632Source: Company, Anand Rathi Research
Fig 4 – PE Band
Ackruti City
6x 12x 18x 24x 30x
0
500
1,000
1,500
2,000
2,500
Jun-
07
Sep-
07
Dec
-07
Mar
-08
Jun-
08
Sep-
08
Dec
-08
Mar
-09
Jun-
09
Sep-
09
Dec
-09
Mar
-10
Jun-
10
Sep-
10
Dec
-10
Source: Bloomberg, Anand Rathi Research
Fig 5 – Price-to-Book Band
Ackruti City
1x
3x
5x
7x
9x
0
500
1,000
1,500
2,000
2,500
Jun-
07
Sep-
07
Dec
-07
Mar
-08
Jun-
08
Sep-
08
Dec
-08
Mar
-09
Jun-
09
Sep-
09
Dec
-09
Mar
-10
Jun-
10
Sep-
10
Dec
-10
Source: Bloomberg, Anand Rathi Research
Fig 6 – Ackruti City vs BSE Realty
Ackruti City
BSE Realty
200
300
400
500
600
Jan-
10
Feb-
10
Mar
-10
Apr-1
0
May
-10
Jun-
10
Jul-1
0
Aug-
10
Sep-
10
Oct
-10
Nov
-10
Dec
-10
Jan-
11
Source: Bloomberg
28 January 2011 Ackruti City – Premium land, but needs to be developed; retain Buy
Anand Rathi Research 35
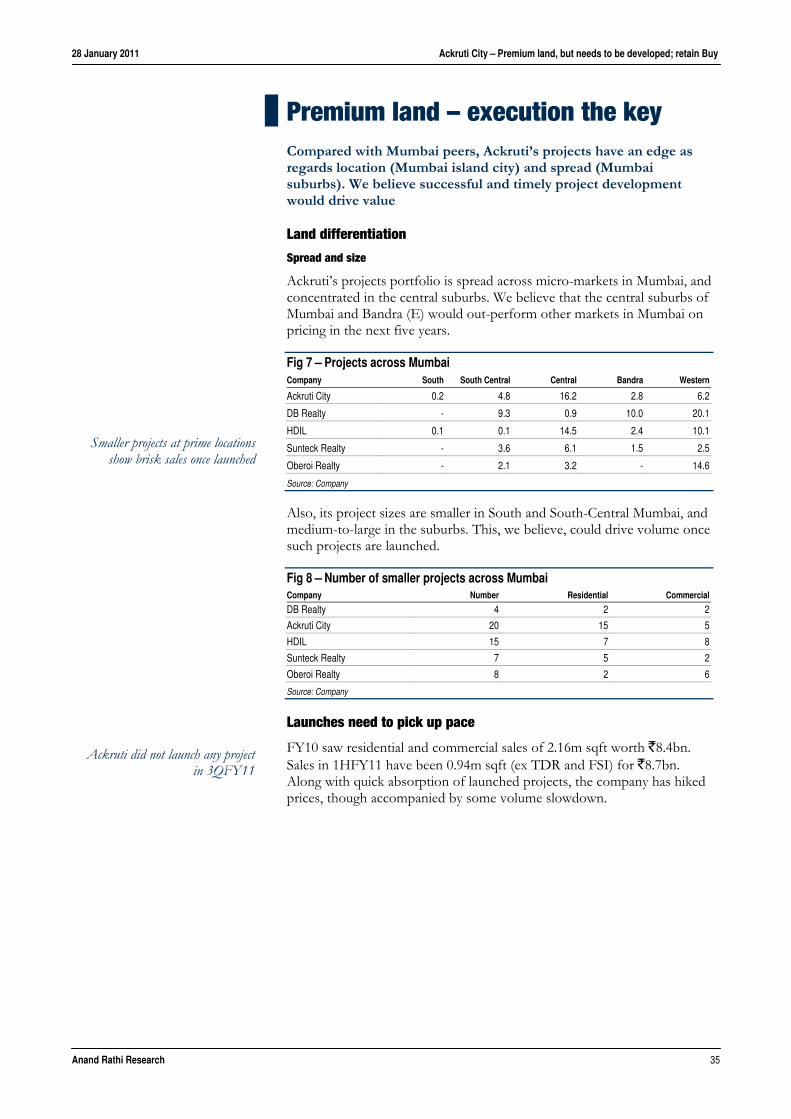
Premium land – execution the key Compared with Mumbai peers, Ackruti’s projects have an edge as regards location (Mumbai island city) and spread (Mumbai suburbs). We believe successful and timely project development would drive value
Land differentiation
Spread and size
Ackruti’s projects portfolio is spread across micro-markets in Mumbai, and concentrated in the central suburbs. We believe that the central suburbs of Mumbai and Bandra (E) would out-perform other markets in Mumbai on pricing in the next five years.
Fig 7 – Projects across Mumbai Company South South Central Central Bandra Western
Ackruti City 0.2 4.8 16.2 2.8 6.2
DB Realty - 9.3 0.9 10.0 20.1
HDIL 0.1 0.1 14.5 2.4 10.1
Sunteck Realty - 3.6 6.1 1.5 2.5
Oberoi Realty - 2.1 3.2 - 14.6
Source: Company
Also, its project sizes are smaller in South and South-Central Mumbai, and medium-to-large in the suburbs. This, we believe, could drive volume once such projects are launched.
Fig 8 – Number of smaller projects across Mumbai Company Number Residential Commercial
DB Realty 4 2 2
Ackruti City 20 15 5
HDIL 15 7 8
Sunteck Realty 7 5 2
Oberoi Realty 8 2 6
Source: Company
Launches need to pick up pace
FY10 saw residential and commercial sales of 2.16m sqft worth `8.4bn. Sales in 1HFY11 have been 0.94m sqft (ex TDR and FSI) for `8.7bn. Along with quick absorption of launched projects, the company has hiked prices, though accompanied by some volume slowdown.
Smaller projects at prime locations show brisk sales once launched
Ackruti did not launch any project in 3QFY11

28 January 2011 Ackruti City – Premium land, but needs to be developed; retain Buy
Anand Rathi Research 36
Fig 9 – Sales volume vs. sales value
0
1,600
3,200
4,800
6,400
8,000
1Q10
2Q10
3Q10
4Q10
1Q11
2Q11
0.0
0.2
0.4
0.6
0.8
1.0
Sales Value Sales Volume (RHS)
(`m) (msqft)
Source: Company
Further, on the sales value receivables front, Ackruti has been comparatively better than peers, with as much as 40% recovered from sales already concluded. Since all launches follow construction-linked payment plans, execution of launched projects is well on track.
Fig 10 – Sale value vs. sales value received
0
20
40
60
80
Ackr
uti C
ity
DB
Rea
lty
HD
IL
Sunt
eck
Rea
lty0
15
30
45
Value Sold Value Received (%) Received (RHS)
(`m) (%)
Source: Companies
With launch plans of 6.9m sqft over the next 3-4 quarters, as per 2QFY11 guidance, the company did not launch any project in 3QFY11. We believe, however, that, in order to monetize its land parcels, launches would have to be brisk, as further price hikes would be difficult. Volumes in Mumbai have already slowed down and hence price points of new projects would be important.
1HFY11 sales (by value) have been higher than those in FY10 at
sustained volume

28 January 2011 Ackruti City – Premium land, but needs to be developed; retain Buy
Anand Rathi Research 37
Fig 11 – Project launches planned Project Name Location Area to be launched in m sqft
Residential Projects
IVIL Phase I Ghatkopar 0.7
Ackruti Ruby Andheri(W) 0.3
Ackruti Swastik Chembur 0.4
Mazgaon Mazgaon 0.2
Ackruti Sea Breeze Hughes Road 0.2
Jade Gardens Peddar Road 0.0
Ackruti Gardenia Phase II Mira Road 0.5
Ackruti Lakewoods Thane 0.5
Ackruti Countrywoods Phase II Kondhwa, Pune 1.2
Commercial Projects
Zeus - PH I Mulund 1.5
GSRTC - Geeta Mandir Ahmedabad 0.3
GSRTC - Adajan Surat 0.5
Hotel, Residential & (Service)
Hindustan Mill Prabhadevi 0.6
Source: Company

28 January 2011 Ackruti City – Premium land, but needs to be developed; retain Buy
Anand Rathi Research 38
Growing debt may be a concern In the past six quarters, Ackruti sold properties worth `16bn, realized debtors of `4bn, raised equity of `3bn and sold FSI/TDR of `3.1bn. Debt, however, has also risen, by `5bn, mainly on account of other construction and larger project additions. Although sanctioned debt for projects is `14.4bn, new project payments and stalling markets raise concerns.
Balance sheet
Debt has risen by `5bn in 1HFY11, mostly on project stake additions, investments in township projects, debtors from sales of FSI/development rights and working capital for rehabilitation. With sales slowing down in Mumbai and credit becoming dearer for developers, the increase in debt could be a cause of concern.
Fig 12 – Growing debt: A red flag
0
4,000
8,000
12,000
16,000
20,000
Sep-
09
Dec
-09
Mar
-10
Jun-
10
Sep-
10
0.60
0.70
0.80
0.90
1.00
1.10
Gross debt Cash Net D/E (RHS)
(`m) (%)
Source: Company
But key near-term projects are well-funded
All residential under-construction projects being self-funded now, the focus is on new launches. Ackruti has sanctioned debt of ~`14.4bn for the new launches planned. This, we believe, could hasten the rehab and free-sale construction process in the near future, provided project additions are arrested.
Fig 13 – Sanctioned debt for new projects Project Sanction (`m)
Textile Park 700
Rising City 2,000
Chembur 1,200
Ruby 1,000
H Mills 9,500
Sion - Wadala P1 2,500
Source: Company
`14.4bn has been sanctioned for project-specific construction

28 January 2011 Ackruti City – Premium land, but needs to be developed; retain Buy
Anand Rathi Research 39
Change in stance We change our NAV for Ackruti City, in line with Mumbai peers. We remove projects with little visibility (Gujarat Biotech Park, Culture Cricket academy; Bandra East; a few SRS projects) and where premium has not been paid for the land (Bandra East government colony project). This impacts our NAV by 47%. We also raise our discount to NAV to 25% from 20% earlier, to take into account recent events and their medium-term impact.
Valuation
We have removed the Bandra (E) government colony project where Ackruti City has obtained an LoA, but a premium of `3.33bn has yet to be paid. The payment, initially to be made in Sep ’10, has now been delayed to Feb ’11. The final sellable area of the project also depends on when the area obtains an FSI of 4. Negative impact on NAV: 21%.
Gujarat Biotech Park: Progress on the biotech park SEZ has been slow in the past few quarters. Although phase 1 is complete and operational, phase 2 is seeing slow progress and land for phase 3 would be handed over to the company only on substantial development in phase 2. Negative impact on NAV: 18%.
In certain SRS and virgin land projects in Mumbai, complete project acquisition has still to be achieved and is slow at present. We remove eight SRS projects totaling 2.1m sqft and a PPP project of over 0.28m sqft in Bandra (E) owing to nil visible progress and the negligible premium paid. Negative impact on NAV: 4%
Fig 14 – Valuation: Mar’12e NAV Mar’12 (`m) (`/share)
SRS 22,083 304
PPP 10,701 147
Normal Projects 8,057 111
SEZs 11,863 163
Townships 2,782 38
Investments at Cost 870 12
Net Debt (15,177) (209)
Total 41,179 566
Source: Anand Rathi Research
Fig 15 – Optional Value - considered as on March'12 NAV Mar’12 (`m) (`/share)
Bandra(E) Gov Colony 10,918 150
Biotech Park P2 and 3 9,976 137
SRS, PPP projects 3,027 42
Source: Anand Rathi Research
We have assumed a development schedule for slum rehab schemes/ redevelopment schemes where work has started, and debt has been sanctioned or drawn.
We change our assumptions for the Hindustan Mills Project, from a sale model to a lease one (cash flows would now be back-ended). The company has received the important environmental clearance for the project and debt sanctioned is `9.5bn.
For valuation, we have considered only visible projects in SRS

28 January 2011 Ackruti City – Premium land, but needs to be developed; retain Buy
Anand Rathi Research 40
After changes in taxes applicable on slum rehab projects, Ackruti sold some projects to avail of higher tax benefits and upfront cash.
For the residual township land, we have altered our market-value assumptions in line with recent land sales conducted by the company in the region.
Risk
Slowdown in sales

28 January 2011 Ackruti City – Premium land, but needs to be developed; retain Buy
Anand Rathi Research 41
Financials Fig 16 – Income statement (`m) Year end 31 Mar FY09 FY10 FY11e FY12e FY13e
Recurring Revenue
Revenue 4,348 5,796 10,236 12,478 19,602
- Op. expenses (258) 1,314 3,720 5,269 9,824
- Employee Costs 149 141 273 374 588
- Other Administrative 362 517 716 873 1,470
EBIDTA 4,095 3,825 5,526 5,961 7,720
- Interest 1,402 1,680 2,240 2,456 2,204
- Depreciation 57 71 114 150 180
+ Other income 200 385 200 200 200
- Tax 232 817 1,147 1,209 1,882
PAT 2,603 1,641 2,226 2,346 3,653
+ Minority Interests 3 0 (72) (141) (1,135)
+ Share of profit from Associates 92 36 148 145 630
Consolidated PAT 2,647 1,649 2,302 2,349 3,149
Dividend 84 425 91 91 91
FDEPS (` / share) 36.4 22.7 31.6 32.3 43.3
CEPS (` / share) 37.2 24.4 33.2 34.4 45.8
DPS (` / share) 1.0 5.0 1.0 1.0 1.0
BV (` / share) 156.9 203.3 233.7 264.7 306.8
Shares outstanding 66.7 72.7 72.7 72.7 72.7
Growth Rates (%)
Revenue (2.3) 33.3 76.6 21.9 57.1
EBIDTA 8.0 (6.6) 44.5 7.9 29.5
Net PAT (11.6) (37.7) 39.6 2.1 34.0
Diluted EPS (11.6) (37.7) 39.6 2.1 34.0
FY10-13e Revenue CAGR 50.1%
FY10-13e EBITDA CAGR 26.4%
FY10-13e EPS CAGR 24.1%
Margins
EBIDTA 94.2 66.0 54.0 47.8 39.4
EBIT (543.9) 127.8 60.2 46.6 22.4
Net Profit 38.4 50.7 41.6 40.1 30.7
Source: Company, Anand Rathi Research

28 January 2011 Ackruti City – Premium land, but needs to be developed; retain Buy
Anand Rathi Research 42
Fig 17 – Balance sheet (`m) Year end 31 Mar FY09 FY10 FY11e FY12e FY13e
Sources of Funds
Share capital 667 727 727 727 727
Reserves & surplus 9,741 14,060 16,270 18,528 21,585
Shareholders’ fund 10,408 14,787 16,997 19,255 22,312
Debt 10,569 13,055 18,055 16,055 14,555
Deferred Tax Liab (net) (104) (50) (50) (50) (50)
Minority interests 2 1 1 1 1
Capital employed 20,875 27,793 35,004 35,261 36,818
Application of Funds
Gross Fixed Assets 760 1,574 2,563 3,106 3,705
Less: Depreciation 110 162 290 440 621
Net Fixed Assets 650 1,411 2,273 2,666 3,084
Capital Work in Progress 331 989 1,088 1,196 1,316
Goodwill on consolidation 1,624 969 - - -
Investments 3,025 3,563 3,563 3,563 3,563
Current Assets
Inventories 6,106 7,903 9,264 11,260 12,239
Debtors 4,517 3,208 3,201 5,067 2,539
Loans and Advances 6,153 11,216 15,702 14,603 16,063
Other Current Assets 741 479 526 632 821
Current Liab and Provisions 2,383 3,160 1,386 4,604 4,440
Net Current Assets 15,244 20,861 28,080 27,835 28,855
Working Capital 15,135 19,644 27,308 26,957 27,223
Cash 110 1,216 772 878 1,632
Capital deployed 20,875 27,793 35,004 35,261 36,818
No. of shares (m) 66.7 72.7 72.7 72.7 72.7
Net Debt/Equity (%) 100.5 80.1 101.7 78.8 57.9
Source: Company, Anand Rathi Research
Fig 18 – Cash flow statement (`m) Year end 31 Mar FY09 FY10 FY11e FY12e FY13e
Consolidated PAT 2,647 1,649 2,302 2,349 3,149
+ Depreciation 57 71 114 150 180
+ Deferred Tax (110) 53 - - -
Cash profit 2,594 1,774 2,416 2,499 3,329
- Incr/(Decr) in WC 2,683 4,510 7,663 (351) 266
Operating cash flow (89) (2,736) (5,248) 2,850 3,063
- Capex 1,515 835 105 653 718
Free cash flow (1,605) (3,571) (5,353) 2,197 2,345
- Dividend 84 425 91 91 91
+ Equity raised (78) 3,098 0 0 (0)
+ Debt raised 2,277 2,486 5,000 (2,000) (1,500)
- Investments 747 538 - - -
- Misc. items 56 (56) - - -
Net cash flow (293) 1,107 (444) 106 754
+ Opening cash 403 110 1,216 772 878
Closing cash 110 1,216 772 878 1,632
Source: Company, Anand Rathi Research

28 January 2011 Ackruti City – Premium land, but needs to be developed; retain Buy
Anand Rathi Research 43
Fig 19 – Ratio Analysis @ `236 Year end 31 Mar FY09 FY10 FY11e FY12e FY13e
Valuations
P / E 6.5 10.4 7.5 7.3 5.5
P / BV 1.5 1.2 1.0 0.9 0.8
M Cap / Sales 3.6 3.0 1.7 1.4 0.9
EV / Sales 5.3 4.4 3.0 2.3 1.4
EV / EBIDTA 5.7 6.7 5.6 4.8 3.4
Dividend
Dividend yield 0.4 2.1 0.4 0.4 0.4
Dividend payout 2.6 22.2 3.3 3.1 2.0
Leverage
Net Debt / Equity 1.0 0.8 1.0 0.8 0.6
Int Coverage 3 2 2 2 3
Return Ratios
RoE 28.3 13.1 14.5 13.0 15.1
RoCE 21.7 15.4 17.2 16.5 20.9
Source: Company, Anand Rathi Research

Appendix 1 Analyst Certification The views expressed in this research report accurately reflect the personal views of the analyst(s) about the subject securities or issuers and no part of the compensation of the research analyst(s) was, is, or will be directly or indirectly related to the specific recommendations or views expressed by the research analyst(s) in this report. The research analysts, strategists, or research associates principally responsible for the preparation of Anand Rathi Research have received compensation based upon various factors, including quality of research, investor client feedback, stock picking, competitive factors, firm revenues and overall investment banking revenues.
Anand Rathi Ratings Definitions
Analysts’ ratings and the corresponding expected returns take into account our definitions of Large Caps (>US$1bn) and Mid/Small Caps (<US$1bn) as described in the Ratings Table below.
Ratings Guide Buy Hold Sell Large Caps (>US$1bn) >20% 5-20% <5% Mid/Small Caps (<US$1bn) >30% 10-30% <10%
Anand Rathi Research Ratings Distribution (as of 6 December 10) Buy Hold Sell Anand Rathi Research stock coverage (138) 69% 17% 14% % who are investment banking clients 5% 4% 0% Other Disclosures This report has been issued by Anand Rathi Financial Services Limited (ARFSL), which is regulated by SEBI.
The information herein was obtained from various sources; we do not guarantee its accuracy or completeness. Neither the information nor any opinion expressed constitutes an offer, or an invitation to make an offer, to buy or sell any securities or any options, futures or other derivatives related to such securities ("related investments"). ARFSL and its affiliates may trade for their own accounts as market maker / jobber and/or arbitrageur in any securities of this issuer(s) or in related investments, and may be on the opposite side of public orders. ARFSL, its affiliates, directors, officers, and employees may have a long or short position in any securities of this issuer(s) or in related investments. ARFSL or its affiliates may from time to time perform investment banking or other services for, or solicit investment banking or other business from, any entity mentioned in this report. This research report is prepared for private circulation. It does not have regard to the specific investment objectives, financial situation and the particular needs of any specific person who may receive this report. Investors should seek financial advice regarding the appropriateness of investing in any securities or investment strategies discussed or recommended in this report and should understand that statements regarding future prospects may not be realized. Investors should note that income from such securities, if any, may fluctuate and that each security's price or value may rise or fall. Past performance is not necessarily a guide to future performance. Foreign currency rates of exchange may adversely affect the value, price or income of any security or related investment mentioned in this report.
This document is intended only for professional investors as defined under the relevant laws of Hong Kong and is not intended for the public in Hong Kong. The contents of this document have not been reviewed by any regulatory authority in Hong Kong. No action has been taken in Hong Kong to permit the distribution of this document. This document is distributed on a confidential basis. This document may not be reproduced in any form or transmitted to any person other than the person to whom it is addressed.
If this report is made available in Hong Kong by, or on behalf of, Anand Rathi Financial Services (HK) Limited., it is attributable to Anand Rathi Financial Services (HK) Limited., Unit 1211, Bank of America Tower, 12 Harcourt Road, Central, Hong Kong. Anand Rathi Financial Services (HK) Limited. is regulated by the Hong Kong Securities and Futures Commission.
Anand Rathi Financial Services Limited and Anand Rathi Share & Stock Brokers Limited are members of The Stock Exchange, Mumbai, and the National Stock Exchange of India.
© 2010 Anand Rathi Financial Services Limited. All rights reserved. This report or any portion hereof may not be reprinted, sold or redistributed without the written consent of Anand Rathi Financial Services Limited.
Additional information on recommended securities/instruments is available on request.