Analyzing user-event data using score-based likelihood ...
9
DFRWS 2017 USA d Proceedings of the Seventeenth Annual DFRWS USA Analyzing user-event data using score-based likelihood ratios with marked point processes Christopher Galbraith a, * , Padhraic Smyth b a Department of Statistics, University of California, Irvine, Bren Hall 2019, Irvine, CA 92697, USA b Department of Computer Science, University of California, Irvine, Bren Hall 3019, Irvine, CA 92697, USA Keywords: Digital forensics Likelihood ratio Marked point process Event data Density estimation Time series abstract In this paper we investigate the application of score-based likelihood ratio techniques to the problem of detecting whether two time-stamped event streams were generated by the same source or by two different sources. We develop score functions for event data streams by building on ideas from the statistical modeling of marked point processes, focusing in particular on the coefficient of segregation and mingling index. The methodology is applied to a data set consisting of logs of computer activity over a 7-day period from 28 different individuals. Experimental results on known same-source and known different-source data sets indicate that the proposed scores have significant discriminative power in this context. The paper concludes with a discussion of the potential benefits and challenges that may arise from the application of statistical analysis to user-event data in digital forensics. © 2017 The Author(s). Published by Elsevier Ltd. on behalf of DFRWS. This is an open access article under the CC BY-NC-ND license (http://creativecommons.org/licenses/by-nc-nd/4.0/). Introduction Event histories recording user activities are routinely logged on devices such as computers and mobile phones. For a particular user these logs typically consist of a list of events where each event consists of a timestamp and some metadata associated with the event. For example, with popular Web browsers (such as Chrome, Internet Explorer, and Firefox) a variety of events related to user actions are logged on the local device. Examples of such actions include content downloads, URL requests, search history, and so on. Log files of user activity are also often accessible via cloud storage, for example for user events related to email activity, social media activity (such as Facebook and Twitter), and remote file storage and editing. As digital devices become more prevalent, these types of user event histories are encountered with increasing regularity during forensic investigations. As an example, an investigator might be trying to determine if two event histories, corresponding to different usernames, were in fact generated by the same individual. The primary contribution of this paper is the development of quantitative likelihood ratio techniques for forensic analysis of user-generated time-series in the form of event data. In particular we investigate score-based likelihood ratio methods in the context of determining whether two event histories are related, e.g., whether or not they were generated by the same individual. We focus in this paper on events that correspond to URL requests generated in a browserdhowever, the methodology we propose is broadly applicable to event data in general. We begin by discussing related work, both in digital forensics as well as in score-based likelihood ratio methodologies and appli- cations. We then discuss the theoretical foundations of the likeli- hood ratio and motivate the score-based likelihood ratio in the context of digital forensics. We then introduce relevant ideas from marked point processes, a statistical framework that has been widely used to analyze spatial point data, which we apply here to sequential event data streams. In particular we focus on the use of segregation and mingling indices as the basis for our score func- tions, and we describe how these techniques can be applied to evaluating the likelihood that two event streams were generated by the same source (or individual). We apply this methodology to a data set of event histories for 28 individuals, focusing on user ac- tivity related to social media. The results indicate that score func- tions based on marked point processes can have significant discriminative power for event-based data sets. In the final section of the paper we discuss both the promise and challenges involved in developing statistical analysis methods for event histories in the context of forensic investigations. * Corresponding author. E-mail addresses: [email protected] (C. Galbraith), [email protected] (P. Smyth). Contents lists available at ScienceDirect Digital Investigation journal homepage: www.elsevier.com/locate/diin http://dx.doi.org/10.1016/j.diin.2017.06.009 1742-2876/© 2017 The Author(s). Published by Elsevier Ltd. on behalf of DFRWS. This is an open access article under the CC BY-NC-ND license (http://creativecommons.org/ licenses/by-nc-nd/4.0/). Digital Investigation 22 (2017) S106eS114
Transcript of Analyzing user-event data using score-based likelihood ...
DFRWS 2017 USA d Proceedings of the Seventeenth Annual DFRWS USA
Analyzing user-event data using score-based likelihood ratios withmarked point processes
Christopher Galbraith a, *, Padhraic Smyth b
a Department of Statistics, University of California, Irvine, Bren Hall 2019, Irvine, CA 92697, USAb Department of Computer Science, University of California, Irvine, Bren Hall 3019, Irvine, CA 92697, USA
Keywords:Digital forensicsLikelihood ratioMarked point processEvent dataDensity estimationTime series
a b s t r a c t
In this paper we investigate the application of score-based likelihood ratio techniques to the problem ofdetecting whether two time-stamped event streams were generated by the same source or by twodifferent sources. We develop score functions for event data streams by building on ideas from thestatistical modeling of marked point processes, focusing in particular on the coefficient of segregationand mingling index. The methodology is applied to a data set consisting of logs of computer activity overa 7-day period from 28 different individuals. Experimental results on known same-source and knowndifferent-source data sets indicate that the proposed scores have significant discriminative power in thiscontext. The paper concludes with a discussion of the potential benefits and challenges that may arisefrom the application of statistical analysis to user-event data in digital forensics.© 2017 The Author(s). Published by Elsevier Ltd. on behalf of DFRWS. This is an open access article under
the CC BY-NC-ND license (http://creativecommons.org/licenses/by-nc-nd/4.0/).
Introduction
Event histories recording user activities are routinely logged ondevices such as computers and mobile phones. For a particular userthese logs typically consist of a list of events where each eventconsists of a timestamp and some metadata associated with theevent. For example, with popular Web browsers (such as Chrome,Internet Explorer, and Firefox) a variety of events related to useractions are logged on the local device. Examples of such actionsinclude content downloads, URL requests, search history, and so on.Log files of user activity are also often accessible via cloud storage,for example for user events related to email activity, social mediaactivity (such as Facebook and Twitter), and remote file storage andediting.
As digital devices become more prevalent, these types of userevent histories are encountered with increasing regularity duringforensic investigations. As an example, an investigator might betrying to determine if two event histories, corresponding todifferent usernames, were in fact generated by the same individual.
The primary contribution of this paper is the development ofquantitative likelihood ratio techniques for forensic analysis ofuser-generated time-series in the form of event data. In particular
we investigate score-based likelihood ratio methods in the contextof determining whether two event histories are related, e.g.,whether or not they were generated by the same individual. Wefocus in this paper on events that correspond to URL requestsgenerated in a browserdhowever, the methodology we propose isbroadly applicable to event data in general.
We begin by discussing related work, both in digital forensics aswell as in score-based likelihood ratio methodologies and appli-cations. We then discuss the theoretical foundations of the likeli-hood ratio and motivate the score-based likelihood ratio in thecontext of digital forensics. We then introduce relevant ideas frommarked point processes, a statistical framework that has beenwidelyused to analyze spatial point data, which we apply here tosequential event data streams. In particular we focus on the use ofsegregation and mingling indices as the basis for our score func-tions, and we describe how these techniques can be applied toevaluating the likelihood that two event streamswere generated bythe same source (or individual). We apply this methodology to adata set of event histories for 28 individuals, focusing on user ac-tivity related to social media. The results indicate that score func-tions based on marked point processes can have significantdiscriminative power for event-based data sets. In the final sectionof the paper we discuss both the promise and challenges involvedin developing statistical analysis methods for event histories in thecontext of forensic investigations.
* Corresponding author.E-mail addresses: [email protected] (C. Galbraith), [email protected] (P. Smyth).
Contents lists available at ScienceDirect
Digital Investigation
journal homepage: www.elsevier .com/locate/di in
http://dx.doi.org/10.1016/j.diin.2017.06.0091742-2876/© 2017 The Author(s). Published by Elsevier Ltd. on behalf of DFRWS. This is an open access article under the CC BY-NC-ND license (http://creativecommons.org/licenses/by-nc-nd/4.0/).
Digital Investigation 22 (2017) S106eS114

Related work
We will discuss two general threads of related work in thissection: (i) methods for exploring and analyzing user event his-tories in the context of digital forensics and (ii) likelihood-ratiotechniques for evaluating whether two samples originated fromthe same source. There has been relatively little overlap of thesetwo topics in prior work, with a few exceptions (e.g., Ishihara, 2011;Overill and Silomon, 2010).
Analysis of user-event logs
In digital forensics there is significant interest in the develop-ment of tools that can assist in the investigation of user-generatedevent logs from computers and mobile devices (Casey, 2011;Roussev, 2016). These event logs may be stored locally on the de-vice (Oh et al., 2011; Pereira, 2009) or (increasingly) in cloud stor-age (Roussev and McCulley, 2016). To help investigators betterunderstand and explore these large data sets there has been a va-riety of work in recent years on techniques for visualization andanalysis of such logs. Examples include interactive timeline analysis(e.g., Buchholz and Falk, 2005), exploring data theft using filecopying timestamps (Grier, 2011), visualization of email histories(Koven et al., 2016), analyzing session to session similarities ofInternet usage (Gresty et al., 2016), and linking user sessions vianetwork traffic information (Kirchler et al., 2016). Beyond the fieldof digital forensics, in areas such as machine learning and datamining, a variety of general purpose event mining and analysisalgorithms and tools have also been developed for exploration ofevent data, using techniques such as automated summarization(e.g., Kiernan and Terzi, 2009) and social network analysis (e.g.,Eagle et al., 2009). In general, however, much of this prior work onevent data is oriented towards data exploration, rather than on thedevelopment of statistical methodologies to answer specific ques-tions in a digital forensics setting.
Score-based likelihood ratios in forensics
Although not commonly employed in digital forensics, likeli-hood ratio techniques have seen a great deal of attention in fo-rensics as a whole. In forensic analysis a common question iswhether two (or more) samples of interest come from the samesource or not. Likelihood ratio (LR) methods provide a probabilisticframework for assessing the relative likelihood of the twocompeting hypotheses (same-source or different-source) givenobserved evidence. LR methods have been widely accepted in thepractice of forensic science, particularly in DNA analysis (Foremanet al., 2003). In other areas such as glass fragment analysis(Aitken and Lucy, 2004), speaker recognition (Gonzalez-Rodriguezet al., 2006), fingerprint analysis (Neumann et al., 2007), hand-writing analysis (Schlapbach and Bunke, 2007), and analysis ofillicit drugs (Bolck et al., 2015), the use and application of LRtechniques is still an area of ongoing research and investigation.
In the direct LR approach the probabilities (or likelihood) of theobserved measurements (under some appropriate distributionalmodel) are computed under both hypotheses being considered.Score-based LR methods differ to the direct approach in that theyfocus on distributions of similarities (or dissimilarities) betweensamples. These similarities are often one-dimensional, which canbe easier to work with compared to modeling the often high-dimensional observations in the direct LR approach. The two ap-proaches, score-based LR and direct LR, provide different tradeoffsin terms of flexibility and robustness (e.g., see Bolck et al. (2015) fora discussion of this tradeoff in the context of forensic analysis ofchemical profiles of drugs). In this paper we focus on the score-
based LR approach. This is motivated by the fact that the type ofdata we are analyzing, namely event time series, can be difficult tomodel directly (in terms of making appropriate distributional as-sumptions), making the score-based approach appealing and moredirectly applicable in this context.
The likelihood ratio
In the discussion below on likelihood ratios we will generallyfollow the notation of Bolck et al. (2015). The LR is the ratio of twoconditional probabilities, where each probability corresponds tothe strength of evidence under a particular hypothesis. The evi-dence, E, corresponds to observed data and can take different formssuch as measurements related to DNA, fingerprints, or user-eventstreams. Let E ¼ {X,Y} where X is a set of observations (measured“features”) for a reference sample from a known source (i.e., asample from a suspect), and Y is a set of observations of the samefeatures as X for a sample from an unidentified source (i.e., a samplerecovered from the crime scene).
The likelihood ratio is the ratio of the probability of observingthe evidence E under two competing hypotheses. The first hy-pothesis is that the samples come from the same source, Hs. Thesecond hypothesis is that the samples come from different sources,Hd. The LR arises in the application of Bayes' theorem to thissituation:
PrðHsjEÞPrðHdjEÞ|fflfflfflfflfflffl{zfflfflfflfflfflffl}
a posteriori odds
¼ PrðEjHsÞPrðEjHdÞ
zfflfflfflfflffl}|fflfflfflfflffl{likelihood ratio
PrðHsÞPrðHdÞ|fflfflfflffl{zfflfflfflffl}
a priori odds
(1)
The likelihood ratio serves the purpose of updating the a prioriodds to form the a posteriori odds (i.e., the ratio of the probability ofthe hypothesis Hs to the probability of the hypothesis Hd afterobserving the evidence E) by comparing the probability ofobserving the evidence if the samples are from the same sourceversus different sources. In practice a forensic examiner may pre-sent a likelihood ratio involving a specific type of evidence to eitherthe judge or jury, who then update their personal prior odds. Thisprocess is repeated formultiple forms of evidence until the decisionmaker can formulate their posterior odds to arrive at a final judg-ment. In this paper we focus specifically on the likelihood ratio inEquation (1) above, and in particular on statistical models andestimation techniques related to PrðEjHsÞ and PrðEjHdÞ.
In practice we are often working with evidence E in the form ofcontinuous measurements, requiring the use of probability densityfunctions f (rather than probabilities Pr) to define the likelihoodratio:
LR ¼ f ðEjHsÞf ðEjHdÞ
¼ f ðX; Y jHsÞf ðX;Y jHdÞ
(2)
The likelihood ratio in Equation (2) is sometimes referred to as afeature-based likelihood ratio, where f is the joint density of themultivariate feature vectors X and Y. As mentioned earlier, esti-mating high-dimensional joint densities tends to be unreliablewhen the dimensionality of the data (the number of features in Xand Y) is large. In particular, the number of observations required toreliably estimate a joint density to a required degree of accuracytends to increase exponentially as a function of dimensionality (e.g.,Scott, 1992).
One technique to sidestep this issue is to compute a function Dof the observed samples X and Y and estimate the probabilitydensity function of D(X,Y), where D(X,Y) is typically a one-dimensional scalar-valued function of X and Y. This estimation
C. Galbraith, P. Smyth / Digital Investigation 22 (2017) S106eS114 S107

can be performed using samples from a set of observational units(i.e., a reference data set D) assumed to be a representative samplefrom the population of all possible sources. The function D is oftenreferred to as a score function. It measures the similarity (ordissimilarity) of the two sets of observed features X and Y. ReplacingX,Y with D(X,Y) in Equation (2) yields the score-based likelihoodratio (SLR):
SLRD ¼ f ðDðX;YÞjHs;DsÞf ðDðX;YÞjHd;DdÞ
(3)
where we explicitly condition on the two data sets Ds (same-source) and Dd (different-source) used to construct the empiricaldensities in the numerator and denominator. The two conditioningsets are formed by restricting the reference data D to samplesknown to be from the same source and different sources, respec-tively. If D is a univariate function, then its density f is also uni-variate and relatively easy to estimate via any of a variety ofstandard parametric or non-parametric methods.
In order to compute the score-based likelihood ratio for aparticular piece of evidence, we need to choose a function D(X,Y)that can assess the similarity of the two samples, where herewe areinterested in samples X and Y that are in the form of time-stampedevents. In the next section we will discuss how to compute simi-larity functions D(X,Y) for such data using ideas from the markedpoint process literature.
Given conditioning sets Ds and Dd we can construct empiricalestimates of the densities for D under the two competing hypoth-eses Hs and Hd, respectively. With these empirical distributions, andgiven two samples X and Y, we can compute the value of each of thedensity functions f evaluated at D(X,Y) to obtain f ðDðX;YÞjHs;DsÞand f ðDðX;YÞjHd;DdÞ. Finally we compute their ratio to get thescore-based likelihood ratio SLRD as in Equation (3). Fig. 1 providesan illustrative example of computing a SLR in this manner.
Score-based likelihood ratios can be used to quantify thestrength of evidence in the following way: if SLRD > 1 we favor thehypothesis that the samples originated from the same source.Conversely, if SLRD < 1 we favor the hypothesis that the samplescame from different sources. If the score-based likelihood ratio isequal to or close to 1, we say that the results are inconclusive. Thefurther SLRD is from 1, the more confidence we have in ourconclusion.
Marked point processes
To define a score-based likelihood ratio in the context of eventdata we need to define a similarity score D(X,Y) for two observed
streams of events X and Y. We do this using techniques from themodeling of marked point processes. These techniques are typicallyapplied to problems involving statistical analysis of spatial pointdatadhere we adapt them for temporal event data.
In the discussion belowwe generally follow the notation of Illianet al. (2008) who define a marked point processM as a sequence ofrandommarked points,M ¼ {(tn,m(tn))}, wherem(tn) is the mark ofpoint tn2ℝd. The dimension d is associated with different physicalinterpretations (e.g., d¼ 2 for spatial data). In this paper, we restrictour focus to the one-dimensional temporal case (d ¼ 1), so that thepoints tn are simply timestamps, where 0 � tn < tnþ1 for all n. Inpractice we can only observe a finite window of time, and thereforewe have a finite number of observations n.
In general the marks m(tn) can be either quantitative (contin-uous) or qualitative (categorical, discrete) and describe a particularcharacteristic of the objects represented by the points. The partic-ular methodology used for analyzing marks depends on theirtypeddifferent techniques are used for analyzing quantitativeversus qualitativemarks. Herewe focus our attention on qualitativemarks. If only two types of points are considered, denoted x and y,we call the process bivariate.
In the setting of digital forensics and user-event streams, weconsider the following setup. Each user's event stream is dichoto-mized by the mark, or type of event, and represented as a bivariatemarked point process in the temporal dimension. As an example, inthe data we consider later in the paper, the first mark correspondsto Facebook-related browser events and the second mark corre-sponds to all other non-Facebook events in the browser.
Let {Xi,Yi} denote the ith user's bivariate process whereXi ¼ {tij:m(tij) ¼ x for j ¼ 1,…,ni} is defined as the sub-process ofevents of mark x. Similarly, define Yi as the sub-process of events ofmark y. Thus, the ith user has ni observed events where tij2ℝþ andmðtijÞ2fx; yg are the time and mark of the ith user's jth event,respectively. Fig. 2 illustrates an example of a particular user'sbivariate marked point process (this is a subset of the data that wewill describe in detail later in the paper).
Illian et al. (2008) discuss a number of techniques to charac-terize the point distribution, while taking into account the marks,in a bivariate process. They make a distinction between first-ordercharacteristics, indices, and higher order characteristics. The first-order characteristics consist of simple measures related to thepoints (i.e., the intensity l, or the mean number of points per unittime) and the marks (i.e., the mark probabilities px and py, or therelative frequencies of each mark). Along with indices, which areneighborhood-based measurements, these characteristics describethe basic properties of the marks and points in a bivariate process.Higher order characteristics consider both the variability of thepoint distribution and the variability of marks and describe corre-lations among marks and points. These characteristics can describelonger-range dependencies in an event process, but are susceptibleto certain assumptions (i.e., stationarity) that are not appropriatefor the data analyzed in this paper.
Fig. 1. Illustration of the densities of the score function D under the hypotheses thatthe samples are from the same source (Hs, dashed line) and that the samples are fromdifferent sources (Hd, solid line). The score-based likelihood ratio SLRD is the ratio ofthe density functions f evaluated at D(X,Y).
Fig. 2. Illustration of a bivariate marked point process in the temporal dimension forthe first day of observation of user 10 in our data set. The lowest row (a mixture of redcrosses and black points) is the bivariate process {X10,Y10}. The two rows above itrepresent the sub-processes of the event stream dichotomized by type: X10 (black dotsof mark x, or Facebook browser events) and Y10 (red crosses of mark y, or non-Facebookbrowser events). (For interpretation of the references to colour in this figure legend,the reader is referred to the web version of this article.)
C. Galbraith, P. Smyth / Digital Investigation 22 (2017) S106eS114S108
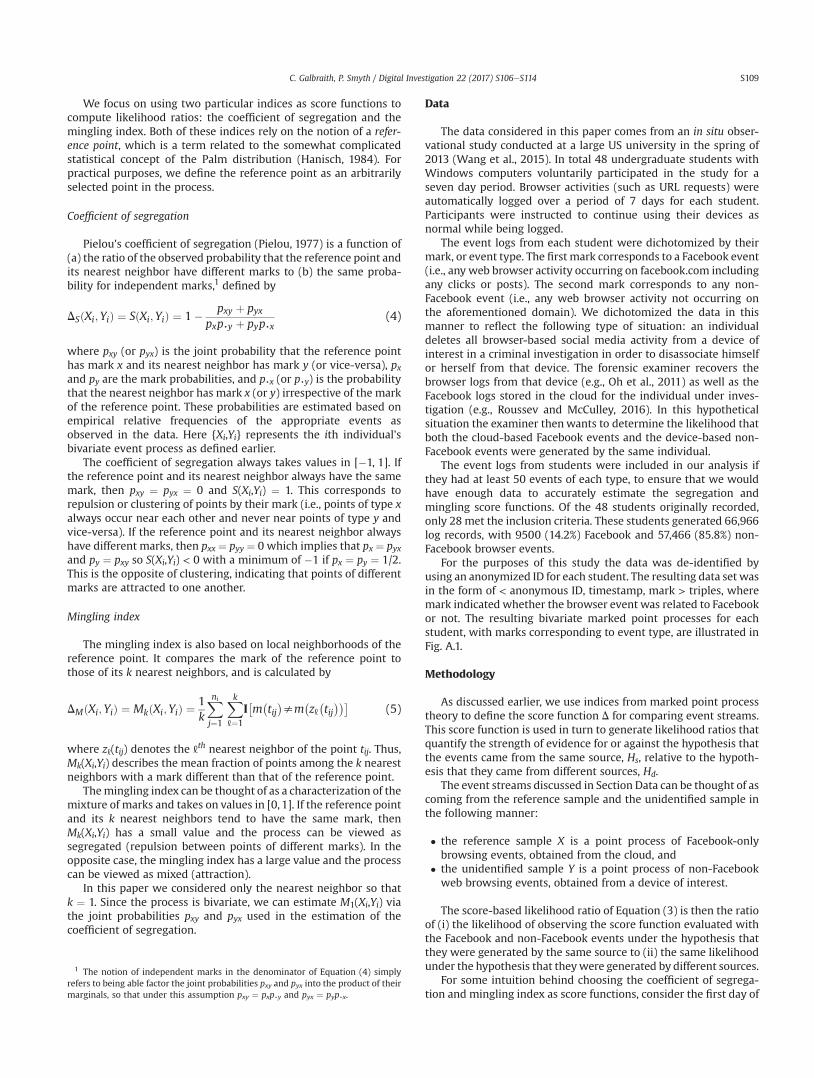
We focus on using two particular indices as score functions tocompute likelihood ratios: the coefficient of segregation and themingling index. Both of these indices rely on the notion of a refer-ence point, which is a term related to the somewhat complicatedstatistical concept of the Palm distribution (Hanisch, 1984). Forpractical purposes, we define the reference point as an arbitrarilyselected point in the process.
Coefficient of segregation
Pielou's coefficient of segregation (Pielou, 1977) is a function of(a) the ratio of the observed probability that the reference point andits nearest neighbor have different marks to (b) the same proba-bility for independent marks,1 defined by
DSðXi;YiÞ ¼ SðXi; YiÞ ¼ 1� pxy þ pyxpxp,y þ pyp,x
(4)
where pxy (or pyx) is the joint probability that the reference pointhas mark x and its nearest neighbor has mark y (or vice-versa), pxand py are the mark probabilities, and p,x (or p,y) is the probabilitythat the nearest neighbor has mark x (or y) irrespective of the markof the reference point. These probabilities are estimated based onempirical relative frequencies of the appropriate events asobserved in the data. Here {Xi,Yi} represents the ith individual'sbivariate event process as defined earlier.
The coefficient of segregation always takes values in [�1, 1]. Ifthe reference point and its nearest neighbor always have the samemark, then pxy ¼ pyx ¼ 0 and S(Xi,Yi) ¼ 1. This corresponds torepulsion or clustering of points by their mark (i.e., points of type xalways occur near each other and never near points of type y andvice-versa). If the reference point and its nearest neighbor alwayshave different marks, then pxx ¼ pyy ¼ 0 which implies that px ¼ pyxand py ¼ pxy so S(Xi,Yi) < 0 with a minimum of �1 if px ¼ py ¼ 1/2.This is the opposite of clustering, indicating that points of differentmarks are attracted to one another.
Mingling index
The mingling index is also based on local neighborhoods of thereference point. It compares the mark of the reference point tothose of its k nearest neighbors, and is calculated by
DMðXi; YiÞ ¼ MkðXi;YiÞ ¼1k
Xj¼1
ni X[¼1
k
I�m�tij�sm
�z[�tij���
(5)
where z[(tij) denotes the [th nearest neighbor of the point tij. Thus,Mk(Xi,Yi) describes the mean fraction of points among the k nearestneighbors with a mark different than that of the reference point.
Themingling index can be thought of as a characterization of themixture of marks and takes on values in [0, 1]. If the reference pointand its k nearest neighbors tend to have the same mark, thenMk(Xi,Yi) has a small value and the process can be viewed assegregated (repulsion between points of different marks). In theopposite case, the mingling index has a large value and the processcan be viewed as mixed (attraction).
In this paper we considered only the nearest neighbor so thatk ¼ 1. Since the process is bivariate, we can estimate M1(Xi,Yi) viathe joint probabilities pxy and pyx used in the estimation of thecoefficient of segregation.
Data
The data considered in this paper comes from an in situ obser-vational study conducted at a large US university in the spring of2013 (Wang et al., 2015). In total 48 undergraduate students withWindows computers voluntarily participated in the study for aseven day period. Browser activities (such as URL requests) wereautomatically logged over a period of 7 days for each student.Participants were instructed to continue using their devices asnormal while being logged.
The event logs from each student were dichotomized by theirmark, or event type. The first mark corresponds to a Facebook event(i.e., any web browser activity occurring on facebook.com includingany clicks or posts). The second mark corresponds to any non-Facebook event (i.e., any web browser activity not occurring onthe aforementioned domain). We dichotomized the data in thismanner to reflect the following type of situation: an individualdeletes all browser-based social media activity from a device ofinterest in a criminal investigation in order to disassociate himselfor herself from that device. The forensic examiner recovers thebrowser logs from that device (e.g., Oh et al., 2011) as well as theFacebook logs stored in the cloud for the individual under inves-tigation (e.g., Roussev and McCulley, 2016). In this hypotheticalsituation the examiner thenwants to determine the likelihood thatboth the cloud-based Facebook events and the device-based non-Facebook events were generated by the same individual.
The event logs from students were included in our analysis ifthey had at least 50 events of each type, to ensure that we wouldhave enough data to accurately estimate the segregation andmingling score functions. Of the 48 students originally recorded,only 28 met the inclusion criteria. These students generated 66,966log records, with 9500 (14.2%) Facebook and 57,466 (85.8%) non-Facebook browser events.
For the purposes of this study the data was de-identified byusing an anonymized ID for each student. The resulting data set wasin the form of < anonymous ID, timestamp, mark > triples, wheremark indicated whether the browser event was related to Facebookor not. The resulting bivariate marked point processes for eachstudent, with marks corresponding to event type, are illustrated inFig. A.1.
Methodology
As discussed earlier, we use indices from marked point processtheory to define the score function D for comparing event streams.This score function is used in turn to generate likelihood ratios thatquantify the strength of evidence for or against the hypothesis thatthe events came from the same source, Hs, relative to the hypoth-esis that they came from different sources, Hd.
The event streams discussed in Section Data can be thought of ascoming from the reference sample and the unidentified sample inthe following manner:
� the reference sample X is a point process of Facebook-onlybrowsing events, obtained from the cloud, and
� the unidentified sample Y is a point process of non-Facebookweb browsing events, obtained from a device of interest.
The score-based likelihood ratio of Equation (3) is then the ratioof (i) the likelihood of observing the score function evaluated withthe Facebook and non-Facebook events under the hypothesis thatthey were generated by the same source to (ii) the same likelihoodunder the hypothesis that theywere generated by different sources.
For some intuition behind choosing the coefficient of segrega-tion and mingling index as score functions, consider the first day of
1 The notion of independent marks in the denominator of Equation (4) simplyrefers to being able factor the joint probabilities pxy and pyx into the product of theirmarginals, so that under this assumption pxy ¼ pxp,y and pyx ¼ pyp,x.
C. Galbraith, P. Smyth / Digital Investigation 22 (2017) S106eS114 S109
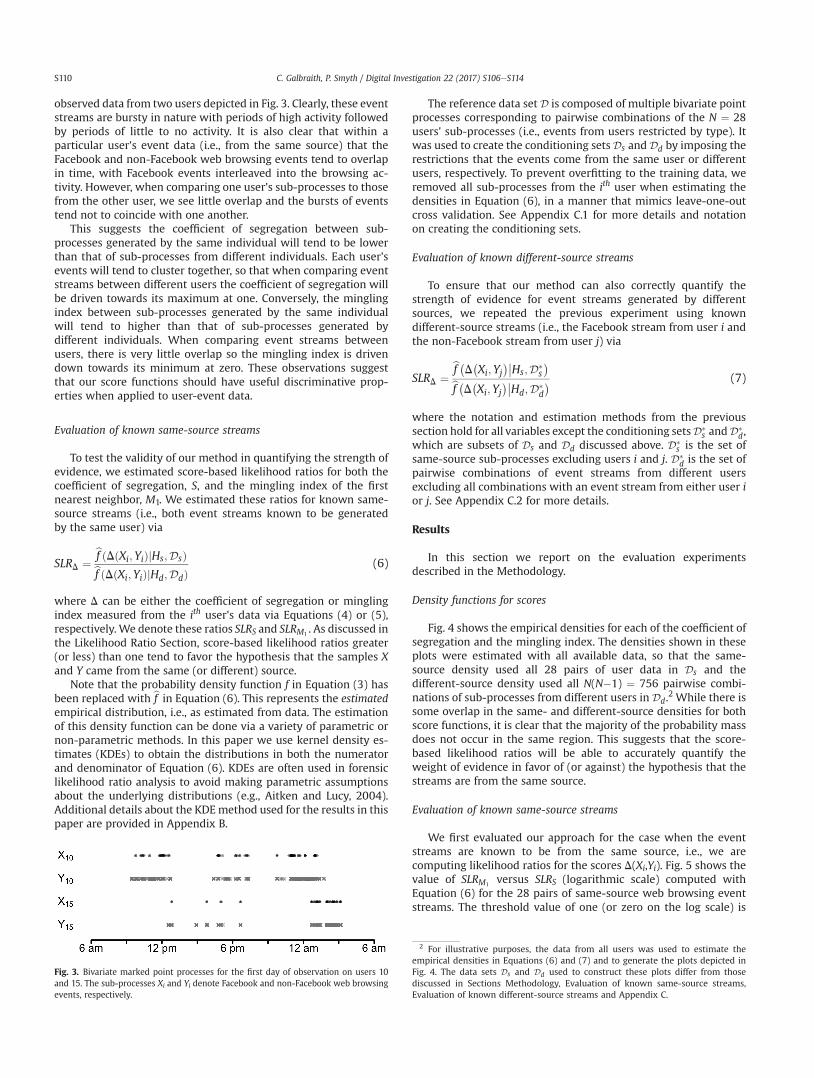
observed data from two users depicted in Fig. 3. Clearly, these eventstreams are bursty in nature with periods of high activity followedby periods of little to no activity. It is also clear that within aparticular user's event data (i.e., from the same source) that theFacebook and non-Facebook web browsing events tend to overlapin time, with Facebook events interleaved into the browsing ac-tivity. However, when comparing one user's sub-processes to thosefrom the other user, we see little overlap and the bursts of eventstend not to coincide with one another.
This suggests the coefficient of segregation between sub-processes generated by the same individual will tend to be lowerthan that of sub-processes from different individuals. Each user'sevents will tend to cluster together, so that when comparing eventstreams between different users the coefficient of segregation willbe driven towards its maximum at one. Conversely, the minglingindex between sub-processes generated by the same individualwill tend to higher than that of sub-processes generated bydifferent individuals. When comparing event streams betweenusers, there is very little overlap so the mingling index is drivendown towards its minimum at zero. These observations suggestthat our score functions should have useful discriminative prop-erties when applied to user-event data.
Evaluation of known same-source streams
To test the validity of our method in quantifying the strength ofevidence, we estimated score-based likelihood ratios for both thecoefficient of segregation, S, and the mingling index of the firstnearest neighbor, M1. We estimated these ratios for known same-source streams (i.e., both event streams known to be generatedby the same user) via
SLRD ¼bf ðDðXi; YiÞjHs;DsÞbf ðDðXi; YiÞjHd;DdÞ
(6)
where D can be either the coefficient of segregation or minglingindex measured from the ith user's data via Equations (4) or (5),respectively. We denote these ratios SLRS and SLRM1
. As discussed inthe Likelihood Ratio Section, score-based likelihood ratios greater(or less) than one tend to favor the hypothesis that the samples Xand Y came from the same (or different) source.
Note that the probability density function f in Equation (3) hasbeen replaced with bf in Equation (6). This represents the estimatedempirical distribution, i.e., as estimated from data. The estimationof this density function can be done via a variety of parametric ornon-parametric methods. In this paper we use kernel density es-timates (KDEs) to obtain the distributions in both the numeratorand denominator of Equation (6). KDEs are often used in forensiclikelihood ratio analysis to avoid making parametric assumptionsabout the underlying distributions (e.g., Aitken and Lucy, 2004).Additional details about the KDEmethod used for the results in thispaper are provided in Appendix B.
The reference data set D is composed of multiple bivariate pointprocesses corresponding to pairwise combinations of the N ¼ 28users' sub-processes (i.e., events from users restricted by type). Itwas used to create the conditioning setsDs andDd by imposing therestrictions that the events come from the same user or differentusers, respectively. To prevent overfitting to the training data, weremoved all sub-processes from the ith user when estimating thedensities in Equation (6), in a manner that mimics leave-one-outcross validation. See Appendix C.1 for more details and notationon creating the conditioning sets.
Evaluation of known different-source streams
To ensure that our method can also correctly quantify thestrength of evidence for event streams generated by differentsources, we repeated the previous experiment using knowndifferent-source streams (i.e., the Facebook stream from user i andthe non-Facebook stream from user j) via
SLRD ¼bf �D�Xi;Yj
���Hs;D�s�
bf �D�Xi; Yj���Hd;D�
d
� (7)
where the notation and estimation methods from the previoussection hold for all variables except the conditioning setsD�
s andD�d,
which are subsets of Ds and Dd discussed above. D�s is the set of
same-source sub-processes excluding users i and j. D�d is the set of
pairwise combinations of event streams from different usersexcluding all combinations with an event stream from either user ior j. See Appendix C.2 for more details.
Results
In this section we report on the evaluation experimentsdescribed in the Methodology.
Density functions for scores
Fig. 4 shows the empirical densities for each of the coefficient ofsegregation and the mingling index. The densities shown in theseplots were estimated with all available data, so that the same-source density used all 28 pairs of user data in Ds and thedifferent-source density used all N(N�1) ¼ 756 pairwise combi-nations of sub-processes from different users in Dd.
2 While there issome overlap in the same- and different-source densities for bothscore functions, it is clear that the majority of the probability massdoes not occur in the same region. This suggests that the score-based likelihood ratios will be able to accurately quantify theweight of evidence in favor of (or against) the hypothesis that thestreams are from the same source.
Evaluation of known same-source streams
We first evaluated our approach for the case when the eventstreams are known to be from the same source, i.e., we arecomputing likelihood ratios for the scores D(Xi,Yi). Fig. 5 shows thevalue of SLRM1
versus SLRS (logarithmic scale) computed withEquation (6) for the 28 pairs of same-source web browsing eventstreams. The threshold value of one (or zero on the log scale) is
Fig. 3. Bivariate marked point processes for the first day of observation on users 10and 15. The sub-processes Xi and Yi denote Facebook and non-Facebook web browsingevents, respectively.
2 For illustrative purposes, the data from all users was used to estimate theempirical densities in Equations (6) and (7) and to generate the plots depicted inFig. 4. The data sets Ds and Dd used to construct these plots differ from thosediscussed in Sections Methodology, Evaluation of known same-source streams,Evaluation of known different-source streams and Appendix C.
C. Galbraith, P. Smyth / Digital Investigation 22 (2017) S106eS114S110

shown by the dashed lines. Table 1 presents the counts of thenumber of bivariate processes whose score-based likelihood ratioslie on either side of the threshold. It should be noted that therewere 11 processes with at least one infinite value for SLRS or SLRM1
.This occurs when the likelihood of the score function evaluated atD(Xi,Yi) under the hypothesis that the event streams came fromdifferent sources is numerically zero and indicates very strongsupport for the hypothesis that the event streams originated fromthe same source.
It is clear that the coefficient of segregation was more discrim-inative than the mingling index, with SLRS correctly quantifying theweight of evidence in 26 of the 28 (93%) known same-source pairs.
SLRM1 was only able to correctly quantify 21 (75%) such pairs, all ofwhich were also captured by SLRS.
Of particular interest are the two bivariate processes (i.e., eventstreams for two users) for which both score-based likelihood ratiosfail to support the same-source hypothesis, i.e., the likelihood ratiosof both scores are less than one. These cases exhibit a unifyingtraitdthey fall in the first quantile of the number of Facebook webbrowsing events per user (they each have less than 132 events ofthis type, compared to the median of 220 events per user). Thesparse nature of their Facebook event data increases the coefficientof segregation and decreases the mingling index. A brief look atFig. 4 explains why the likelihood ratios are less than the thresholdvalues. Their score values fall in the right tail of Fig. 4a and the lefttail of Fig. 4b where the same-source density is lower than thedifferent-source density.
Evaluation of known different-source streams
We then evaluated our approach when the event streams areknown to be from different sources, i.e., we are computing likeli-hood ratios for the scores D(Xi,Yj). Fig. 6 shows the value of SLRM1
versus SLRS (logarithmic scale) computed with Equation (7) for the756 pairwise combinations of different-source web browsing eventstreams. The threshold value of one (or zero on the log scale) isshown by the dashed lines. Table 2 presents the counts of the
Fig. 4. Empirical distribution of the score functions under each hypothesis. Same-source density (Hs, dashed line) and different-source density (Hd, solid line) approximated viakernel density estimates with Gaussian kernels. Note that data from all of the users was used here for illustrative purposesdthe densities depicted here differ from those used toevaluate our method (which used leave-one-out cross-validation). (a) Coefficient of segregation with bandwidths of 0.110 (Hs) and 0.025 (Hd). (b) Mingling index with k ¼ 1 andbandwidths of 0.065 (Hs) and 0.009 (Hd).
Fig. 5. Scatterplot of SLRD, D2{S,M1}, for the 28 pairs of same-source web browsingevent streams calculated via Equation (6) on logarithmic scale. Note the break in eachaxis to show the 11 processes with at least one infinite value for SLRS or SLRM1
.
Table 1Counts of themeasurement of the strength of evidence in known same-source pairs.Positives (þ, SLRD > 1) and negatives (�, SLRD < 1) indicate that SLRD favored thehypothesis that the streams are from the same source or different sources, respec-tively. SLRS incorrectly quantified 2 of the 28 (7%) known matches.
SLRM1Total
� þSLRS � 2 0 2
þ 5 21 26Total 7 21 28
Fig. 6. Scatterplot of SLRD, D2{S,M1}, for the 756 pairwise combinations of different-source web browsing event streams calculated via Equation (7) on logarithmic scale.
C. Galbraith, P. Smyth / Digital Investigation 22 (2017) S106eS114 S111
number of bivariate processes whose score-based likelihood ratioslie on either side of the threshold.
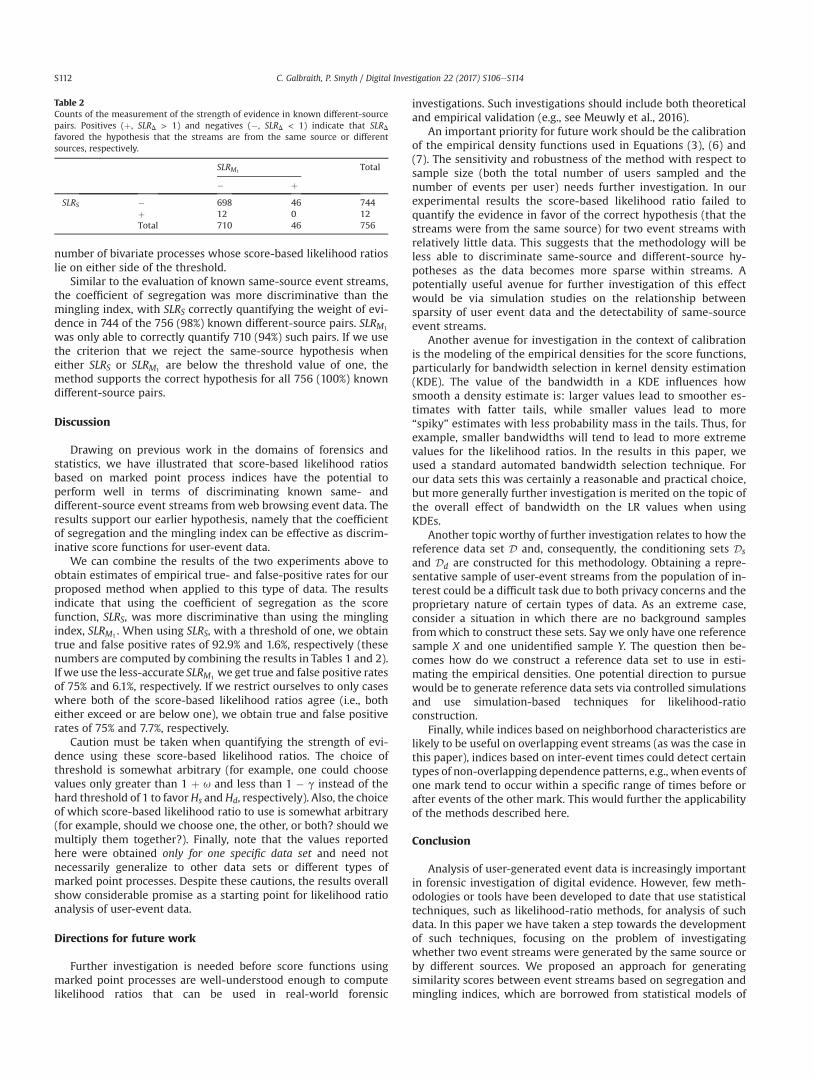
Similar to the evaluation of known same-source event streams,the coefficient of segregation was more discriminative than themingling index, with SLRS correctly quantifying the weight of evi-dence in 744 of the 756 (98%) known different-source pairs. SLRM1
was only able to correctly quantify 710 (94%) such pairs. If we usethe criterion that we reject the same-source hypothesis wheneither SLRS or SLRM1
are below the threshold value of one, themethod supports the correct hypothesis for all 756 (100%) knowndifferent-source pairs.
Discussion
Drawing on previous work in the domains of forensics andstatistics, we have illustrated that score-based likelihood ratiosbased on marked point process indices have the potential toperform well in terms of discriminating known same- anddifferent-source event streams from web browsing event data. Theresults support our earlier hypothesis, namely that the coefficientof segregation and the mingling index can be effective as discrim-inative score functions for user-event data.
We can combine the results of the two experiments above toobtain estimates of empirical true- and false-positive rates for ourproposed method when applied to this type of data. The resultsindicate that using the coefficient of segregation as the scorefunction, SLRS, was more discriminative than using the minglingindex, SLRM1
. When using SLRS, with a threshold of one, we obtaintrue and false positive rates of 92.9% and 1.6%, respectively (thesenumbers are computed by combining the results in Tables 1 and 2).If we use the less-accurate SLRM1
we get true and false positive ratesof 75% and 6.1%, respectively. If we restrict ourselves to only caseswhere both of the score-based likelihood ratios agree (i.e., botheither exceed or are below one), we obtain true and false positiverates of 75% and 7.7%, respectively.
Caution must be taken when quantifying the strength of evi-dence using these score-based likelihood ratios. The choice ofthreshold is somewhat arbitrary (for example, one could choosevalues only greater than 1 þ u and less than 1 � g instead of thehard threshold of 1 to favorHs andHd, respectively). Also, the choiceof which score-based likelihood ratio to use is somewhat arbitrary(for example, should we choose one, the other, or both? should wemultiply them together?). Finally, note that the values reportedhere were obtained only for one specific data set and need notnecessarily generalize to other data sets or different types ofmarked point processes. Despite these cautions, the results overallshow considerable promise as a starting point for likelihood ratioanalysis of user-event data.
Directions for future work
Further investigation is needed before score functions usingmarked point processes are well-understood enough to computelikelihood ratios that can be used in real-world forensic
investigations. Such investigations should include both theoreticaland empirical validation (e.g., see Meuwly et al., 2016).
An important priority for future work should be the calibrationof the empirical density functions used in Equations (3), (6) and(7). The sensitivity and robustness of the method with respect tosample size (both the total number of users sampled and thenumber of events per user) needs further investigation. In ourexperimental results the score-based likelihood ratio failed toquantify the evidence in favor of the correct hypothesis (that thestreams were from the same source) for two event streams withrelatively little data. This suggests that the methodology will beless able to discriminate same-source and different-source hy-potheses as the data becomes more sparse within streams. Apotentially useful avenue for further investigation of this effectwould be via simulation studies on the relationship betweensparsity of user event data and the detectability of same-sourceevent streams.
Another avenue for investigation in the context of calibrationis the modeling of the empirical densities for the score functions,particularly for bandwidth selection in kernel density estimation(KDE). The value of the bandwidth in a KDE influences howsmooth a density estimate is: larger values lead to smoother es-timates with fatter tails, while smaller values lead to more“spiky” estimates with less probability mass in the tails. Thus, forexample, smaller bandwidths will tend to lead to more extremevalues for the likelihood ratios. In the results in this paper, weused a standard automated bandwidth selection technique. Forour data sets this was certainly a reasonable and practical choice,but more generally further investigation is merited on the topic ofthe overall effect of bandwidth on the LR values when usingKDEs.
Another topic worthy of further investigation relates to how thereference data set D and, consequently, the conditioning sets Ds
and Dd are constructed for this methodology. Obtaining a repre-sentative sample of user-event streams from the population of in-terest could be a difficult task due to both privacy concerns and theproprietary nature of certain types of data. As an extreme case,consider a situation in which there are no background samplesfromwhich to construct these sets. Say we only have one referencesample X and one unidentified sample Y. The question then be-comes how do we construct a reference data set to use in esti-mating the empirical densities. One potential direction to pursuewould be to generate reference data sets via controlled simulationsand use simulation-based techniques for likelihood-ratioconstruction.
Finally, while indices based on neighborhood characteristics arelikely to be useful on overlapping event streams (as was the case inthis paper), indices based on inter-event times could detect certaintypes of non-overlapping dependence patterns, e.g., when events ofone mark tend to occur within a specific range of times before orafter events of the other mark. This would further the applicabilityof the methods described here.
Conclusion
Analysis of user-generated event data is increasingly importantin forensic investigation of digital evidence. However, few meth-odologies or tools have been developed to date that use statisticaltechniques, such as likelihood-ratio methods, for analysis of suchdata. In this paper we have taken a step towards the developmentof such techniques, focusing on the problem of investigatingwhether two event streams were generated by the same source orby different sources. We proposed an approach for generatingsimilarity scores between event streams based on segregation andmingling indices, which are borrowed from statistical models of
Table 2Counts of the measurement of the strength of evidence in known different-sourcepairs. Positives (þ, SLRD > 1) and negatives (�, SLRD < 1) indicate that SLRDfavored the hypothesis that the streams are from the same source or differentsources, respectively.
SLRM1Total
� þSLRS � 698 46 744
þ 12 0 12Total 710 46 756
C. Galbraith, P. Smyth / Digital Investigation 22 (2017) S106eS114S112
marked point processes. Experimental results, based on analysis ofreal-world browser event streams from 28 individuals, indicatethat the proposed methodology provides a useful starting point fordiscriminating between same-source and different-source pairs.Potential future directions that can build on these results includedevelopment of accurate calibration methods, analysis of sensi-tivity and robustness of the methodology, characterization of theproperties of a broader range scores and indices, and additionalexperimental validation of the methods using both simulated andreal-world data sets.
Acknowledgements
This research was partially funded through Cooperative Agree-ment #70NANB15H176 between the National Institute of Standardsand Technology and Iowa State University, which includes activitiescarried out at Carnegie Mellon University, University of California,Irvine, and University of Virginia; and was also supported in partthe National Science Foundation under grant number IIS-1320527and by a Google Faculty Award (to PS).
The authors would like to acknowledge the contributions of HalStern for useful discussions related to the work in this paper. Theauthors would also like to thank the reviewers for their usefulfeedback on the original version of this paper.
Appendix A. Data
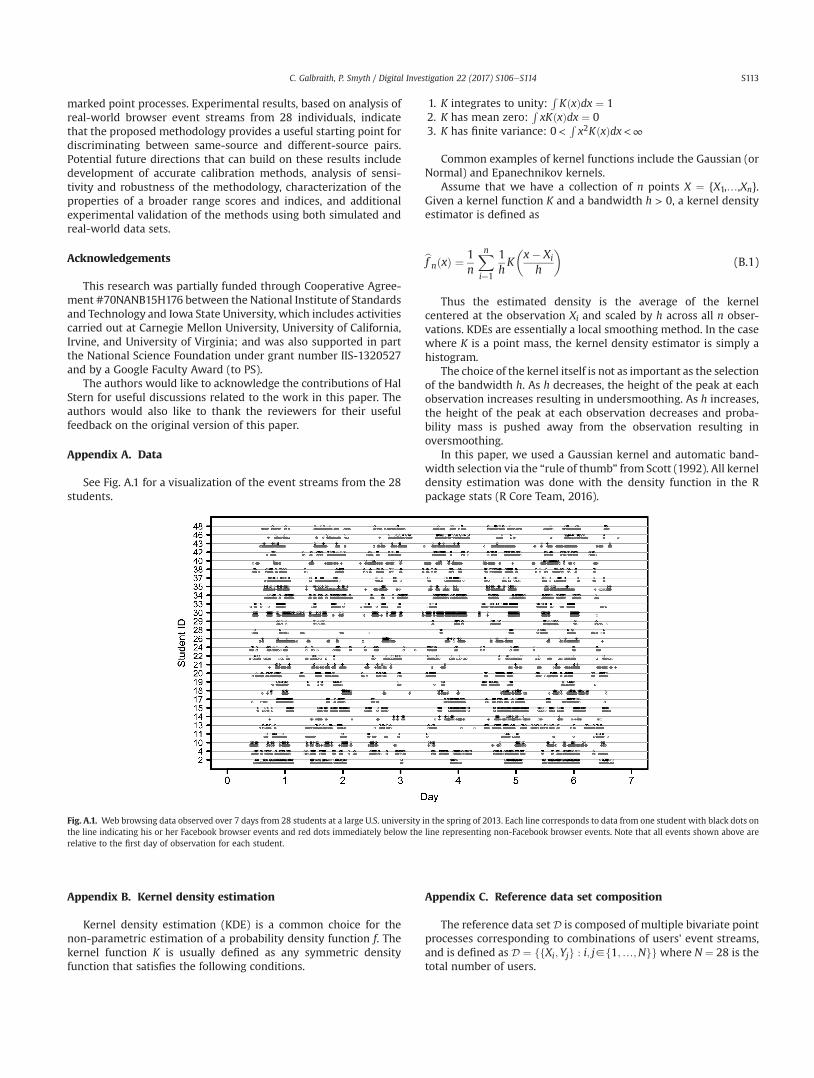
See Fig. A.1 for a visualization of the event streams from the 28students.
Appendix B. Kernel density estimation
Kernel density estimation (KDE) is a common choice for thenon-parametric estimation of a probability density function f. Thekernel function K is usually defined as any symmetric densityfunction that satisfies the following conditions.
1. K integrates to unity:RKðxÞdx ¼ 1
2. K has mean zero:RxKðxÞdx ¼ 0
3. K has finite variance: 0<Rx2KðxÞdx<∞
Common examples of kernel functions include the Gaussian (orNormal) and Epanechnikov kernels.
Assume that we have a collection of n points X ¼ {X1,…,Xn}.Given a kernel function K and a bandwidth h > 0, a kernel densityestimator is defined as
bf nðxÞ ¼ 1n
Xni¼1
1hK�x� Xi
h
(B.1)
Thus the estimated density is the average of the kernelcentered at the observation Xi and scaled by h across all n obser-vations. KDEs are essentially a local smoothing method. In the casewhere K is a point mass, the kernel density estimator is simply ahistogram.
The choice of the kernel itself is not as important as the selectionof the bandwidth h. As h decreases, the height of the peak at eachobservation increases resulting in undersmoothing. As h increases,the height of the peak at each observation decreases and proba-bility mass is pushed away from the observation resulting inoversmoothing.
In this paper, we used a Gaussian kernel and automatic band-width selection via the “rule of thumb” from Scott (1992). All kerneldensity estimation was done with the density function in the Rpackage stats (R Core Team, 2016).
Appendix C. Reference data set composition
The reference data set D is composed of multiple bivariate pointprocesses corresponding to combinations of users' event streams,and is defined as D ¼ ffXi;Yjg : i; j2f1;…;Ngg where N ¼ 28 is thetotal number of users.
Fig. A.1. Web browsing data observed over 7 days from 28 students at a large U.S. university in the spring of 2013. Each line corresponds to data from one student with black dots onthe line indicating his or her Facebook browser events and red dots immediately below the line representing non-Facebook browser events. Note that all events shown above arerelative to the first day of observation for each student.
C. Galbraith, P. Smyth / Digital Investigation 22 (2017) S106eS114 S113
Appendix C.1. Known same-source streams
The set D was used to create the conditioning sets Ds andDd by imposing some restrictions. The set of event streamscoming from the same source excluding user i is Ds ¼ffXj;Yjg : j2f1;…;Ng; jsig, so that the probability density in thenumerator of Equation (6) is estimated with the scores from theother N�1 ¼ 27 users' bivariate processes. The set of eventstreams coming from different sources excluding user i isDd ¼ ffXj;Ykg : j; k2f1;…;Ng; jsksig, so that the denominator ofEquation (6) is estimated with the scores from the other(N�1)(N�2) ¼ 27 � 26 pairwise combinations of the remainingusers' sub-processes.
Appendix C.2. Known different-source streams
The conditioning sets for this experiment are subsets of thosedescribed above, so that D�
s3Ds and D�d3Dd. Here, the set of event
streams coming from the same source excludes both users i and j,and is denoted D�
s ¼ ffXk;Ykg : k2f1;…;Ng; ksisjg. In thismanner the probability density in the numerator of Equation (7) isestimated with the scores from the other N�2 ¼ 26 users' bivariateprocesses. The set of event streams coming from differentsources excludes all bivariate processes containing a sub-process from either user i or j, and is denotedD�
d ¼ ffXk;Y[g : k; [2f1;…;Ng; ks[sisjg, so that the denomina-tor of Equation (7) is estimated with the scores from the other(N�2)(N�3) ¼ 26 � 25 pairwise combinations of the remainingusers' sub-processes.
References
Aitken, C.G., Lucy, D., 2004. Evaluation of trace evidence in the form of multivariatedata. J. R. Stat. Soc. Ser. C Appl. Stat. 53 (1), 109e122.
Bolck, A., Ni, H., Lopatka, M., 2015. Evaluating score- and feature-based likelihoodratio models for multivariate continuous data: applied to forensic MDMAcomparison. Law Probab. Risk 14 (3), 243e266.
Buchholz, F.P., Falk, C., 2005. Design and implementation of Zeitline: a forensictimeline editor. In: DFRWS.
Casey, E., 2011. Digital Evidence and Computer Crime: Forensic Science, Computers,and the Internet. Academic Press.
Eagle, N., Pentland, A.S., Lazer, D., 2009. Inferring friendship network structure byusing mobile phone data. Proc. Natl. Acad. Sci. 106 (36), 15274e15278.
Foreman, L., Champod, C., Evett, I., Lambert, J., Pope, S., 2003. Interpreting DNA
evidence: a review. Int. Stat. Rev. 71 (3), 473e495.Gonzalez-Rodriguez, J., Drygajlo, A., Ramos-Castro, D., Garcia-Gomar, M., Ortega-
Garcia, J., 2006. Robust estimation, interpretation and assessment of likelihoodratios in forensic speaker recognition. Comput. Speech Lang. 20 (2), 331e355.
Gresty, D.W., Gan, D., Loukas, G., Ierotheou, C., 2016. Facilitating forensic exami-nations of multi-user computer environments through session-to-sessionanalysis of internet history. Digit. Investig. 16, S124eS133.
Grier, J., 2011. Detecting data theft using stochastic forensics. Digit. Investig. 8, S71eS77.Hanisch, K., 1984. Some remarks on estimators of the distribution function of nearest
neighbour distance in stationary spatial point processes. Ser. Stat. 15 (3), 409e412.Illian, J., Penttinen, A., Stoyan, H., Stoyan, D., 2008. Statistical Analysis and Modelling
of Spatial Point Patterns. John Wiley & Sons Ltd, West Sussex, England.Ishihara, S., 2011. A forensic authorship classification in SMS messages: a likelihood
ratio based approach using n-gram. In: Proc. of the Australasian LanguageTechnology Association Workshop 2011, pp. 47e56.
Kiernan, J., Terzi, E., 2009. Constructing comprehensive summaries of large eventsequences. ACM Trans. Knowl. Discov. Data 3 (4), 21.
Kirchler, M., Herrmann, D., Lindemann, J., Kloft, M., 2016. Tracked without a trace:linking sessions of users by unsupervised learning of patterns in their DNStraffic. In: Proceedings of the 2016 ACM Workshop on Artificial Intelligence andSecurity. ACM, pp. 23e34.
Koven, J., Bertini, E., Dubois, L., Memon, N., 2016. Invest: intelligent visual emailsearch and triage. Digit. Investig. 18, S138eS148.
Meuwly, D., Ramos, D., Haraksim, R., 2016. A guideline for the validation of likeli-hood ratio methods used for forensic evidence evaluation. Forensic Sci. Int. 276,142e153.
Neumann, C., Champod, C., Puch-Solis, R., Egli, N., Anthonioz, A., Bromage-Griffiths, A., 2007. Computation of likelihood ratios in fingerprint identifica-tion for configurations of any number of minutiae. J. Forensic Sci. 52 (1),54e64.
Oh, J., Lee, S., Lee, S., 2011. Advanced evidence collection and analysis of webbrowser activity. Digit. Investig. 8, S62eS70.
Overill, R.E., Silomon, J.A., 2010. Digital meta-forensics: quantifying the investiga-tion. In: Proc. 4th International Conference on Cybercrime Forensics Education& Training (CFET 2010), Canterbury, UK (September 2010).
Pereira, M.T., 2009. Forensic analysis of the Firefox 3 Internet history and recoveryof deleted SQLite records. Digit. Investig. 5 (3), 93e103.
Pielou, E., 1977. Mathematical Ecology. John Wiley & Sons, Inc.R Core Team, 2016. R: a Language and Environment for Statistical Computing. R
Foundation for Statistical Computing, Vienna, Austria. https://www.R-project.org/.
Roussev, V., 2016. Digital forensic science: issues, methods, and challenges. Syn-thesis lectures on information security. Priv. Trust 8 (5), 1e155.
Roussev, V., McCulley, S., 2016. Forensic analysis of cloud-native artifacts. Digit.Investig. 16, S104eS113.
Schlapbach, A., Bunke, H., 2007. A writer identification and verification systemusing HMM based recognizers. Pattern Anal. Appl. 10 (1), 33e43.
Scott, D.W., 1992. Multivariate Density Estimation: Theory, Practice, and Visuali-zation. Wiley.
Wang, Y., Niiya, M., Mark, G., Reich, S., Warschauer, M., 2015. Coming of age (digi-tally): an ecological view of social media use among college students. In: Pro-ceedings of the 18th ACM Conference on Computer Supported CooperativeWork & Social Computing, pp. 571e582.
C. Galbraith, P. Smyth / Digital Investigation 22 (2017) S106eS114S114