
ANALYZING THE USE OF GASEOUS HELIUM AS A ... THE USE OF GASEOUS HELIUM AS A PRESSURANT WITH...
24
ANALYZING THE USE OF GASEOUS HELIUM AS A PRESSURANT WITH CRYOGENIC PROPELLANTS WITH THERMODYNAMIC VENTING SYSTEM MODELLING AND TEST DATA A. Hedayat, S.L. Nelson NASA-Marshall Space Flight Center, MSFC, AL L. J. Hastings Alpha Technology Inc., Huntsville, AL R.H. Flachbart, D. J. Vermilion, S.P. Tucker NASA-Marshall Space Flight Center, MSFC, AL ABSTRACT Cryogens are viable candidate propellants for NASA's Lunar and Mars exploration programs. To provide adequate mass flow to the system's engines and/or to prevent feed system cavitation, gaseous helium (GHe) is frequently considered as a pressurant. During low gravity operations, a Thermodynamic Venting System (TVS) is designed to maintain tank pressure during low gravity operations without propellant resettling. Therefore, a series of tests were conducted in the Multi-purpose Hydrogen Test Bed (MHTB) of Marshall Space Flight Center (MSFC) in order to evaluate the effects of GHe pressurant on pressure control performance of a TVS with liquid hydrogen (LH 2 ) and nitrogen (LN2) as the test liquids. The TVS used in these test series consists of a` recirculation pump, Joule-Thomson (J-T) expansion valve, and a parallel flow concentric tube heat exchanger combined with a longitudinal spray bar. Using a small amount of liquid extracted from the tank recirculation line, passing it through the J-T valve, and then through the heat exchanger, thermal energy is extracted from the bulk liquid and ullage thereby enabling pressure control. The LH2/GHe tests were performed at fill levels of 90%, 50%, and 25% and LN2 /GHe tests were conducted at fill levels of 50% and 25%. Moreover, each test was conducted with a specified tank ullage pressure control band. A one-dimensional TVS performance program was used to analyze and correlate the test data. Predictions and comparisons with test data of ullage pressure and temperature and bulk liquid saturation pressure and temperature with test data are presented. KEYWORDS: cryogenic, pressurant, liquid nitrogen, liquid hydrogen, heat transfer, data analysis INTRODUCTION By maintaining the ullage pressure within a specified control band, the pressurization system provides the required propellant flowrate and thermodynamic state to the engine 1 https://ntrs.nasa.gov/search.jsp?R=20090028643 2018-05-18T11:52:03+00:00Z
Transcript of ANALYZING THE USE OF GASEOUS HELIUM AS A ... THE USE OF GASEOUS HELIUM AS A PRESSURANT WITH...

ANALYZING THE USE OF GASEOUS HELIUM AS A PRESSURANT WITHCRYOGENIC PROPELLANTS WITH THERMODYNAMIC
VENTING SYSTEM MODELLING AND TEST DATA
A. Hedayat, S.L. NelsonNASA-Marshall Space Flight Center, MSFC, AL
L. J. HastingsAlpha Technology Inc., Huntsville, AL
R.H. Flachbart, D. J. Vermilion, S.P. TuckerNASA-Marshall Space Flight Center, MSFC, AL
ABSTRACT
Cryogens are viable candidate propellants for NASA's Lunar and Mars explorationprograms. To provide adequate mass flow to the system's engines and/or to prevent feedsystem cavitation, gaseous helium (GHe) is frequently considered as a pressurant. Duringlow gravity operations, a Thermodynamic Venting System (TVS) is designed to maintaintank pressure during low gravity operations without propellant resettling. Therefore, aseries of tests were conducted in the Multi-purpose Hydrogen Test Bed (MHTB) ofMarshall Space Flight Center (MSFC) in order to evaluate the effects of GHe pressuranton pressure control performance of a TVS with liquid hydrogen (LH2) and nitrogen (LN2)as the test liquids. The TVS used in these test series consists of a` recirculation pump,Joule-Thomson (J-T) expansion valve, and a parallel flow concentric tube heat exchangercombined with a longitudinal spray bar. Using a small amount of liquid extracted fromthe tank recirculation line, passing it through the J-T valve, and then through the heatexchanger, thermal energy is extracted from the bulk liquid and ullage thereby enablingpressure control. The LH2/GHe tests were performed at fill levels of 90%, 50%, and 25%and LN2/GHe tests were conducted at fill levels of 50% and 25%. Moreover, each testwas conducted with a specified tank ullage pressure control band. A one-dimensionalTVS performance program was used to analyze and correlate the test data. Predictionsand comparisons with test data of ullage pressure and temperature and bulk liquidsaturation pressure and temperature with test data are presented.
KEYWORDS: cryogenic, pressurant, liquid nitrogen, liquid hydrogen, heat transfer, dataanalysis
INTRODUCTION
By maintaining the ullage pressure within a specified control band, the pressurizationsystem provides the required propellant flowrate and thermodynamic state to the engine
1
https://ntrs.nasa.gov/search.jsp?R=20090028643 2018-05-18T11:52:03+00:00Z

in order to prevent cavitation. In addition, the development of efficient advancedcryogenic upper stages and manned vehicles requires the maintaining of tank pressurecontrol while minimizing propellant boil-off which poses significant challengesassociated with the storage of cryogens in the near zero gravity environment of space.Traditionally auxiliary thrusters are used to settle the propellants in order to accomplishtank pressure control through venting. However, such systems incur weight penalties(associated with the propellant and hardware required) that increase with the number ofsettling sequences required during the mission. In addition, tank venting/resettling maybecome necessary at inopportune times in a mission timeline and thereby increasemission complexity. The TVS concept enables tank pressure control through ventingwithout resettling.
The feasibility of the spray-bar TVS concept application was investigated and validated atNASA-MSFC by conducting a series of successful tests [1-3]. In the earlier test series;the ullage was only comprised of the propellant vapor. To evaluate the effect of a non-condensable pressureant gas such as GHe on the TVS performance, tests with GHe in theullage were conducted with LN2 and LH2 [4, 5]. An overview of the spray-bar TVSconcept is presented in the following section.
Thermodynamic. Venting System (TVS) Concept
Originally, the spray-bar TVS concept was introduced for LH2 applications [1, 5].The TVS, as shown in Figure 1, consist of a recirculation pump, a Joule-Thomson (J-T)expansion/shutoff valve, and a parallel flow concentric tube heat exchanger/spray-barapparatus. The pump extracts liquid propellant from the tank and flows it through the heatexchanger/spray bar apparatus. The fluid re-enters the tank through orifices in the spraybar that expel the fluid radially into the tank. This results in propellant destratification andullage condensation through mixing. When pressure control within the tank cannot bemaintained through mixing alone (bulk liquid is saturated at the ullage pressure), a smallamount of fluid extracted from the recirculation flow is passed through the J-T valvewhere it is expanded to a lower pressure and temperature. The subcooled two-phase fluidmixture is then passed through the heat exchanger, which extracts heat from therecirculation flow, and subsequently is vented to the environment. Details of spray-barTVS hardware development effort are provided by Lak and Wood [6].
To adapt the system for LN2 testing, several modifications were made to theoriginal TVS components and configuration. The recirculation pump and J-T valve werereplaced to accommodate the much higher mass flow rate required for LN2 test series.The original composite MHTB legs were replaced with stainless steel legs which couldsupport a full tank of LN2 . Due to much larger mass of stored LN2, compared to LH2,stored in the MHTB, two graphite heaters were installed in the bottom of the tank,thereby delivering a specified quantity of energy into the bulk .liquid and accelerating thethermodynamic state changes.

TVS TEST SETUP AND PROCEDURES
All Tests were conducted at the MSFC East Test Area thermal vacuum facility,Test Stand 300. The facility systems, in combination with the MHTB's shroud, enabledsimulation of on orbit thermal and vacuum conditions. For LN 2 tests, to accelerate thetesting, the heaters were turned on. For each test series, a boiloff test was performed inorder to determine the ambient heat leak and heater input into the MHTB. For LN2testing, an additional boil-off test with the graphite heaters turned on was conducted inorder to measure the total heat leak from ambient sources and the heaters. For each tankfill level, after the boil-off testing was completed, the tank was locked up and allowed toself-pressurize until the ullage pressure attained the maximum tank pressure set point.Upon reaching this pressure, depending on the propellant tested and fill level, the pumpor the pump/JT combination were used to reduce the pressure to the minimum tankpressure set point. At this point the pump and/or pump and the J-T valve was/were turnedoff, the tank was allowed to self-pressurize. The automated operation of the TVScontinued with a specified control band according control algorithms established for thetwo test series described in the references [4, 5]. For TVS operation with GHepressurant, GHe was injected into the ullage until the total ullage pressure reached theminimum tank pressure set point for GHe operation. Again, the automated operation ofthe TVS maintained the ullage pressure within the specified control band according thecontrol algorithm.
MODEL OVERVIEW
The TVS. code is based, on a transient one-dimensional analytical model and wasformulated to characterize the TVS performance. The TVS performance formulation iscomprised of four combined thermal-fluid models including the heat exchanger, the spraymanifold and injector tubes, the recirculation pump, and the tank. The heat exchangermodel calculates the quality and two-phase pressure loss at the vent exit. The spraymanifold and injection tube model determines the pressure drops within the manifold andtubes along with the spray flow rates and velocities leaving the injection orifices. Therecirculation pump model calculates the pump head increase from the pump speed andthe . head coefficient curve provided by the pump manufacturer. The tank model is alumped node model consisting of four control volumes: the ullage, the tank wall, the tankwall liquid, and the bulk liquid. The ullage is comprised of two species, the propellantvapor and a non-condensable gas, GHe. A detailed description of the TVS analyticalmodel is given by Nguyen [7].
The TVS performance program originally was developed to analyze LH 2 MHTBspray-bar TVS configuration. To utilize the TVS program for the LN 2 application, theoriginal code was modified by incorporating LN2/GN2 properties and LN2 pump and J-Tvalve characteristics. Also, the tank model was modified by adding an additional heatsource term, representing heater input and heat transfer through the new stainless steellegs, to the bulk liquid control volume. Therefore, the total heat source represented the
3

energy received by the bulk liquid via environmental heat leaks, heaters, and heat transferthrough the MHTB's legs. The details of TVS analytical model are not provided here,since the major thrust of the paper is to address correlation of this analytical model/codewith the MHTB test data.
RESULTS AND DISCUSSIONS
The LN2/GHe and LH2/GHe test series were conducted in 2004 and 2005, respectively.For LN2/GHe testing heaters were installed in the lower section of the tank. For each testseries, first the boil-off testing was conducted,'then one or more TVS tests (depending onthe propellant tested) were conducted with single specie ullage, then GHe was injectedand TVS tests resumed with two species ullage. In this paper, only the analysis and testdata correlation of test series were reviewed. Details of each test series are given byFlachbart et al. [4, 51. The TVS model predicted ullage pressure and temperature and bulkliquid saturation pressure and temperature were compared with the test data. Themodeling and data correlation for each test series were reviewed in the followingsections.
LN2/GHe Test Series
The LN2/GHe tests were conducted at 50% and 25% fill levels. As determined by boil-offtesting, the total heat input was measured from boiloff tests. For each test, the total heatinput into the system (environmental heat leaks + heat via legs + heat added by heaters)was measured to be 450 W. After the tank was locked up and completion of the GHeinjection process, the ullage pressure increased steadily until reaching a specifiedmaximum set point; then, both the pump and J-T were turned on. The pump and 7-Tvalve were operated at nearly constant mass flow rates of about 1.5 kg/s and 0.025 kg/s,respectively. As the ullage pressure was reduced to the specified minimum set point, thepump and the J-T were turned off. In the following sections, detailed model predictionsand comparisons for each test were discussed.
LN2/GHe, 50% Fill Level Test
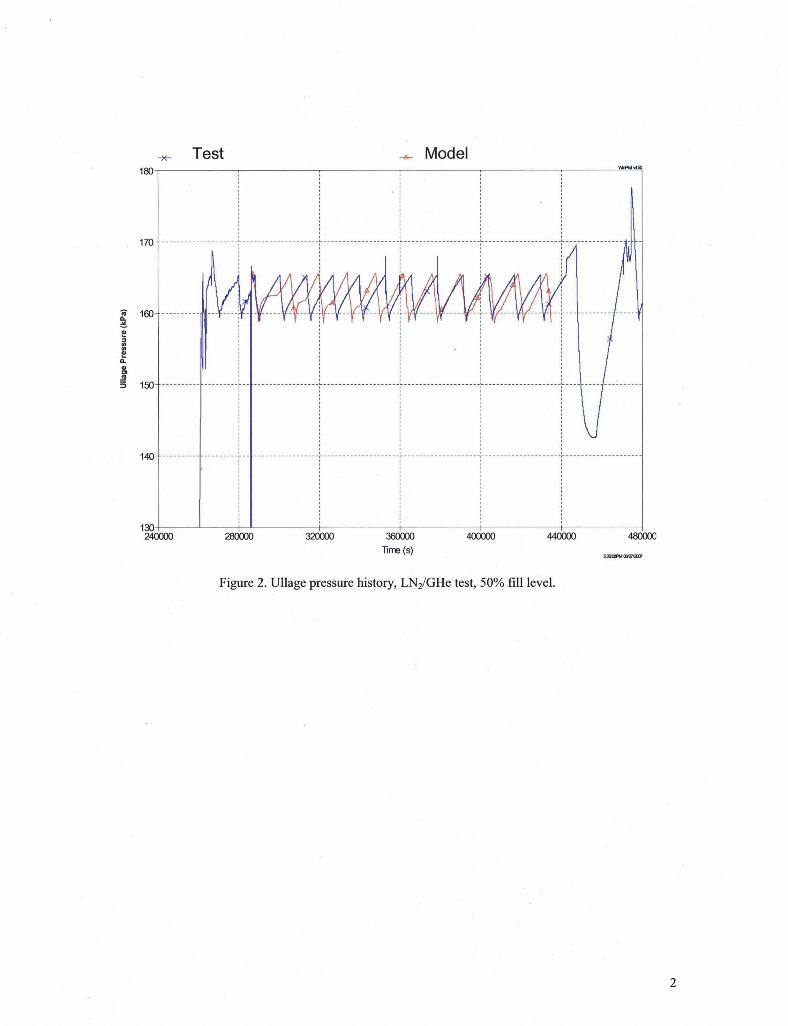
The maximum and minimum pressure set points during this test were 165.3 kPa and158.8 kPa, respectively. The ullage pressure comparison was depicted in FIGURE 2. Theaverage predicted and measured ullage pressure rise rates were 0.6 Pa/s and 0.58 Pa/s,respectively. The average predicted and measured pressure drop rates were 2.7 Pa/s and3.3 Pa/s, respectively. The average predicted and measured cycle durations were 4.02 hrsand 3.56 hrs, respectively., Since the ullage region was modeled as a single node by theTVS code, the predicted ullage temperature was compared to two ullage temperaturemeasurements. These temperatures were measured by the closest sensor to the liquid-ullage interface—location 1, and the highest sensor in the ullage region—location 2. Theullage temperature comparison, as shown in FIGURE 3, indicated a close agreementbetween the calculated and measured values. The average predicted and measured ullagetemperatures were about 81.7 K and 80 K, respectively. , The predicted bulk liquid
4

saturation pressure was compared with the test data, as shown in FIGURE 4. The bulkliquid saturation pressure was overpredicted. The average predicted and measured bulkliquid saturation pressures were about 162 kPa and 109 kPa, respectively. As depicted inFIGURE 5, the predicted bulk liquid saturation temperatures were close to the values oftest data. The average predicted and measured bulk liquid saturation temperatures wereabout 81.5 K and 78 K, respectively. Considering the bulk liquid saturation pressure to bea function of saturation temperature, during the testing the saturation pressure wasdetermined by measuring the bulk liquid temperature at specified location of liquid regionwithin tank. Therefore, overprediction of the bulk liquid saturation pressure could be duemeasurement inaccuracy of the sensor representing the saturation temperature.
LN2/GHe, 25% Fill Level Test
The maximum and minimum pressure set points during this test were 165.3 kPa and158.8 kPa, respectively. The ullage pressure comparison was depicted in FIGURE 6.Average predicted and measured ullage pressure rise rates were 1.25 Pa/s and 0.98 Pa/s,respectively. Average predicted and measured pressure drop rates were 5.7 Pa/s and 6.8Pa/s, respectively. Average predicted and measured cycle durations were 1.83 hrs and2.17 hrs, respectively. The ullage temperature comparison, as shown in FIGURE 7,indicated a close agreement between the calculated and measured values. The averagepredicted and measured ullage temperatures were about 82.5 K and 81.6 K, respectively.The predicted bulk liquid saturation pressure was compared with the test data, as shownin FIGURE 8. The bulk liquid saturation pressure was overpredicted. The averagepredicted and measured bulk liquid saturation pressures were about 162 kPa and 124 kPa,respectively. As depicted in FIGURE 9, the predicted bulk liquid saturation temperatureswere close to the values of test data. The average predicted and measured bulk liquidsaturation temperatures were about 81.5 K and 79 K, respectively.
LH2/GHe Test Series
LH2/GHe tests were conducted at the 90%, 50%, and 25% fill levels.. During boil-offtesting, the total heat input was measured to be about 70 W (in this test series the heaterswere not used). After tank lock up and completion of GHe injection process, the testingcontinued with TVS operation within a prescribed pressure control band of specified,maximum and minimum set points. The data correlations for this test series were carriedout for 50% and 25% fill levels, similar to the fill levels of LN2/GHe test series. The datacorrelations for each fill level test were discussed in the following sections.
LH2/GHe, 50% Fill Level Test
The maximum and minimum pressure set points during this test were 172.2 kPa and165.3 kPa, respectively. The ullage pressure comparison was depicted in FIGURE 10.Average predicted and measured ullage pressure rise rates were 1.45 Pa/s and 1.3 Pa/s,respectively. Average predicted and measured pressure drop rates were 19 Pa/s and 14Pa/s, respectively. Average predicted and measured cycle durations were 1.45 hrs and
5

1.51 hrs, respectively. The ullage temperature comparison, as shown in FIGURE 11,indicated a close agreement between the calculated and measured values. The averagepredicted and measured ullage temperatures were about 22.5 K and 24 K, respectively.The predicted bulk liquid saturation pressure was compared with the test data, as shownin FIGURE 12. The bulk liquid saturation pressure was overpredicted. The averagepredicted and measured bulk liquid saturation pressures were about 166 kPa and 164.2kPa, respectively. As depicted in FIGURE 13, the predicted and measured bulk liquidsaturation temperatures were matched very well.
LH2/GHe, 25 % Fill Level Test
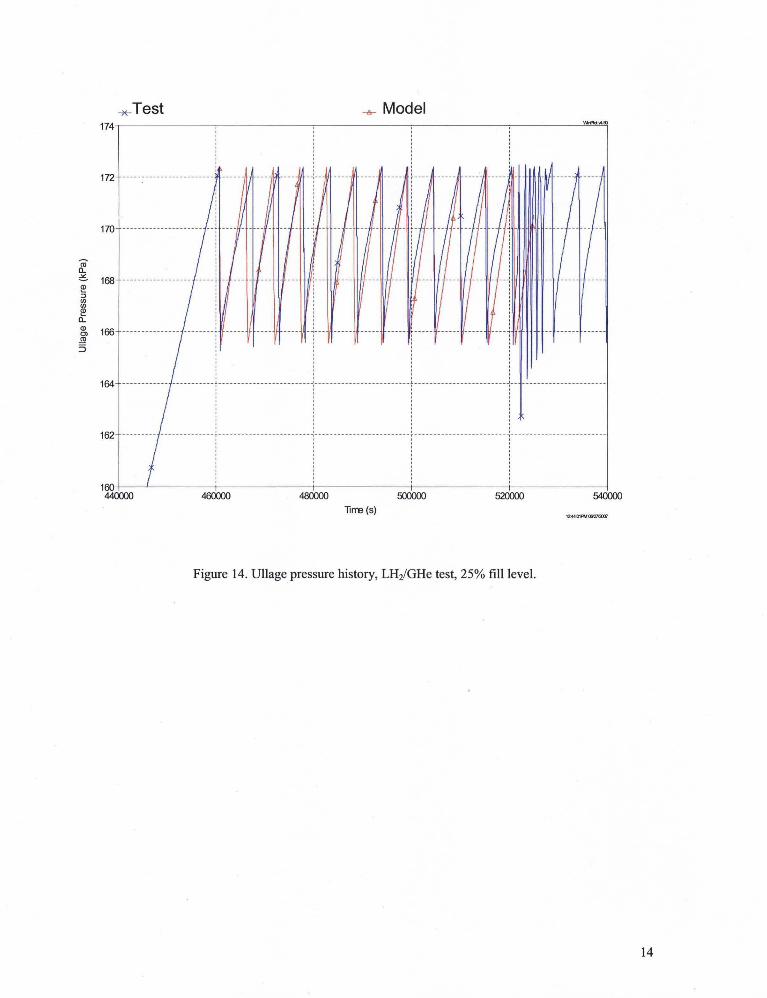
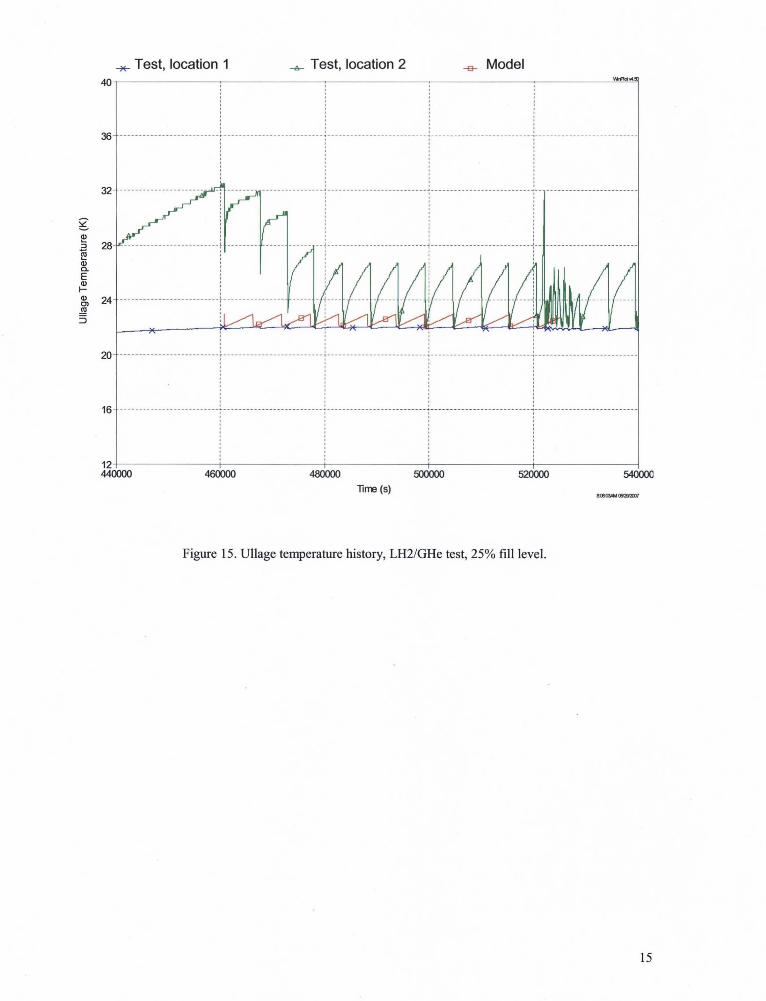
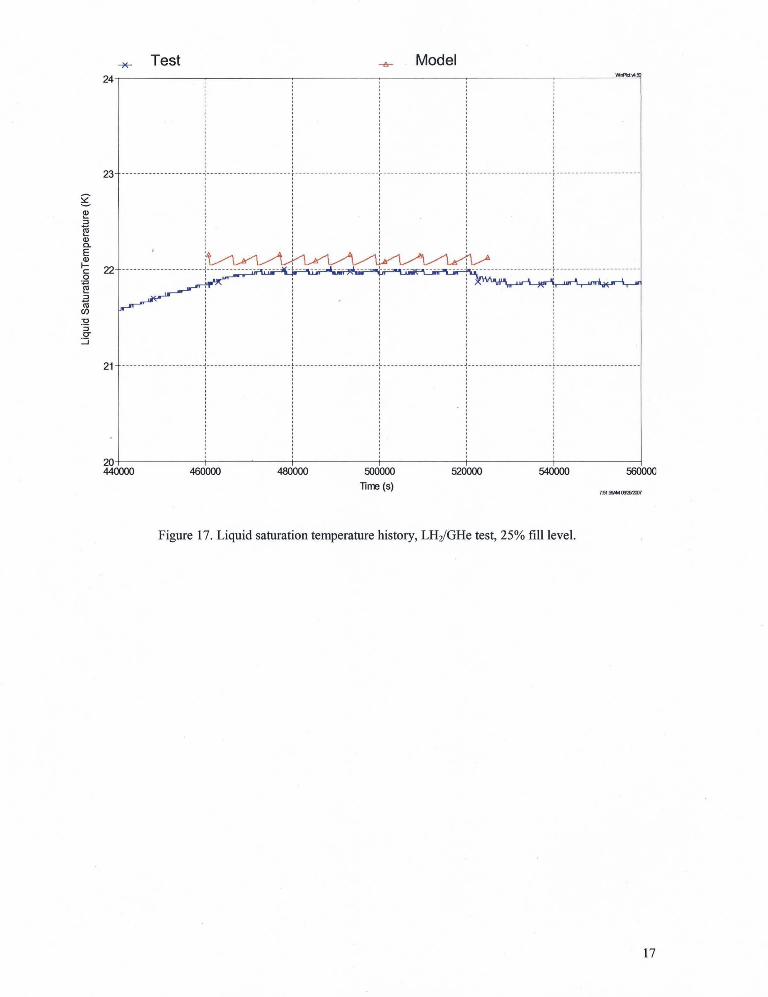
The maximum and minimum set points during this test were 172.4 kPa and 165.3 kPa,respectively. The ullage pressure comparison was depicted in FIGURE 14. Averagepredicted and measured ullage pressure rise and pressure drop rates were in agreement,1.3 Pa/s and 2.4 Pa/s for ullage pressure rise and pressure drop rates, respectively.Average predicted and measured cycle durations also in agreement, at about 1.5 hrs. Theullage temperature comparison, as shown in FIGURE 15, indicated a close agreementbetween the calculated and measured values. The average predicted and measured ullagetemperatures were about 22.5 K and 24 K, respectively. The predicted bulk liquidsaturation pressure was compared with the test data, as shown in FIGURE 16. Thepredicted and measured bulk liquid saturation pressures were in a close agreement. Theaverage predicted and measured bulk liquid saturation pressures were about _168 kPa and163 kPa, respectively. As depicted in FIGURE 17, the predicted and measured bulk liquidsaturation temperatures were in good agreements.
SUMMARY
A one-dimensional TVS performance program was used to analyze and correlate two testseries conducted. Correlation and data analysis were performed for 50% and 25% filllevel for both LH2/GHe and LN2/GHe tests. Predicted and measured values of ullagepressure and temperature and bulk liquid saturation pressure and temperature werecompared with those of test data. For LN 2/GHe test series, predicted ullage pressures,temperatures, and cycle times were in agreement with the data. However, the modeloverpredicted the bulk saturation pressure for both 50% and 25% LN 2/GHe tests. Thepredicted bulk liquid saturation temperature matched reasonably well with the data. Forselected LH2/GHe test cases, the predicted ullage pressures and temperatures and bulkliquid saturation pressures and temperatures were in good agreement with those of themeasured values.
In general, the deviations of predicted values from the test data could be due to theoversimplification of the TVS model. It is believed that the analytical modeling, whichassumed that the liquid and ullage were each represented by a single node, did notaccurately simulate the complex energy exchange occurring at the liquid vapor interface,and also did not address stratification within ullage and liquid regions.
6

REFERENCES
1. L.J. Hastings, L.J., R.H. Flachbart, J.J Martin, A. Hedayat, M. Fazah, L.Lak, H Nguyen, "Spray BarZero Gravity Vent System for On-Orbit Liquid Hydrogen Storage," NASA/TM-2003-212926, , J.W.Bailey, October 2003.
2. Flachbart, R. H., Hastings, L. J., and Martin, J. J., "Testing of a Spray Bar Zero Gravity CryogenicVent System for Upper Stages," 35 `x' AIAA/ASME/SAE/ASEE Joint Propulsion Conference andExhibit, June 20-24, 1999, Paper Number AIAA 99-2175.
3. R. H. Flachbart, L. J. Hastings, A. Hedayat, S. L. Nelson, and S. P. Tucker, "Testing of a Spray-Bar Thermodynamic Vent System in Liquid Nitrogen," Paper C1-G-05, CEC2005.
4. R. H. Flachbart, L. J. Hastings, A. Hedayat, S. L. Nelson, S. P. Tucker, "Testing of a Spray-BarThermodynamic Vent System in Liquid Nitrogen," pp. 240-247, Advances in CryogenicEngineering, Volume 51A, American Institute of Physics, 2006.
5. R. H. Flachbart, L. J. Hastings, A. Hedayat, S. Nelson, S. Tucker, "Testing the Effects of HeliumPressurant on Thermodynamic Vent System Performance with Liquid Hydrogen," CryogenicEngineering Conference, Chattanooga, TN, July 16-20 2007.
6. Lak, Tibor and Wood, Charles, "Zero-G Thermodynamic Venting System Final Report," RockwellAerospace, Downey Operations, Report Number SSD 94M0038, Contract Number NAS8-39202.
7. Nguyen, H, "Zero-G Thermodynamic Venting; System (TVS) Performance Prediction Program,"Rockwell Aerospace, Contract NAS8-39202 May 24, 1994.
7

Heater
Pum
Figure 1. TVS Configuration.
Test , Model180
ws^w
170
a
160 -------- -- - ---- - - ----- - -- - -- -- -- --- --^- ---- ----- ---^-
-- -- -- --- -------- ------
va`
5 150
140
130240000 280000 320000 360000 400000 440000 480000
Time (s)
Figure 2. Ullage pressure history, LN Z/GHe test, 50% fill level.
2

)oa
^ Test, location 1 -,- Test, location 2 $ Model
Time (s)
— 7
Figure 3. U11age temperature history, LNz/GHe test, 50% fill level.

aY_dJNNda`CO
JAN9
aJ
-,- Test Model
Time (s)
ate, =
Figure 4. Liquid saturation pressure history, LNZ/GHe test, 50% fill level.

Test
Model34
32
30
74240000 280000 320000 360000 400000
Time (s)
Figure 5. Liquid saturation temperature history, LN2/GHe test, 50% fill level.
Y
m
mmCLEa^
c0MML
J
440000
480000
am^
5

-,- Test
Model180
170
OR, 160Y_d3NNda`d.a5 150 ---------------------;---------------------- ---------------------;---------------------- -------------------------------------- -----
140 ------------------------------------------- ---------------------'---------------------- ---------------------'--------------------
130470000 480000 490000 500000 510000 520000 530000
Time (s)
Figure 6. Ullage pressure history, LN2/GHe test, 25% fill level.
6

DOC
Y
cuNCL
FMM
D
Test, location 1 Test, location 1 -,- Model
Time (s)e^r^ wm^m
Figure 7. Ullage temperature history, LNz/GHe test, 25% fill level.

RaY
3J
000
Test Model
Time (s) ae1:arM asvrem
Figure 8. Liquid saturation pressure history, LNz/GHe test, 25% fill level.

Test -^ Model
Y 82
m
iomCLEdHC0M
MU)a
2'J 78
76470000 480000 490000 500000 510000 520000 530000 540000
Time (s) «:,-.sea. ovnrev>
Figure 9. Liquid saturation temperature history, LN Z/GHe test, 25% fill level.
9

aY
Nm
_N
00Q
— Test -6- Model
Ti rm (s)3@^f-M OG'S^'ffiI
Figure 10. Ullage pressure history, LHz/GHe test, 50% fill level.
10

Doa
Test, location 1 Test, location 2 Model
Time (s)
Figure 11. Ullage temperature history, LHZ/GHe test, 50% fill level.
11

caCLYNLN3NNdL
CL
c0YLYN.7
QJ
144 I240000 260000
-x- Test Model
Time (S)aaxmra^os7vmm
Figure 12. Liquid saturation pressure history, LHz/GHe test, 50% fill level.
12

YmLYcuLdCQ.
CQ^
Y
L
v/
J
-- Test Model
Time (s)x^:au^n ovJVmm
Figure 13. Liquid saturation temperature history, LHZ/GHe test, 50% fill level.
13
a
ddarnco
Test , Model
Time (s)
Figure 14. Ullage pressure history, LH 2/GHe test, 25% fill level.
14
OOC
YN
19
NCLEa^HNmco
D
, Test, location 1 -- Test, location 2 $ Model
Time (s)
Figure 15. Ullage temperature history, LH2/GHe test, 25% fill level.
15

CL
NL
NdL
ac0rcaL
w
cn.7crJ
Test Model
Time (s)1:9:JbTM 06'9(ffi!
Figure 16. Liquid saturation pressure history, LHZ/GHe test, 25% fill level.
16
,- Test ^ Model24 — w wnwn
r r r
YN
NNaNF
O
m
is
aZ3
crJ
r r i
21
20440000 460000 480000 500000 520000 540000 560000
Time (s)^si:$wora^^
Figure 17. Liquid saturation temperature history, LH Z/GHe test, 25% fill level.
17