Analyzing the Relationship between the Business Model and ...
75
Degree Project – Accounting and Management Control (BUSN 68) 2014-05-27 MASTER THESIS Analyzing the Relationship between the Business Model and Working Capital Management – A Case Study Authors: Nina Olsen Stefanie Wetz Supervisors: Anders Anell Per Magnus Andersson
Transcript of Analyzing the Relationship between the Business Model and ...
Degree Project – Accounting and Management Control (BUSN 68)
2014-05-27
MASTER THESIS
Analyzing the Relationship between the
Business Model and Working Capital
Management – A Case Study
Authors:
Nina Olsen
Stefanie Wetz
Supervisors:
Anders Anell
Per Magnus Andersson

II
Abstract
Seminar date: 2014-06-02
Course: BUSN 68, Degree Project - Accounting and Management
Control
Authors: Nina Olsen and Stefanie Wetz
Advisors: Anders Anell and Per Magnus Andersson
Five key words: Business Model, Working Capital Management, Accounts
Receivable, Accounts Payable, Inventory
Purpose: The purpose of this thesis is to describe, analyse and discuss
the relationship between working capital management and the
business model through an extensive analysis of theories and
conducting a case study of a multinational corporation.
Methodology: We used a qualitative and mainly deductive approach based on
literature review and a case study with a multinational company.
Theoretical perspectives: Built on previous research related to the topics of WCM and
business models. Based on these concepts, a framework was
developed that was then applied to a case study.
Empirical foundation: We have collected the empirical data from personal
observations, documentation and interviews within the case
study company.
Conclusions: We have found a strong link between the business model and
working capital management. The design and the decisions
made within the components of the business model influences
the level of receivables, payables and inventory significantly.
Therefore the business model should be considered in order to
improve working capital effectively and efficiently.

III
Acknowledgement
We would like to thank our supervisors Anders Anell and Per-Magnus Andersson for their
support and guidance throughout the work with our thesis. We would also like to express our
gratitude to the company in which we conducted our case study, and especially the
interviewees, who generously contributed valuable information that made this study possible.
Tack så mycket!
Nina Olsen & Stefanie Wetz

IV
Table of Content
Abstract ................................................................................................................................. II
Acknowledgement .................................................................................................................III
Table of Content ................................................................................................................... IV
List of Abbreviations ............................................................................................................. VI
Table of Figures .................................................................................................................. VII
1 Introduction .................................................................................................................... 1
1.1 Problem Background ............................................................................................... 1
1.2 Research Purpose................................................................................................... 2
2 Research Approach ........................................................................................................ 4
2.1 Methodology............................................................................................................ 4
2.2 The Choice of a Case Study .................................................................................... 5
2.3 Criticisms on Case Studies as a Research Approach .............................................. 7
2.4 Scientific Approach.................................................................................................. 7
2.5 Structure of the Paper ............................................................................................. 8
3 Theoretical Framework and Literature Review ............................................................... 9
3.1 Business Model ....................................................................................................... 9
3.1.1 Definition of Business Model ............................................................................ 9
3.1.2 Components of the Business Model ................................................................12
3.1.3 Relationship to Strategy, Organisation and Performance Measurement ..........14
3.2 Working Capital ......................................................................................................16
3.2.1 The Concept of Working Capital ......................................................................16
3.2.2 Effects of Working Capital Management ..........................................................20
3.2.3 Accounts Payable ...........................................................................................22
3.2.4 Accounts Receivables .....................................................................................25
3.2.5 Inventory .........................................................................................................29
4 Framework for the Relationship of Business Model and WCM ......................................34
4.1 Contingency Factors ..............................................................................................34
4.2 Relationship between WCM and the Components of a Business Model .................36

V
4.2.1 Value Proposition and WCM ...........................................................................36
4.2.2 Customer and WCM ........................................................................................37
4.2.3 Channels and WCM ........................................................................................38
4.2.4 Customer Relations and WCM ........................................................................39
4.2.5 Partnerships and WCM ...................................................................................39
4.2.6 Key Activities, Key Resources and WC ...........................................................40
4.2.7 Cost Structure and WC ...................................................................................41
5 Case Study ....................................................................................................................42
5.1 The Company’s Business Model ............................................................................42
5.2 Differentiation Strategy ...........................................................................................43
5.3 Customers ..............................................................................................................43
5.4 Receivable Management ........................................................................................44
5.5 Suppliers ................................................................................................................45
5.6 Payables Management ...........................................................................................45
5.7 Inventory Management ...........................................................................................46
5.8 Measurement for Working Capital ..........................................................................47
5.9 Financing ...............................................................................................................47
6 Case Study Analysis .....................................................................................................49
6.1 Value Proposition and WCM ..................................................................................49
6.2 Customers and WCM .............................................................................................50
6.3 Channels and WCM ...............................................................................................51
6.4 Customer Relations and WCM ...............................................................................51
6.5 Partnerships and WCM ..........................................................................................52
6.6 Key Resources and WCM ......................................................................................54
6.7 Cost structure and WCM ........................................................................................54
6.8 Potential of changing contingency factors ..............................................................55
7 Discussion and Conclusions ..........................................................................................56
References ...........................................................................................................................62
Appendix ..............................................................................................................................68

VI
List of Abbreviations
B2B Business to Business
B2C Business to Customer
BSC Balanced Scorecard
CCC Cash-to-Cash Cycle
DHI Days Inventory Held
DPO Days Payables Outstanding
DSO Days Sales Outstanding
EVA Economic Value Added
GPG General Purchasing Group
GWC Gross Working Capital
NOPAT Net Operating Profit After Taxes
NWC Net Working Capital
SKU Stock Keeping Unit
WC Working Capital
WCM Working Capital Management

VII
Table of Figures
Figure 1: Structure of the Research Approach ....................................................................... 5
Figure 2: Definitions of Business Model ................................................................................10
Figure 3: Nine Components of a Business Model ................................................................12
Figure 4: Business Model, Strategy, Organization and Performance Measurement .............16
Figure 5: Cash-to-Cash Cycle .............................................................................................19
Figure 6: Contingency Factors, Business Model and the WC Components ..........................34
Figure 7: The Relationship of Value Proposition and WCM ..................................................36
Figure 8: Relationship between Customer and WCM ...........................................................37
Figure 9: The Relationship between Channel and WCM ......................................................38
Figure 10: Relationship Customer Relations and WCM ........................................................39
Figure 11: The Relationship between Partners and WCM ....................................................40
Figure 12: The Relationship between Financial Resources and WCM ..................................41
Figure 13: Case Study Findings: Relationship Value Proposition WCM ................................49
Figure 14: Case Study Findings: Relationship Customers and WCM ...................................51
Figure 15: Findings Case Study: Relationship Customer Relations and WCM .....................52
Figure 16: Findings Case Study Relationship Partnerships and WCM ..................................53
Figure 17:CCC for The Coca Cola Company .......................................................................68
Figure 18: CCC for Nestle . ..................................................................................................68

1
1 Introduction
1.1 Problem Background
Within the last decades the business environment has changed significantly. This is mainly
driven by developments within the information and communication technology which
facilitated communication and turned information into a cheap and always available good
(Russell, Albrecht & Sack, 2000). Another factor having an immense influence is
globalization. Companies have to compete for customers, resources, capital and employees
against organizations from the other end of the world (Nilson, Olve & Parment, 2011). These
developments have significantly increased the competition among companies, shortened the
product-life-cycle, increased the complexity as well as accelerated business life (Russell,
Albrecht & Sack, 2010).
Additionally the last financial crisis in 2008 brought along new developments which the
companies had to face. Within only a few months the global production dropped by about 20
percentage points. Furthermore due to insecurity regarding market development financial
institutes restricted and limited the allocation and extension of funds (Hofmann et al., 2011).
Management is always confronted with changes, such as the above mentioned, and to be
successful the company’s business model has to be adapted to its environmental
requirements (De Reuver, Bouwman & Haaker, 2013). A business model in general can be
understood as a model which describes the company’s logic of producing and selling goods
to create value for its customers and generate revenue (Osterwalder, 2004). To analyse a
business model nine components can be used: the company’s value proposition, customer
segments, channels, customer relations, partnerships, key activities and key resources as
well as the company’s cost and revenue structure (Osterwalder & Pigneur, 2010). Whenever
the environment is changing, companies have to rethink their business model and adapt
these components to the changing environment (De Reuver, Bouwman & Haaker, 2013).
The limited access to liquidity during financial crises for example, forced companies to find
other financial sources, which is one reason why working capital management got popular
(Nevries & Gebhardt, 2013). In general working capital is defined as the current assets
minus current liabilities, thus it shows how much cash the company has available to satisfy
the short-term cash obligations (Preve & Sarria-Allende, 2010). Current assets like cash,
cash equivalents, inventory and accounts receivable are usually defined as assets which can
be sold within one year, whereas current liabilities are all liabilities that are to be settled in
2
cash within one year including accounts payable, short-term loan, dividends and interest
payable (Buchmann & Jung, 2014). However the management of receivables, payables and
inventory is paid most attention in working capital management (Heesen & Moser, 2013). By
reducing the tied up capital in these items, liquidity is set free and can be used for other
investments (Nevries & Gebhardt, 2013). Consequently the financing can take place
internally and the dependency on external financing institutes decreases (Schulte, 2011).
A report by Ernst & Young shows that the largest 1 000 European companies have tied up €
475 billion in working capital (Smid, 2007) and according to a study by the Boston Consulting
Group, working capital can on average be improved by 30 - 40 % which would lead to overall
cost savings of 5 - 10 % (Buchmann et al., 2008). This shows the enormous potential of
working capital management for companies.
The topic for this thesis was brought to us by the company one of the authors is working for.
This company, which is a multinational corporation within the food packaging and processing
industry, stated that working capital management and cash flow are areas in need of
improvements. Since we thought working capital management is a broader and more
interesting topic we decided to focus on this issue and conduct a case study based on this
company. During our literature research and interviews with finance and business control
directors of the company we realized that the company’s business model has a significant
influence on working capital management and decision making within this area. This
aroused our interest and since literature linking working capital management and business
model is quite limited we decided to focus on this relationship in our study. Additionally every
company is affected by the above mentioned changes in the business environment, which is
why this issue could also be of interest for other organisations. Thus by having a detailed
analysis we can contribute to the existing theories within these topics.
1.2 Research Purpose
The purpose of this thesis is to describe, analyse and discuss the relationship between
working capital management and the business model through an extensive analysis of
theories and conducting a case study of a multinational corporation. Our main research
questions are:
- How are working capital management and the business model defined in literature?
- How is the relationship between business model and working capital management
described in the literature?

3
- How does the company’s working capital management practice in the case study differ
compared to the findings in literature?
- How does the company’s business model in the case study affect working capital
management?
- What conclusions can we draw from the case study analysis of the relationship between
the company’s business model and working capital management for other companies?

4
2 Research Approach
2.1 Methodology
As previously mentioned, the idea for this topic of research came from managers within the
company in which we conducted the case study. They stated that working capital
management (WCM) and cash flow was an area in need of improvement. We chose to focus
on the area of working capital (WC), as we believed that this was a broad and interesting
topic. We started the research for this paper by reviewing a large amount of textbooks on the
topic of WCM. This gave us an understanding of the topic and what can be done to improve
WCM in a business. We then went on to study published research papers by various authors
which gave us further understanding of the issue and how others have previously worked
with WC within corporations. The findings of this research will be described in Chapter 3.2,
which contains a rather technical summary of WC and WCM.
Initially the focus of this paper was on how to improve WCM within a business. From
literature we saw the importance of top management involvement in WC improvement
initiatives. This knowledge lead us to believe that WCM should be linked to the strategy of a
company. We then started research in order to find a link between WCM and strategy.
However, from this research and the interviews we conducted at the company, we realised
that the business model of a company had a significant impact on WCM.
Further research was conducted with regards to the topic of business models, where we
found various definitions. Through extensive research we then created a business model
framework based on other authors work. Within this framework we combined what we
thought were the most important components of the business model that may also have an
impact on WCM. The model that we used to capture how the business model may have
impact on WCM was then analysed through the case study. This was done through
describing the findings of the case study and applying them to our framework. We were then
able to draw our conclusions from this. The following figure illustrates our research
approach:
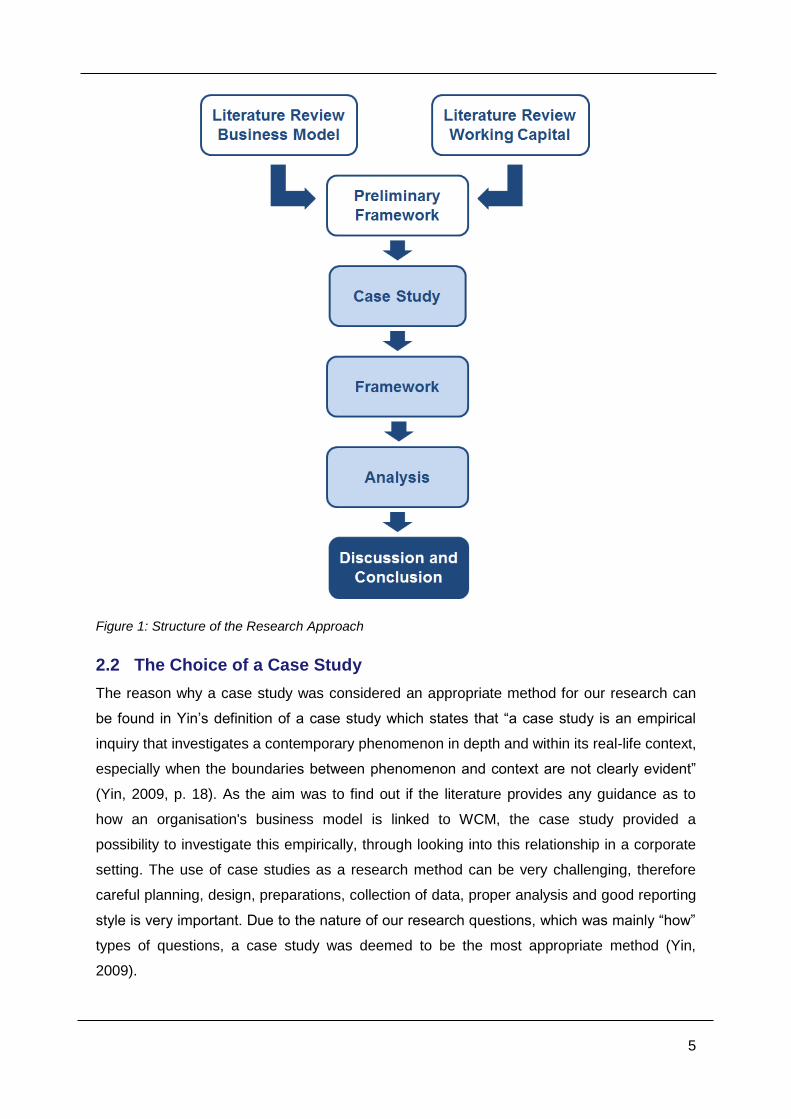
5
Figure 1: Structure of the Research Approach
2.2 The Choice of a Case Study
The reason why a case study was considered an appropriate method for our research can
be found in Yin’s definition of a case study which states that “a case study is an empirical
inquiry that investigates a contemporary phenomenon in depth and within its real-life context,
especially when the boundaries between phenomenon and context are not clearly evident”
(Yin, 2009, p. 18). As the aim was to find out if the literature provides any guidance as to
how an organisation's business model is linked to WCM, the case study provided a
possibility to investigate this empirically, through looking into this relationship in a corporate
setting. The use of case studies as a research method can be very challenging, therefore
careful planning, design, preparations, collection of data, proper analysis and good reporting
style is very important. Due to the nature of our research questions, which was mainly “how”
types of questions, a case study was deemed to be the most appropriate method (Yin,
2009).
6
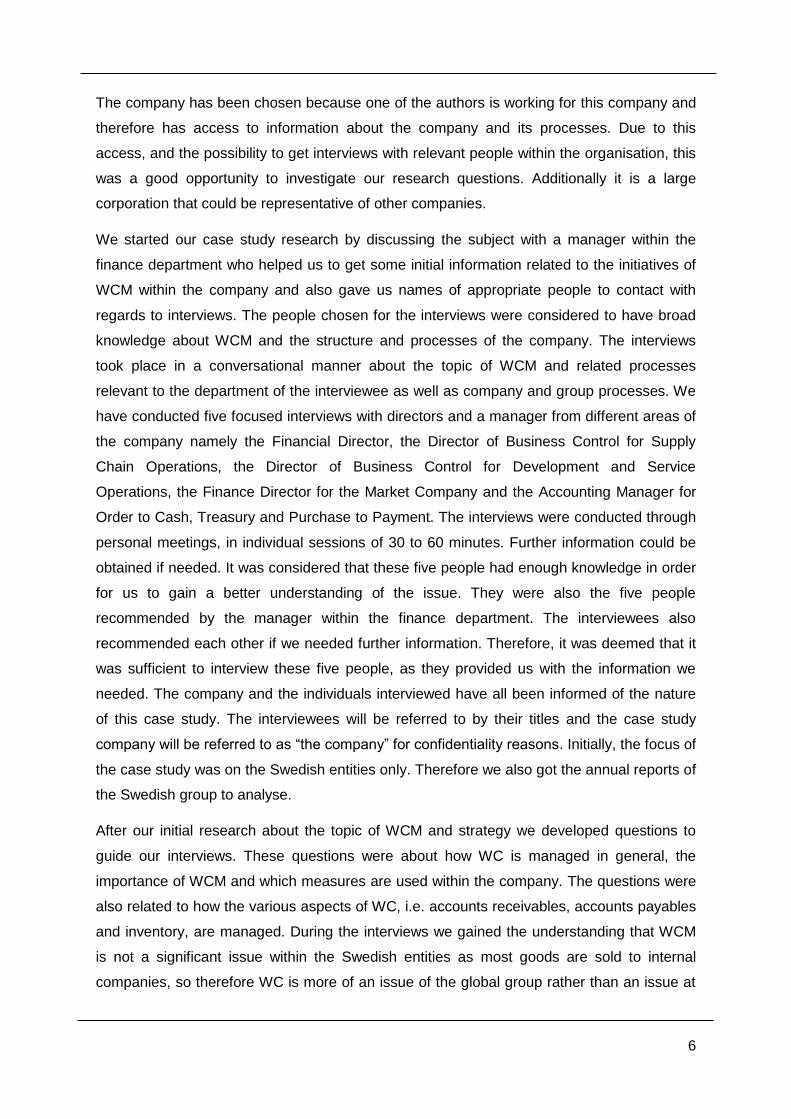
The company has been chosen because one of the authors is working for this company and
therefore has access to information about the company and its processes. Due to this
access, and the possibility to get interviews with relevant people within the organisation, this
was a good opportunity to investigate our research questions. Additionally it is a large
corporation that could be representative of other companies.
We started our case study research by discussing the subject with a manager within the
finance department who helped us to get some initial information related to the initiatives of
WCM within the company and also gave us names of appropriate people to contact with
regards to interviews. The people chosen for the interviews were considered to have broad
knowledge about WCM and the structure and processes of the company. The interviews
took place in a conversational manner about the topic of WCM and related processes
relevant to the department of the interviewee as well as company and group processes. We
have conducted five focused interviews with directors and a manager from different areas of
the company namely the Financial Director, the Director of Business Control for Supply
Chain Operations, the Director of Business Control for Development and Service
Operations, the Finance Director for the Market Company and the Accounting Manager for
Order to Cash, Treasury and Purchase to Payment. The interviews were conducted through
personal meetings, in individual sessions of 30 to 60 minutes. Further information could be
obtained if needed. It was considered that these five people had enough knowledge in order
for us to gain a better understanding of the issue. They were also the five people
recommended by the manager within the finance department. The interviewees also
recommended each other if we needed further information. Therefore, it was deemed that it
was sufficient to interview these five people, as they provided us with the information we
needed. The company and the individuals interviewed have all been informed of the nature
of this case study. The interviewees will be referred to by their titles and the case study
company will be referred to as “the company” for confidentiality reasons. Initially, the focus of
the case study was on the Swedish entities only. Therefore we also got the annual reports of
the Swedish group to analyse.
After our initial research about the topic of WCM and strategy we developed questions to
guide our interviews. These questions were about how WC is managed in general, the
importance of WCM and which measures are used within the company. The questions were
also related to how the various aspects of WC, i.e. accounts receivables, accounts payables
and inventory, are managed. During the interviews we gained the understanding that WCM
is not a significant issue within the Swedish entities as most goods are sold to internal
companies, so therefore WC is more of an issue of the global group rather than an issue at
7
country level. Therefore we had to expand the study to a global level. The challenges of this
expansion was that we could not get annual reports, including a balance sheet and profit and
loss statement for the group, as this is confidential information, due to the fact that it is not a
public company. Another challenge was that we could not get interviews with directors on a
global level to get a better view of how WC is managed there. However one of our
interviewees directly reports to the group and therefore has a good understanding of what is
relevant from a group perspective and another interviewee has worked abroad and therefore
could provide additional relevant information.
From the interviews we realised that the business model has a significant impact on how WC
is managed within a company. However, we also found out that since the financial crisis and
due to continuously increasing global competition, WCM has become much more important
on a group level, and managing components of WC, such as inventory, are very important
on country level. Furthermore, we found out that improved forecasting has gained
importance. By the third interview we had directed the questions more to the link between
the business model and WCM, which meant that we could get a clearer understanding of
this link.
2.3 Criticisms on Case Studies as a Research Approach
Some criticisms against using case studies include the risk of bias if the case study is not
conducted properly, and if appropriate procedures are not being followed. Another issue is
that when only using one case study it will be difficult drawing conclusions that can be
applied to a broader setting. We are aware that it may be difficult to draw generalised
conclusions based on only one case (Yin, 2009). It can be argued that since it is a large
corporation it will have similar features as other corporations and therefore it may still be
possible to apply the results in other contexts, as the case is built on a sound theoretical
base. Furthermore it can also be seen as a starting point for a new research area since, to
our knowledge, the relationship between a business model and WCM has not yet been
analysed in detail. Additionally we were aware of the risk of biased results based on the fact
that one of the authors is working for the company. However, we kept this risk in mind
throughout the study to ensure it was conducted objectively.
2.4 Scientific Approach
Based on the previous description our research approach to link theory (literature on WC
and business model) and practice (case study), can mainly be classified as a deductive
approach. In general one can distinguish between the deductive and inductive approaches.
In the deductive approach hypothesis and conclusions are based on theories, which may

8
then be tested empirically. Whereas in the inductive approach the researcher will gather
information without linking it to any theory, theories will then be developed based on the
empirical findings (Patel & Davidsson, 2011). The deductive approach has mainly been used
in this study. However, our study may have traits of the inductive approach as well, as
observations were done through a case study, which could lead to an attempt to formulate
further theory, based on our observations. There are positive and negative aspects to both
approaches. The researcher may remain more objective with the deductive approach as a
starting point can be found in existing theory. However, gaining any new and different ideas
leading to development of the theory may be more difficult for the same reason (Patel &
Davidsson, 2011). As there is already substantive literature on the topic of WCM, the
research conducted is descriptive to a large extent. Detailed descriptions of WCM and
business models were done. The main focus of this research is qualitative (Patel &
Davidsson, 2011).
2.5 Structure of the Paper
The thesis is structured as followed. First we present a literature review about business
model, which is discussed controversially in literature. Based on this we derive a definition
for the business model and its main components and link it to other popular concepts such
as strategy, organisation and performance measurement. This is followed by a literature
review on WC including WCM and its three main components accounts receivable, accounts
payable and inventory as well as measures how to evaluate the WC performance. Secondly
we develop a framework based on the literature, linking the concepts of business model and
WCM. Thereafter, our findings in the case study are presented and finally analysed by using
our developed framework.

9
3 Theoretical Framework and Literature Review
3.1 Business Model
3.1.1 Definition of Business Model
The business model is the fundament of any organisation (Magretta, 2002). The concept of
the business model became popular in the 1990s especially in the IT sector, where during
the IT boom a lot of firms failed to create a sustainable business model (Brunninge &
Wramsby, 2014). Nowadays, in the fast changing environment, companies need to be able
to adapt the existing business model or sometimes even develop a new one which is
adjusted to the new challenges (De Reuver, Bouwman & Haaker, 2013). However there is
no clear and consistent definition of this concept in the literature and especially regarding
links to other concepts, such as strategy, there is a lack of consensus (Al-Debei & Avison,
2010; Brunninge & Wramsby, 2014; Georg & Bock, 2011).
The term “business model” consists of the two words “business” and “model”. Therefore,
reviewing a dictionary might help to get a first understanding of the meaning. According to
the Oxford Advanced Dictionary (2000) a business is “the activity of making, buying, selling
or supplying goods or services for money” (p. 160) whereas a model is defined as “a simple
description of a system, used for explaining how something works or calculating what might
happen” (p. 819). Therefore a business model seems to be a simplified description of how a
company is producing and selling goods to earn money.
However this does not provide us with detailed knowledge of what belongs to a business
model and what does not. Therefore a review of different definitions is analysed next in
figure 2.

10
Author Definition of Business Model
Pro
duct/
Ma
rket
Com
bin
ation
Custo
mer
Valu
e C
reation
Pro
fit
Genera
tion
Desig
n v
alu
e
chain
Str
ate
gy
TImmers, (1999)
“An architecture for product, service and information flows, including a description of the various business actors and their roles; and a description of the potential benefits for the various business actors and the source of revenue”
x x x
Klueber, (2000)
“Business models are defined as summary of the value creation logic of an organization or a business network including assumptions about its partners, competitors and customers. They define the business and IS architecture, rules, potential benefits and the sources of revenue.”
x x x x
Mahadevan, (2000)
“A business model is a unique blend of three streams that are critical to the business (…) The value stream identifies the value proposition for the buyers, sellers, and the market makers (…). The revenue stream is a plan for assuring revenue generation for the business. The logistical stream addresses various issues related to the design of the supply chain for the business.”
x x x
Magretta, (2002)
Business models “are, at heart, stories – stories that explain how enterprises work. A good business model answers Peter Drucker’s age-old questions: Who is the customer? And what does the customer value? It also answers the fundamental question: (…) How do we make money in this business?”
x x x
Hamel, (2002) in Weinhardt et al., (2011)
He identifies four characteristics of a business model: the core strategy including the business mission, product/market positioning and the basis for differentiation, followed by the strategic resource which describes the core competencies and core processes. The third component is the customer interface representing the go-to-market strategy, relationships to customers and pricing and revenue models. Finally the value networks including suppliers and other business partners.
x x x x x
Osterwalder, (2004)
A business model has to address the four areas: “Product: The products and the value propositions offered to the market, customer interface: Who the company's target customers are (…) and how it builds a strong relationships with them, infrastructure management: How the company efficiently performs infrastructural or logistical issues, with whom and financial aspects: What is the revenue model, the cost structure and the business model’s sustainability.”
x x x x
Kotler, Berger & Bickhoff (2010)
“A simplified description of a company’s strategy” including the three component “the choice of product/market combination, the determination of the revenue mechanism and the configuration and execution of value adding activities”
x x x X
Georg & Bock, (2011)
“A business model is the design of organizational structures to enact a commercial opportunity.” x x
Figure 2: Definitions of Business Model

11
As we can see from the analysis: profit generation, value creation, customers and
product/market combination are the most mentioned facets of a business model.
Weinhardt et al. (2011), who did a qualitative and quantitative analysis of 26 business model
definitions covering the years 1998 to 2004, came to similar results. They identified four
elements which are commonly used in literature to define the business model concept. The
first component is value creation which deals with a description of the offer a company has
for its customers. However the granularity between the authors differs significantly. Some
focus more on a marketing perspective, discussing the product/market mix whereas others
describe the activities performed by a company to create value and its dependencies. The
network is the second element including business partners like suppliers and other actors
and their role. A business model can be designed either for a single company or a value
network. Apart from that the customers and markets are also mentioned frequently which is
linked to the value creation process since value can only be generated if customer needs are
satisfied. Finally profit can be considered as the fourth element explaining a business model
which describes how the company earns money. Some authors point out that revenue
generation is the most important component of a business model; however four out of 26 do
not mention this component at all.
Based on the similar components Osterwalder & Pigneur (2010) developed a tool to
describe, analyse and design business models, which they call “The Business Model
Canvas”. According to them “a business model describes the rationale of how an
organization creates, delivers, and captures value” (Osterwalder & Pigneuer, 2010, p. 14). In
a previous paper Osterwalder developed out of the four main components, which he defined
as product, customer interface, infrastructure management and financial aspects, nine
building blocks which illustrate best how the organisation earns money (Osterwlader, 2004).
These nine building blocks have been further developed by Osterwalder & Pigneur (2010)
into customer segment, value proposition, channels, customer relations, revenue structure,
key resources, key activities, key partnership and cost structure.
In this thesis we follow the definition by Osterwalder & Pigneuer (2010) and use their tool to
describe and analyse the link between business model and WC. There are other approaches
as well such as the one by Weinhardt et al. (2011). Many models are built on the idea how
company’s generate profit but with different focus areas. The approach by Osterwalder &
Pigneuer provides the benefit that it includes, from our point of view, the most important
components of the business model and links them together. Which is why we thought the
tool was the most appropriate one for our study. The following figure illustrates the relations
between the nine components according to Osterwalder & Pigneuer (2010):

12
Figure 3: Nine Components of a Business Model (based on Osterwalder & Pigneuer, 2010)
3.1.2 Components of the Business Model
Customer and Customer Segment
Customers are the centre of value creation for any company (Weinhardt et al., 2011) and
therefore the heart of every business model (Osterwalder & Pigneuer, 2010). Since no
company can survive without customers, it needs to be ensured that the expectations and
needs of the customers are met. In order to achieve customer satisfaction, the company
should decide for which customer group they want to create value and which are the most
important ones. This can be done by classifying the customers into several district segments
regarding attributes like their needs, expectations or behaviour. To create a business model
a company needs to clarify on which segment they want to focus. Different approaches can
be found. The business model for example, can only target a niche market and therefore
focus only on one customer segment. Another option is not distinguishing between different
customer segments but to target the mass market (Osterwalder & Pigneuer, 2010).
Value Creation and Proposition
By transforming raw material through the use of labour and capital into a final state or
product a company creates value (Besanko et al., 2013). From a customer perspective value
is created if the product or service satisfies its needs (Kotler et al., 2008). The value creation
is closely linked to the value proposition of a company, which Osterwalder and Pigneuer
(2010, p. 22) describe as “the bundle of products and services that create value for a specific
customer segment (…) it is the reason why customers turn to one company over another”.
Therefore a value proposition consists of a mix of value providing elements which can be of
quantitative nature such as price or speed of service or qualitative nature such as design,

13
which create value and satisfy the needs of the customer segment (Osterwalder & Pigneuer,
2010).
Customer Relationships and Channels
This component describes which kind of relationship a company has to a certain customer
segment. Within a business model a company should clarify this relation, which can include
the type of relationship, e.g. personal or automated (Osterwalder & Pigneur, 2010), or a time
focus like long-term or short-term customer relations (Peters et al., 2013). Additionally the
relationship to customers can be driven by motivations such as customer acquisition, sales
growth and customer retention (Osterwalder & Pigneur, 2010). Often the business model
neglects the customer relationship and focuses on the value creation process and the
product. However this potential should not be underestimated since customers are an
important factor for the value creation (Peters et al., 2013).
Apart from customer relations the way a company wants to reach its customers to deliver the
value proposition should be considered in a business model, which Osterwalder & Pigneur
(2010) refer to as channel. Although this component is not discussed by many authors
(Peters et al., 2013), it can be of interested in several industries.
Key Resources and Activities
“Key resources describe the most important assets required to make a business model
work” (Osterwalder & Pigneur, 2010, p. 34). These key resources are needed to create a
value proposition, sell it on a market, stay in touch with customers and finally generate
revenue. They include physical items, financial capital or human resources. Depending on
the business model a different mix of key resources is needed (Osterwalder & Pigneuer,
2010).
However to create value not only the resources are needed but also actions. Each business
model has some key activities which are of importance for the company to operate
successfully. Similar to key resources, they focus on delivering the value proposition to the
customer and generate profit, and differ depending on the business model (Osterwalder &
Pigneuer, 2010).
Key Partnership
“The key partnerships describe the network of suppliers and partners that make a business
model work” (Osterwalder & Pigneuer, 2010, p. 38). It includes business partners and
coalitions and their roles in creating value along the value chain for customers (Weinhardt et
al., 2011; Hamel, 2000 in Osterwalder, 2004). Coalitions can be classified as alliances with

14
competitors thinking and acting the same way, whereas partners and suppliers deliver
important components to produce the final product or service (Hamel, 2000 in Osterwalder,
2004). Being more specific, apart from the classical business partners such as suppliers;
financial institutions, shareholders and even other stakeholders such as legal institutions,
can be considered as business partners. This component within a business model describes
the role of each of these business partners, as well as the relationship they have with the
company.
Cost and Revenue Structure
The last components try to answer the question: how does the company generates profit
(Stähler, 2001; Stähler, 2002 in Osterwalder, 2004). While the cost structure “describes the
most important cost incurred while operating under a particular business model”
(Osterwalder & Pigneuer, 2010, p.40), the revenue structure illustrates how a company
generates cash from its customers (Osterwalder & Pigneur, 2010). Thus considering both
together shows how a company generates profit. Additionally a business model should
answer the question where does the income come from, thus the connection to customers
and value proposition should be considered (Afuah and Tucci, 2003 in Osterwalder, 2004).
3.1.3 Relationship to Strategy, Organisation and Performance Measurement
After defining the four main components of a business model, a clear description of the
relationship to the concept of strategy and how both are embedded in the organisation
should be given. Strategy is traditionally defined as “a plan – some sort of consciously
intended course of action, a guideline (…) to deal with situations” (Mintzberg, 1987, p.11), as
a company’s position in the market (Porter, 2004) or as a set of long-term objectives,
defining steps how to fulfil the goals and how to measure the achievement (Kaplan & Norton,
2004).
However the relationship between strategy and business model is discussed controversially
in literature. Magretta states “a business model isn’t the same thing as strategy” (2002, p.89)
and Kotler, Berger & Bickhoff point out that a business model is “a simplified description of a
company’s strategy” (2010, p.56). Therefore strategy can be seen as a precondition for a
business model defining the vision and objectives of a firm (Weinhardt et al., 2011), which is
similar to Osterwalder’s framework. He defines a business model as “the translation of a
company’s strategy into a blueprint of the company’s logic to earning money” (Osterwalder,
2004, p. 14). Thus based on the previous considerations both business model and strategy
address a comparable problem namely finding a sustainable way of earning money.
However it takes place on a different business layer (Osterwalder, 2004). Therefore we can

15
conclude that the business model is a simplified version of the company to explain and
predict how the company’s strategy can be achieved to generate long-term profit. Meaning
the company’s strategy and vision are implemented through the business model by
translating it into the value creation, profit generation as well as network and customer logic
(Osterwalder, 2004).
Having defined that, the relationship between business model and the organisation as well
as the link to performance measurement can be of concern to understand the business
model concept in its entirety. Based on Osterwalder’s framework, the organisation is the
implementation of “the business model into appropriate business structures and processes”
(2004, p. 17). Thus the organisation represents the operational realisation of the business
model. Additionally the business model points out which areas are of particular interested
and therefore should be monitored (Osterwalder, 2004). In this case performance
measurement could be seen as tool to evaluate and measure the implementation of the
strategy and business model as well as the achievements. Performance measurement can
be defined as the implementation of measures for different dimensions like for example cost,
time, quality or customer satisfaction which are used to measure and evaluate the efficiency
and effectiveness of company, employee or process performance (Gleich, 2011). A
commonly used performance measurement system is the Balanced Scorecard (BSC),
introduced by Kaplan and Norton in the early 90s. In contrast to the traditional performance
measurement system which mainly focused on the financial performance, the BSC included
non-financial measures and indicators which should support management in monitoring the
business (Osterwalder, 2002). Therefore the BSC uses four perspectives namely the
financial, customer, internal business processes and learning and growth perspective. Within
each perspective, objectives and measures are included which are derived from the
company’s vision and strategy (Kaplan & Norton, 2004). However a comparison of the four
perspectives of the BSC to the main components of a business model shows that they are
quite similar (Osterwalder, 2004). Thus the BSC or performance measurement in general
can be classified as a tool to measure the achievements of the strategy as well as the
business model depending on the chosen measures.
The figure 4 illustrates these considerations:

16
Figure 4: Business Model, Strategy, Organization and Performance Measurement
Additionally the following example tries to clarify the relationship between strategy, business
model, organisation and performance measurement. Imagine a company formulates a
strategy which includes the objective “sustainable growth in Europe”, the business model
would then define how the nine main components need to be adjusted to achieve the
strategic goal. For customers for example the company can either decide to focus on
drumming up new customers, increase sales with old customers or having a mixed
approach, which in turn might have an influence on the organisation. To increase the amount
of new customers it is likely that new sale staff needs to be hired. In the end the performance
measures such as company growth rate or the percentage of new customers on sales can
be used to measure and evaluate the achievements of the strategy and the business model.
3.2 Working Capital
3.2.1 The Concept of Working Capital
Definition of Working Capital
The concept of Working Capital is not new. Already in 1917, Lough said (in Meyer, 2007, p.
22):
“Sufficient working capital must be provided in order to take care of the normal
process of purchasing raw materials and supplies, turning out finished
products, selling the products, and waiting for payments to be made. If the
original estimates of working capital are insufficient, some emergency
measures must be resorted to or the business will come to a dead stop”

17
However since the latest financial crises in the end of the 1990s and 2008, it has become a
popular and necessary concept to improve a company’s financial situation (Chiou & Cheng,
2006).
WC can be considered as a collective term for short-term balance-sheet items (Meyer,
2007). Nevertheless a consistent definition of WC cannot be found in literature. There are
mainly two definitional distinctions of WC: Net Working Capital (NWC) and Gross Working
Capital (GWC). Schulte (2011) defines WC as GWC only including a firm’s investments in
current assets. This concept is based on the consideration that companies earn their profit
through investing their funds in fixed and current assets. Thus increasing overall investments
lead to an increase in WC (Chadamiya & Menapara, 2013). However the majority of authors
describe WC as NWC defined as current assets less current liabilities, which is a more
conservative view (see for example Heesen & Moser, 2013; Klepzig, 2014; Preve & Sarria-
Allende, 2010). By including current liabilities this concept describes how a company’s
investments in current assets are financed, which facilitates the drawing of conclusion
regarding a company’s liquidity (Chadamiya & Menapara, 2013).
This thesis follows the last mentioned approach and uses WC as a synonym for NWC and
therefore defines WC as current assets minus current liabilities. Current assets, like cash,
cash equivalents, inventory and accounts receivable are classified as assets that can be
transferred into cash within one year, whereas current liabilities are all liabilities that become
due within one year including accounts payable, short-term loan, dividends and interest
payable (Buchmann & Jung, 2014). Still there is a disagreement in literature which short-
term items should be allowed for WC considerations. The majority of authors concentrate on
the four main WC components, using the following method to calculate WC (Klepzig, 2014):
However Heesen & Moser (2013) for example argue that cash can be neglected because its
percentage on the balance sheet is minor. Since a detailed consideration of cash would go
beyond the scope of this thesis we will disregard cash as well and focus on the three main
WC items receivables, inventory and payables.
The level of WC differs from company to company. Factors influencing a company’s WC are
diverse. It depends on the type of business and industry (Berk & DeMarzo, 2013), as well as
the size of the company, the production cycle process, seasonal variations and plans
regarding a firm’s growth and expansion (Chadamiya & Menapara, 2013).

18
Since the WC components are part of the balance sheet it can be noted that having a
positive WC means the company has financed parts of the WC with long-term available
capital. Whereas a negative WC implies that some of the fixed assets are financed by short-
term available capital (Hofmann et al., 2011). A negative WC ratio is often a signal for a
company’s market power (Klepzig, 2014).
Working Capital Management
Based on these considerations working capital management can be defined as the steering,
planning and control of a company’s operative investments with the main WC components
cash, receivables, inventory and payables and its interrelation (Hofmann et.al, 2011). Its
objective is to ensure an optimal balance of each component which can be described as the
level where risk and efficiency is in balance (Jain, 2013, p. 178). A company’s operative
actions are only possible if the firm invests in WC. A sufficient level of cash is needed to be
able to react to unexpected expenditures. The same counts for raw material and finished
goods inventory to ensure a frictionless production and sales process. Additionally
companies have to cope with customers who not immediately pay after the delivery of the
goods (Berk & DeMarzo, 2013). These investments are financed by the short-term liabilities
of a company, mainly credits provided by suppliers (Preve & Sarria-Allende, 2010).
Top management is usually more interested in larger investments like property, plant and
equipment than in classical WC components, such as inventory, receivables and payables.
Inventories are typically in the responsibility of material disposal or production planning
whereas receivables and payables are part of the finance department’s responsibilities. This
shows on the one hand that only approximately 30 % of the assets are determined by the
top management (Klepzig, 2014). Hence using WCM as a strategic tool including it in top
management decision making brings along significant potentials. On the other hand it
demonstrates as well that WCM is a multilevel and department overarching task, which
might entail problems regarding conflicting goals of the involved departments (Klepzig,
2014).
The Cash-to-Cash Cycle
The most common tool to measure and control the effectiveness of WCM is the Cash-to-
Cash Cycle (CCC), which is also known as Cash-Conversion-Cycle. It represents the
timespan between cash outflow for raw material to suppliers and cash inflow for the delivery
of finished goods to customers (Hofmann et al., 2011).
Apart from the CCC, the operating cycle concept can be found in literature as a tool for
measuring WCM. However this approach is based on the definition of WC as GWC (Knauer

19
& Wöhrmann, 2013) and therefore not considering accounts payable. In the case that the
company’s raw materials are paid cash, the operating cycle is identical with the CCC, but in
today’s business this is quite uncommon (Berk & DeMarzo, 2013). Since this thesis is based
on the definition of WC as NWC, the operating cycle will be paid no further attention.
Figure 5: Cash-to-Cash Cycle (based on Nevris & Gebhardt, 2013 and Hofmann et al., 2013)
The purchase of raw materials leads to increases in inventory and accounts payable which,
depending on the payment conditions, is followed by a cash outflow to the supplier. During
production, raw materials are transformed into finished goods and therefore raw material
stocks decrease while finished goods stocks increase simultaneously. As soon as the
customer buys products of the company, the finished goods stock decreases and accounts
receivable increase followed by a future cash inflow (Meyer, 2007). Therefore three sub-
processes of the CCC can be identified: order-to-cash, forecast-to-fulfill and purchase-to-pay
(Klepzig, 2014).
The cash-to-cash cycle time is a measure related to the CCC concept (Hofmann et al.,
2011). Compared to the absolute measure WC, the CCC time is a relative ratio which
facilitates inter- and intra-firm benchmarking (Knauer & Wöhrmann, 2013). Stewart (1995, p.
43 in Farris, Hutchison & Hasty, 2005) explains this measure as the “average days required
to turn one dollar invested in raw material into one dollar collected from the customer”. It
considers the three main WC items represented by the three sub-processes calculated
through the measures: days payables outstanding (DPO), days inventory held (DIH) and
days sales outstanding (DSO) (Hofmann et al., 2011). The formulas to calculate the CCC,
DIH, DPO and DSO can be seen in figure 5.

20
Improvements of these three components lead to increases in WC and further subsequent
improvements which will be developed in the next section. According to Meyer (2007) the
value generation on the basis of the CCC depends mainly on the interaction of the level of
WC, its risk structure, opportunity costs for alternative investments and the industry and
business model of the company. Each industry has special characteristics which influence
the CCC and the level of WC as well as every WC item. Grocery stores for example usually
sell on a cash basis and therefore have a low DSO (Berk & DeMarzo, 2013).
3.2.2 Effects of Working Capital Management
Since the financial crises of the late 1990s and 2008, it has been noted just how significant
the impact of WCM is. Research has demonstrated that poor WCM can cause even
wholesome businesses with good operations and profits, to go bankrupt (Chiou & Cheng,
2006). It can be assumed that WC improvements have a significant influence on liquidity,
financing and profitability since European companies’ WC has an average amount of 12 %
of sales and 20 % of capital employed (Smid, 2007)
WCM and Liquidity
Even though WC as a measure is not a suitable indicator to evaluate companies’ liquid funds
(Chiou & Cheng, 2006), improvements in WC influence a firm’s liquidity situation directly
(Kim et. al, 1998; Opler et. al, 1999). Liquidity can be understood as a company’s ability to
pay the bills as soon as they come due (Sagner, 2011). Liquidity problems occur if there is a
mismatch between current assets and current liabilities, therefore having a high amount of
WC protects companies from getting illiquid (Bhattacharya, 2012). On the other hand having
a high amount of WC is related to opportunity costs. Funds invested in inventory, cash or
receivables could be used to pay debts or shareholder dividend instead (Berk & DeMarzo,
2013). Thus by reducing WC, opportunity costs can be minimized and liquidity is set free.
Hence WCM is about right-sizing. The company needs a certain level of WC to ensure
liquidity even in unexpected situations, but amounts above this level lead to inefficiency.
WCM and Internal Financing
Additionally WC improvements strengthen the internal financing capability of a company,
which is one reason why WCM got popular during the financial crisis. Companies’ limited
access to liquidity through external finance forced them to focus on internal financing options
(Nevries & Gebhardt, 2013). By reducing the assets tied up, capital is set free and the
financing need in general decreases. Consequently dependence on external financing
sources such as banks decreases as well, since financing can take place more and more
through the company’s cash flow. Thereby a company’s debt-to-equity ratio gets improved,
21
too, which leads to higher company ratings and the ability to raise credits more easily
(Schulte, 2011).
WCM and Profitability
Improvements in WC also have a multiple effect on a company’s profitability (Heesen &
Moser, 2013). The profit is measured through the income statement, which illustrates the
flow of expenses and revenues earned by the firm’s assets within one period (Berk &
DeMarzo, 2013). Since the main WC components (cash, receivables, inventory and
payables) are assets respectively liabilities, included in the balance sheet, changes affect
companies’ profit only indirectly.
From a theoretical point of view, positive as well as negative impacts on profit are
conceivable. On the one hand WCM can influence firms’ sales and thereby revenues.
Exerting a loose trade credit policy which enables the customer to check quality first and pay
later, may lead to higher customer satisfaction and loyalty and thus higher sales. The same
applies for inventories, assuming that a higher level of inventories reduces stock-outs and
thereby the loss of sales (Banos-Caballero et al., 2010). Hence from this point of view
decreases in WC would cause lower sales and profit.
On the other hand, WC improvements result in a reduction of companies’ financial need, as
examined in the previous part. Thus cost of capital decrease and as a consequence firms’
expenses do, too. Additionally, one could argue that lower inventory decreases the cost for
storage and by optimizing supplier and customer management within a WC project
administrative expenditures can also be reduced (Hofmann et.al, 2011). Thus from this
perspective WC improvements would bring about less expenditures and thereby a higher
profit.
These opposing effects of WC changes on profitability have been examined in numerous
empirical studies (see for example Deloof, 2003; Garcia-Teruel & Martinez-Solano, 2006,
Banos-Caballero et al., 2012). In general these studies provide evidence that WC
improvements positively affect a firm’s profitability, although the impacts are mainly driven by
improvements in receivables and inventories, payables can be neglected (Knauer &
Wöhrmann, 2013). Additionally Banos-Caballero et al. (2012) found out that WC and
profitability have a concave relation, meaning that WC improvements only lead to higher
profitability up to a certain level.

22
WCM and Company’s Value
Since modern business management is based on the shareholder value approach by
Rappaport meaning that all business activities should be adjusted to increase the company’s
value (Rappaport 1995, in Nevries & Gebhardt, 2013), WCM should also be reflected from
this point of view. Heesen & Moser (2013) as well as Hofmann et al. (2011) use the
Economic Value Added (EVA) concept to evaluate WC impacts on a firm’s value. EVA is a
measure of the residual income, which is based on the idea that the company’s value is
added as soon as all costs are considered (Heesen & Moser, 2013). EVA is calculated as
followed:
The net operating profit after taxes (NOPAT) is based on a company’s profit adjusted by
especially taxes. Based on previous explications, which provide evidence that profit is
positively affected by WC improvements, it can be concluded that NOPAT increases as well
since there is no coherence identifiable between WC and taxes.
WC improvements target to reduce inventories and receivables, thereby the current assets
decrease and the balance sheet is shorted leading as well to a reduction of the overall
capital. Apart from this the need for external financing decreases, as we have seen in the
previous section which brings about a reduction of costs of capital (Hofmann et al., 2011),
hence an overall decrease of the subtrahend of the formula. Therefore it can be assumed
that WC improvement leads to a higher EVA and thus company value.
3.2.3 Accounts Payable
Definition of Accounts Payable
Accounts payable are part of companies’ current liabilities. These include payments for
supplier invoices, salaries and other payments (Sagner, 2011). Accounts payable can be
viewed as financing free of charge to the firm (Arvidsson & Engman, 2013), that is provided
to a buyer by a seller. This type of financing will be provided to the company in proportion to
the operating level as long as it is a going concern (Bhattacharya, 2012). This can be a
significant source of finance for companies, which can be maximised through negotiating
longer payment terms with suppliers (Arvidsson & Engman, 2013).
Function of Trade Credits
The reason trade credit is widely used by companies can be explained by several theories.
Financing Theory states that trade credit provides benefits to the “lender” that financial

23
institutions do not have, therefore it will be less costly. Suppliers have the advantage that
they may be in a closer relationship with the customer, and can thus keep track of their
operations and creditworthiness in a better way. Furthermore, the supplier can more easily
repossess products and resell them through their network, in the event that the customer is
unable to pay. This can be seen as a reduced credit risk which leads to lower cost of capital.
In the event that a customer does not pay, the supplier can stop shipments that may be vital
to the customer, thus providing more incentive for the customer to pay. Furthermore,
Liquidity Theory states that larger firms are more likely to provide trade credit as they have
easier access to institutional financing. Firms having high levels of inventories are also more
likely to take advantage of more trade credit. Thirdly, Price Discrimination Theory states that
trade credit can be used as a substitute to competing through price discrimination when
there are legal or market restrictions to this type of discrimination. Then longer payment
terms can be offered as a type of price discrimination to compete in the market. Additionally,
Product Differentiation Theory also states that the use of trade credit can be a way to
differentiate a product in the market. At last, Market Power Theory indicates that trade credit
is mainly used to increase sales when using a push strategy (Bhattacharya, 2012).
Factors Influencing the Level of Payables
To increase working capital it is essential to manage payment terms. Factors such as net
days to pay invoices, possible discount rates and discount periods are all essential parts of
the payment terms. Many suppliers grant certain percentages of discounts if invoices are
paid within a certain amount of days. This can provide good opportunities for extensive cost
savings on large invoices. The amount of days the company has to pay the invoice and still
receive the discount will impact on the possibility to take advantage of the discount option.
Net days are the amount of days the company has to pay the invoice after the discount
period has elapsed, i.e. credit days given by the supplier to the customer (Hofmann et al.,
2011).
Objectives of Payables Management
Based on these considerations the objectives of payable management can be derived. The
better the payment terms for the company the higher the amount of payables and therefore
the lower the level of WC. Thus by negotiating better payment terms, such as higher
discounts for early payment or increased credit days the company can not only affect its
liquidity in a positive way but also improve the level of WC (Hofmann et al., 2011).

24
Centralized Negotiations and Strategy
Another important aspect is that if possible, the same payment terms for the same supplier
should be used throughout the company. Various business units may have different payment
terms for the same supplier, in this case the company may fail to take advantage of good
payment terms negotiated by one business unit as terms are not being negotiated for the
company as a whole. The purchasing department should have one database to verify all
payment terms for all units to ensure that benchmarking can be conducted to negotiate good
terms for all units. The same should also be done for discount rates and discount period
used to ensure the highest possible discount is achieved throughout the business. Having a
centralised purchasing department may have positive effects on the processes and
organisation of payment terms (Hofmann et al, 2011).
An important strategic decision to be made is whether negotiations should be made to
extend the amount of days that the invoice should be paid within, or if the highest possible
discount should be obtained for early payments. Which decision should be made depends to
a great extent on the industry the company is operating in. This decision will have long-term
effects on the company’s WC. Whatever payment-term-strategy is decided upon, it must be
communicated to all relevant personnel, such as the purchasing department, accountants,
controllers and the legal department (Hofmann et al., 2011). Furthermore, the terms should
be included in relevant documentation such as “General Terms and Conditions of
Purchasing” (Hofmann et al., 2011, p. 27).
Establish Payable Policies
Furthermore, it is important to establish payables policies that apply to all staff. In most
companies, payables clerks or payables accountants handle the payables invoices, and
many decisions are left to their discretion. Therefore it is important to communicate what
policies apply. It is also essential to establish when invoices are to be paid, i. e. if they are to
be paid on the due date or a certain amount of days after the due date. Paying late will give
the company a significant amount of further free financing; however, it may lead to poor
relationships with suppliers (Sagner, 2011).
Process Optimization
Internal processes should be as efficient as possible to ensure discounts can be taken
advantage of if this is desired (CFERF, 2013). The time the invoice needs to process
internally should be considered when negotiating payment terms. It must be ensured that the
invoice will have enough time to go through the internal processes from receiving the
invoice, to booking, approval and payment. If it is not possible to get the invoice through the

25
system in a certain amount of time, there is no point in negotiating discounts that can only be
obtained if the invoice is paid within a fewer number of days than it takes to get the invoice
through the system (Hofmann et al, 2011). It may be worthwhile reviewing this internal
process as well, to ensure maximum efficiency. Additionally the company should only have
as many payment runs as needed, e. g. every week. The actual number depends on the
industry and country (Buchmann & Jung, 2014) as well as the efficiency of the internal
processes. There should also be a good approval process in place to avoid paying incorrect
invoices. This process should also ensure that the goods have been received and that the
invoice is matching the order (CFERF, 2013). Invoices for goods that do not meet quality
standards etc. should be delayed (Buchmann & Jung, 2014).
Measurement of Accounts Payables
Furthermore it is important to follow up and measure the number of credit days the firm has
with all vendors. This step is important to verify if the company is reaching its targeted
payment terms. It is also important to follow up on how many invoices are paid after the due
date, in order to review how much liquidity comes from paying too late. These
measurements can also be used for training purposes within the purchase to payment
process and for the purchasing department so that these processes can be further improved
(Arvidsson & Engman, 2013).
3.2.4 Accounts Receivables
Definition Accounts Receivables
Receivables or accounts receivable can be defined as assets a company owns as a
consequence of selling goods or services including providing a credit for the customer. If the
company would sell the products directly for cash, payment would be received immediately,
thus no receivables would be created (Bose, 2010). Therefore the account receivable
amount in the balance sheet represents company's claims based on contracts where the
company's task is already fulfilled but the contract partner’s debt is still due (Mayer, 2007).
Compared to other assets receivables have a low risk, since payment default can be
calculated on the basis of historical experience. However increases in international
receivables usually lead to an increase in overall risk, because it is difficult to evaluate
foreign credit status (Mayer, 2007).
The credit policy is a key success factor determining the level of receivables. To establish a
credit policy companies need to discuss mainly three issues. Firstly the credit standard
which determines who is getting a credit, e.g. everyone who applies or should a selective
26
criteria be used? For both cases it is important to evaluate the credit risk for each customer
since this directly affects the level of tied up capital in receivables. After that, the credit terms
need to be established, including decisions regarding the length of the period before a
customer has to pay and the offer of a discount for early payment comprising the discount
percentage and period. Finally the establishment of a collective policy determines how the
company wants to deal with customers paying late. Options range from doing nothing to
sending out a reminder letter or threatening to take legal actions (Berk & DeMarzo, 2013).
Functions of Extending Trade Credits
The theories explaining the existence of trade credits have already been discussed in the
previous chapter. That’s why we will focus only on the relationship to customers in this
chapter. A survey by Jain (2013) indicates that the main reason for extending a credit is to
increase sales, which was stated by two thirds of the interviewed companies, followed by the
objective to match the credit term with competitors to achieve a competitive advantage.
Therefore receivables management can primarily be seen as a marketing tool, which is used
in a competitive environment to increase customer satisfaction and sales (Long et al. 1993;
Cheng & Pinke, 2000 in Jain, 2013) and as a consequence enhance profit (Bose, 2010).
Costs Related to Trade Credits
However the more credits are granted to customers the higher the level of receivables and
costs related to that. There are mainly four types of costs related to the extension of trade
credits: the costs of capital, administration, collection and defaulting costs. Costs of capital
result from the fact that money spent for a trade credit is tied up and cannot be used for
paying own obligations. Thus if the company does not have sufficient resources it might
have to raise funds from outside the organization which is then related to additional costs of
capital (Bose, 2010). Additionally the administration costs increase since staff is needed to
arrange the trade credits and provide investigations regarding customer’s credit status
(Chadamia & Menapara, 2013) as well as the cost of collections. For example the company
might have to send payment reminder to customers or even take further steps such as legal
actions (Bose, 2010). Although the risk of receivables is quite low compared to other assets
(Meyer, 2007), it happens that customers do not pay their debt. In this case defaulting costs
occur meaning that the company has to write off the so called bad debts (Bose, 2010).
Factors Influencing the Level of Receivables
The extension of credits varies from industry to industry based on competitiveness and
monetary conditions (Preve & Sarria-Allende, 2010). The size of receivables is mainly
influenced by the sales level and credit policy. The higher the sales the higher is the level of

27
receivables within one industry. This fact can even be used to forecast the amount of
receivables. If a company for example wants to increase the sales by 20 %, receivables
certainly will increase by 20 % as well. Apart from sales, the credit policy is the main factor
influencing the level of receivables. It includes different parameters like the length of the
credit period, the quantity of credit granted or the size of discounts. (Bose, 2010)
Objective of Receivable Management
Based on the previous considerations, management of receivables must be balanced
between the marketing and finance strategy (Klepzig, 2014), meaning weighting the benefit
of extending customer credits and costs. Thus the main issue can be classified as finding the
optimal investment level in receivables, which is the point where the return on investment in
future funding receivables is lower than the cost associated with financing the additional
capital (Bolten, 1976). Or like Bose (2010, p. 212) defines the optimum level as: “the level
where there is a trade-off between costs and profitability”. A liberal credit policy leads to
growth in sales and profit as well as increases in receivables and thereby to higher risks of
bad debts and higher costs. A strict credit policy on the other hand results in lower sales and
profit but also lower risk and a decrease in liquidity. Thus the optimum between these two
trends needs to be met (Bose, 2010).
Measurement of Receivables
To evaluate whether the optimal credit policy has been found and is working effectively,
companies should frequently analyse and monitor the accounts receivable (Berk & DeMarzo,
2013). One measure that is frequently used is accounts receivable days, which represents
the average number of days a company needs to collect its sales (Bose, 2010). It equals the
DSO measure which was already introduced in Chapter 3.2.1. By comparing DSO with the
company’s payment agreements within the credit terms, a prediction regarding the
effectiveness of the credit policy can be made. If the company agrees with its customers
about 30 days as a period to pay, but DSO is 40 days it can be derived that on average
customers are paying 10 days later than they are supposed to (Berk & DeMarzo, 2013). This
knowledge is helpful to predict receivables in the future (Bose, 2010) and thereby enable a
more accurate cash flow planning. Additionally it can also be used for benchmark purposes,
for example observe the company’s trend in receivables or compare them with main
competitors (Berk & DeMarzo, 2013).
Apart from this, the aging schedule of debtors is frequently used in practice (Jain, 2013).
This method follows the expectation that the longer the overdue the more likely it is that the
invoice will never be paid (Sagner, 2011). Within this method the accounts are sorted and

28
grouped by the number of days outstanding, which can be done either based on the number
of accounts or the value outstanding (Berk & DeMarzo, 2013). As a result we get for
example four groups: 1-30 days outstanding, 30-60 days past due, 60-90 days and more
than 90 days overdue (Bhattacharya, 2012). If the percentages of the last two groups
increase the company should check its credit policy (Berk & DeMarzo), since the risk for bad
debt increases as well.
Process Optimization
Issuing correct invoices is essential if the company wants to receive payments on time. The
reason customer invoices are incorrect may sometimes be related to problems with internal
processes, and may have nothing to do with the finance function. Whenever there is a high
rate of incorrect invoices, the company should look at the entire process to establish the root
cause of the problem. Employees in other business units than finance may not realize that
their internal processes are causing problems within the area of WCM, therefore
communicating this problem is vital. Any issues with incorrect invoices could also lead to
customer frustration, which may impact the relationship with the customer (CFERF, 2013;
Buchmann & Jung, 2014). To improve the receivables process it is therefore essential to
invoice the customer as quickly as possible, as any delay will impact WC (Buchmann &
Jung, 2014). Furthermore, it is essential to have standardised processes, e.g. of how you
deal with the collections process, and the processes should be automated as much as
possible. Such best practice processes will also help ensure that problems are detected and
can be corrected. Automating processes, will save time which employees can spend on
more productive tasks and it will lead to more interesting job tasks, which in turn will motivate
staff. Staff can then ensure higher level objectives are met. (Cotis, 2004).
Monitoring and Controlling
Companies must make sure they track their receivables in a timely matter. This will also
contribute to avoiding revenue leakage through bad debt (Cotis, 2004). The collection
process should be proactive, and calls can be made to customers before invoices fall due. In
this case the call can be seen as a courtesy call checking if all is correct with the invoice,
and any issues can be resolved in a timely manner to avoid delayed payments. The
company can also conduct analysis of their customers to keep track of customers often
paying late, courtesy calls and reminders or statements can then be sent out before the
invoice is due for payment (CFERF, 2013; Buchmann & Jung, 2014). The most efficient way
to ensure timely payments by customers is to establish a direct debit scheme (Buchmann &
Jung, 2014). Metrics such as weighted average days to receive payments can be tracked
and used as a measure of performance. Any discounts given to customers for early payment
29
should be tracked to ensure the customer paid within the number of days both parties
agreed on, if not the discount should be collected from the customer. Furthermore, credit
limits to customers should be monitored to ensure appropriate credit limits are given, and
any indication of financial issues with the customer should lead to a revision of this limit
(CFERF, 2013). Renegotiating customer payment terms is also a way to improve WC,
however, the relationship with the customer and their bargaining power must be considered
(Buchmann & Jung, 2014).
External Options to Manage the Trade Credits
Considerations regarding the financing of the receivables until maturity should be made as
well as how to bear default risks. Except for managing the receivable process internally, the
company can establish a finance subsidiary to deal with it, purchasing credit insurance or
using factoring (Mian & Smith, 1992). Factoring means that the company sells its right to
collect the receivables to another company, which has the advantage that the company gets
cash immediately (Preve & Sarria-Allende, 2010). However it might also have some
disadvantages regarding the company’s image. Factoring can also be rather expensive, with
interest rates of as much as 25 - 54 % annually. There might also be additional set up costs,
such as employee training and suitable system set up with the factoring company (Hofmann
et al, 2011).
3.2.5 Inventory
Definition of Inventory Management
Inventories can be defined as physical items, which are stored for future sale or use. They
are either purchased or created through production (Swamidass, 2000) and one can
distinguish between raw materials, consumables as well as auxiliary, finished and unfinished
goods (IAS 2.4). Usually there is an imbalance between the demand of an item either for
consumption or sales and the supply because of economic, technical, social or natural
forces (Muckstadt & Sapra, 2010). That is why inventory is needed to compensate the
imbalance and ensure a trouble-free business cycle. Therefore it is important to understand
that inventories are a consequence of actions or policies rather than the cause, which means
that inventory is a dependent variable and not an independent one (Muckstadt & Sapra,
2010). With an average share of around 35 % inventory is the largest of the four WC
components. Additionally approximately 13 % of company’s sales volume is tied up in
inventories and especially in industrial and trading companies the costs of inventory account
for 13-22 % of total costs (Hofmann et al., 2011). Thus efficient and effective inventory

30
management can have a significant influence on company’s WC situation as well as liquidity
and profitability (Jain, 2013).
Inventory management can be defined as the planning, steering, classification and control of
inventories (Hofmann et al., 2011) and the actions and policies which influence the stock
level. By having a look at the CCC, inventory management can also be understood as the
procedural link between payables management and receivables management (Meyer,
2007). Haley & Schall describe this task through a metaphor: “Managing the level of
investment in inventory is like maintaining the level of water in a bath-tub with an open drain.
The water is flowing out continuously. If the water is let in too slowly, the tub soon gets
empty. If the water is let in too fast, the tub overflows” (Haley & Schall, 1963, p. 500 in
Chadamiya & Menapara, 2013). Hence inventory management is about finding the ideal
level of stocks which is the optimum between the benefit of holding inventory and minimizing
costs related to the hold of inventory.
Functions of Holding Inventory
Holding inventory can have different functions. Firstly cost reductions function: ordering the
demand on a daily basis leads to smaller lots and higher prices (Brealey, Myers & Allen,
2011). By bundling the lots and thereby increasing the inventory the company can achieve
lower procurement costs through volume rebates, lower fixed ordering costs and better
conditions in transportation (Hofmann et al., 2011). Secondly the security functions including
a number of non-calculable risks like failure of machines or delivery difficulties by a supplier
(Hofmann et al., 2011). In such cases inventory can help to ensure a trouble-free production
and prevent stock-outs of finished goods. If a company cannot deliver demanded products it
risks loss of sales and customer dissatisfaction. Thus especially in a high seasonality driven
business, finished goods stocks are needed to meet the customers demand (Berk &
DeMarzo, 2013). This is also related to a third function the reducing of delivery periods. A
higher level of inventories facilitate to meet customer requests better and faster (Hofmann et
al., 2011). Apart from this a high level of inventory improves the operational efficiency and
effectiveness. The start of production is always related to costs and additional work. Thus
the higher the inventory and therefore the longer the production can run without stopping,
the lower the costs (Kumar & Ganguli, 2009). Additionally inventories can be held for
speculation purposes, which are especially found with raw materials. If a company expects
increases in market prices or changes in exchange rates, which have a negative impact on
prices, it can be reasonable to purchase the raw material and thereby increase the
inventories for compensation purposes (Hofmann et al., 2011). Finally in the case of some
products stocking is part of the production process and has a finishing function. For example
31
wine or cheese which is stored until a certain level of maturing is achieved (Hofmann et al.,
2011).
Factors Influencing the Level of Inventory
On the basis of these functions, the factors influencing the quantity of inventory can be
derived. One of these factors is the predictability of sales and production. The higher the
volatility the more inventories are needed to ensure ability to supply. Additionally the nature
of the product and the make span as well as the industry and agreements with customers
and suppliers are of concern. A company producing dairy goods usually has a lower level of
inventory because of the risk of perishability than a jeweller who wants to offer a choice to
his customers and therefore has a higher level of inventory (Arnold, 2008).
Costs Related to Inventory
This shows that holding inventory brings along a number of benefits, however it also involves
additional costs. Inventory can be considered as an investment which is in competition with
other assets for limited financial resources (Meyer, 2007). Compared to other assets,
investments in inventory do not earn any money in terms of interests (Brealey, Myers &
Allen, 2011). Consequently holding inventory entails opportunity costs which can be
determined by the calculatory interest (Hofmann et al., 2011). Additionally the costs for the
warehouse increase with a higher stock level due to the use of technical facilities,
warehouse infrastructure and personnel. The extent to which cost increase depends on the
company’s type of inventory as well as the degree of centralization, the higher the
centralization the lower the costs (Hofmann et al., 2011). The company also needs to
consider the insurance costs, the higher the value on the stocks the higher the risk thus
costs for inventory insurance (Arnold, 2008). Apart from costs of inventory, risks should be
considered such as theft, damage or a value loss in the case of a short product-life-cycle
(Hofmann et al., 2011). These costs of holding capital need to be contrasted with the costs
of a low inventory namely reordering costs, stock-out costs as well as a drop in sales and
profit (Arnolds, 2008).
Objectives of Inventory Management
To sum up, inventory management therefore can be described as managing two conflicting
parties. On the one hand the investments in inventory should be minimized to decrease
costs related to inventory, on the other hand the demand for raw materials, auxiliary and
finished goods of production and sales need to be satisfied. Thus the objective of inventory
management is to find the balance between benefits and costs associated with holding
stocks (Jain, 2013). However inventory management is an integrated system which means
32
that it cannot be considered independently. It is directly linked to production, warehousing,
purchasing, finance, marketing and sales (Bhattacharya, 2012). As mentioned earlier each
of this functional area pursues its own objectives which can have distinct implications for the
level of inventory (Meyer, 2007). Therefore policies regarding the level of inventory should
be agreed upon in a team or an inventory manager who deals with this topic should be
employed (Bhattacharya, 2013).
Measurement of Inventory
To ensure long-term inventory improvements, measures regarding the level of stocks and
stock coverage should be monitored and controlled frequently for example through a
monthly performance reporting. It needs to be assured that the costs and benefits related to
the holding of inventory are balanced (Jain, 2013). A measure frequently used is the
inventory turnover which is similar to DIH and therefore presents the average days inventory
stays in stocks (see chapter 3.2.1). One of the variables that needs to be considered as well,
is the optimal lot size, which is the quantity where the delivery and handling costs and costs
of carrying the inventory are at a minimum (Chadamiya & Menapara, 2013).
Apart from the optimal lot size the safety stock levels should be planned and appropriately
adjusted. Safety stock is needed to decrease the out-of-stock risks arising through for
example delivery problems of the supplier, faulty deliveries or uncertainties in the demand
(Hofmann et al, 2011). It can be calculated by weighting the cost of holding additional
inventory and the stock-out costs (Arnold, 2008). The lower the risks the less safety stock is
needed. Thus a more advanced demand planning accuracy can be helpful to reduce safety
stocks. If the safety stock of a company is too high, a reduction can contribute to decreases
in total inventory and carrying costs (Hofmann et al., 2011).
Another variable which can help to improve the inventory situation through process
optimization is the procurement time, which is defined as the timespan between the
occurrence of a demand and the final availability of the article at the place of demand. The
lower the procurement time the higher the flexibility of a company in cases of changed
conditions and the less inventory in form of safety stock is needed. To reduce the
procurement time the internal decision process need to be accelerated as well as
possibilities such as online platforms or the choice of traffic carrier should be evaluated.
(Hofmann et al., 2011)
Process Optimization
To improve the level of inventory a company’s total supply chain should be considered. In
this case forecasts of the future demand, which can be understood as an estimation of the

33
average demand for a certain period, are of concern (Axsäter, 2006). The more accurate
sales are forecasted, the lower the level of safety stock can be and the better production can
be planned to facilitate lower finished good stocks. Therefore forecasting and planning
accuracy should be improved.
Other variables in the process which influence the level of inventory are the delivery point in
time of raw materials from suppliers and the time of delivery of finished goods to customers.
Both can be improved by Incoterms and diverse delivery models. An example of such a
delivery model is the just-in-time concept where “materials and work in progress are
delivered just before they are needed and finished goods are produced just before being
sent to the customer” (Arnold, 2008, p. 548). Just-in-time manufacturing manages the total
material flow of the production. This concept looks upon inventory as waste since it does not
provide any value for the product. Hence the aim is to drive inventory to zero which is only
possible if the systems works reliably. To make that possible the commitment of the whole
organisation as well as all suppliers towards the delivery of high quality is needed
(Bhattacharya, 2012).
Improvements in the Balance Sheet
Apart from the previous mentioned concepts which focus on the reduction of inventory and
costs through improvements in the process of the value chain, inventory can be reduced in
the balance sheet by changes in the inclusion of the stock (Klepzig, 2014). According to IAS
framework an “asset is a resource controlled by the entity as a result of past events” (IAS, F
4.4(a)). Therefore inventory has to be included in the balance sheet as soon and as long as
the company can control it which can be arranged within agreements with suppliers and
customers. The goal is to gain the control of purchased goods as late as possible from the
supplier and pass on the control of finished goods as early as possible to the customer.
Thereby the inventory level in the balance sheet can be reduced (Klepzig, 2014).

34
4 Framework for the Relationship of Business Model and
WCM
After reviewing the literature regarding business model and WC the main part of our thesis is
following. In this section we will develop, on the basis of literature, a framework linking the
choice of business model with WCM and external factors influencing both.
4.1 Contingency Factors
Based on contingency theory there is no generally applicable way to structure an
organisation. It must fit the contingencies and thus the external environment (Donaldson,
2006; Williams, 2008). It can be assumed that this is also true for the design of a business
model.
As main contingency factors in our case we can identify company’s financial environment,
competition and customer’s as well as supplier’s bargain power, which influence some of the
business model’s components and therefore WCM, as can be seen in the figure 6.
Figure 6: Contingency Factors, Business Model and the WC Components
Financial environment
A contingency factor influencing the business model as well as WCM is the company’s
financial environment (Chiou & Cheng, 2006) which to some extent has already been
discussed in Chapter 3.2.2. During the last financial crises the costs of debt increased

35
significantly plus financial institutes allocated credits only restrictively. Therefore companies
had only limited access to external finances and needed to find other ways to finance the
business. In this case WCM can be seen as a tool to improve internal finance and decrease
the dependence on external financial investors (Nevries & Gebhardt 2013). However using
this tool might also influence the business model. For example introducing just-in-time
delivery not only leads to reductions in inventories but also changes the relationship between
the company and its suppliers, which should not be neglected.
Bargain Power
The bargaining power of a company in relation to its suppliers and customers depends on
the type of product and the number of suppliers. That is, whether it is a commodity product
with many suppliers or if it is a special product with only a few suppliers available (Hofmann
et al., 2011). The contingency factor bargain power directly influences and designs some of
the business model components such as partnership, customer segment and customer
relations. Additionally it can be argued that it affects the company’s WCM. The higher the
bargain power the better is the basis for negotiating payment terms which in turn influence
the level of WC.
Competition
Based on Porter’s approach, competition consists of “Five Forces” namely threat of entry,
availability of substitutes, customer’s and supplier’s bargain power and the competitive
rivalry. The threat of entry in a market depends on the height of entry barriers, which are
advantages that incumbents have in comparison to new entrants (Porter, 2004). A high
amount of substitutes leads to a stronger competition. Bargain power has already been
discussed in the previous section. The intensity of competitive rivalry is the last of Porter’s
five forces which determine the competitiveness of a market. It is greatest if there are a
number of competitors which are equal in size and power, industry is growing slowly and
products and services are nearly identical (Porter, 2004).
The level of competition directly influences the design of the business model for example
through the arrangements within the customer, partner and value proposition components.

36
4.2 Relationship between WCM and the Components of a Business
Model
4.2.1 Value Proposition and WCM
Value proposition can be classified as the company’s product and service portfolio
(Weinhardt et al., 2011), which includes all technical and functional features that provide a
benefit to the customer (Meffert, Burmann & Kirchgeorg, 2011). A competitive advantage
can be achieved by offering the customers a greater value by providing a lower price or
more benefits that justify a higher price for the product (Kotler et al., 2008). In general these
two approaches can be considered regarding value creation (Besanko et al., 2013), which
lead to significant implications for the rest of the business model (Osterwalder & Pigneur,
2010) and influence the level of WC. A company can either focus on cost leadership,
meaning selling the same product as its competitors but for a lower price or supply
differentiated products for which the customer is willing to pay more (Grant, 2008). Both
concepts lead within the same industry to different business models and value propositions.
Depending on the choice of approach WCM might focus on different issues as well.
For a cost leader it is mainly important to gain a competitive advantage by providing low
prices (Grant, 2008). Therefore we assume that the company’s cost structure is of
significance, which leads to the assumption, that WCM might be more relevant, since a
balanced level of WC leads to cost reductions.
Figure 7: The Relationship of Value Proposition and WCM

37
In contrast, for a company focusing on differentiation, WCM can be assumed to be less
relevant. Due to highly differentiated products the inventory level should be higher because
of the larger amount of stock keeping units (SKU) in raw material and finished products.
Additionally differentiation can be strengthened by providing higher quality and/or a better
service, thus customer orientation and relationship might be in the focus as well, which could
lead to the fact that receivables are higher due to more customer friendly payment terms or
less strict follow up of overdues. Our suggestions are summed up in figure 7.
4.2.2 Customer and WCM
The relationship between customer and WCM is mainly driven by the relation of bargain
power and dependence between the company and its customers. We argue that the higher
the customer’s bargain power compared to the company’s bargain power, the higher the
level of receivables and inventory. Through pressurizing the company, the customer might
be able to concede better payment terms and demand for example just-in-time delivery
which leads to a higher level of receivables and inventories for the company.
Figure 8: Relationship between Customer and WCM
A second factor which should not be neglected from our point of view is the dependency,
which is subjected to the number of customer and their percentage on company’s sales. The
lower the number of customers and therefore the higher the share of sales for each
customer the more the company depends on the single customer. A retailer for example has
a lot of distinct customers whereas a supplier within the car industry usually has only a few
powerful customers hence the retailer can relinquish of one of its customers but for the
supplier it might lead to bankruptcy. Thus it can be assumed the higher the dependency on
the customer, the more likely it is that the company admits better payment and delivery

38
terms which then lead to a higher level of receivables and inventory. The relationship
between customers and WCM is illustrated in figure 8.
4.2.3 Channels and WCM
Different kind of customer markets or channels can be distinguished (Kotler et al., 2008)
whereby the most common business models are built either on a business to consumer
(B2C) concept or a business to business (B2B). The customers within a B2C model are
“individuals and households that buy goods and services for personal consumption” (Kotler
et al., 2008, p. 182) whereas customers in a B2B model are other companies that purchase
the goods or services to use for processing in production (Kotler et al., 2008). Within a B2C
business trade credits usually can be neglected, companies get paid in cash directly or only
have short payment terms; therefore the level of receivables should be quite low. Compared
to the B2B concept where trade credits are daily fare which directly influences the level of
WC. This estimation can be supported by a study of German companies, which show that
the average time allowed for payment in a B2C market is 15 days but in a B2B market 30
days are common on average (Hofmann et al., 2011). However disregarding other factors, it
can be argued that receivable days for companies on average should be around 30 days in
Germany no matter if they are acting in a B2B or B2C environment since in both cases their
suppliers are acting as well in a B2B market. This would lead to the fact that B2C firms have
a lower receivable less payables ratio than B2B companies. By assuming the level of
inventory is similar this means that the B2C model leads to a lower level of WC.
Figure 9: The Relationship between Channel and WCM

39
However B2C firms tend to have higher stocks due to high volatility and a lower possibility to
plan the sales accurately. B2B companies usually have long-term contracts with its suppliers
and therefore more detailed knowledge about planned sales volume, which leads to the fact
that more accurate planning is possible and less stock are needed. Consequently there are
two opposing effects, which tend to be different weighted from industry to industry. Our
suggestions regarding the link of channel and WC can be seen in figure 9.
4.2.4 Customer Relations and WCM
Regarding customer relations one can distinguish between a long-term or short-term focus
(Peters et al., 2013). We assume that a company focusing on a long-term customer
relationship might not pressurize its customers for better payment and delivery terms even if
it had the bargain power to do so. In this case customer relation should be more important
than WC improvements.
Figure 10: Relationship Customer Relations and WCM
As can be seen in figure 10, another factor influencing the link between WCM and customer
relations is the company’s motivations namely acquiring new customers, customer retention
or growth in sales (Osterwalder & Pigneur, 2010). If a company wants to attract new
customers or achieve sales growth, it might use trade credits or delivery options such as
just-in-time concepts as a marketing tool. Therefore we assume that in this case the level of
receivables and inventory increase.
4.2.5 Partnerships and WCM
Regarding WC the partners of highest interest are the company’s suppliers. As factors
influencing the WC level within such a partnership or network, the place and the bargain

40
power in the supply chain can be suggested. It can be assumed that, the closer the company
is at the beginning of the value chain and the more powerful actors compared to the
company, are included in the value chain the higher is the level of WC. The higher the
bargain power the more likely the company puts pressure on payment and delivery terms
which is then passed along the value chain. Therefore we assume that a company with a
high bargain power compared to its suppliers has a higher level of payables and likely lower
stock.
Figure 11: The Relationship between Partners and WCM
Apart from the bargain power the dependency on a supplier or partner should not be
neglected. If there are a high number of suppliers who are able to deliver the raw material in
the demanded quality, the dependency is low compared to the case where there are only
one or two suppliers. Thus no matter how high the bargain power of the company, if it
strongly depends on the supplier the company might not demand better payment and
delivery terms to ensure the supply of the raw material. To the contrary if the supplier is
aware of his position it might demand better payment and delivery terms. Our suggestions
are summed in figure 11
4.2.6 Key Activities, Key Resources and WC
Regarding these components we can draw a link between WC and the company’s financial
resources. We assume for a company which has a significant level of financial funds, WCM
is of less concern than for a company having trouble to get financial funds. In the latter case
the company may use WCM as a tool to strengthen the internal generation of liquidity and
become more independent of external funds (see also Chapter 3.2.2). The following figure
presents our assumptions.

41
Figure 12: The Relationship between Financial Resources and WCM
4.2.7 Cost Structure and WC
WCM has a direct and significant influence on the company’s cost structure, as we have
already discussed in Chapter 3.2.2. Therefore WCM can be understood as a tool to reduce
costs. However the effect on the revenue structure is less obvious. Only if the extension of
trade credits or the offer to provide special delivery option like just-in-time is used as a
marketing tool to acquire new customers or generate a sales growth a link can be found.
Thereby an increase in the level of receivables and inventory would lead to higher revenues,
but also to higher costs. Thus it should be considered that revenue is higher than the
additional costs to be able to generate profit.
Apart from these considerations, we can see that changes in the business model
components indirectly influence the cost structure of the business model as well. That is
caused by the fact that as soon as the level of receivables or inventory increases, the overall
costs, like for example opportunity costs, administration cost or holding costs, increase also.

42
5 Case Study
5.1 The Company’s Business Model
The company is a global organisation, which is then divided into various geographical
clusters and markets. In Sweden there are many companies that belong to the Swedish
entity. These include packaging solutions, processing solutions, processing components,
technical service, a market company for the Swedish market, and a support company that is
providing services such as business support, IT services and financial services for the
Swedish entities mainly.
The company has two main business areas, packaging solutions and processing solutions.
Within the two business areas there are slightly different business models. In the packaging
solutions area the business model is based on packaging material and filling machines,
which means that the business is based on goods that have a high turnover. The processing
solution area on the other hand is responsible for producing machines for processing e.g.
dairy products such as ice cream and cheese. Since the company can only sell a certain
number of machines and a certain amount of after-service, the sales of packaging material
can be considered more important.
Due to Competition law the company had to change their business model slightly in the past
few years. Therefore some business areas had to be separated.
In Sweden most of the company’s sales are to other internal companies. The production
companies sell their products to market companies in various countries that are then
responsible for selling the goods to external customers in that country. There is only one
market company in Sweden, which is responsible for sales to Swedish customers. These
figures are consolidated into the annual report of the Swedish companies. Most other goods
are sold to internal customers in other countries.
The main competitors for the whole liquid foods market is plastic and glass bottles. If the
market is segmented based on carton packages the main competitors include Elopak, SIG
Combiblock, and Greatview Aseptic, which is a non-systems supplier. Non-system suppliers
can be classified as suppliers delivering packaging material to customers which is then used
for machines built by other companies. The competitors within the non-systems suppliers are
increasing rapidly in size and numbers.

43
5.2 Differentiation Strategy
The company is pursuing a differentiation strategy, but also aims to be competitive on cost.
One interviewee stated that,
”We want to differentiate ourselves against our competitors. The way that we
are working on differentiating is on the product portfolio, we want to come up
with new products, new shapes and other kinds of features” (Director Business
Control, Development and Service Operations).
Furthermore, the company’s strong environmental policies also differentiate them in the
market. They do significant work in order to reduce their carbon footprint and work to ensure
that their carton products are certified through e.g. the Forest Stewardship Council (FSC).
This means that they have to ensure their suppliers are producing paperboard in a
sustainable way.
The company delivers, amongst other things, high quality machines for food processing and
packaging. These machines are often at the customer’s site for a significant amount of time,
often between 20-30 years. Another way to differentiate is through high quality service. If
there is any problems with the machines or if they break down, the company will ensure that
they are repaired within a very short time frame. An interviewee stated,
“To give an example, let’s say a customer within the dairy industry; they get
their order in the evening, of what to deliver the next morning. They have
about twelve hours to produce. So if the machine is standing still they are
failing to deliver. Therefore it is very critical that we can be fast in fixing
machines, and we have to have spare parts available and deliver in short
notice” (Director Business Control, Development and Service Operations).
5.3 Customers
There is currently a mix of small and large customers, but the main volumes are sold to
large, often global, customers. The business environment has changed significantly over the
last ten years. Previously there were more small customers, but now there is a much smaller
amount of customers that are very large. This has significantly increased the bargaining
power of the customers, who are becoming much more powerful. It is more difficult for the
company to negotiate. The company is now more regarded as a supplier amongst many
others.
Additionally the company’s customers are experiencing high pressures due to intensified
pressure from their customers on pricing as well as very short lead time, and increasing

44
prices from their raw materials suppliers and delayed payments from retail chains, that are
often delaying payments to their suppliers for up to 120 days. Furthermore, many public
companies, are also delaying their payments in order to present better figures for their book
closings and annual reports.
The company has close, long-term strategic relationships with many of its customers, both
on global, international and regional levels; one reason for this is the long life of the
machines. The main motivation for customer-relation is growth together with the customers.
It was stated that,
“Our operations are focused on growth, trying to grow our business in terms of
getting new customers, or even more focused on trying to increase the
business of our existing customers, because if our customers are growing, we
are growing with them” (Director Business Control, Development and Service
Operations).
5.4 Receivable Management
Within the Swedish entities of the company WCM is not a priority, due to the fact that most
sales are done to internal customers. However, within the marketing company there is
significant focus on receivables, especially overdues. Although payment terms are not a
focus within negotiations with customers, as long-term relationships with customers are of
higher importance. The standard payment term is 30 days. The main focus of the company
in relation to receivables is on overdues. If the total receivables are increasing, but the
overdues are decreasing it is a good sign that the company is doing more business with the
customers. As growth is one of the main strategic objectives, that is a very good indicator.
Aging reports are followed up continuously to ensure overdues are not increasing and the
risk of write-downs is kept to a minimum. If an invoice is more than 180 days overdue, the
company will make provisions for write-downs of 50%, and more than 360 days provisions
for write-downs is 100%. The company has credit policies to assess credit risk and payment
terms. There is also a credit committee that decide on what actions to take on overdue
invoices.
The company is trying to get customers to use Direct Debit; this will give the customer a
discount, which is a rather favourable interest rate for the customer. Direct Debit means that
the company will collect the payment directly from the customer’s account, and thus receive
payment two to three days after the invoice is created. This way the company is aiming to
arrange good financing solutions for their customers. The customers can take advantage of

45
the discounts given by early payment, through Direct Debit, and use that money on factoring
solutions with their bank to be able to benefit from longer payment terms as well.
5.5 Suppliers
There are two main categories of supplies. The first is direct material, which includes all the
raw materials that is purchased, where the most significant material is paperboard, which is
consumed for packaging material. The group manages these suppliers centrally. The
company is a significant customer to suppliers of paperboard. However, the paperboard as
such is not a very big business compared to the total market for these suppliers. Therefore
the bargaining power is rather restricted. Furthermore, there is also other direct material,
which includes machines and spare parts purchased from external suppliers. This is done by
the Swedish entities. The supply chain operations are responsible for these purchases, as
many of these supplies are purchased from smaller vendors the company has a rather high
bargain power. The second category is indirect material, which is all material that the
company purchases for its own use, e.g. office supplies. This is handled by a general
purchasing group (GPG) on a country level. Since suppliers are rather small compared to
the company, the company has a rather high bargaining power, although it is not used
extensively to push for very long payment terms.
Changes in the financial environment has led to changes in behaviour and processes of the
company, for example forecasting in terms of demand for supplied products has become
significantly more important since the financial crisis. It is difficult to predict demand from
customers. During the crisis customers were putting their investments on hold. This was a
significant problem for the company and its suppliers. The company does not pay suppliers
in advance, so if customers delayed their orders, the company had to put their orders on
hold too. This led to significant problems for other players at the beginning of the value
chain, especially for many small suppliers, who ended up with excess inventory. The use of
factoring can also be a way to help small vendors with their liquidity needs.
5.6 Payables Management
Regarding payables management the GPG is pushing for standard payment terms which are
often 30 days; this depends on which country the supplier is in, 60 days is also common in
some countries. The cost is considered more important than managing payment terms.
Sometimes it is possible to obtain discounts of up to five per cent. However, then payment
often has to be done in ten days. This is difficult to manage with the system, as there might
not be enough time to get the invoice through the system and paid within such a short time
frame. It was stated that,

46
“WC cannot be viewed as stand-alone. It is not possible to be perfect in WC,
because that will be punished on the cost side. For example if we try to get
longer and longer payment terms, then the company might have to pay higher
prices” (Director Business Control, Supply Chain Operations).
However, approximately 75% of all purchases in Sweden are done from external suppliers of
e.g. machines and spare parts, therefore payment terms can be viewed as relevant by the
financing department as it will have a significant impact on liquidity. It was stated that,
“I see a huge potential in work with the supplier side, in so called Financial
Supply Chains and with payment terms. If customers have 60 or 90 days
payment terms, and suppliers have 30 days it will impact our WC negatively in
Sweden” (Accounting Manager Order to Cash, Treasury and Purchase to
Payment).
It can also be seen within the purchase to payment department that there has been an
increase in suppliers using factoring services for their invoices. If payment is delayed the
company will receive an interest invoice after 2-3 days, this also have a negative impact on
the company.
5.7 Inventory Management
Within the production companies, factories and technical service there is a significant focus
on inventory management. The company is working with just-in-time and world class
manufacturing as well as forecasting tools to ensure that inventory levels are kept at an
optimal level. The main parts of inventories are with the market companies and the factories.
Capital equipment is stored within central organisations such as supply chain operations,
and then the stock is shipped to the market companies before it is shipped to the customer.
The machines must pass many tests before shipment, in order to ensure they satisfy quality
specifications. Incoterms are considered to be important as they determine how long the
goods stay in the company’s stock and books. The company is working with aging reports
for inventory as well, to ensure that old stock can be cleared out. There are also many
distribution centres around the world that keep spare parts available for customers if a
machine breaks down, since it is very important to be able to deliver service to repair
machines very quickly.
The company has a large product portfolio which means that significant amounts of spare
parts must be kept for all machines. Therefore platform thinking was introduced, within this
concept they use a base model for the machines that can be adjusted to customer needs.

47
This will reduce the complexity of the capital equipment and the spare parts that are needed,
as the machines will be more standardised. In time this will reduce the number of spare parts
that must be kept for the machines. This is one of the biggest challenges in relation to
reducing WC, as it is still important to come up with new products, which are then increasing
the product portfolio further.
5.8 Measurement for Working Capital
Performance measurement systems such as the BSC are used for the group, clusters and
market companies. In the group BSC there is a measure for cash flow and WC, in the cluster
BSC there is a measure for WC. WC is measured as an average over the year. Five
quarters are used, with higher weighting for the middle quarters to decrease focus on the
year-end figures, and increase focus on what is happening throughout the year. This had a
positive effect on the behaviour in the market companies. There is also a measure of WC as
a ratio of net sales. This is measured to ensure that they are not penalised in terms of worse
WC if the business is growing. However these measures are not providing good guidelines
for operation units in terms of what actions to take, therefore different measures are used on
this level. Market companies measure overdues in percentage of receivables. Stock is
measured in relation to cost of sales or net sales, depending on where in the process the
goods are. Payments to suppliers are also measured to ensure that payment terms are
respected and invoices are paid on time. Cash flow forecasting is an area that has also
increased in importance significantly in the last few years. And the company has significantly
improved its forecasting. This was due to an initiative from top management, which has led
to an increase in focus within this area. Measures used for cash flow forecasting are related
to the accuracy of the forecasts. Forecasting within the companies that mainly have internal
transactions is rather easy, but forecasting within the market companies is very difficult as
they depend much on the payment dates of customer receivables. On a unit level it is
difficult to be accurate, but on the group level any inaccuracies tend to level out, therefore
forecasting on the group level is very good. Furthermore, business intelligence is also used
to compare these measures to other companies through analysis of annual reports.
5.9 Financing
The company is a private company that has been very profitable throughout the years.
Therefore the company has a very solid and strong financial position and good liquidity. As
the Swedish companies are mainly selling products to internal companies, there is no
problem to finance the operations. Collection of receivables is not an issue as it is mainly
moving money from one internal company to another; the money stays within the group. And

48
most receivables are paid through the internal netting system. Therefore WCM is not a main
issue at country level.
Due to the financial crisis the banks are more reluctant to lend money. New rules in Sweden
prevent banks from lending too much money to companies. Therefore banks are supplying
new services such as factoring. The company does not use factoring however; as analyses
have shown that it is too expensive, and does not provide any benefit. Instead the company
has its own internal banking and financing system. Therefore the focus on WCM is more of
an issue at the global level. Cash flow forecasting however is important on country level for
operation purposes and on the group level to plan liquidity.
However there are also new regulations in Sweden with regards to internal financing.
Companies outside of the EU are not allowed to finance companies within the EU. This has
led to a need to change the financing aspect in the future, where the company will be more
dependent on local external financing. This may also increase the importance of WC on a
country level, as well as reconsideration of the use of factoring. It means that the
responsibility of financing the operations will increase on the country level. These regulations
are very important to follow in order to remain tax compliant. It was also stated that,
“I agree that there is more of a focus on cost than liquidity. However, the more
expensive banks are getting when lending money, the more the focus on WC
will increase in every level of the company. The liquidity aspect will most likely
become more important in the future” (Manager Order to Cash, Treasury and
Purchase to Payment).
Furthermore, it should be calculated how much the bank loans cost and what it would cost to
extend payment terms to suppliers if this means that cost would increase.

49
6 Case Study Analysis
6.1 Value Proposition and WCM
As we have seen in the previous chapter the company is pursuing a differentiation strategy.
Based on the developed framework, this strategy leads to higher levels of receivables and
inventory which has a negative effect on WC. From the company in the case study we can
see, that the increased product portfolio leads to a higher amount of SKUs and thus to
higher inventory. For example, providing high quality service for the machines requires the
company to have a significant amount of stock of spare parts for all machines. Spare parts
for older machines may not be easily accessible from suppliers, therefore the company must
also keep parts for older models in stock for many years to ensure the customer will always
get the best service at all times. Furthermore to deliver high quality, newly built machines
need to be tested extensively before shipping to the customers, which also increases the
level of inventory and therefore affects WC negatively.
However the changes in the European Union law made it easier for non-system suppliers to
enter the market and threaten the market share of the company. Additionally the threat from
competitors producing PET bottles has increased due to technical developments, which
makes it possible to produce these bottles at lower prices. Therefore competition has
increased significant during the last years and the company started to focus on costs as well
to stay competitive. In textbooks and research papers we have seen that, WCM can be used
as a tool to reduce costs. A report by the Boston Consulting Group shows that good WCM
can lead to cost savings of 5 - 10 % (Buchmann et al., 2008).
Figure 13: Case Study Findings: Relationship Value Proposition WCM
50
So what the company is trying to do is improving WC by reducing inventory to decrease
costs and stay competitive, but only to the point where it does not jeopardize their
differentiation strategy. This finding is illustrated in figure 13 and explains among other
things, why WCM is not a main focus of the company.
6.2 Customers and WCM
The case study shows that due to changes in the business environment the bargain power
of the company’s customers has increased significantly. Accordingly, the company’s
dependency on each customer has increased as well since there are more suppliers in the
market competing for fewer customers.
The main customers of the company are selling their products to retailers across the world
and due to increased retailer concentration the customer’s situation is becoming more
intense as well. For example, in Germany, in 1999, the eight biggest retailers had a market
share of 70% within the market goods sector. In 2011 the four biggest retailers had 85%
market share (Pavel & Schlippenbach, 2011). Similar developments can be seen in other
countries (Vander Stichele & Young 2009). Therefore the company’s customers are
experiencing high pressures due to intensified pressure from their customers on pricing.
Thus not only the company’s customers have become larger and fewer over the last ten
years, so have the customer’s customers, so this phenomenon can be seen in large parts of
the value chain. Therefore these changes and developments increase the pressure on the
company as well.
As previously discussed in the literature part of WCM (Chapter 3.2.1), Days Payables
Outstanding (DPO) is a measure commonly used to analyse how long the purchase to
payment process is within a company. Thus the customers DPO, shows how long they take
to pay their suppliers, which will affect the company’s receivables. Therefore we can use this
measure to evaluate the payment behaviour of the company’s customers. It can be seen
from an analysis of customer DPO that this measure has increased in general over the last
few years. From 2009 to 2013 DPO of Coca-Cola has increased from 116 to 181, and for
Nestlé it has increased from 53 days in 2010 to 116 in 2013 (for calculations see appendix).
This could have a negative effect on the company’s receivables and WC. Our findings are
illustrated in figure 14.

51
Figure 14: Case Study Findings: Relationship Customers and WCM
6.3 Channels and WCM
The company is doing business under the B2B concept, where they sell mainly machines
and packaging material to customers, who in turn are also in a B2B relationship with their
customers. The customer’s customer are the retail chains that are then in a B2C
relationship.
Due to the position the company has within the value chain, the company cannot impact the
B2B relationships. It is not possible to sell their products directly to end consumers. The
customers of the company on the other hand can choose to deliver their products directly to
the consumers, instead of delivering to retail chains. But it is a rather limited market. As the
company does not have the possibility to impact this by changing their business model, this
section is not of major relevance to this case and we are not able to draw any conclusions
regarding the relationship between the business model and WCM.
6.4 Customer Relations and WCM
As we have seen in the case study the company’s customer relations can be classified as
long-term strategic relations, based on the motivation to grow together with the customer. In
our framework we argued that if a company focuses on sales growth, WC will be affected
negatively by increases in receivables and inventory, since the company might use trade
credits and delivery options as a marketing tool.
However concerning trade credits, the company has chosen another approach by using
Direct Debit, which provides a win-win situation for both customers and the company. By
using Direct Debit the company gets cash immediately thus no receivables occur, which of
course reduces the overall level of receivables and has a positive effect on WC. Therefore

52
this case shows that Direct Debit can be used as a marketing tool as well to strengthen the
customer relationship and leading to sales growth, while having a positive effect on WC.
However it needs to be considered that there might be a trade-off between the benefit of
receiving cash early and lost revenue due to discounts.
Figure 15: Findings Case Study: Relationship Customer Relations and WCM
Regarding the level of inventory our assumptions in the framework can be confirmed. To be
able to maintain good relationships with customers the company must provide service
immediately if a filling machine at the customers plant breaks down. Therefore spare parts
for all machines sold within the last 30 years must be available which leads to a high level of
inventory and therefore negative effects on WC. Our findings regarding the relationship of
WCM and customer relations can be found in figure 15.
6.5 Partnerships and WCM
In our framework we assumed that having a higher bargain power than the company’s
supplier leads to a higher level of payables and therefore affect WC positively. Since the
literature (Chapter 3.2.3) states that companies should make use of payment terms to
increase their free borrowing from suppliers as much as possible, perhaps even by
systematically delaying payment by a few days in order to improve WC.
Regarding the company’s bargain power we can conclude that it is dependent on the
business area. The bargain power towards paperboard suppliers can be classified as limited,
whereas the company possess a high power towards suppliers of other direct material, such
as spare parts, and indirect material.

53
From the case we can see that the negotiation of payment terms is not a main priority for the
company. They use standard payment terms in the area of high and low bargain power.
Since according to the company it is more important to maintain good relationships with
suppliers and respect their payment terms. Furthermore, delaying payments may lead to
increased prices or interest costs, since a lot of suppliers use factoring companies, which the
company wants to avoid.
However we could also see that changes in the financial environment during the financial
crisis, where some suppliers were financially struggling, has led to changes in the company’s
behaviour and processes. Forecasting in terms of demand for supplier products has become
more important, which may lead to a win-win situation for both the company and its
suppliers. Since better forecasts can lead to better planning of production for both, which in
turn will lead to optimal levels of inventory and the possibility to get just-in-time delivery.
Furthermore, due to changes in regulation that leads to increased dependency on external
financing for the Swedish entities, payment terms are likely to increase in importance in the
future.
Figure 16: Findings Case Study Relationship Partnerships and WCM
To sum up, the relationship between payment terms and suppliers partnership can be seen
from various perspectives. One aspect is costs. The company does not want to increase the
number of days within the payment terms if it may increase the cost of the supplies. The
other aspect is in cases where the company has significant bargaining power. For example,
when it comes to small suppliers who are delivering large amount of stock to the company,
and are very dependent on the company, significantly increased payment terms are not
pursued anyway, as this would not be a fair way to do business. Additionally one can argue
that the company is somehow dependant on the supplier and cannot risk all of them going
bankrupt.

54
6.6 Key Resources and WCM
In the developed framework we assume that WCM is less important for companies that have
stable findings than for company’s struggling financially, since WCM can be used as a tool to
improve liquidity. This fact can be confirmed by the case study. The company is financed
stably and has its own internal bank and financing system therefore WC seems not to be
important to improve liquidity on the country level. Reasons why WC is important in some
areas of the company are of different nature like it has been discussed in the previous
chapter.
However due to changes in Swedish law the Swedish entities have to change its business
model slightly since it is not allowed to use the internal banking system anymore. This
means new agreements with financial institutions have to be made and the importance of
liquidity and WCM will increase for the Swedish entities in the future.
6.7 Cost structure and WCM
In the framework we have drawn the conclusion, that every change in receivables and
inventory directly influences the company’s cost structure and WCM therefore can be
understood as a tool to decrease the company’s cost.
That is exactly what the company in our case study is doing. They use WCM as a tool to
decrease the overall costs to stay competitive, however only up to the point where quality
and differentiation is not endangered. Evidence for that can be seen in a number of business
model components.
Additionally we got the impression from the interviews that WCM is more important on a
group level than on a country level, where they focus on costs. The reason for this can be
found in the organisation’s structure and its complexity. Effects on WCM cannot be
measured effectively on a lower level. For example the Swedish company has only a few
external customers but a high amount of internal ones. Thus measuring DSO would provide
a wrong picture of the situation and therefore does not provide any guidance for
improvements. However focusing on costs leads the countries to do WCM kind of
automatically since it can be considered as a tool to decrease costs especially by reducing
inventory. Nevertheless on a group level the measurement of WCM is more suitable, since it
gives a full picture. Based on this we can conclude that in the case of the company the
complexity of the business model is responsible for the focus on costs instead of WCM on a
country level.

55
6.8 Potential of Changing Contingency Factors
In our analysis we have seen that competition and bargain power are the main contingency
factors influencing the relationship of the business model and WCM. It is very likely that the
competition from substitutes like bottles as well as from non-system carton suppliers will
increase in the future. In this regard the Chinese competitor Greatview Aseptic, who is
producing carton packaging material can be mentioned. This competitor has a small market
share at the moment, but an impressive growth rate and possibly a cheaper cost structure
than the company as well. Competition is a contingency factor that the company can only
influence minimally for example by creating market entry barriers for other supplier. Patents
can be an option for market barriers, which the company uses. However it is not really
preventing competition. Therefore the company needs to find solutions for dealing with and
beating the competition.
However from the insights we could get in the case study the company’s business model
seems to be up for this task by concentrating on differentiation to provide a benefit to the
customer for instance through high quality and sustainable and environmentally friendly
products. Additionally the strong customer orientation and relation generates customer
satisfaction and loyalty.
The customers bargain power on the other hand is a contingency factor that can be
influenced slightly through the company’s growth or by creating dependencies. For growth a
clear and strong value proposition is necessary, which we think the company has. The
creation of dependency is more difficult. The company could develop machines for which
only the company’s packaging material can be used. This would increase the customer’s
dependency on the company; therefore it could be an option. Another opportunity might be a
mix between an innovation and pull strategy. By that we mean the following idea: the
consumers of products, in the company’s case the households, might prefer more and more
sustainable products, whereby the packaging material is of concern. Thus if consumers
demand this type of packaging the company’s customers, like beverage producers are
forced to use sustainable packaging material. If the company now is the only one which is
able to provide an innovative and satisfying solution the customer has no other choice than
to buy from the company and the dependency increases. However this constructed situation
is unlikely to occur. But the point is that not only the customer orientation should be of
concern but also the end consumer focus to drive the innovations in the correct direction.
56
7 Discussion and Conclusions
The purpose of this thesis was to describe, analyse and discuss the relationship between
working capital management and the business model. Based on this purpose we developed
six research questions. The findings for each question will be discussed next:
Definition of Working Capital Management and Business Model in Literature
A business model can be described, in a simplified way, how a company is producing and
selling goods to earn money. It can also be seen as a blueprint of a company’s strategy. The
business model includes various components such as customer segment, value proposition,
channels, customer relations, key resources, key activities, key partnerships, revenue and
cost structure. Companies must evaluate which segments they are targeting, and thus
creating value for. Value is created, if the product or service satisfies the needs of the
customer. The relationship to customers can be either long-term or short-term, and be driven
by factors such as growth or customer retention. Companies use key resources such as
capital or human resources to create value for their customers. Companies are also using
their networks of partners and suppliers, which all have a role in creating value. All these
components contribute to what costs a firm incurs and how revenue is generated.
WC can be defined as current assets minus current liabilities. Where receivables and
inventory are seen as the main components of current assets and payables are seen as the
main component of current liabilities. The main goal is to reduce the amount of money tied
up in these components in order to use it for other investments and to decrease the need for
external funding. Additionally WCM can be used as a tool to reduce costs and increase the
company’s value.
Accounts payables can be seen as financing free of charge to the firm. Suppliers can extend
trade credit more cheaply than financial institutions as the supplier can easily repossess the
goods if the customer doesn’t pay. Managing payment terms and discounts can be a way to
improve WC and reduce costs. In large corporations it is an advantage to use centralised
purchasing organisations to negotiate payment terms.
Accounts receivables are assets that a company owns due to extending trade credit when
selling goods or services to customers. Credit policies determine which payment terms
should be applicable to customers, risk must be evaluated, and possible discounts for early
payment should be considered as well as how to deal with overdues. The size of receivables
varies with industry, and increasing receivables can be seen as a healthy sign of growth as
long as the overdues are not increasing. A common measure used to keep track of

57
receivables is the aging report, where the company can monitor any overdue invoices in
order to avoid bad debt.
Inventory includes purchased or produced items that a company stores for future use or
sale. Inventory is needed, as companies cannot predict exact demand for a product at all
times. The optimal level of inventory must be found in order to avoid carrying excess
inventory but on the other hand it needs to be ensured that demand can be met. Forecasting
future demand should be done in order to plan production accordingly, and just-in-time
manufacturing can be used to decrease the amount of stock. Inventory often constitutes a
large part of WC, and significant costs can be associated with holding inventory.
Relationship of Business Model and Working Capital Management in Literature
Textbooks and research papers do not provide frameworks or theories to explicitly link the
company’s business model to WCM. Which is why we developed, based on different kind of
theories and concepts, a framework of how the relationship could be understood.
Therefore we reviewed the nine components of the business model and argued the following
relations: Value proposition states how a company creates value for its customers, e.g.
through differentiation strategies or through cost leadership, which both lead to different
assumptions regarding the level of WC. The company’s relationship with its customers,
which is affected by bargaining power and dependency, will influence WC. If the customer
has high bargaining power receivables and inventory will increase. If there are fewer
customers in the market there will be higher percentage of sales to single customers, which
will increase a company’s dependency on particular customers. Customer relations, i.e.
long-term or short-term, will impact WC, as e.g. companies in long-term relationships are
less likely to pursue aggressive negotiations regarding payment terms. Growth strategy will
impact on whether the company intends to acquire new customers or aim to grow with their
existing customers. A company’s place in the value chain, bargaining power and number of
suppliers may influence the level of WC. Additionally the importance and focus of WC highly
depends on the company’s ability to obtain external financial funding. All these factors
impact on a company’s cost and revenue structure, where WCM can be seen as a tool to
reduce costs and increase revenues.
Differences and Similarities between the Company’s Working Capital Practice and Findings
in Literature
By comparing our findings in the case study to the recommendations in textbooks and
research papers we have found similarities as well as differences. It can be seen in the
literature that initiatives related to WCM should come from top management in order to have

58
an impact on the company and be effective. Based on the case study we can also draw the
same conclusion, that top management initiative is essential for successful WCM
improvements. Whereas the negotiation of payment terms with suppliers and customers
seems to be central for best practice WCM from the literature point of view. The company
does not concentrate on this issue, since they argue that relationship is more important.
However receivable management focuses mainly on the management of overdues which is
as well an issue in textbooks. By dealing with the company’s own payment behaviour
regarding paying the suppliers always on time and aiming for reducing late paying, the
company chooses an approach which is not a common recommendation in literature. Some
papers even recommend paying late to benefit from the higher level of payables.
Nevertheless, regarding inventory management we could see similarities. The company
uses just-in-time delivery as well as world class manufacturing to improve the level of
inventory. The same counts for WC measurement, even though we could not get detailed
insights of the company’s performance measurement. Like suggested in textbooks and
research papers the company uses the BSC to control WC on a group level. Additionally
they use the aging schedule for receivables and the DIH. Apart from these ratios the
company measures the overdue in percentage of receivables to evaluate the growth and an
aging schedule for inventory. These measures were not commonly seen in the literature.
Effects of the Company’s Business Model on Working Capital Management
A case study of a multinational corporation within the packaging and processing industry
was conducted to test our framework and how the components of the business model
influence WCM. It was found that the company is using WCM as a tool to reduce costs in
order to stay competitive in the market. However, as they are pursuing a differentiation
strategy they will only reduce inventory to the point where they can still provide the needed
benefits and level of service to their customers. This means that WC is not the main focus of
the company.
Based on the analysis of the company’s customers it can be seen that the company is much
more dependent on its customers now than ten years ago, as there are fewer customers that
are larger in size. The customers are also in a more competitive situation as the retail chains
that constitute the customer’s customers are also decreasing in number and increasing in
size. However, a changing environment does not necessarily mean a change in the business
model is required. Companies have to find ways to adapt to the new environment. One way
to do this is through better WCM as this can be used to reduce costs and use resources
more efficiently.

59
The company’s main focus is on long-term customer relationships, as the capital equipment
sold to customers will survive at the site for a significant amount of years. Therefore the aim
is also to grow together with the customers. It can also be seen that there are more ways for
companies to improve WC other than managing payment terms. The use of Direct Debit
solutions, which can benefit both the customer and the company, can lead to improved WC
as well as good customer relations.
The company can be seen to be in the middle of the value chain and have different
bargaining powers with different suppliers. The company is a large customer to suppliers of
paperboard, but this business is a small part to the total sales of that supplier. Therefore the
bargain power decreases. There are also many smaller suppliers where the company is a
huge customer, but even though the company might have a high bargain power in this case
it is not worth risking a good supplier relationship by demanding longer payment terms,
because longer payment terms can lead to increases in prices. Additionally, the company
often uses just-in-time delivery thus it is dependent on the reliable delivery of its supplies.
Therefore the relationship in general can be classified as more important than payment
terms in contrast to the relation in literature.
Financial resources are of main importance to a company in order to finance operations. It is
important to differentiate between national and group level, as internal banking makes it
possible to finance operation in every country, but the group may still require external
financing. Therefore WCM is more important on the group level. However due to legal
changes in Sweden this will probably change in future. Furthermore, WCM can be a tool to
improve liquidity, however if the company is stably financed there is no need for focus on
WC for the reason of liquidity. There might be other reasons such as reducing costs to stay
competitive.
Additionally we can see that apart from the mentioned contingency factors including
competition, financial environment and bargain power, the changes in regulations can lead
to a need to change the business model, which then might influence WCM.
Conclusions for other Companies
This study has shown that there is a relationship between the business model and WCM
which should be considered by each company. The main learning we can draw from this
thesis is that, unlike it is pointed out in textbooks, WCM is not always of main importance to
a company and does not need to be prioritised at all times to be successful. The importance
is dependent on the design of the business model and choices within its components. Since
improvements in WC might lead to problems in some parts of the business model, such as

60
customer relations or value proposition, not only the positive effects of WCM should be
considered but also the negative ones. Additionally the potential of WC improvements
should be evaluated first to ponder benefits and risks as well as ensure that resources are
spent efficiently and effectively. Apart from this, contingency factors such as competition,
bargain power of suppliers and customers, financial situation and the legal requirements
should not be neglected, because they might have a significant influence on the business
model and WCM as well.
Limitations and Further Research
The limitations within this study are largely related to the fact that we have only done a single
case study. Therefore it is important to consider what results we might have had if we made
multiple case studies. By studying other companies we may have found further links
between the business model and WCM. This could be due to the fact that a different
business model may impact WCM in a way that is not described in this study. It is assumed
that most companies have different business models. However, companies in the same
industry and size may have similarities in their business model. Therefore we assume that
similar businesses manage WC in a similar way. This assumption has not been tested in this
study.
Further limitations include the range of interviews, which are limited to people within the
Swedish organisation of the company. As we have not conducted interviews on the group
level it is not possible to verify our conclusions about the business model’s impact on WC
based on top management's opinion. Furthermore, there may be differing opinions of
employees throughout the organisation, depending on their area of focus. However, to
establish this, a very large number of interviews would have to be conducted, and we do not
believe this would change our overall results. In addition, the opinions may change between
different countries as cultural differences would have influence on the results. Due to the fact
that it is a very complex company it is not possible to consider every aspect of the
organisation as this would expand our scope significantly.
Suggestions for further studies include reviewing the link between the business model and
WCM in different companies within the same industry and of the same size, which would
require multiple case studies. This type of study could also be extended to other industries.
Furthermore, it is assumed that smaller companies would have significantly different
business models, and therefore would manage WC in a very different way. It could be
suggested that a different framework would have to be developed for smaller companies.
Therefore further studies are also required to look into the relationship between business
61
models and WCM in smaller firms. Therefore we can conclude that this topic could be an
interesting field for further studies.

62
References
Books
Arnold, G. (2008). Corporate Financial Management, 4th Edition. Pearson.
Arvidsson, J. & Engman, T. (2013). Working Capital Management, Att frigöra capital för att
tjäna mer pengar. Mölnlycke: Björn Lundén Information AB.
Axsäter, S. (2006). Inventory Controlling. 2nd Edition. New York: Springer.
Besanko D., Dranove, D., Shanley, M. & Schaefer, S. (2013). Economics of Strategy. 6th
Edition. Singapore: Wileys.
Bhattacharya, H. (2012). Working Capital Management, Strategies and Techniques. 2nd
Edition. New Delhi: PHI Learning.
Berk J. & DeMarzo, P. (2013). Corporate Finance. 3rd Edition. Pearson.
Bolten, S. (1976). Managerial Finance. Boston: Houghton Mitten Co.
Bose, C. (2010). Fundamentals of Financial Management. 2nd Edition. New Delhi: PHI
Learning.
Brealey R., Myers, S. & Allen, F. (2011). Principles of Corporate Finance. Irwin: McGraw-Hill.
Bryman, A. & Bell, E. (2007). Business Research Methods. 2nd Edition. New York: Oxford
University Press Inc.
Chadamiya B. & Menapara, M. (2013). Working Capital Management, Strategic Techniques
and Choices. New Delhi: New Century Publications.
Donaldson, L. (2006). The Contingency Theory of Organizational Design: Challenges and
Opportunities. in Burton, R., Eriksen, B., Harkonsson, D. & Snow, C. Organization Design,
The Evolving-State-of-the-Art. Springer.
Gleich, R. (2011). Performance Measurement - Konzepte, Fallstudien und Grundschema für
die Praxis. 2nd Edition. München: Vahlen.
Grant, R. (2008). Contemporary strategy analysis. 8th Edition. Chichester: Wiley.
Hofmann, E., Maucher, D., Piesker, S. & Richter, P. (2011). Ways Out of the Working
Capital Trap, Empowering Self-Financing Growth Through Modern Supply Management.
Berlin: Springer
63
Heesen, B. & Moser, O. (2013). Working Capital Management, Bilanzierung, Analytik und
Einkaufsmanagement. 2nd Edition. Wiesbaden: Springer Gabler
Jain P. (2013) Financial Management Practice: An Empirical Study of Indian Corporates.
India: Springer
Kaplan R. & Norton, D. (2004). Strategy Maps, Converting Intangible Assets Into Tangible
Outcome. Boston: Harvard Business School Press.
Klepzig, H. (2014). Working Capital und Cash Flow, Finanzströme durch
Prozessmanagement optimieren. 3rd Edition. Wiesbanden: Springer Gabler
Kotler, P., Berger, R. & Bickhoff, N. (2010). The Quintessence of Strategic Management:
What You Really Need to Know to Survive in Business. Heidelberg: Springer.
Kotler, P., Armstrong, G., Wong, V. & Saunders, J. (2008). Principles of Marketing. 5th
Edition. Harlow: Pearson.
Meffert, H., Burmann, C. & Kirchgeorg, M. (2011). Marketing: Grundlagen marktorientierter
Unternehmensführung. 11th Edition. Wiesbaden: Gabler.
Meyer,C. (2007). Working Capital und Unternehmenswert, eine Analyse zum Management
der Forderungen und Verbindlichkeiten aus Lieferungen und Leistungen. Wiesbaden: GWV
Fachverlag.
Muckstadt, J. & Sapra, A. (2010). Principles of Inventory Management, When You Are Down
to Four, Order More. New York: Springer.
Nilsson, F., Olve, N. & Parment, A. (2010). Controlling for Competiveness - Strategy
Formulation and Implementation through Management Control. Copenhagen Business
School Press.
Patel, R. & Davidsson, B. (2011). Forskningsmetodikens grunder, Att planera, genomf ra
och rapportera en unders kning. 4th Edition. Lund: Studentlitteratur
Porter, M. (2004). Competitive Advantage, Creating and Sustaining Superior Performance.
New York: Free Press.
Oxford Advanced Learners Dictionary. (2000). Oxford Advanced Learners Dictionary. 6th
Edition. Oxford University Press.
Preve, L.& Sarria-Allende, V., (2010). Working Capital Management, Oxford University
Press.
Sagner, J. (2011). Essentials of WCM. New Jersey: Wiley

64
Schulte, V. (2011). Working Capital Management - Liquidität steuern.Halle: Ravensberger
Swamidass, P. (2000). Encyclopedia of Production and Manufacturing Management. Kluwer
Academic Publishers.
Timmers, P. (1999). Electronic Commerce, Strategies and Models for Business-to-Business
Trading. Chichester: John Wiley & Sons.
Weinhardt, C., Blau, B., Conte, T., Filipova-Neumann, L., Meinl, T. & Michalk, W. (2011).
Business Aspects of Web Services. Heidelberg: Springer.
Williams, C. (2008). Comparing Evolutionary and Contingency Theory Approaches to
Organizational Structure. in Burton et al. Designing Organizations. Springer.
Yin, K. R. (2009). Case Study Research, Design and Methods. 4th Edition. USA: Sage
Publications Inc.
Articles
Al-Debei, M. & Avision, D. (2010). Developing a unified framework of the business model
concept. European Journal of Information Systems, 19, p. 359-376.
Banos-Caballero, S., Gracia-Teruel, P. & Martinez-Solano, P. (2012). The speed of
adjustment in working capital requirement. The European Journal of Finance, 19 (10), 978-
992.
Brunninge, O. & Wramsby, G. (2014). Avoiding to get stuck in a successful business model:
Dynamic business model adaption from a path dependence perspective. 3. International
Conference on Path Dependence in Berlin.
Chiou, J-R. & Cheng, L. (2006). The determinants of working capital management. Journal
of American Academy of Business, Cambridge, 10(1), 149- 155.
CFERF (2013). Working Capital Optimization. Toronto: Canadian Financial Executives
Research Foundation.
Cotis, L. (2004). Lean Working Capital Management, Embedding Best Practices for
Revenue Maximisation and Profit Optimization. Business Credit. Vol. 106 Issue 1, p56-57. p.
2.
Deloof, M. (2003). Does Working Capital Management Affect Profitability of Belgian Firms?
Journal of Business Finance and Accounting, 30 (3), 573-587.
De Reuver, M., Bouwman, H. & Haaker, T. (2013). Business Model Roadmapping: A
practical approach to come from an existing to a desired business model. International
Journal of Innovation 17 (1).

65
Etiennot, H., Preve, A. & Sarria Allende, V. (2012). Working Capital Management: An
Exploratory Study. Journal of Applied Finance, 1, 162-175.
Farris, M., Hutchison, P. & Hasty R. (2005). Using Cash-to-Cash To Benchmark Service
Industry Performance. Journal of Applied Business Research, 21 (2), p. 113-124.
Garcia-Teruel, P. & Martinez-Solano, P. (2010). Determinants of trade credit: A comparative
study of European SMEs. International Small Business Journal, 28 (3), 215-233.
Georg, G. & Bock, A. (2011). The Business Model in Practice and its Implications for
Entrepreneurship Research. Entrepreneurship Theory and Practice, January 2011, p. 83 -
111.
Jose, M. L., Lancaster, C. & Stevens, J. L. (1996). Corporate return and cash conversion
cycles. Journal of Economics and Finance, 20, 33–46.
Kim, C., Mauer, D. & Sherman, A. (1998). The Determinants of Corporate Liquidity: Theory
and Evidence. Journal of Financial and Quantitative Analysis, 33 (3), 335-359.
Klueber, R. (2000). Business Model Design and Implementation for eServices. AMCIS 2000
Proceedings. Paper 139.
Knauer, T. & Wöhrmann, A. (2013). Working capital management and firm profitability.
Journal of Management Control, 24 (1), 77-87.
Kumar M. & Ganguli, S. (2009). Modeling Inventory Management Improvements: Criticalities
and Recommendations. ICFAI Journal of Supply Chain Management.
Lancaster, C. & Stevens, J. (1999). Corporate Liquidity and the significance of earnings
versus cash flow: An examination of industry effects. The Journal of Applied Business
Research, 15(3), 37-46.
Long M., Malitz I. & Ravid S. (1993). Trade credit, quality guarantees, and product marketability. Financ Manage (22) p.117–127.
Magretta, J. (2002). Why Business Models Matter. Harvard Business Review, May 2002, p.
87-92.
Mahadeva, B. (2000). Business Models for Internet-Based E-Commerce: An Anatomy.
California Management Review. 42 (4), p. 55- 69.
Mian, S. & Smith, C. (1992). Accounts Receivable Management Policy: Theory and
Evidence. The Journal of Finance, 47 (1), p. 169-200.
Mintzberg, H. (1987). The Strategy Concept I: Five Ps For Strategy. California Management
Review. Fall, 1987 p. 11-24.

66
Moss, J. & Stine, B. (1993). Cash conversion cycle and firm size: A study of retail firms.
Managerial Finance, 19(8), 25-34.
Nevries, P. & Gebhardt, R. (2013). Erfolgsfaktoren des Working Capital Managements.
Controlling and Management Review, 5, 14-25.
Opler, T., Pinkowitz, L., Stulz, R. & Williamson, R. (1999). The determinants and implications
of corporate cash holding. Journal of Financial Economics, 52, 3-46.
Osterwalder, A. (2004). The Business Model Ontology: A Proposition in a Design Science
Approach. Universite de Lausanne.
Pavel, F. & Schlippenbach, V. (2011). Konzentration im Lebensmitteleinzelhande: Hersteller
sitzen am kürzeren Hebel. Wochenbericht des DIW Berlin, 13.
Peters, F., van Kleef, E., Snijders, R. & van den Elst, J. (2014). The Interrelation between
Business Model Components – Key Partner Contributing to a Media Concept. Journal of
Media Business Studies, 10(3), p. 1-22.
Russell, K., Albrecht, S. & Sack, R. (2000). Charting the Course Through a Perilous Future.
Management Accounting Quarterly, Fall 2000, p.4-11.
Shin, H. & Soenen, L. (1998). Efficiency of working capital management and corporate
profitability. Financial Practice and Education, 8, 37–45.
Smid, R. (2007). Unlocking value from your sheet through working capital management.
Journal of Payments Strategy & Systems, 2 (2), p. 127-137.
Stewart, G. (1995). Supply chain performance benchmarking study reveals keys to supply
chain excellence. Logistic Information Management, 8 (2), 38-44.
Online Resources
Buchmann P. & Jung, U. (2014). Best-Practice Working Capital Management: Techniques
for Optimizing Inventories, Receivables, and Payables, QFinance. Available Online:
http://www.qfinance.com [Accessed March 28 2014]
Buchmann, P., Roos, A., Jung, U. & Wörtler, M. (2008). Cash for Growth: The Neglected
Power of Working-Capital Management. BCG Opportunities for Actions. Available Online:
http://www.bcg.com.cn/en/files/publications/articles_pdf/Cash_for_Growth_May_2008.pdf
[Accessed Mai 18 2014]
IFRS Foundation & IASB. (2014) Available Online: http://www.ifrs.org/Pages/default.aspx
[Accessed Mai 05 2014]

67
Nestle (2014). Annual Report 2013. Available Online: http://www.nestle.com/asset-
library/documents/library/documents/annual_reports/2013-annual-report-en.pdf [Accessed
Mai 10 2014]
Nestle (2013). Annual Report 2012. Available Online: http://www.nestle.com/asset-
library/documents/library/documents/annual_reports/2012-annual-report-en.pdf [Accessed
Mai 10 2014]
Nestle (2012). Annual Report 2011. Available Online: http://www.nestle.com/asset-
library/Documents/Library/Documents/Annual_Reports/2011-Annual-Report-EN.pdf
[Accessed Mai 10 2014]
Nestle (2011). Annual Report 2010. Available Online:http://www.nestle.com/asset-
library/Documents/Library/Documents/Annual_Reports/2010-Annual-Report-EN.pdf
[Accessed Mai 10 2014]
Osterwalder, A. & Pigneur, Y. (2010). Business Model Generation. Available Online:
http://www.businessmodelgeneration.com/downloads/businessmodelgeneration_preview.pdf
[Accessed Mai 15 2014]
The Coca Cola Company (2014). Annual Report on Form 10-k 2013. Available Online:
http://assets.coca-colacompany.com/d0/c1/7afc6e6949c8adf1168a3328b2ad/2013-annual-
report-on-form-10-k.pdf [Accessed Mai 10 2014]
The Coca Cola Company (2013). Annual Report on Form 10-k 2012. Available Online:
http://assets.coca-colacompany.com/c4/28/d86e73434193975a768f3500ffae/2012-annual-
report-on-form-10-k.pdf [Accessed Mai 10 2014]
The Coca Cola Company (2012). Annual Report on Form 10-k 2011. Available Online:
http://assets.coca-
colacompany.com/b6/f3/ecad445f4fc1819dd37e04e057ad/form_10K_2011.pdf [Accessed
Mai 10 2014]
The Coca Cola Company (2011). Annual Report on Form 10-k 2010. Available Online: The
Coca Cola Company (2012). Annual Report on Form 10-k 2011. Available Online:
http://assets.coca-
colacompany.com/87/d3/c3c91e74419798fac5d7cf79d210/form_10K_2010.pdf [Accessed
Mai 10 2014]
Vander Stichele, M & Young B. (2009). The Abuse of Supermarket Buyer Power in the EU
Food Retail Sector. Available Online: http://somo.nl/publications-en/Publication_3279
[Accessed Mai 12 2014]

68
Appendix
Figure 17:CCC for The Coca Cola Company (calculation based on The Coca Cola Company, 2014;
The Coca Cola Company, 2013; The Coca Cola Company, 2012; The Coca Cola Company 2011)
Figure 18: CCC for Nestle (calculation based on Nestle, 2014; Nestle, 2013; Nestle, 2012; Nestle
2011).