ANALYZING THE LEVELS OF COMPLIANCE TO THE KILLAM …
50
ANALYZING THE LEVELS OF COMPLIANCE TO THE KILLAM LIBRARY FOUR-BIN WASTE MANAGEMENT SYSTEM TO DETERMINE AREAS OF CONCERN FOR FUTURE MANAGEMENT Final Report ENVS/SUST 3502 April 13, 2011 Jennifer Allan Mhari Lamarque Huan Liu Elsbeth Scotland Ashley White
Transcript of ANALYZING THE LEVELS OF COMPLIANCE TO THE KILLAM …
ANALYZING THE LEVELS OF COMPLIANCE TO THE KILLAM
LIBRARY FOUR-BIN WASTE MANAGEMENT SYSTEM TO
DETERMINE AREAS OF CONCERN FOR FUTURE MANAGEMENT
Final Report
ENVS/SUST 3502
April 13, 2011
Jennifer Allan
Mhari Lamarque
Huan Liu
Elsbeth Scotland
Ashley White

2
AUTHORS’ DETAILS
Jennifer Allan
BSc Dalhousie University
Mhari Lamarque
BA Dalhousie University
Huan Liu
BCD Dalhousie University
Elsbeth Scotland
BA Dalhousie University
Ashley White
BSc Dalhousie University
3
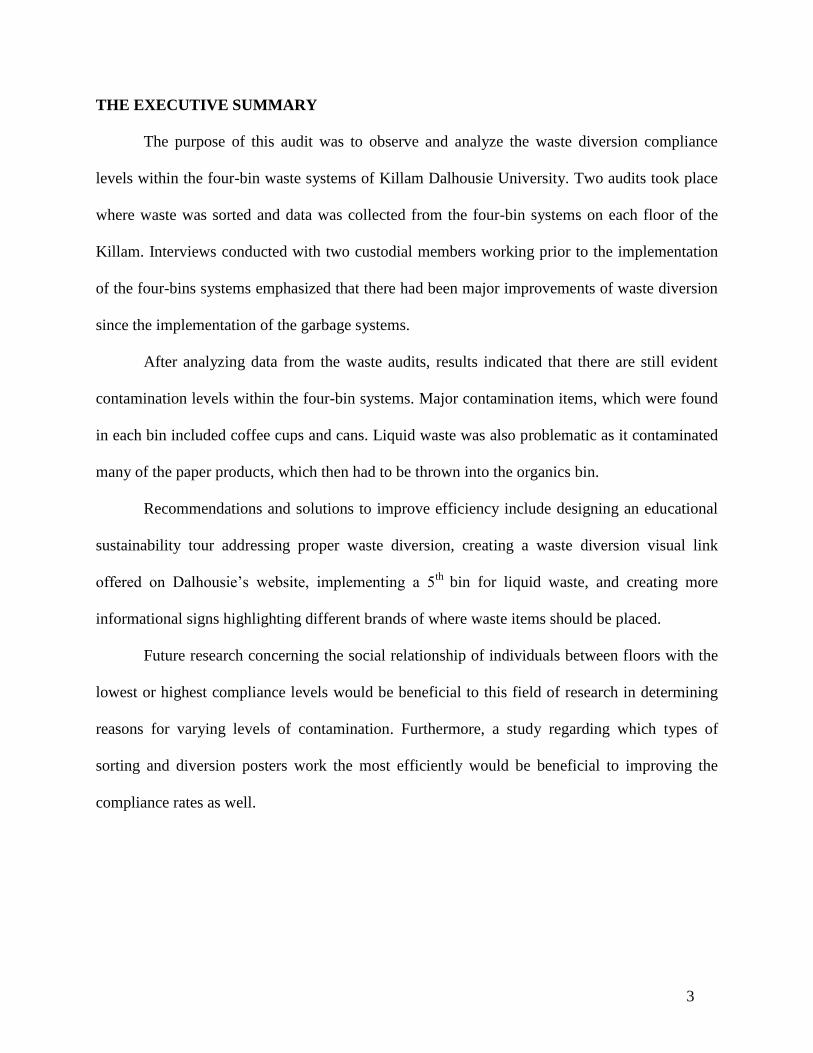
THE EXECUTIVE SUMMARY
The purpose of this audit was to observe and analyze the waste diversion compliance
levels within the four-bin waste systems of Killam Dalhousie University. Two audits took place
where waste was sorted and data was collected from the four-bin systems on each floor of the
Killam. Interviews conducted with two custodial members working prior to the implementation
of the four-bins systems emphasized that there had been major improvements of waste diversion
since the implementation of the garbage systems.
After analyzing data from the waste audits, results indicated that there are still evident
contamination levels within the four-bin systems. Major contamination items, which were found
in each bin included coffee cups and cans. Liquid waste was also problematic as it contaminated
many of the paper products, which then had to be thrown into the organics bin.
Recommendations and solutions to improve efficiency include designing an educational
sustainability tour addressing proper waste diversion, creating a waste diversion visual link
offered on Dalhousie’s website, implementing a 5th
bin for liquid waste, and creating more
informational signs highlighting different brands of where waste items should be placed.
Future research concerning the social relationship of individuals between floors with the
lowest or highest compliance levels would be beneficial to this field of research in determining
reasons for varying levels of contamination. Furthermore, a study regarding which types of
sorting and diversion posters work the most efficiently would be beneficial to improving the
compliance rates as well.
4
TABLE OF CONTENTS
1.0 Introduction ..................................................................................................................... 5
1.1 Background ......................................................................................................... 5
1.2 Objectives ............................................................................................................7
1.3 Purpose ............................................................................................................... 8
2.0 Methods .......................................................................................................................... 8
2.1 Study Design ....................................................................................................... 8
2.2 Quantitative Sampling Procedures ...................................................................... 9
2.3 Qualitative Sampling Procedures ........................................................................ 12
2.4 Data Analysis ...................................................................................................... 12
2.5 Delimitations and Limitations .............................................................................13
3.0 Results .............................................................................................................................14
4.0 Discussion .......................................................................................................................17
4.1 Summary of Research Question ..........................................................................17
4.2 Significant Findings ............................................................................................ 15
4.3 Other Key Findings.............................................................................................. 25
4.4 Comparison with Existing Research Studies....................................................... 26
4.5 Implications for Theory....................................................................................... 28
4.6 Findings Which Support/Failed to Support Hypothesis ..................................... 28
5.0 Conclusion................................................................................................…………....... 30
5.1 Recommendations for Action ............................................................................ 30
5.2 Recommendations for Future Research............................................................... 31
6.0 References ....................................................................................................................... 32
7.0 Acknowledgements ......................................................................................................... 34
8.0 Appendixes:
8.1 Appendix A – Data Results .................................................................................35
8.2 Appendix B – Dalhousie Waste Management Guide ......................................... 42
8.3 Appendix C – Interview Questions ..................................................................... 43
8.4 Appendix D – Ethics Proposal ...........................................................................44
5
1.0 INTRODUCTION
1.1 Background
The traditional practice of land filling waste is growing problematic. As population and
consumption grow, waste production grows as well. These increasing rates of waste have
required more land to be used for land filling and have led to multiple environmental
implications, such as the contamination of adjacent land and contribution to global warming
through its high methane emissions. Methane is a gas that has 21 times the ability to contribute to
global warming (Thompson, Sawyer, Bonom, & Smith, 2007). High dollar amounts required to
build and seal landfills make them even less appealing, and harder to maintain. It is estimated
that to build an individual cell of a landfill, it would cost $15 million Canadian dollars, and
another $6 millions to seal it, with additional maintenance costs. The negative environmental
and financial implications due to land filling practices stand as strong reasons for mitigation
efforts.
Diverting recyclable materials from landfill disposals can mitigate the adverse effects that
are caused by land filling. Major benefits can include, but are not limited to, a significant
decrease in greenhouse gases, retrieval of valuable resources, and stimulation to create a green
economy and technology (Ontario Ministry of the Environment, 2010).
As substantial contributors to municipal waste, universities have made many efforts to
increase waste diversion. Dalhousie University, a major contributor to the waste produced in the
Halifax Regional Municipality (HRM), has the opportunity to lead the region in improved
diversion rates. Effective monitoring of waste diversion can be achieved through the conduction
of waste audits; which are essential in colleting baseline data, assisting future policy formation
and monitoring the effectiveness of previous efforts.
6
Studies conducted across North America have shown that waste created on a university
campus is largely divertible. In 2003, a waste audit was conducted in a dormitory, an academic
building and the student union building at MIT, and found around 70% of the disposed trash was
recyclable. This study also pointed out that by recycling 40% of the trash (their goal), the
institution could save $100,000 a year – 10% of the total waste management budget (MITnews,
2003). On a national level, an audit performed at the University of Toronto showed that public
areas, especially classrooms, tended to have more waste with a lower capture rate (University of
Toronto, 2010). Reports proposed that increasing the number of recycling bins and reducing the
number of individual garbage cans could help diversion rates.
Dalhousie University, as a participant in the Greening the Campus movement and as a
major contributor to HRM waste (Christian, et al., 2010), is responsible for ameliorating its
diversion rate. The university currently has a target rate of 75% waste diversion, increasing from
a rate of 50% in 2009 (Facilities Management, 2009).
In 2006, Dalhousie conducted a study, which evaluated the efficiency of its recycling
program. In order to monitor people’s knowledge, attitude and recycling habits, an audit was
performed throughout several buildings over all three campuses: the Life Sciences Centre, the
Killam Library, the Student Union Building, the Engineering Buildings and the Dentistry
Building (Brooks, et al., 2006). This specific study discovered that inefficiency of the multiunit
bins was primarily due to lack of knowledge, the scarcity and lack of access to the multiunit bins,
and the unclear labels on the bins (Brooks, et al., 2006). Recurring contaminants within this
study were recyclables and organics. Amongst all respondents, 91% recommended placing more
recycling facilities throughout the campuses (Brooks, et al., 2006)
7
An audit, conducted in 2008, of the contamination levels within the four-bin systems was
conducted in Henry Hicks Academic Administration Building, the Sir Charles Tupper Medical
Building and the Ira McNabb Building (Heathcote, et al., 2010). The findings of this project
showed that coffee cups, solid napkins, facial tissues and cardboard were the most misplaced
(Heathcote, et al., 2010). In 2009, an audit of the four-bin systems within the Life Science Centre
was conducted, and large amounts of organics were found to contaminate the refuse bins
(Heathcote, et al., 2010).
Early 2010 marked the beginning of a pilot project on the second floor of the Killam
Library. The Library Green Team eliminated all the individual bins and placed four-bin systems
on the floor in their place. An initial study was conducted to find that eliminating individual bins
can decrease the garbage waste from 85% to 25%, and a decrease in contamination in the four-
bin system (Heathcote, et al., 2010). Success of this pilot project has led the Library Green Team
to further eliminate the individual refuse bins and place multiple four-bin systems in the atrium
and all common areas of each floor of the library.
1.2 Objectives
Through the process of a waste audit and conduction of interviews, this research project
sought to determine and observe compliance levels of the recently implemented four-bin system
within the Dalhousie Killam Library. In addition to determining compliance levels, this project
observed common contaminants, and compared contamination levels by floor. As there has been
no previous study which discusses and compares contamination levels in four-bin system in
different locations within the same building, or one which proves the long-term effectiveness of
these systems, this project will provide data that is both useful and timely.
8
1.3 Purpose
In addition to monitoring the effectiveness of the four-bin system within the Killam
Library, conclusions of this study are intended to contribute to the data and literature used on
Dalhousie’s campus. Results from this study may prove useful when performing audits of other
buildings on campus, and provide concrete data to compare compliance levels between
buildings. Information gathered from this study will support future strategising, policy making
and educating staff and students about Dalhousie’s undertaking to increase waste diversion to
75% on campus. Furthermore, the data from this study will prove useful for further studies not
only in the Killam Library, but across Dalhousie’s campus and other campuses nationwide.
The following report will describe the methods used to conduct the waste audit and
custodial interviews, present the results from the methods, discuss the results and their
implications and consider future actions and research that is applicable.
9
2.0 METHODS
2.1 Study Design
Both quantitative and qualitative research methods were used in order to obtain all the
necessary data required to meet the defined research objectives. A quantitative approach was
used to collect representative waste audit data from the Killam Library on Dalhousie
University’s Studley campus in order to assess the building’s compliance levels to the newly
implemented four bin waste management system. As well, qualitative interviews were conducted
to gather behind-the-scenes knowledge of the success and failure of the waste systems. A
proportional stratified random probabilistic sampling technique was implemented to collect
quantitative data regarding the contents of each bin within the four bin waste system. This
technique ensured representativeness among each strata of our population (Palys and Atchinson,
Chapter 4, 2008). Also, non-probabilistic purposive techniques were practiced to gather
qualitative data from the interviews. According to Palys and Atchinson, purposive sampling does
not aim for representativeness; instead it intentionally seeks out individuals who have a specific
reason for inclusion in the study (Palys and Atchinson, Chapter 4, 2008). Clearly, the custodial
staff have unique knowledge about waste disposal on campus, which the interviews were
designed to determine. An ethics proposal was needed to ensure confidentiality of each
individual involved in the interview process.
2.2 Quantitative Sampling Procedures
Prior to the waste audit being conducted, the group coordinated with the Killam Library
custodial staff to help schedule the audits. The group organized the date and time during which
the audit would occur, so that the custodial staff knew not to dispose of the garbage, as well as to
determine the prime time to collect the waste bins. The daytime custodial supervisor marked the
10
seven waste systems during her shift so that the evening staff would know which systems we
were planning to audit, and would not remove them. If it were necessary to change the bag from
one of the systems we were auditing, the bag would be labeled and left overnight in our sampling
location for us to add to our audit in the morning. This helped us to achieve a consistent 24-hour
garbage collection for our waste audits. Other than the custodial staff and the members of the
Library Green Team, no other students or staff were informed of the date of the audit. Otherwise,
individuals may have changed their waste behaviours and our audit results would not have been
representative of normal waste practices (Solid Waste District, 2011). Furthermore, before the
waste audit began, the team divided up procedural roles. It was recommended that each team
member be assigned only one role in the sampling procedure. This way there was validity and
reliability in the obtained results, without the possibility of error occurring when different
individuals used slightly different procedures or techniques. Procedural roles included:
Collection of the waste (entire group), one data recorder and photographer (Jennifer Allan), and
four waste sorters and weighers (Mhari Lamarque, Huan Liu, Ashley White and Elsbeth
Scotland).
Two audits were conducted, one on Tuesday, March 15th
, and the second on Tuesday,
March 22nd
. Both mornings, the audit began at 6am by meeting with the daytime custodial
supervisor outside the Killam Library, in order to be let into the library before public hours.
Also, the early start enabled us to collect the waste before the morning staff came in contact with
it. To determine how many four-bin waste systems we would sample, a proportional sampling
approach was used. Since there were 9 bin sets on the first floor, 7 bin sets on the second floor, 4
bin sets on the third floor, and 5 bin sets on the fourth and fifth floors, we decided to sample 2, 2,
1, 1, and 1 four-bin waste system respectively from each floor per audit. Therefore, a total of 7
11
systems were sampled each waste audit, totaling 28 bags of waste. The entire team collected the
representative waste bags from the four-bin systems on each floor and brought them to an area
behind the circulation desk that we had arranged to use for the waste sorting. Bags were then
arranged in order of floor for ease and convenience throughout the audit.
Firstly, the four waste sorters donned all necessary safety equipment, including Tyvek
suits, safety glasses, and gloves. The data recorder/photographer did not require safety attire, as
she never touched the waste. This equipment was provided by Rochelle Owen, Gary Davidson,
and Michael Wilkinson who also provided the team with a sampling scale. All data collected was
recorded in a data chart, an example of which can be found in Appendix A. The same Pitney
Bowes scale, which incorporated a tare function, was used for both waste audits, which allowed
for more representative data results. To begin, the weight of one sorting bin was recorded – this
weight was needed to be subtracted from each recorded weight to obtain a weight for just the
waste in the bag. The audit began with the first floor’s waste and continued to the fifth floor,
where each 4-bin system was sorted before moving onto the next one. A black garbage bag was
used as a surface to sort the waste on, to avoid making any extra mess. The team consistently
began with the paper bin from each system to avoid contaminating the contents with liquid. The
contents of the bag were arranged on top of the garbage bag, and the photographer took a photo
of the waste pile. This photo included a label in the bottom corner indicating the date, the target
waste type, bin number, and floor of the four-bin waste system, in order for it to be clearly
distinguished later for further analysis. Once the photo was approved, the waste sorters began to
sort the contents into four sorting bins, one for each type of potential contaminant – garbage,
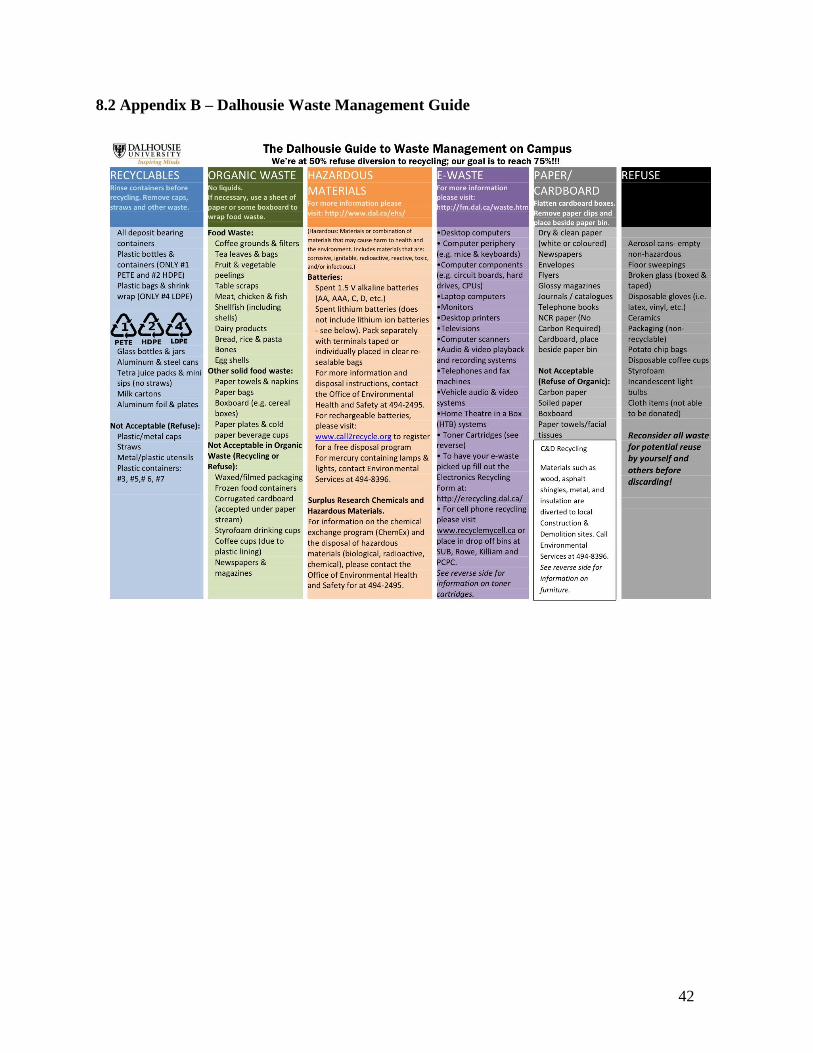
recyclables, paper, and organic, according to the Dalhousie Waste Management Guide, found in
Appendix B. Each sorting bin was weighed to calculate the weight of each type of waste within
12
the target waste. The data recorder kept track of the data collected, using one data chart for each
four-bin waste system. As the waste was sorted, observations were made concerning the contents
of the bags, particularly pointing out commonly misplaced items. This was also carried out later
by photo examination. This same procedure continued for the other three target waste bags
within the same four bin waste system, as well as for the other bags collected from each of the 5
floors. The refuse collected throughout the audit was properly sorted and disposed of following
the audit. Also, any spills that occurred while sampling or waste residues that were left were
cleaned up immediately following the audit.
Dalhousie’s Audit Instructions were followed, although slight modifications were made
to the procedure in order to obtain the objectives of the study (Dalhousie’s Audit Instructions,
2011).
2.3 Qualitative Sampling Procedures
Our team interviewed two members of the Killam Library custodial staff. A member of
the Library Green Team worked with the evening custodial supervisor to coordinate the
interviews with the staff members. One member of our team was responsible for carrying out the
interview process, and recording the responses. The questions that were asked to the custodial
staff in our interview can be found in Appendix C.
2.4 Data Analysis
Once all data was collected, the levels of contamination within each target waste bin were
determined. A percentage of each type of waste was calculated by dividing the weight of each
type of waste found in one bag by the total weight of that bag. These calculations were used to
analyze the level of compliance to the four bin waste system by comparing compliance between
each target bin within the same four bin waste system, as well as to determine problem areas by
13
comparing levels of compliance between floors. Results were displayed using Microsoft Excel
programming. Qualitative data displays, including bar graphs and pie charts, were used to
express the final results. Data collected through observation during the waste audits, as well as
by further analysis of our photographs, was taken into account and used in future discussion of
our audit results.
The interview responses were used to help confirm our results found in the waste audits,
as well as to gain further knowledge concerning the four bin waste system, which was fully
implemented last year. We included the results in the final report in order to provide support for
our quantitative data.
2.5 Delimitations and Limitations
Delimitations of this study included the fact that only the Killam Library was studied,
hoping that sample would give us a representation of the entire campus, due to it being such a
frequently visited building by most students. However, this was only an assumption. Limitations
included the small time frame we had for this study. If further time were allowed, more audits
would have been completed to provide stronger data results, but this was not practical for a five
week study. Also, the responses given from the custodial interviews were out of our control, and
their ability to provide some answers may not have been permitted.
14
3.0 RESULTS
Two waste audits were performed in the Killam Library to determine the compliance and
contamination levels. The results varied from each audit and gave some insight into the research
questions of this report. The results of the study will be given in this section.
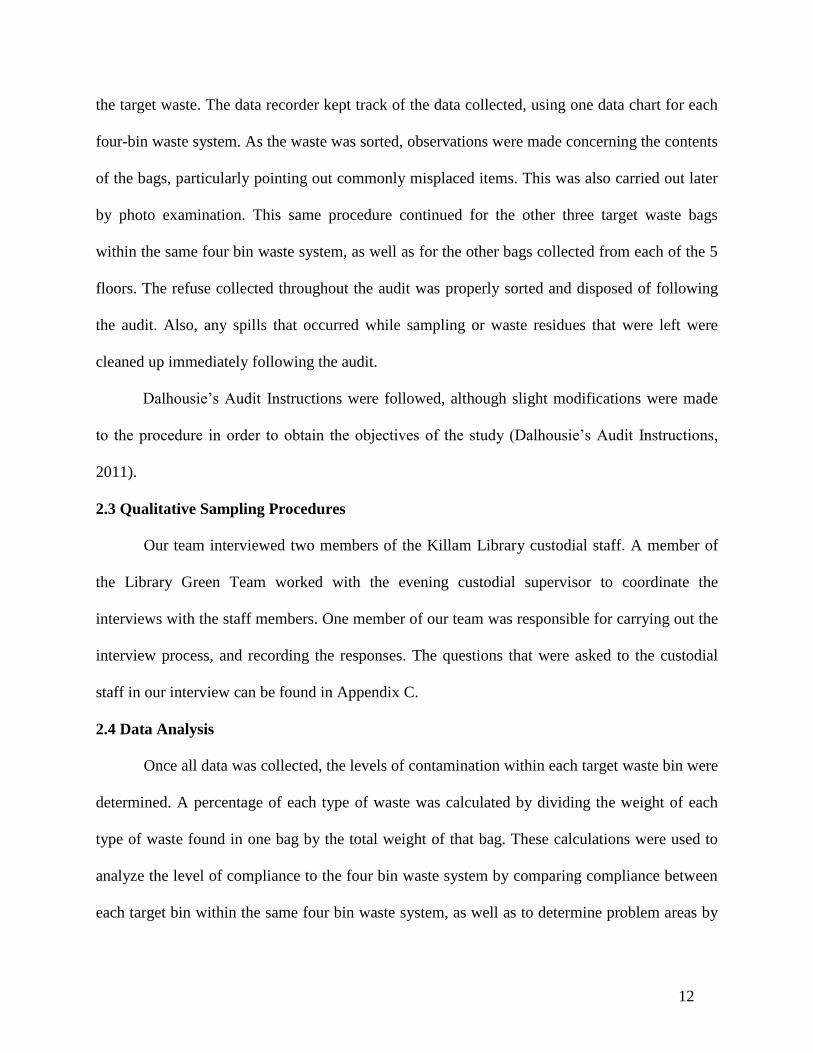
The first waste audit took place on March 15, 2011. The preliminary findings showed, by
visual estimation, that the garbage bins were the most contaminated and therefore had the lowest
compliance levels. After analysis of the data was completed it became apparent that because
contamination level was determined by weight, plastic actually had the highest contamination as
shown in the following graph.
Figure 1. The contamination level of the four waste bins from the 4-bin waste system on the
fourth floor collected in the firtst waste audit, on March 15, 2011.
The above graph shows that the plastic bin of the first system on the fourth floor had high
levels of contamination. Garbage was the worst contaminant, found in almost every bin of every
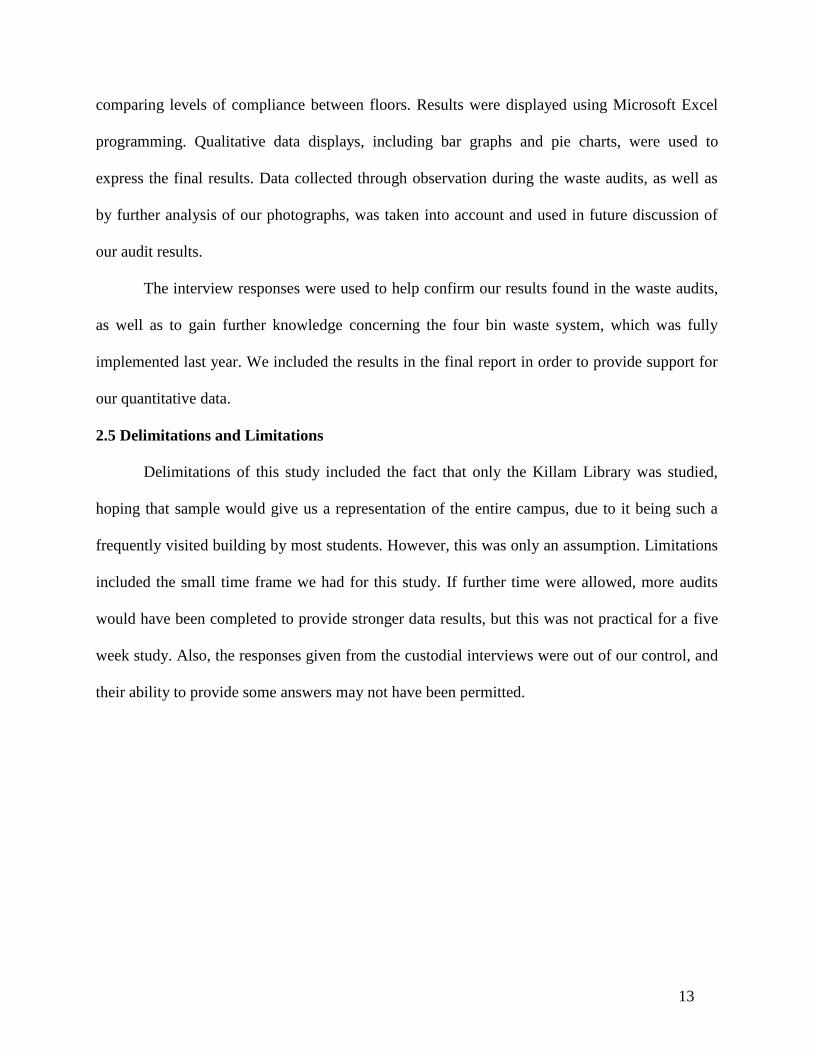
system. When garbage did appear in a bin, it was most likely found to be the heaviest (weight
recorded in grams), as shown in the table below.
15
Floor 2 - System 1: Quiet Area
Weight of each type of waste within target bin (grams)
Target Waste Type
Total Weight (g)
Garbage Paper Plastic Organic
Garbage 1550 1130 0 20 400
Paper 590 340 70 0 180
Plastic 730 220 0 460 50
Organic 1130 40 0 0 1090
Figure 2. The weight of waste collected from the Floor 2 – System 1 4-bin waste system on
the March 15, 2011 waste audit.
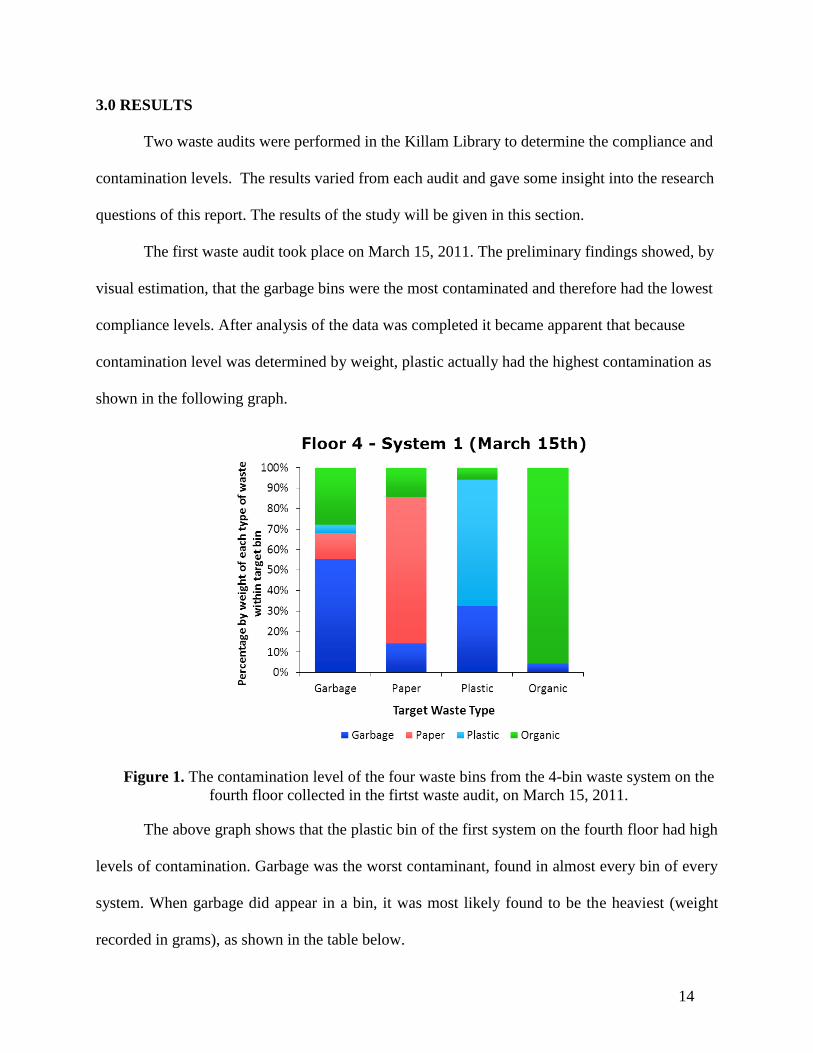
The second waste audit took place on March 22, 2011. Again, the plastic bins were
found to be the most contaminated. On every floor except the third the garbage bin was
contaminated with all of the other three types of waste; paper, plastic, and organic. This is shown
in the sample graph from the first system on the first floor. The high contamination levels are
quite easy to point out.
Figure 3. The contamination level of the four waste bins from the first 4-bin waste system on
the first floor collected in the second waste audit, on March 22, 2011.
16
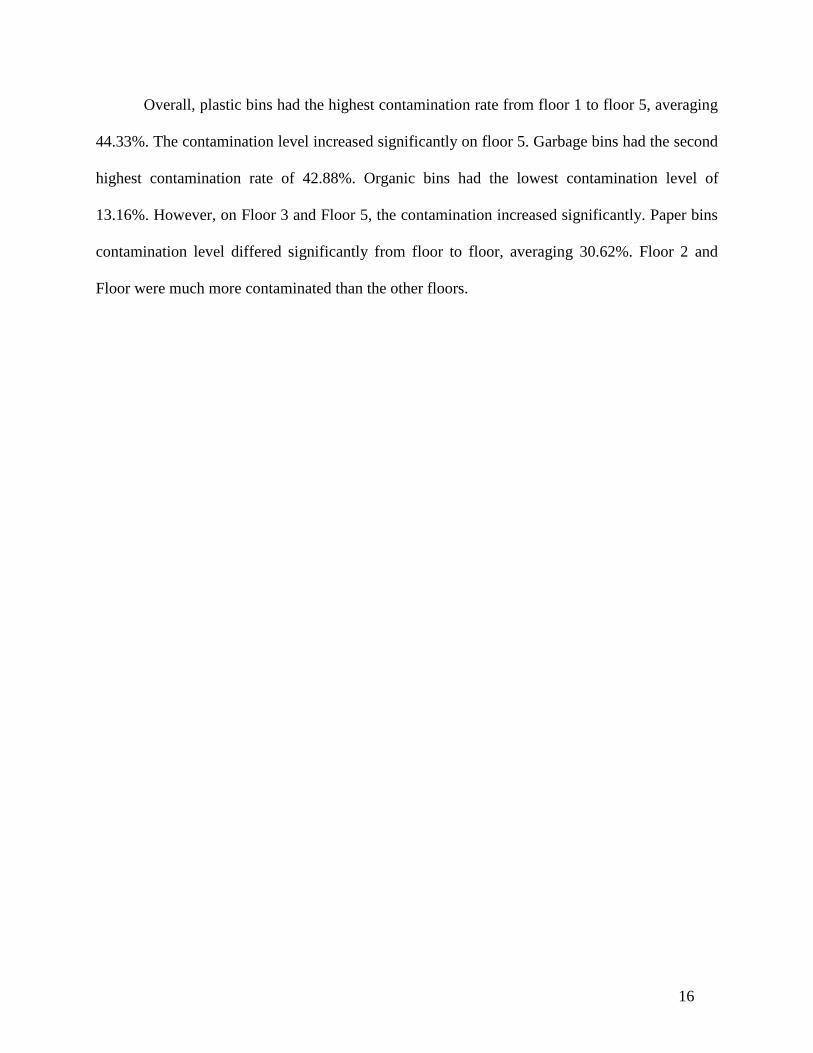
Overall, plastic bins had the highest contamination rate from floor 1 to floor 5, averaging
44.33%. The contamination level increased significantly on floor 5. Garbage bins had the second
highest contamination rate of 42.88%. Organic bins had the lowest contamination level of
13.16%. However, on Floor 3 and Floor 5, the contamination increased significantly. Paper bins
contamination level differed significantly from floor to floor, averaging 30.62%. Floor 2 and
Floor were much more contaminated than the other floors.
17
4.0 DISCUSSION
4.1 Summary of Research Question
This study was conducted to determine the compliance level within each waste type of
the four-bin disposal system on each floor of the Killam Library, to observe the commonly
misplaced items, and to track the degree of success of the four-bin systems that were
implemented last year. The Library Green Team hypothesized the contamination level on certain
floors or areas may be higher than the rest, and specific items may be continuously displaced. In
the previous study that was conducted in the Killam Library in 2010, coffee cups were found to
be most commonly displaced, and a waste audit on the pilot four-bin system showed that it was
possible to significantly increase the diversion rate (Heathcote, et al., 2010).
4.2 Significant Findings
Quantitative Findings
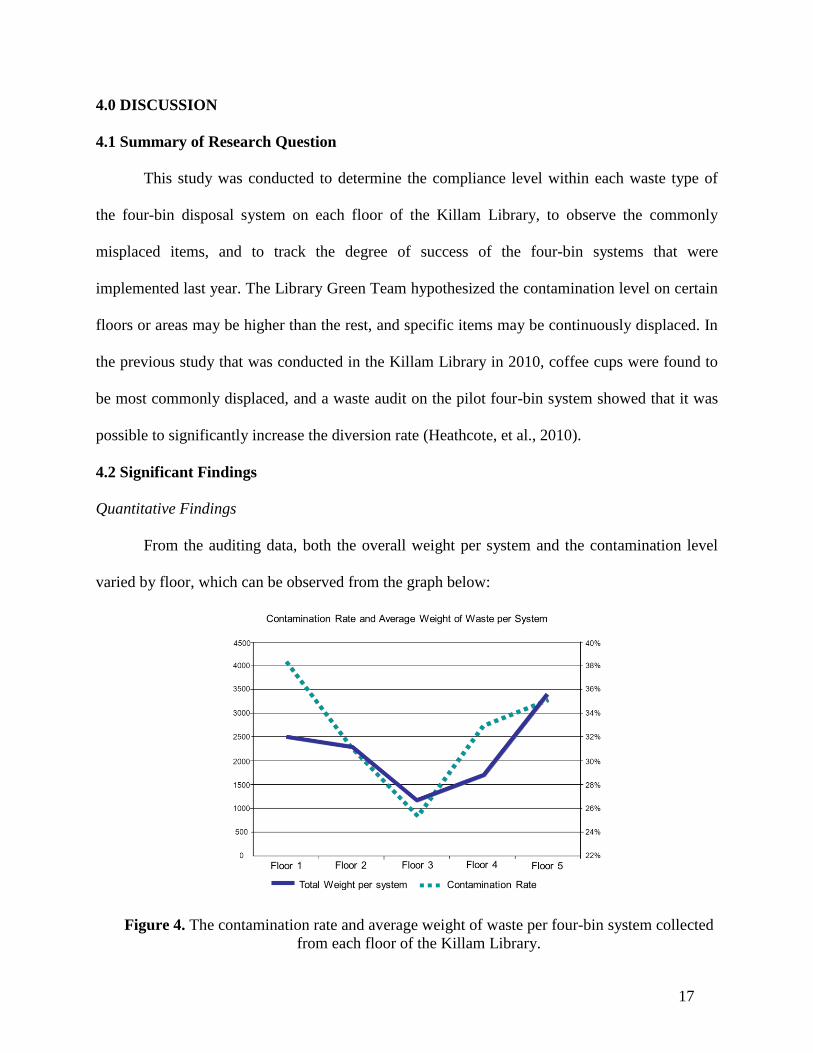
From the auditing data, both the overall weight per system and the contamination level
varied by floor, which can be observed from the graph below:
Figure 4. The contamination rate and average weight of waste per four-bin system collected
from each floor of the Killam Library.
18
Floor one, which is the busiest area in all the five floors and where the coffee shop and
food court are located, was observed to have the highest contamination level yet the amount of
waste was around average.
Interestingly, on the second floor, which is almost as busy as the ground floor, had a
similar amount of waste per system with floor one, but the contamination level was nearly 10%
lower. What is worth noticing is that the second floor is where the previous four-bin system pilot
project was conducted and where garbage cans were first completely replaced by four-bin
systems. Given this, it is possible that the length of time it took to replace individual garbage
cans with four-bin systems may have had an influence on people’s waste diversion behavior.
The atriums from floor three to floor five are quiet study areas, and food is not allowed
on the fourth floor. Among them, the 3rd
floor had the lowest contamination rate as well as the
least waste, and the reason remains unknown. The total weight of waste on the fourth floor was
below the overall average, but the contamination rate was fairly high. The atrium on floor five,
however, had a surprisingly large amount of waste, nearly 140% of the weight of waste on the
first floor; meanwhile, the contamination level was the second highest of all five floors, only
around 3% lower than the first floor. However, when looking into the composition of the
contamination in each bin, each garbage bin was observed to be heavily contaminated by organic
waste. Given that organic waste usually weighs more, the large amount of displaced organic
waste may contribute to both the weight of waste, as well as the contamination level.
In general, the contamination levels were not consistent from floor to floor; neither was
the overall amount of waste. The significant difference in amount of waste on different floors
indicated that the frequency and usage vary in different areas in the Killam, and these may have
had an impact on the waste diversion rate.
19
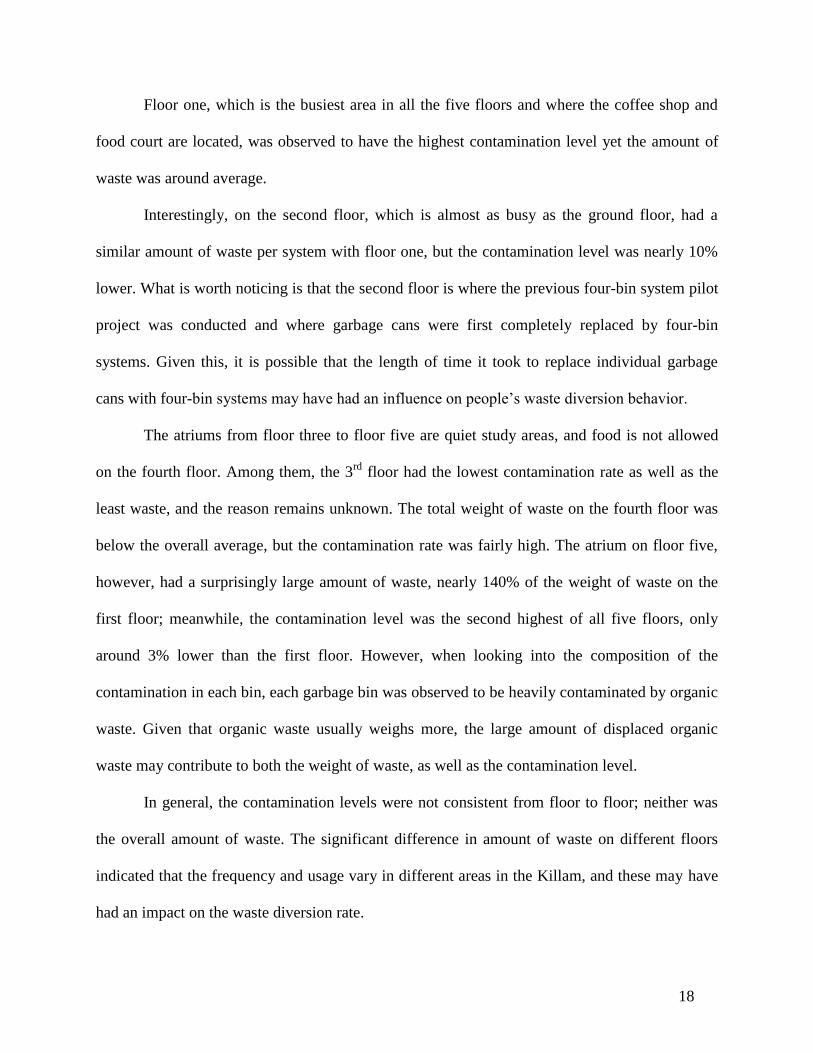
Figure 5. The contamination level calculated for each garbage bin within the 7 individual 4-
bin waste systems from both waste audits.
From the waste auditing, the general garbage bins had the second highest contamination
level. From the graph above, it is obvious that organic was the dominant contamination in
garbage bins; meanwhile, floor one and floor five show constant and significant high
contamination levels. The high contamination on floor one may have been because there was a
food court near by. What is worth mentioning is that the atrium on the 4th
floor is a quiet study
area, and, different from the atriums on the other floors, food is prohibited. However,
significantly lower amount of organic contamination was not observed on this floor in garbage
bins in both of the waste audits.
The organic contamination in the garbage bins on the 5th
floor was dominated by large
packs of food. For instance, in the second audit, a whole box of dishes was found, contributing
significantly to the contamination level.
20
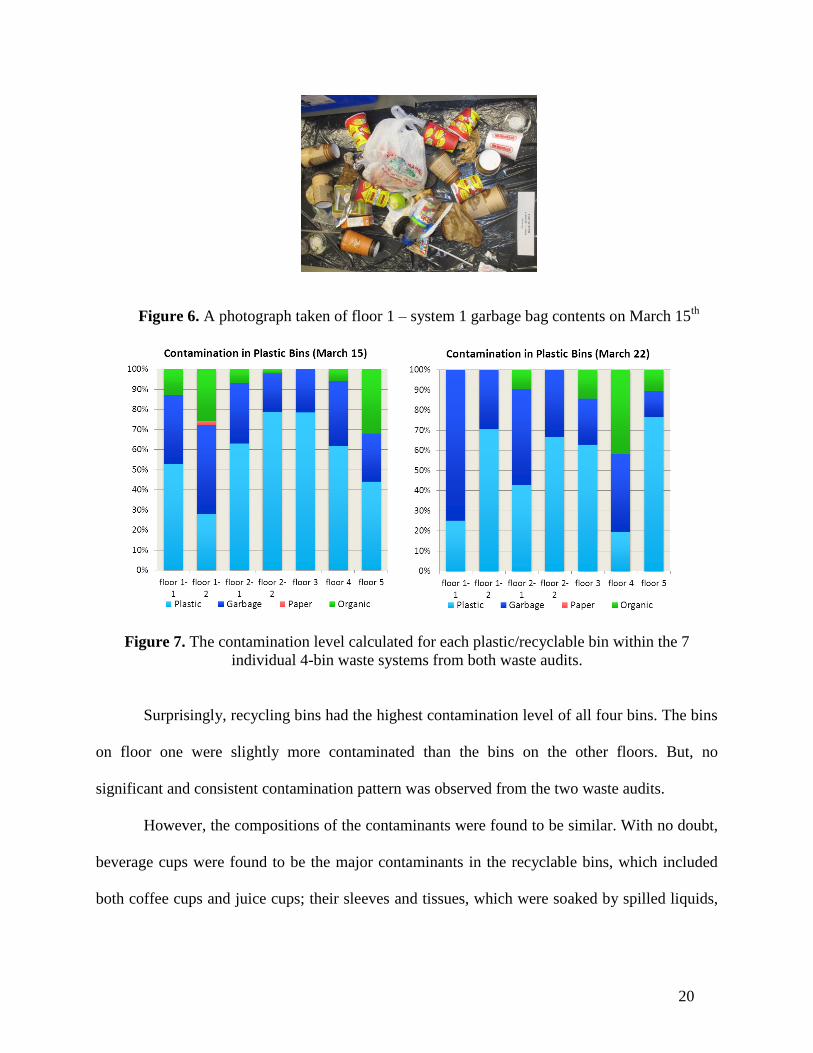
Figure 6. A photograph taken of floor 1 – system 1 garbage bag contents on March 15th
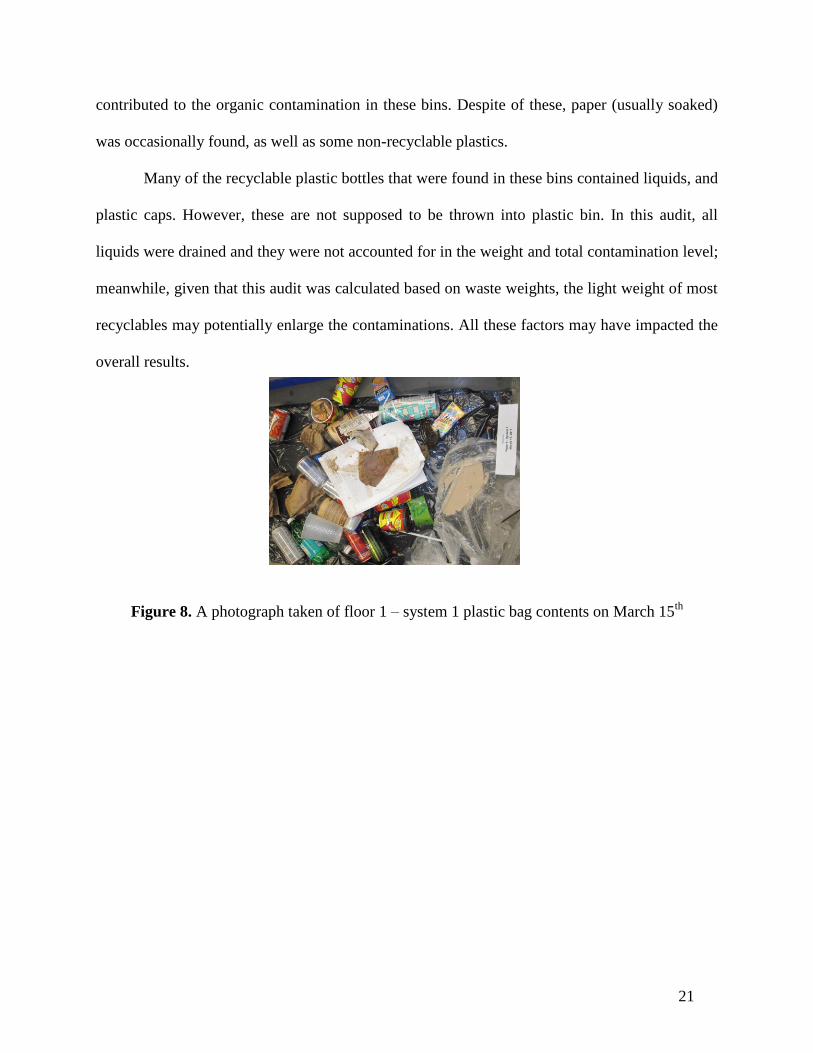
Figure 7. The contamination level calculated for each plastic/recyclable bin within the 7
individual 4-bin waste systems from both waste audits.
Surprisingly, recycling bins had the highest contamination level of all four bins. The bins
on floor one were slightly more contaminated than the bins on the other floors. But, no
significant and consistent contamination pattern was observed from the two waste audits.
However, the compositions of the contaminants were found to be similar. With no doubt,
beverage cups were found to be the major contaminants in the recyclable bins, which included
both coffee cups and juice cups; their sleeves and tissues, which were soaked by spilled liquids,
21
contributed to the organic contamination in these bins. Despite of these, paper (usually soaked)
was occasionally found, as well as some non-recyclable plastics.
Many of the recyclable plastic bottles that were found in these bins contained liquids, and
plastic caps. However, these are not supposed to be thrown into plastic bin. In this audit, all
liquids were drained and they were not accounted for in the weight and total contamination level;
meanwhile, given that this audit was calculated based on waste weights, the light weight of most
recyclables may potentially enlarge the contaminations. All these factors may have impacted the
overall results.
Figure 8. A photograph taken of floor 1 – system 1 plastic bag contents on March 15th
22
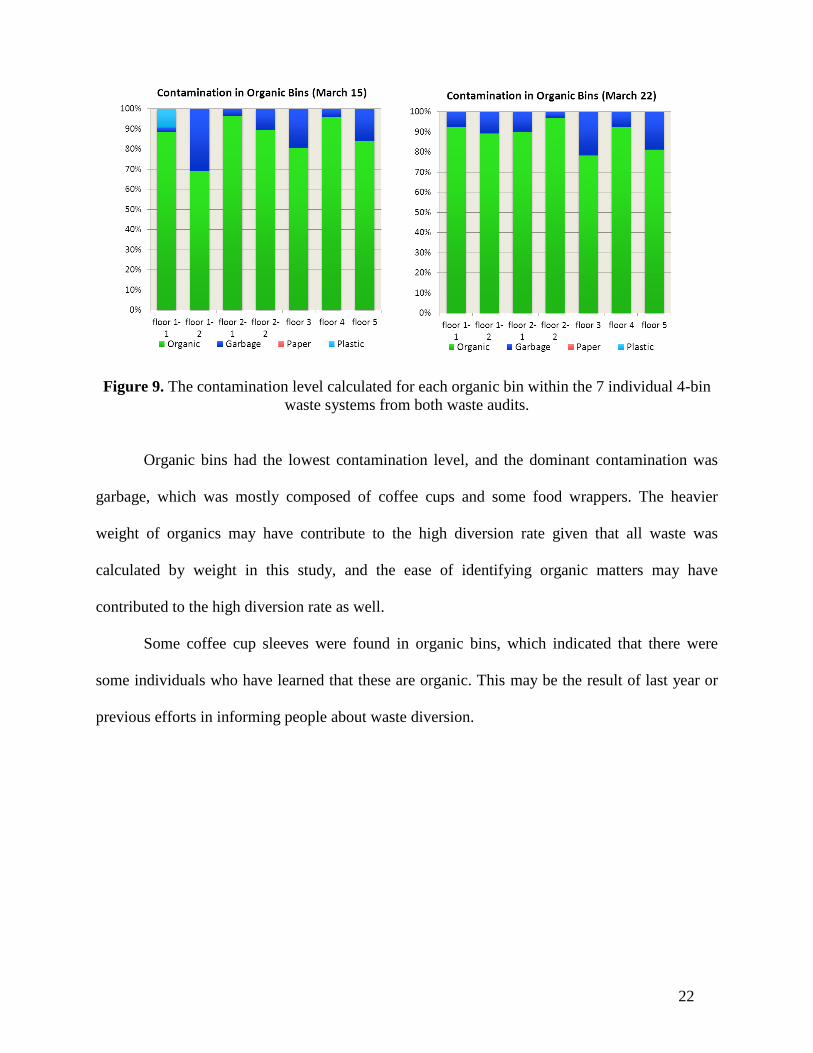
Figure 9. The contamination level calculated for each organic bin within the 7 individual 4-bin
waste systems from both waste audits.
Organic bins had the lowest contamination level, and the dominant contamination was
garbage, which was mostly composed of coffee cups and some food wrappers. The heavier
weight of organics may have contribute to the high diversion rate given that all waste was
calculated by weight in this study, and the ease of identifying organic matters may have
contributed to the high diversion rate as well.
Some coffee cup sleeves were found in organic bins, which indicated that there were
some individuals who have learned that these are organic. This may be the result of last year or
previous efforts in informing people about waste diversion.
23
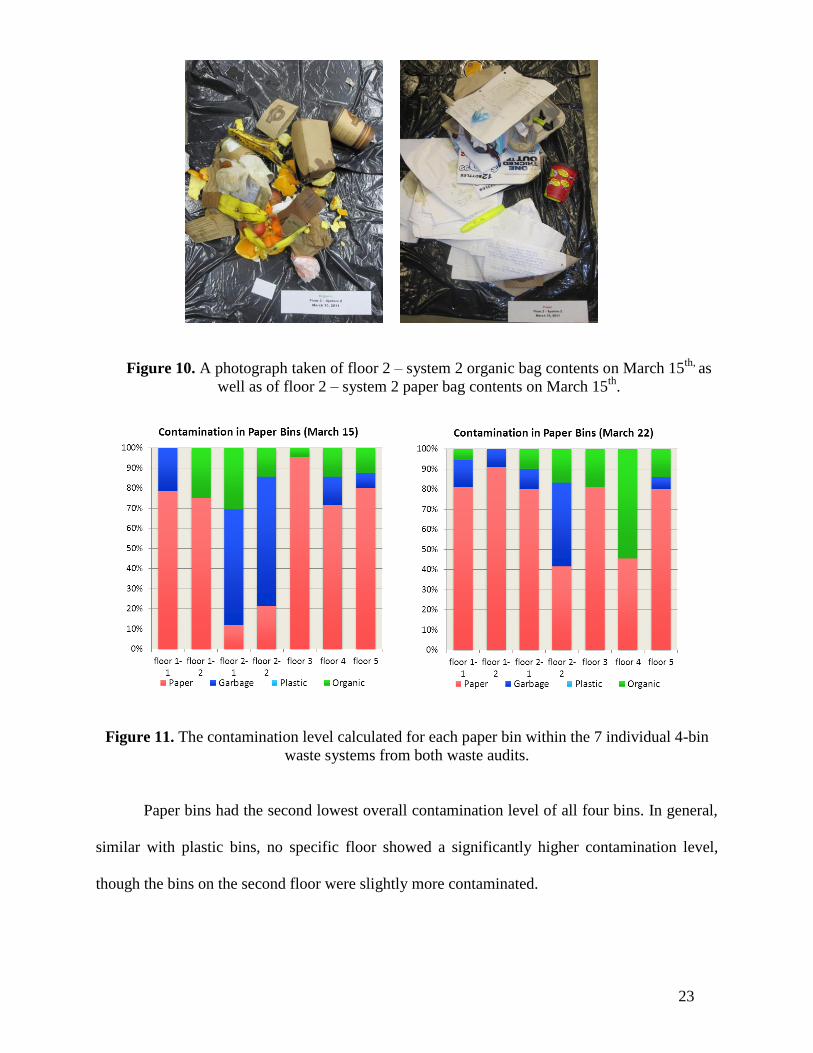
Figure 10. A photograph taken of floor 2 – system 2 organic bag contents on March 15th,
as
well as of floor 2 – system 2 paper bag contents on March 15th
.
Figure 11. The contamination level calculated for each paper bin within the 7 individual 4-bin
waste systems from both waste audits.
Paper bins had the second lowest overall contamination level of all four bins. In general,
similar with plastic bins, no specific floor showed a significantly higher contamination level,
though the bins on the second floor were slightly more contaminated.
24
Throughout the audit, coffee cups and food packaging were widely observed, we well,
stationary products were found on the second floor in the first audit. It is not common, however,
in the second audit, the leftover coffee in coffee cups soaked the paper. Therefore, the wet paper
had to be counted as organic instead of diverting it to the paper bin. In addition, napkins and
coffee cup sleeves were observed in paper bins.
Qualitative Finding
From the two interviews with custodial staff, an improvement of waste diversion had
been noticed since the implementation of the four-bin system. However, staff commented that
the four bins are always contaminated and no particular system has been observed to be
significantly more contaminated than the others. In addition, they mentioned that coffee cups and
cans are the major contaminants while the messy liquids are a problem as well.
The observations by the custodial staff that diversion rate has increased since last year,
the dominant contribution of coffee cups in the contamination rate, as well as the problem of
liquids, were consistent with the results of the waste audits. However, during the auditing, cans
were not observed to be major contaminates from both the audit data and photos. The reason
may be that the cans are very light thus can be less reflected in a weight-based waste audit. In
addition, the garbage bags for all the bins except garbage bins are transparent. These two factors
together with the comparatively large volume of cans may make these contaminations more
noticeable. Only two waste audits were conducted for this study, and it may have been an
anomaly that these two days had less can contaminations.
25
4.3 Other Key Findings
Coffee cups were still the dominant contaminant in all four bins in the Killam; however,
beside the diversion of coffee cups themselves, there were several other significant factors that
contributed to the contamination.
In garbage bins, organic was the major type of contamination, and vice versa. However,
the organic bins were much less contaminated than garbage bins. From what was observed in the
audits, the organic contamination in garbage bins (e.g. rice, pizza) were all packed in packages
like plastic and paper boxes, and plastic coated paper. One reason may be that it is much easier to
throw away food with its package rather than throwing food into organic bins separately. Also,
sanitary concerns of individuals, for example, spilling food outside the bin or having it stick on
to the cover of the bins, may have discouraged people from diverting their waste. Education or
improvement on this specific issue may help to decrease this contamination, and improve
diversion. Further research on the behaviours and reasons why people do not separate their food
may be useful.
The plastic coated paper wrappers were commonly displaced as well. These bags should
be thrown in the garbage bins, however many of them were observed in paper and organic bins.
These individuals must have had good intentions to try to recycle these products, although they
were not sure which bin was appropriate.
Other than the lack of diversion of coffee cups and their sleeves, tea bags and liquid
inside the coffee cups were also a problem. Tea bags were unusually diverted into organic bins,
and the unfinished liquids commonly contaminated the paper if they were displaced into paper
bins. During the collection of garbage bags during the auditing, several bags were found to be
leaking, creating a serious inconvenience to custodial staff. To avoid this problem, staff often
26
double bagged these bins to prevent leaking, which would double the consumption of plastic
garbage bags.
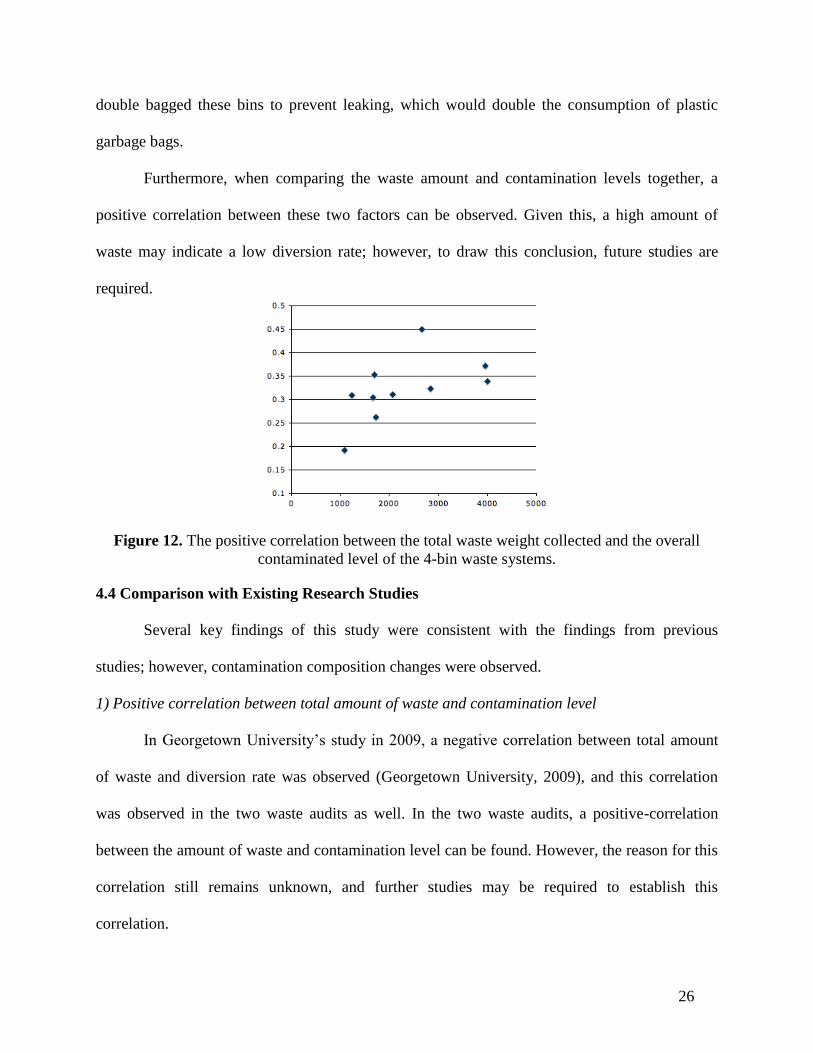
Furthermore, when comparing the waste amount and contamination levels together, a
positive correlation between these two factors can be observed. Given this, a high amount of
waste may indicate a low diversion rate; however, to draw this conclusion, future studies are
required.
Figure 12. The positive correlation between the total waste weight collected and the overall
contaminated level of the 4-bin waste systems.
4.4 Comparison with Existing Research Studies
Several key findings of this study were consistent with the findings from previous
studies; however, contamination composition changes were observed.
1) Positive correlation between total amount of waste and contamination level
In Georgetown University’s study in 2009, a negative correlation between total amount
of waste and diversion rate was observed (Georgetown University, 2009), and this correlation
was observed in the two waste audits as well. In the two waste audits, a positive-correlation
between the amount of waste and contamination level can be found. However, the reason for this
correlation still remains unknown, and further studies may be required to establish this
correlation.
27
2) Most commonly displaced Item: coffee cups
Coffee cups remained the number one displaced item, which was consistent with the
observation from the waste audit in the Killam in 2010 (Heathcote, et al., 2010), and it was
commonly found in all the rest of the three bins. However, it is worth noticing is that some of
cold drink cups are plastic #1 and can be recycled but were found to be displaced in garbage
bins. With the warming weather, it is reasonable to estimate that more cold drink cup waste will
be created and its contribution to contamination level will increase.
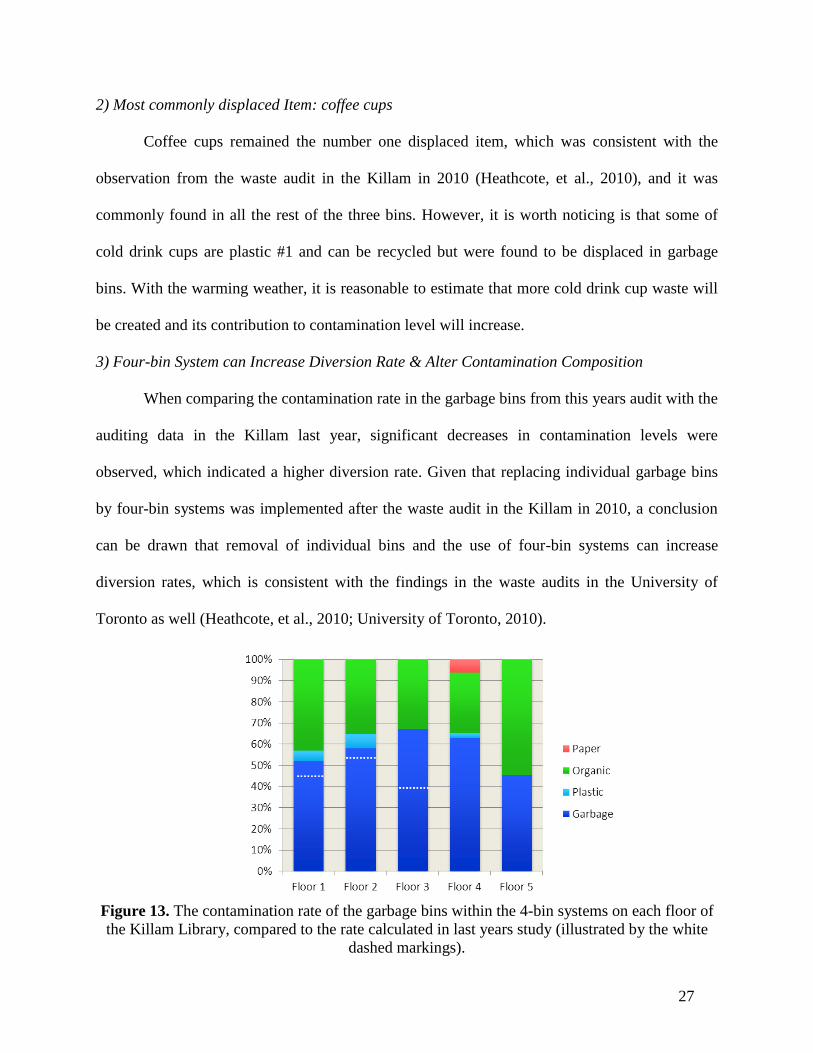
3) Four-bin System can Increase Diversion Rate & Alter Contamination Composition
When comparing the contamination rate in the garbage bins from this years audit with the
auditing data in the Killam last year, significant decreases in contamination levels were
observed, which indicated a higher diversion rate. Given that replacing individual garbage bins
by four-bin systems was implemented after the waste audit in the Killam in 2010, a conclusion
can be drawn that removal of individual bins and the use of four-bin systems can increase
diversion rates, which is consistent with the findings in the waste audits in the University of
Toronto as well (Heathcote, et al., 2010; University of Toronto, 2010).
Figure 13. The contamination rate of the garbage bins within the 4-bin systems on each floor of
the Killam Library, compared to the rate calculated in last years study (illustrated by the white
dashed markings).
28
The composition of contamination in garbage bins has become less diverse since last
year: the contaminations of displaced paper waste and recyclable waste have decreased
tremendously, and displaced organic became the dominant contamination. These changes were
not observed from previous studies (Heathercote, et al., 2010). This may be because the
implementation of four-bin systems has raised people’s awareness of waste diversion.
4.5 Implications for theory
Given the information and discussion above, one theory may be carefully drawn that the
implementation of four-bin systems can increase diversion rates, and the composition of
contamination will change; the contamination level, as well as the total amount of waste, varies
in different locations. A positive-correlation between overall amount of waste and contamination
rate is observed, however, the causation still remains unknown, and further research is needed to
draw a conclusion about this relationship.
4.6 Findings which supported and failed to support the hypothesis
The findings from the two audits were consistent with the Library Green Team’s
hypothesis that contamination level would vary in different locations. Generally, the
contamination level on floor one was the highest, and it was found lowest on floor three.
However, no particular pattern was observed. Also plastic/recycling and paper bins were
particularly highly contaminated, which failed to support the hypothesis.
The hypothesis that there would be commonly displaced contaminants was supported by
the observations. The commonly displaced items were found to be coffee cups, plastic coated
paper bags and wrappers, packed food, and liquids. Even though some unexpected and
uncommon items like stationary dominated the contamination in one specific bin in one audit,
29
most displaced items were the commonly displaced ones. There was no significant finding that
failed to support this hypothesis.
30
5.0 CONCLUSION
Conduction of this waste audit research study has brought forth several dominant
problems within the waste diversion four-bin systems, and the compliance levels within the
Dalhousie Killam Library. Interviews with the custodial staff working prior to the
implementation of the four-bin systems and collected data indicated that there have been major
improvements in the compliance levels of waste diversion after implementation. Although there
have been improvements, each bin remained contaminated on a daily basis with common items
such as coffee cups and cans.
5.1 Recommendations for Actions
After collecting and analyzing the data, it was evident to see where the problem areas
were situated within the four-bins waste diversion systems. The following is a list of solutions
developed in hopes of improving and increase the compliance levels within these four-bins
systems.
Proposed Solutions:
1. Designing a tour that will educate students about sustainability on Dalhousie’s campus.
One of the stops will educate students on the importance of the four-bin systems, and
teach them how to properly use them.
2. Liquid was a major contaminant within many of the bins, primarily from unfinished
beverages. Implementation of a liquid waste bucket as a fifth bin would help to decrease
the problem as liquid as a major contaminant, and would also protect other items from
becoming contaminated, such as paper towel.
3. Designing an online educational waste diversion visual link, which would be available on
the Library Green Teams Homepage.
31
4. Implementation of more informative diversion sings, which would be permanently posted
above the four-bin systems. Photos of recognizable brands may also help students and
faculty know where to dispose of their waste, Tim Horton’s coffee cups, Second Cup
bags and coffee cups, etc.
5.2 Recommendations for Future Research
This study strived to address which bins had the highest levels of contamination and why,
however, there are many other studies that could be conducted pertaining to the compliance
levels of the four-bin systems in the Killam. Recommendations for future research could include
the social relationship of individuals between floors with the lowest or highest compliance levels.
As well as a study regarding which sort of sorting and diversion posters work the most efficiently
would be beneficial to improving the compliance rates.
32
6.0 REFERENCES
Brooks, K., et al. (2006). An Evaluation of Dalhousie University's Campus Recycling Program.
Retrieved February 21, 2011, from Office of Sustainability: http://environmental.science.
dal.ca/Files/Environmental%20Programs/MaterialsProject.pdf
Christian, S., et al. (2010). Studley Campus Walkability Assessment. Retrieved February 15,
2011, from Environmental Problem Solving II: The Campus as a Living Laboratory:
http://environmental.science.dal.ca/Files/Environmental%20Programs/ENVS_3502_proj
ects_2010/Walkability.pdf
Dalhousie University (2005). Facilities Management. The Dalhousie Guide to Waste
Management on Campus. Retrieved February 10, 2011 on the World Wide Web:
http://fm.dal.ca/recycling.htm
Dalhousie University (2011). Dalhousie’s Waste Audit Instructions.
Facilities Management. (2009). The Dalhousie Guide to Waste Management on Campus.
Retrieved February 21, 2011, from Facilities Management (Environmental Services),
Dalhousie University:
http://fm.dal.ca/documents/pdf/Dalhousie_Guide_to_Waste_Managem
ent__Version_Oct__2009.pdf
Georgetown University. (2009). Solid Waste and Recycling – Georgetown University – FY 2008
and 2009. Retrieved February 21, 2011, from Sustainability at Georgetown University:
http://sustainability.georgetown.edu/initiatives/recycling/recycling.fy2008-09.cfm
Heathcote, A., et al. (2010). Conducting a Waste Audit in the Killam Library at Dalhousie
University to Establish Waste Habits and Locate Problem Area. Retrieved February 21,
2011, from Campus Student Research, Office of Sustainability, Dalhousie University:
http://environmental.science.dal.ca/Files/Environmental%20Programs/ENVS_3502_projec
ts_2010/WasteAudit.pdf
MITnews. (2003, October 29). Waste audit identifies recycling opportunities. Retrieved February
21, 2011, from MITnews: http://web.mit.edu/newsoffice/2003/waste-1029.html
Ontario Ministry of the Environment. (2010, 12 8). Waste Diversion. Retrieved February 21,
2011, from Ontario Ministry of the Environment:
http://www.ene.gov.on.ca/environment/e n/subject/waste_diversion/index.htm
Palys and Atchinson (2008). Chapter 4 Sampling in Research Decisions 4th Edition. Toronto:
Thomson Nelson.
Solid Waste District (2011). How to Conduct a Waste Audit. Retrieved on February 14, 2011 on
the World Wide Web: http://www.solidwastedistrict.com/projects/waste_audit.htm
33
University of Toronto. (2010). Waste Audits and Waste Reduction Plan. Retrieved February 21.
2011, from Recycling and Waste Management: http://www.fs.utoronto.ca/recycle/wa
steaudit.htm
34
7.0 ACKNOWLEDGEMENTS
Our team would like to thank the following people for their assistance on our project. It
would not have been possible or have gone as smoothly without them. Thank you to our
instructors, Tarah Wright and Rochelle Owen for their helpful mentoring, The Library Green
Team, Michelle Poan, Jan Pelley, Janice Slauenwhite, Sandra Dwyer, and Leigh Smith for their
continual support and assistance throughout our project, the daytime custodial supervisor, Carla
Hill, for helping with the organization, labeling and collection of the waste during our audits, the
evening custodial supervisor, Juanita Haas, for her help in arranging the interviews, Nancy
Melvin, for arranging the location of our waste auditing, Gary Davidson, for the helpful training
session on the proper ways to conduct a waste audit he provided, Michael Wilkinson, of
Facilities Management, for providing the necessary bins, gloves and scale required to conduct
the audit, and to The Company House for hosting the Pecha Kucha night. Thank you!
35
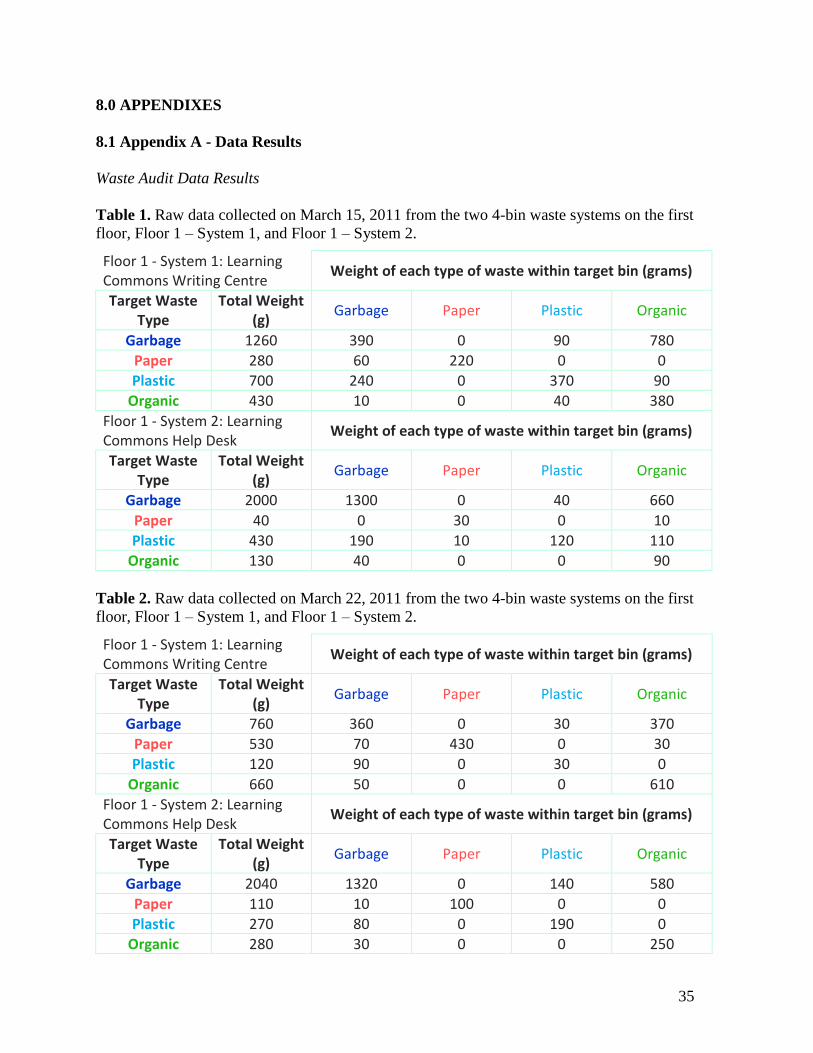
8.0 APPENDIXES
8.1 Appendix A - Data Results
Waste Audit Data Results
Table 1. Raw data collected on March 15, 2011 from the two 4-bin waste systems on the first
floor, Floor 1 – System 1, and Floor 1 – System 2.
Floor 1 - System 1: Learning Commons Writing Centre
Weight of each type of waste within target bin (grams)
Target Waste Type
Total Weight (g)
Garbage Paper Plastic Organic
Garbage 1260 390 0 90 780
Paper 280 60 220 0 0
Plastic 700 240 0 370 90
Organic 430 10 0 40 380
Floor 1 - System 2: Learning Commons Help Desk
Weight of each type of waste within target bin (grams)
Target Waste Type
Total Weight (g)
Garbage Paper Plastic Organic
Garbage 2000 1300 0 40 660
Paper 40 0 30 0 10
Plastic 430 190 10 120 110
Organic 130 40 0 0 90
Table 2. Raw data collected on March 22, 2011 from the two 4-bin waste systems on the first
floor, Floor 1 – System 1, and Floor 1 – System 2.
Floor 1 - System 1: Learning Commons Writing Centre
Weight of each type of waste within target bin (grams)
Target Waste Type
Total Weight (g)
Garbage Paper Plastic Organic
Garbage 760 360 0 30 370
Paper 530 70 430 0 30
Plastic 120 90 0 30 0
Organic 660 50 0 0 610
Floor 1 - System 2: Learning Commons Help Desk
Weight of each type of waste within target bin (grams)
Target Waste Type
Total Weight (g)
Garbage Paper Plastic Organic
Garbage 2040 1320 0 140 580
Paper 110 10 100 0 0
Plastic 270 80 0 190 0
Organic 280 30 0 0 250
36
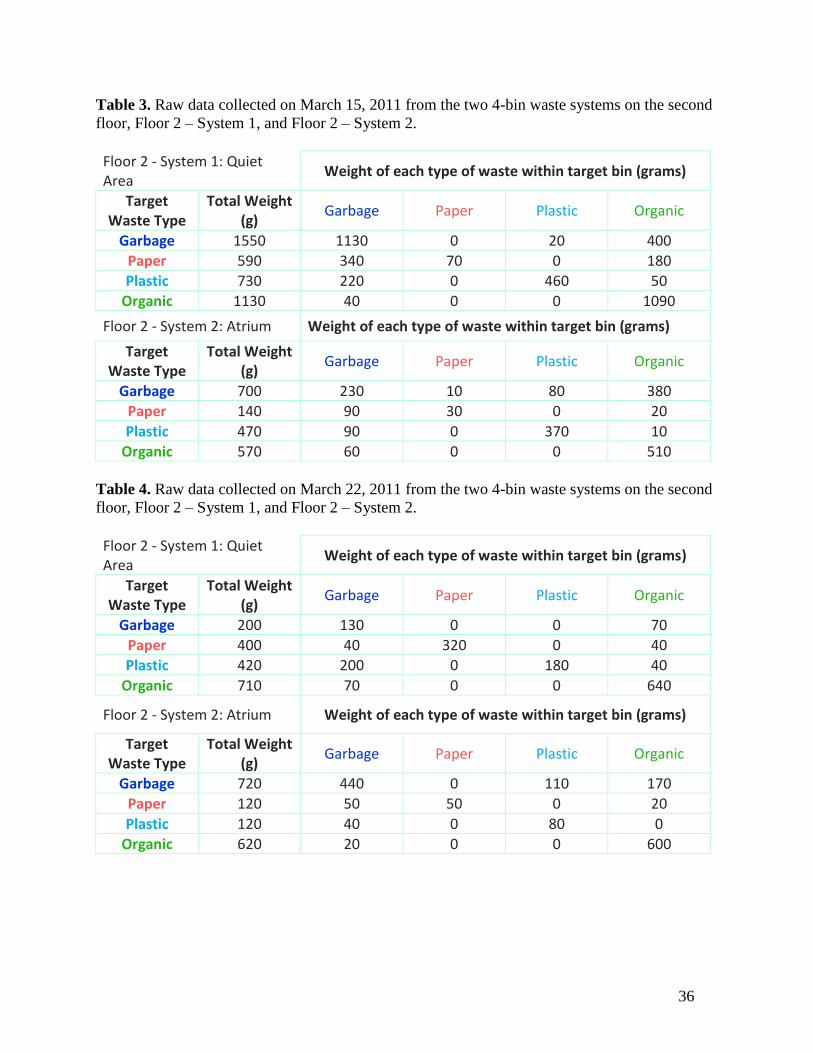
Table 3. Raw data collected on March 15, 2011 from the two 4-bin waste systems on the second
floor, Floor 2 – System 1, and Floor 2 – System 2.
Floor 2 - System 1: Quiet Area
Weight of each type of waste within target bin (grams)
Target Waste Type
Total Weight (g)
Garbage Paper Plastic Organic
Garbage 1550 1130 0 20 400
Paper 590 340 70 0 180
Plastic 730 220 0 460 50
Organic 1130 40 0 0 1090
Floor 2 - System 2: Atrium Weight of each type of waste within target bin (grams)
Target Waste Type
Total Weight (g)
Garbage Paper Plastic Organic
Garbage 700 230 10 80 380
Paper 140 90 30 0 20
Plastic 470 90 0 370 10
Organic 570 60 0 0 510
Table 4. Raw data collected on March 22, 2011 from the two 4-bin waste systems on the second
floor, Floor 2 – System 1, and Floor 2 – System 2.
Floor 2 - System 1: Quiet Area
Weight of each type of waste within target bin (grams)
Target Waste Type
Total Weight (g)
Garbage Paper Plastic Organic
Garbage 200 130 0 0 70
Paper 400 40 320 0 40
Plastic 420 200 0 180 40
Organic 710 70 0 0 640
Floor 2 - System 2: Atrium Weight of each type of waste within target bin (grams)
Target Waste Type
Total Weight (g)
Garbage Paper Plastic Organic
Garbage 720 440 0 110 170
Paper 120 50 50 0 20
Plastic 120 40 0 80 0
Organic 620 20 0 0 600
37
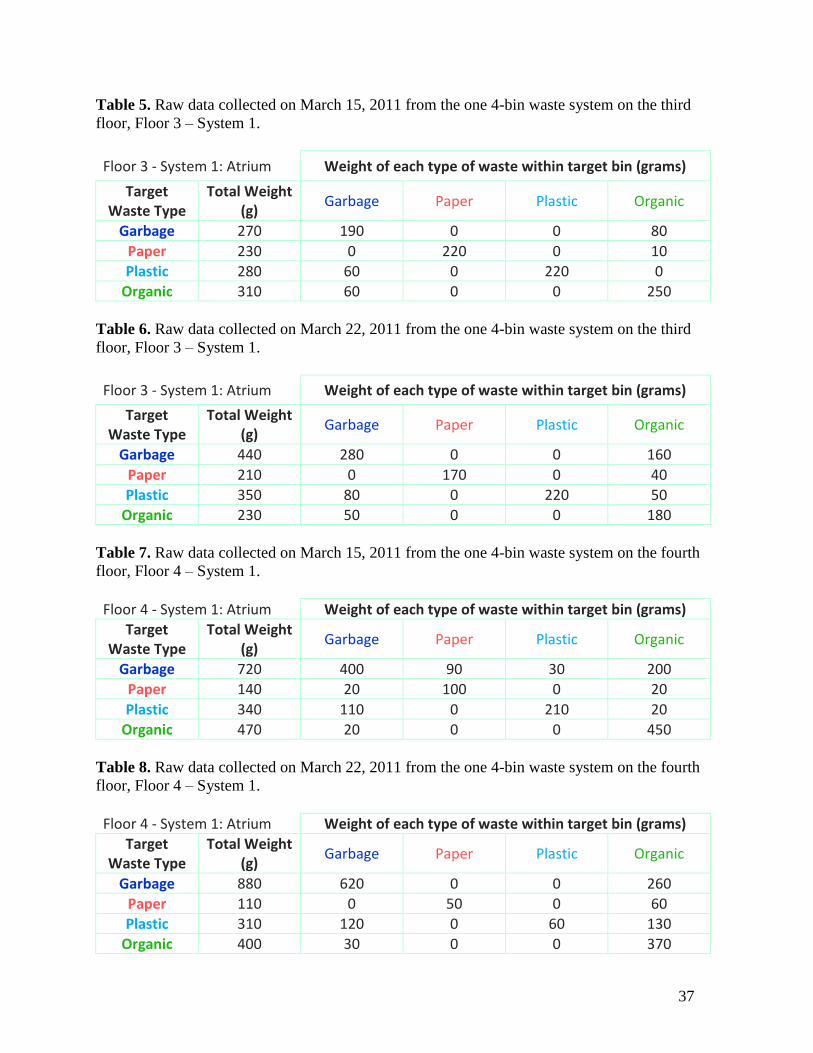
Table 5. Raw data collected on March 15, 2011 from the one 4-bin waste system on the third
floor, Floor 3 – System 1.
Floor 3 - System 1: Atrium Weight of each type of waste within target bin (grams)
Target Waste Type
Total Weight (g)
Garbage Paper Plastic Organic
Garbage 270 190 0 0 80
Paper 230 0 220 0 10
Plastic 280 60 0 220 0
Organic 310 60 0 0 250
Table 6. Raw data collected on March 22, 2011 from the one 4-bin waste system on the third
floor, Floor 3 – System 1.
Floor 3 - System 1: Atrium Weight of each type of waste within target bin (grams)
Target Waste Type
Total Weight (g)
Garbage Paper Plastic Organic
Garbage 440 280 0 0 160
Paper 210 0 170 0 40
Plastic 350 80 0 220 50
Organic 230 50 0 0 180
Table 7. Raw data collected on March 15, 2011 from the one 4-bin waste system on the fourth
floor, Floor 4 – System 1.
Floor 4 - System 1: Atrium Weight of each type of waste within target bin (grams)
Target Waste Type
Total Weight (g)
Garbage Paper Plastic Organic
Garbage 720 400 90 30 200
Paper 140 20 100 0 20
Plastic 340 110 0 210 20
Organic 470 20 0 0 450
Table 8. Raw data collected on March 22, 2011 from the one 4-bin waste system on the fourth
floor, Floor 4 – System 1.
Floor 4 - System 1: Atrium Weight of each type of waste within target bin (grams)
Target Waste Type
Total Weight (g)
Garbage Paper Plastic Organic
Garbage 880 620 0 0 260
Paper 110 0 50 0 60
Plastic 310 120 0 60 130
Organic 400 30 0 0 370
38
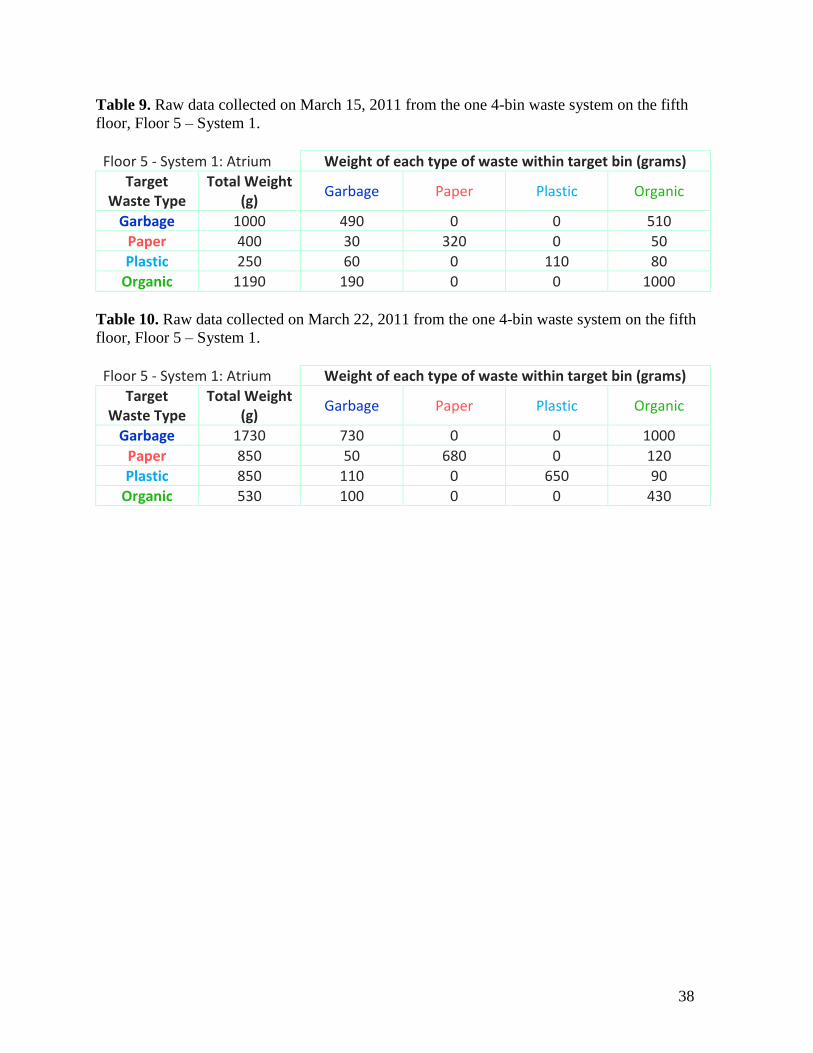
Table 9. Raw data collected on March 15, 2011 from the one 4-bin waste system on the fifth
floor, Floor 5 – System 1.
Floor 5 - System 1: Atrium Weight of each type of waste within target bin (grams)
Target Waste Type
Total Weight (g)
Garbage Paper Plastic Organic
Garbage 1000 490 0 0 510
Paper 400 30 320 0 50
Plastic 250 60 0 110 80
Organic 1190 190 0 0 1000
Table 10. Raw data collected on March 22, 2011 from the one 4-bin waste system on the fifth
floor, Floor 5 – System 1.
Floor 5 - System 1: Atrium Weight of each type of waste within target bin (grams)
Target Waste Type
Total Weight (g)
Garbage Paper Plastic Organic
Garbage 1730 730 0 0 1000
Paper 850 50 680 0 120
Plastic 850 110 0 650 90
Organic 530 100 0 0 430
39
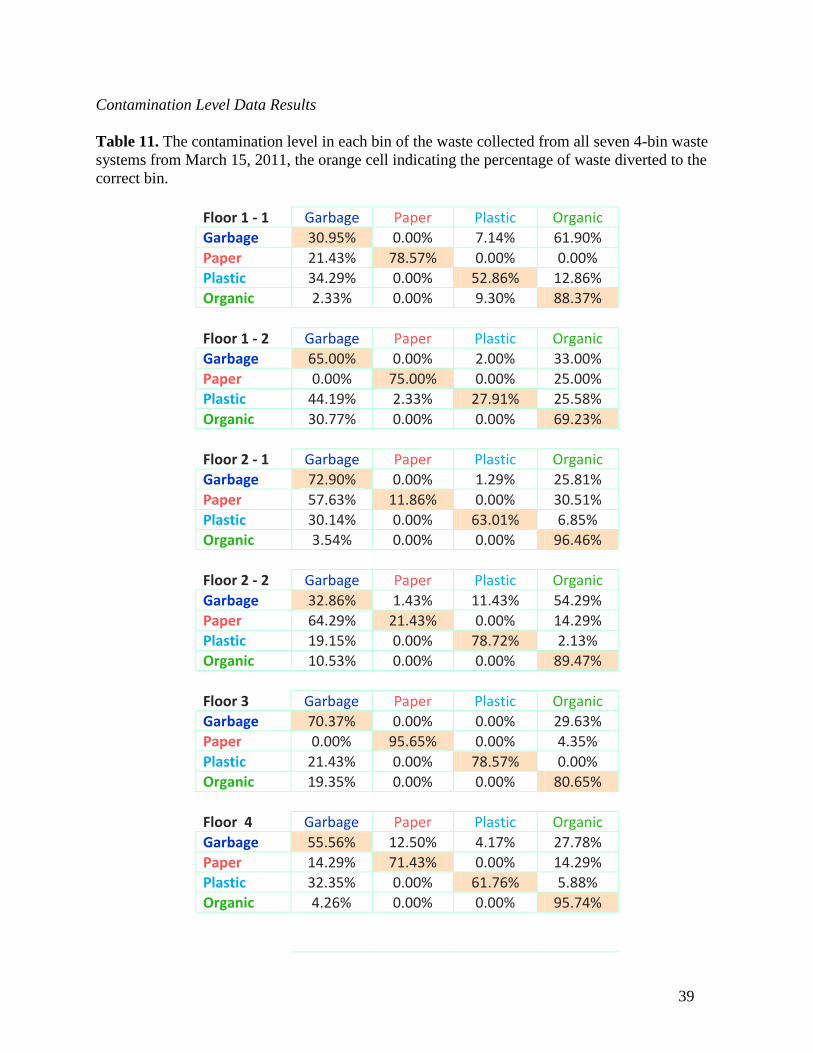
Contamination Level Data Results
Table 11. The contamination level in each bin of the waste collected from all seven 4-bin waste
systems from March 15, 2011, the orange cell indicating the percentage of waste diverted to the
correct bin.
Floor 1 - 1 Garbage Paper Plastic Organic
Garbage 30.95% 0.00% 7.14% 61.90%
Paper 21.43% 78.57% 0.00% 0.00%
Plastic 34.29% 0.00% 52.86% 12.86%
Organic 2.33% 0.00% 9.30% 88.37%
Floor 1 - 2 Garbage Paper Plastic Organic
Garbage 65.00% 0.00% 2.00% 33.00%
Paper 0.00% 75.00% 0.00% 25.00%
Plastic 44.19% 2.33% 27.91% 25.58%
Organic 30.77% 0.00% 0.00% 69.23%
Floor 2 - 1 Garbage Paper Plastic Organic
Garbage 72.90% 0.00% 1.29% 25.81%
Paper 57.63% 11.86% 0.00% 30.51%
Plastic 30.14% 0.00% 63.01% 6.85%
Organic 3.54% 0.00% 0.00% 96.46%
Floor 2 - 2 Garbage Paper Plastic Organic
Garbage 32.86% 1.43% 11.43% 54.29%
Paper 64.29% 21.43% 0.00% 14.29%
Plastic 19.15% 0.00% 78.72% 2.13%
Organic 10.53% 0.00% 0.00% 89.47%
Floor 3 Garbage Paper Plastic Organic
Garbage 70.37% 0.00% 0.00% 29.63%
Paper 0.00% 95.65% 0.00% 4.35%
Plastic 21.43% 0.00% 78.57% 0.00%
Organic 19.35% 0.00% 0.00% 80.65%
Floor 4 Garbage Paper Plastic Organic
Garbage 55.56% 12.50% 4.17% 27.78%
Paper 14.29% 71.43% 0.00% 14.29%
Plastic 32.35% 0.00% 61.76% 5.88%
Organic 4.26% 0.00% 0.00% 95.74%
40
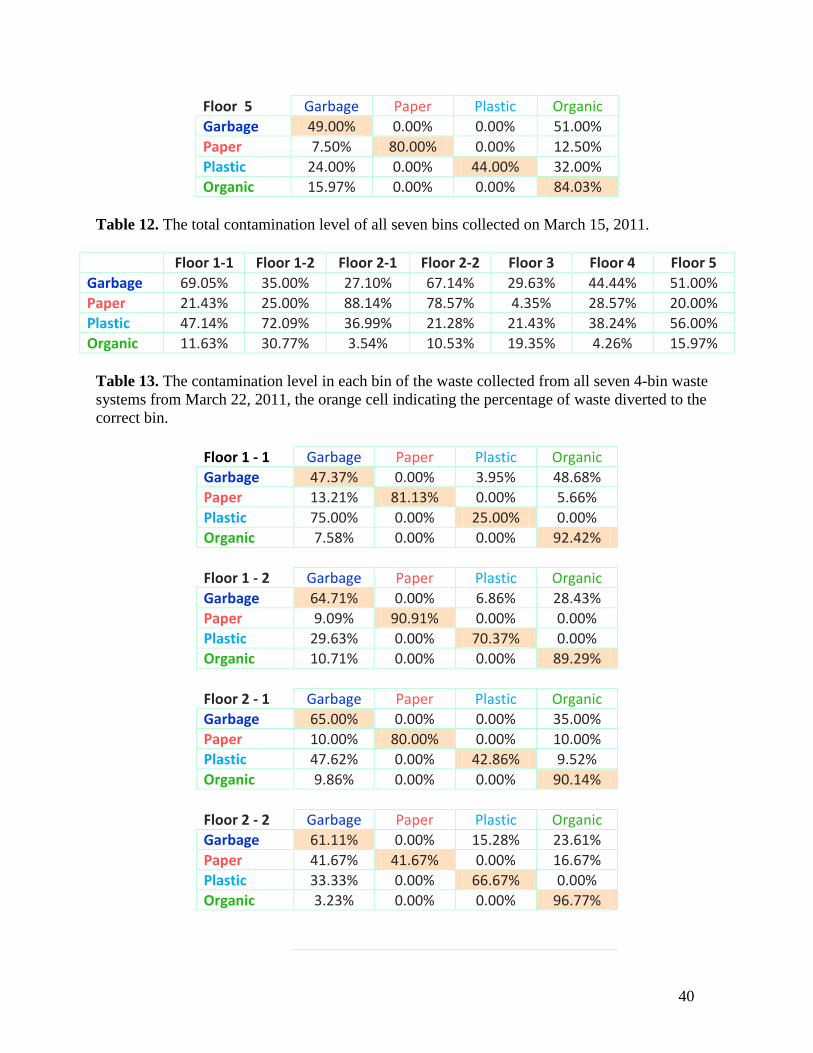
Floor 5 Garbage Paper Plastic Organic
Garbage 49.00% 0.00% 0.00% 51.00%
Paper 7.50% 80.00% 0.00% 12.50%
Plastic 24.00% 0.00% 44.00% 32.00%
Organic 15.97% 0.00% 0.00% 84.03%
Table 12. The total contamination level of all seven bins collected on March 15, 2011.
Floor 1-1 Floor 1-2 Floor 2-1 Floor 2-2 Floor 3 Floor 4 Floor 5
Garbage 69.05% 35.00% 27.10% 67.14% 29.63% 44.44% 51.00%
Paper 21.43% 25.00% 88.14% 78.57% 4.35% 28.57% 20.00%
Plastic 47.14% 72.09% 36.99% 21.28% 21.43% 38.24% 56.00%
Organic 11.63% 30.77% 3.54% 10.53% 19.35% 4.26% 15.97%
Table 13. The contamination level in each bin of the waste collected from all seven 4-bin waste
systems from March 22, 2011, the orange cell indicating the percentage of waste diverted to the
correct bin.
Floor 1 - 1 Garbage Paper Plastic Organic
Garbage 47.37% 0.00% 3.95% 48.68%
Paper 13.21% 81.13% 0.00% 5.66%
Plastic 75.00% 0.00% 25.00% 0.00%
Organic 7.58% 0.00% 0.00% 92.42%
Floor 1 - 2 Garbage Paper Plastic Organic
Garbage 64.71% 0.00% 6.86% 28.43%
Paper 9.09% 90.91% 0.00% 0.00%
Plastic 29.63% 0.00% 70.37% 0.00%
Organic 10.71% 0.00% 0.00% 89.29%
Floor 2 - 1 Garbage Paper Plastic Organic
Garbage 65.00% 0.00% 0.00% 35.00%
Paper 10.00% 80.00% 0.00% 10.00%
Plastic 47.62% 0.00% 42.86% 9.52%
Organic 9.86% 0.00% 0.00% 90.14%
Floor 2 - 2 Garbage Paper Plastic Organic
Garbage 61.11% 0.00% 15.28% 23.61%
Paper 41.67% 41.67% 0.00% 16.67%
Plastic 33.33% 0.00% 66.67% 0.00%
Organic 3.23% 0.00% 0.00% 96.77%
41
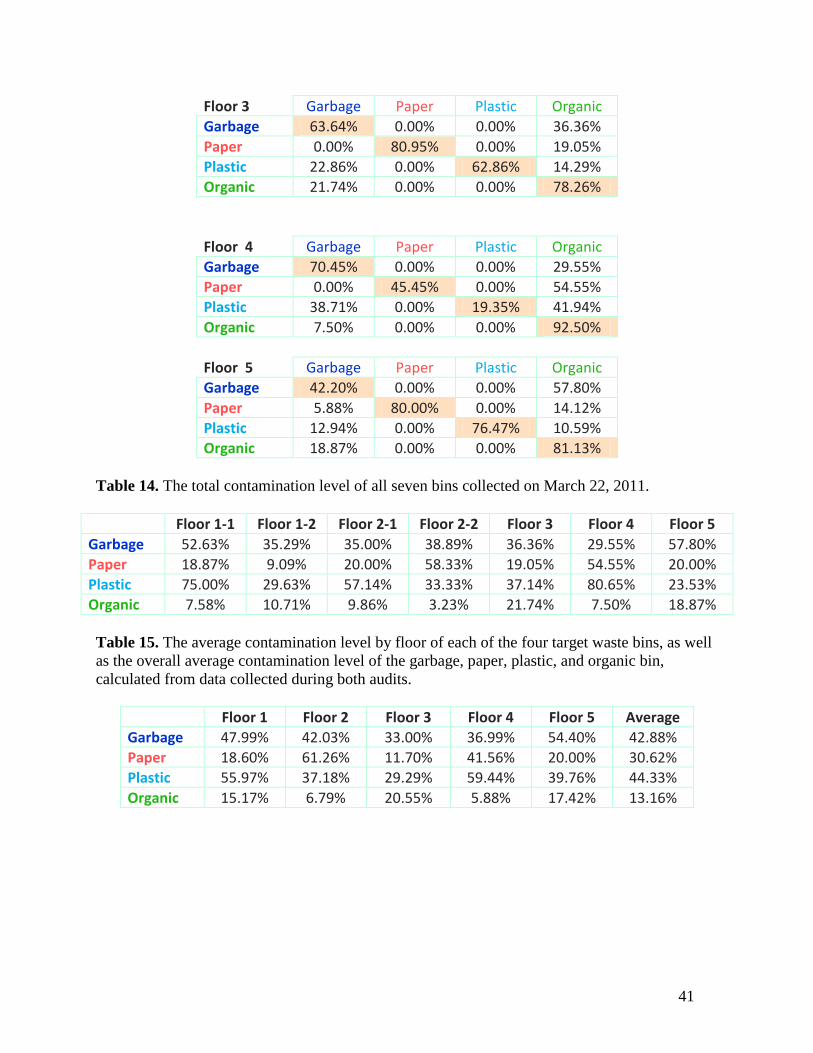
Floor 3 Garbage Paper Plastic Organic
Garbage 63.64% 0.00% 0.00% 36.36%
Paper 0.00% 80.95% 0.00% 19.05%
Plastic 22.86% 0.00% 62.86% 14.29%
Organic 21.74% 0.00% 0.00% 78.26%
Floor 4 Garbage Paper Plastic Organic
Garbage 70.45% 0.00% 0.00% 29.55%
Paper 0.00% 45.45% 0.00% 54.55%
Plastic 38.71% 0.00% 19.35% 41.94%
Organic 7.50% 0.00% 0.00% 92.50%
Floor 5 Garbage Paper Plastic Organic
Garbage 42.20% 0.00% 0.00% 57.80%
Paper 5.88% 80.00% 0.00% 14.12%
Plastic 12.94% 0.00% 76.47% 10.59%
Organic 18.87% 0.00% 0.00% 81.13%
Table 14. The total contamination level of all seven bins collected on March 22, 2011.
Floor 1-1 Floor 1-2 Floor 2-1 Floor 2-2 Floor 3 Floor 4 Floor 5
Garbage 52.63% 35.29% 35.00% 38.89% 36.36% 29.55% 57.80%
Paper 18.87% 9.09% 20.00% 58.33% 19.05% 54.55% 20.00%
Plastic 75.00% 29.63% 57.14% 33.33% 37.14% 80.65% 23.53%
Organic 7.58% 10.71% 9.86% 3.23% 21.74% 7.50% 18.87%
Table 15. The average contamination level by floor of each of the four target waste bins, as well
as the overall average contamination level of the garbage, paper, plastic, and organic bin,
calculated from data collected during both audits.
Floor 1 Floor 2 Floor 3 Floor 4 Floor 5 Average
Garbage 47.99% 42.03% 33.00% 36.99% 54.40% 42.88%
Paper 18.60% 61.26% 11.70% 41.56% 20.00% 30.62%
Plastic 55.97% 37.18% 29.29% 59.44% 39.76% 44.33%
Organic 15.17% 6.79% 20.55% 5.88% 17.42% 13.16%
42
8.2 Appendix B – Dalhousie Waste Management Guide
43
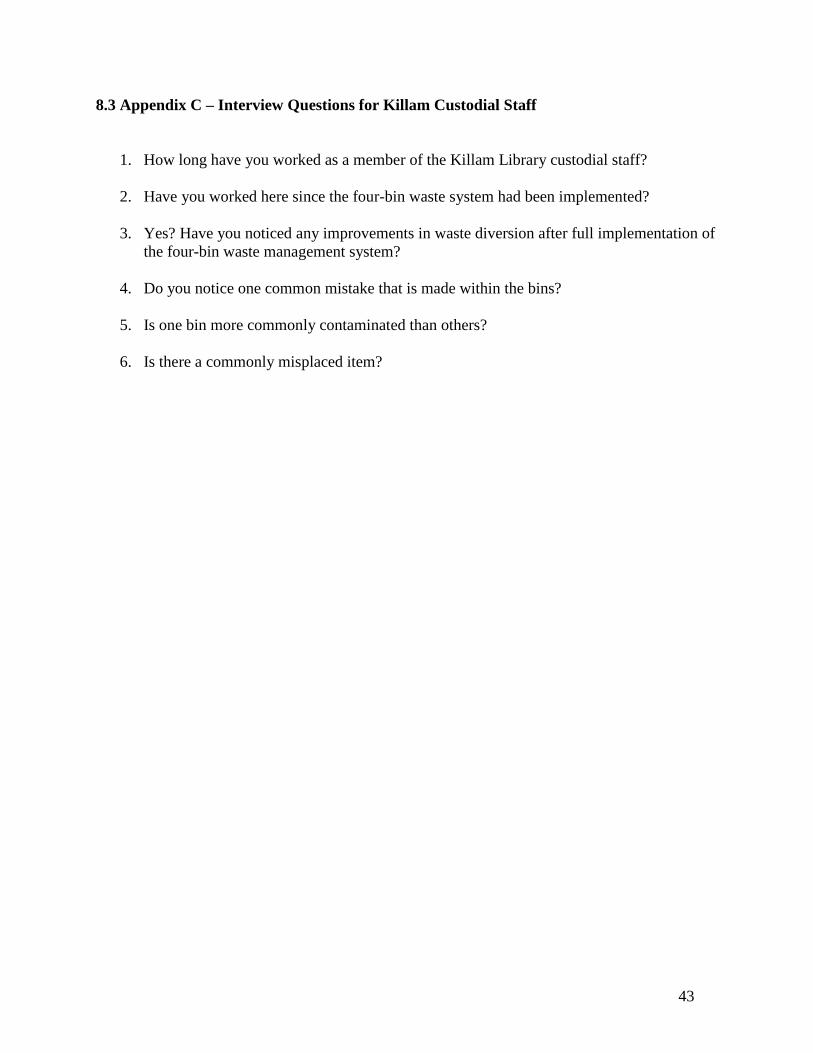
8.3 Appendix C – Interview Questions for Killam Custodial Staff
1. How long have you worked as a member of the Killam Library custodial staff?
2. Have you worked here since the four-bin waste system had been implemented?
3. Yes? Have you noticed any improvements in waste diversion after full implementation of
the four-bin waste management system?
4. Do you notice one common mistake that is made within the bins?
5. Is one bin more commonly contaminated than others?
6. Is there a commonly misplaced item?
44
8.4 Appendix D – Ethics Proposal
45
46
47
48
49
50