Analyzing the Indian Education Market
20
Analyzing the Indian Education Market InfoSphere A Centre for New Economics Studies Initiative InfoSphere Aliva Smruti, Archita Sridhar, Divyansh Singh Parihar, Diya Chadha and Swasti Ray
Transcript of Analyzing the Indian Education Market

Analyzing the Indian Education Market
InfoSphereA Centre for New Economics Studies Initiative
InfoSphere
Aliva Smruti, Archita Sridhar, Divyansh Singh Parihar, Diya Chadha and Swasti Ray

INTRODUCTION
The New Education Policy (2020) aims to make “India a globalknowledge superpower”.
In this InfoSphere Issue, we analyze the education sector from amacro level in India.
The Issue will feature the team’s analysis on:
1. Government Spending on Education & Role of Privatization inEducation Sector
2. State’s Spending on Education and Their performance viz-a-vizGirl-child education
3. Relationship between ‘Education’ and ‘Employability:’ WideningAcad-Ind gap in India’s Labour Market
4. Impact of Teacher Training on Student Accomplishment
InfoSphere

GlossaryGross Enrolment Ratio (GER) - Number of students enrolled in a given level of education, regardless of age, expressed as a percentage of the official
school-age population corresponding to the same level of education. It is useful to note that GER includes students of all ages. Therefore, with late/early
enrolments, repetitions, GER can exceed 100%.
Net Enrolment Ratio (NER) - number of boys and girls of the age of a particular level of education that are enrolled in that level of
education, expressed as a percentage of the total population in that age group.
Supply side issues in Education – access to education (government colleges and schools), student aid, learning outcomes, management and
monitoring.
Elementary Education – Primary School (Class 1-5)
Secondary Education – High school or middle school (Class 6-9)
Acad-Ind Gap – Mismatch between academic education and industry requirements.
InfoSphere

Redrafted in 1979; announced
the newNational
Education Policy (1986) (Rajiv Gandhi
Govt.)
First National Education
Policy drafted (1968)
Kothari Commission,
the Indian Education
Commission set up in (1964)
Secondary Education
Commission set up under Dr. A.
LakshmanaswamiMudaliar in
(1952)
UGC set up under Dr.
S.Radhakrishnan(1948)
Right to Education Act (RTE) (2009)
New National
Education Policy
approved by cabinet (2020)
InfoSphere
MHRD released Draft New Education
Policy (2019)
Education Planning in Post-Independent India
Higher Education –Flexible degrees and Multiple Exit options
Languages – Mother Tongue & Regional
Languages till class 5
Restructuring School education 5 (Foundational)+
3 (Preparatory)+3 (Middle)+4 (Secondary)
Prioritising teacher Education - National
Curriculum Framework for Teacher Education
Academic Bank for Credits – Digital storage of credits
Gender Inclusion Fund –Assisting Female and transgender children

• While India does well compared to Bangladesh and
Pakistan, India lags substantially behind all other
developing economies.
• In 2017, in countries where the Per capita GDP was 1%
higher, the predicted gross enrolment rates in
secondary education are 0.125% higher, other things
remaining constant.
• India’s higher education market is highly lucrative for
increased private investment as there is high demand
for quality education. However, major issues lie in the
secondary education segment due to supply-side constraints.
*Results are statistically significant at 95% level of confidence.
Refer to regression output in the last page
Bangladesh
Brazil Switzerland
UK
Indonesia
India
LAC
MEX
Middle Income CountriesNPL
PAK
SWE
USANOR
Sri LankaGER
RUS
020
4060
8010
012
014
0G
ross
Enr
ollm
ent R
atio
(%
)
7 8 9 10 11Log of GDP per capita in 2017 (constant 2010 US$)
GER Fitted valuesSource :World Bank (2017) InfoSphere
Cross-Country Comparison of Gross Enrollment Ratios in
Secondary education

0
0.5
1
1.5
2
2.5
3
3.5
4
4.5
5
5.5
6
6.5
7
1951
-52
1960
-61
1970
-71
1980
-81
1990
-91
2000
-01
2005
-06
2006
-07
2007
-08
2008
-09
2009
-10
2010
-11
2011
-12
2012
-13
2013
-14
2014
-15
2015
-16
2016
-17
2017
-18
2018
-19
2019
-20
Publ
ic E
xpen
ditu
re o
n Ed
ucat
ion
(% o
f GD
P)Public Expenditure on Education (as percentage of GDP)
Target Expenditure on Education - 6% Recommended by Kothari Commission (1964-68)
NEP 1968
NEP 1986(Revised)
Source: MHRD Budget Estimates
RTE 2009 New NEP
InfoSphere

-9
-6
-3
0
3
6
9
12
15
18
-40,000
-20,000
0
20,000
40,000
60,000
80,000
2010-11 2011-12 2012-13 2013-14 2014-15 2015-16 2016-17 2017-18 2018-19 2019-20
( %) C
hang
e in
allo
catio
n (Y
oY)
Allo
catio
n to
Dep
t. of
Sch
ool E
duca
tion
(in R
s cr
ore)
Change (%)Source: MHRD Budget Estimates
ALLOCATION TO DEPARTMENTS OF SCHOOL EDUCATION
• 2015-16 – GOI released only 57% of Allocation to Sarva
siksha Abhiyan (SSA)
• Only 27% of States share (on average, across states) was
released.
• By September 2015, only 23% of approved plans were
spent.
• In July 2018, Samagra Siksha Abhiyan (SMSA)
subsumed three schemes: (a) SSA (class 1-8); (b) Rashtriya
Madhyamik Shiksha Abhiyan (class 9-12) and (c) Teacher
Education.
• Under SMSA only 71.27% of the RE- 2019-20 is spent till
January 2020. (Acc. to Report 312th report of standing
committee on HRD)To know more:
https://www.prsindia.org/parliamenttrack/budgets/demand-grants-2020-21-
analysis-human-resource-development
https://cprindia.org/sites/default/files/policy-briefs/SSA.pdfInfoSphere
-9
-6
-3
0
3
6
9
12
15
18
21
24
27
30
-19,000
0
19,000
38,000
57,000
2010-11 2011-12 2012-13 2013-14 2014-15 2015-16 2016-17 2017-18 2018-19 2019-20
( %
) C
hang
e in
allo
catio
n (Y
oY)
Allo
catio
n to
Dep
t. of
Hig
her
Educ
atio
n (in
Rs
cror
e)
Change (%)
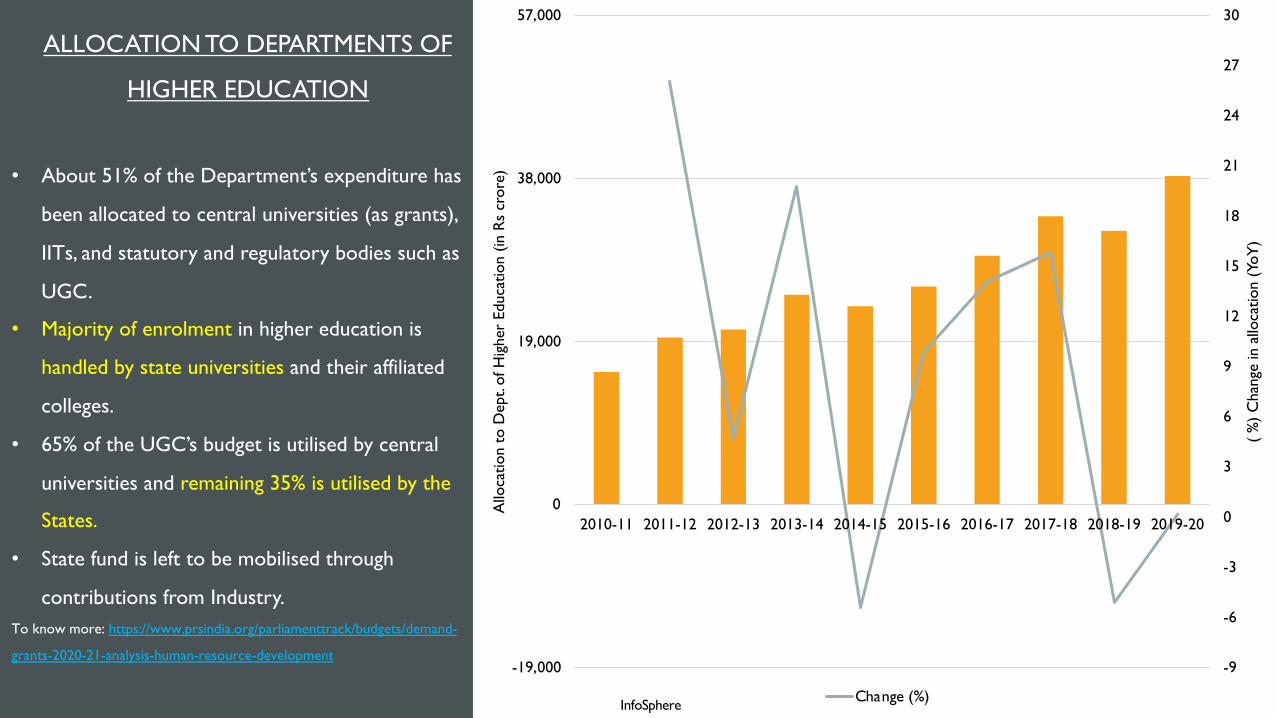
ALLOCATION TO DEPARTMENTS OF
HIGHER EDUCATION
• About 51% of the Department’s expenditure has
been allocated to central universities (as grants),
IITs, and statutory and regulatory bodies such as
UGC.
• Majority of enrolment in higher education is
handled by state universities and their affiliated
colleges.
• 65% of the UGC’s budget is utilised by central
universities and remaining 35% is utilised by the
States.
• State fund is left to be mobilised through
contributions from Industry. To know more: https://www.prsindia.org/parliamenttrack/budgets/demand-
grants-2020-21-analysis-human-resource-development
InfoSphere

0
0.5
1
1.5
2
2.5
3
3.5
4
4.5
2000
-01
2001
-02
2002
-03
2003
-04
2004
-05
2005
-06
2006
-07
2007
-08
2008
-09
2009
-10
2010
-11
2011
-12
2012
-13
2013
-14
2014
-15
2015
-16
2016
-17
2017
-18
Cen
ter
and
Stat
e Sp
edin
g as
a %
oif
GD
PCentre and State Spending on Education (as a percentage of GDP)
Centre as % of GDP States as % of GDP Source: MHRD Budget Estimates

• Allocation to World Class Institutions in 2020-21 - increase of 23% from the revised estimates of 2019-20.
• GOI selected 10 private institutions and 8 public institutions as institutes of eminence - greater autonomy in admitting foreign students, fixing
fees, and recruiting foreign faculty.
• The funding allocation for Rashtriya Uchchtar Shiksha Abhiyan (RUSA) has significantly decreased by 78%. The scheme aims to improve
the overall quality of existing state higher educational institutions.
• Grants to central universities has also declined.
• Hence, we see gradual Privatisation and tightening Centre-State relations with falling allocations to states.
Source: MHRD Budget Estimates
InfoSphere
0
1,000
2,000
3,000
4,000
5,000
6,000
7,000
8,000
9,000
Grants toCentral Unis
IITs UGC andAICTE
NITs StudentFinancial Aid
Improvingsalary ofteachers
Digital India-e-learning
World ClassInstitutions
IIITs Research andInnovation
RUSA Others
Allocation of Budget to Major Heads under the Department for Higher Education (2019-20 to 2020-21)(in Rs.Crores)
2019-20 RE 2020-21 BE
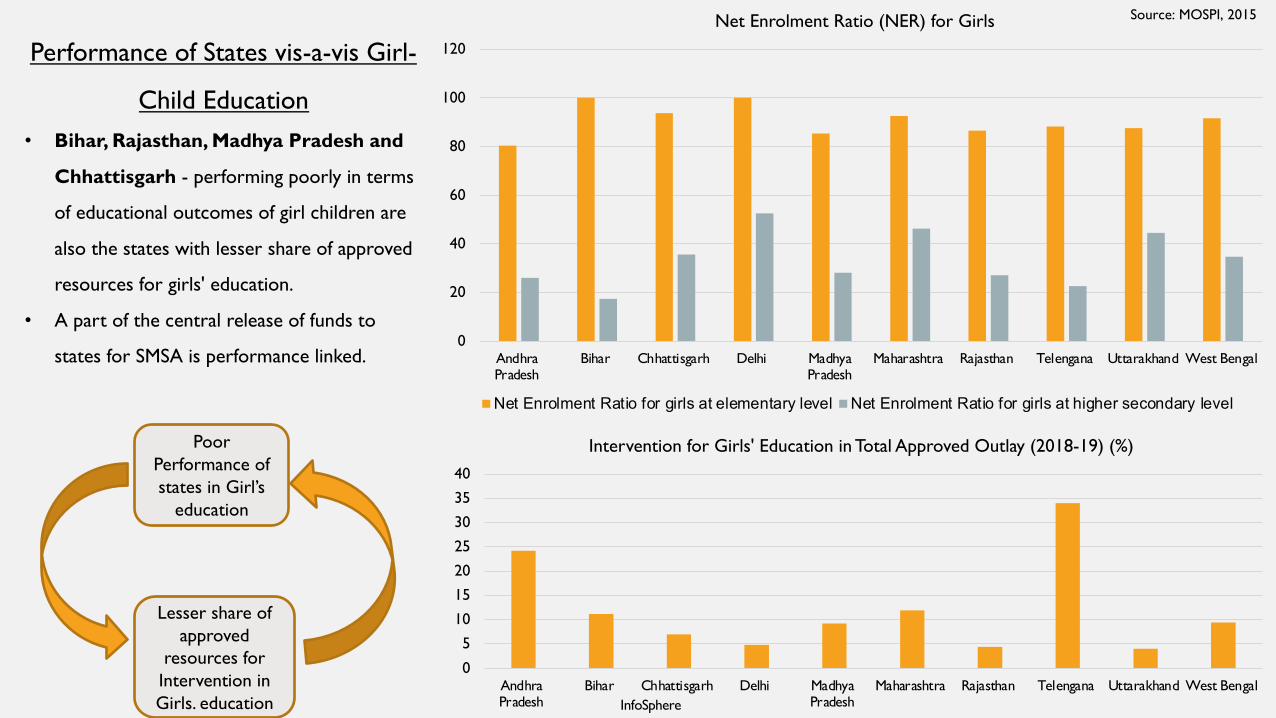
Performance of States vis-a-vis Girl-
Child Education• Bihar, Rajasthan, Madhya Pradesh and
Chhattisgarh - performing poorly in terms
of educational outcomes of girl children are
also the states with lesser share of approved
resources for girls' education.
• A part of the central release of funds to
states for SMSA is performance linked. 0
20
40
60
80
100
120
AndhraPradesh
Bihar Chhattisgarh Delhi MadhyaPradesh
Maharashtra Rajasthan Telengana Uttarakhand West Bengal
Net Enrolment Ratio (NER) for Girls
Net Enrolment Ratio for girls at elementary level Net Enrolment Ratio for girls at higher secondary level
Source: MOSPI, 2015
0
5
10
15
20
25
30
35
40
AndhraPradesh
Bihar Chhattisgarh Delhi MadhyaPradesh
Maharashtra Rajasthan Telengana Uttarakhand West Bengal
Intervention for Girls' Education in Total Approved Outlay (2018-19) (%)Poor Performance of states in Girl’s
education
Lesser share of approved
resources for Intervention in Girls. education InfoSphere

Low Budgetary
Allocations
Slow paced
release of
funds from
Centre
Lower Share of
allocated funds
released to
States
States resort to
market for funds
(Privatisation)
Increase in
Price of
education
Low learning
outcome for
those being
aided by govt. Acad-Industry Gap
Consequences of Low budgetary Allocations

1.50.94
0.23
6.57
2.96
0.53
8.15
3.9
0.76
0
1
2
3
4
5
6
7
8
9
Tot
al
Act
ivel
y Lo
okin
g fo
r Jo
bs
Empl
oyab
le
Tot
al
Act
ivel
y Lo
okin
g fo
r Jo
bs
Empl
oyab
le
Tot
al
Act
ivel
y Lo
okin
g fo
r Jo
bs
Empl
oyab
le
Technical Non-Technical All Graduates
Supp
ly o
f Lab
our
(in m
illio
ns)
Level of Education
Supply of Educated Labour
Source: NSDC NASSCOM Report
• The graph represents the supply
side issues of quality and quantity
in the educated labour market.
• Gap in learning outcome and
desired employment skills.
• Only 0.15 million technically
qualified candidates are estimated
to be employable out of the 0.78
million people supplied from
technical streams in 2013.
Read more: NSDC NASSCOM Report
Learning Outcome and Employment: Acad-Ind gap
InfoSphere

Source: Indian Skills Report 2020
Pradhan Mantri Kaushal Vikas
Yojana (PMKVY)Skill Investment vs. Outcome
231734
67944
127295
81739
401875
120985
201486
9976182732
104001119243
33092
85629
53320
207676
70160
119466
5014339130
67473
0
50000
100000
150000
200000
250000
300000
350000
400000
450000
Rajsa
than
Karna
tka
Tamil n
adu
Andhr
a Pra
desh
Uttar P
rades
h
Wes
t Ben
gal
Harya
naDelh
i
Mahara
stra
Telan
gana
Num
ber
of C
andi
date
s
States
Passed Candidates Employed through placement
• Launched in 2015 to promote skill development and employability among youth workforce.
• The Government of India had sanctioned an amount of Rs. 28,38,71, 578 for year 2016-18 towards implementation of the State engagement components of PMKVY (2016-20).
• The graph shows the number candidates who have successfully passed the course and number people who were able to find employment.
Read more: Indian Skill Report 2020
InfoSphere

Training of Teaching Staff: INSET Training
Source: Impact of In-Service Teacher Training on Classroom Transaction(National Council of Educational Research and Training, 2012) InfoSphere
02468
10121416
Andhr
a Pra
desh
Bihar
Chhatt
isgarh
Gujara
t
Harya
na
Jammu &
Kash
mir
Madhy
a Pra
desh
Mahara
shtra
Megha
laya
Nagala
nd
Odis
ha
Rajas
than
Tamil N
adu
Uttar
Prad
esh
Wes
t Ben
gal
Ran
k States
Relevance of training to teachers and student achievement
Rank on Student Achievement
Rank on Relevance of Training to teachers
• INSET – In-Service training is a school-based workshop for teachers to help improve teaching methods and student-centered learning.
• In Tamil Nadu, Uttar Pradesh, Gujarat, Jammu and Kashmir and Odisha - Student achievement was found significantly correlated with the relevance of INSET and enrichment of understanding of the content .
Read more: Impact of Teacher training on class room transaction
Variable Rank Order Correlation
Relevance of teacher training 0.54
Presentation of New concepts and Ideas through Discussion and
Explanation
0.28
participation in discussion and making experience-based comments
for participation
0.25

InfoSphere
0
2
4
6
8
10
12
14
16
Andhr
a Prad
esh
Bihar
Chhatt
isgarh
Gujarat
Haryan
a
Jammu &
Kash
mir
Madhy
a Prad
esh
Mahara
sh tr
a
Mcgha
laya
Nagala
nd
Odisha
Rajasth
an
Tamil N
adu
Uttar P
rades
h
West
Beng
al
Ran
k
Rank on Student Achievement Rank on Presentation of New Concepts/Idea by Discussion with Explanation
Correlation between Teacher Discussion and Explanation (taught in INSET Training) and Student Achievement
Source: Impact of In-Service Teacher Training on Classroom Transaction(National Council of Educational Research and Training, 2012)

InfoSphere
0
5
10
15
20
25
30
Andhr
a Prad
esh
Bihar
Chhatt
isgarh
Gujarat
Haryan
a
Jammu &
Kash
mir
Madhy
a Prad
esh
Mahara
sh tr
a
Mcgha
laya
Nagala
nd
Odisha
Rajasth
an
Tamil N
adu
Uttar P
rades
h
West
Beng
al
Ran
kCorrelation between Teacher Discussion (taught in INSET Training) and Student Achievement
Rank on Participation of Teachers in Discussion-making Comments on the basis of their Experience
Rank on Student Achievement Source: Impact of In-Service Teacher Training on Classroom Transaction(National Council of Educational Research and Training, 2012)

• Allocations on education has seen an upward trend. However, the release of funds from the Central Government has been meager. Despite
this, the spending on education taken up by States by mobilizing funds from the private investment space. Given that the States share in
total spending on education (as a constitutional separation of powers too) is much higher compared to the Centre, the Central government
must ensure that for implementation of NEP 2020, the State gets more finance to address its grand vision.
• States’ performance on Girls’ education has been poor and with the Centre allocating funds based on the State’s performance, it has
trapped states such as Bihar, Rajasthan, Madhya Pradesh and Chhattisgarh in a vicious cycle where states have lesser and lesser funds (and
performance improvement becomes difficult).
• We see a gradual creeping of rampant, ad-hoc Privatization in all levels of education during the years. However, with the endorsement of
push towards private players in NEP 2020 policy, letting private investment alone dictate the dynamics of education sector performance will
only worsen issues of accessibility, equity and other supply-side constraints for quality education of the masses.
• We witness a gap in employability and the quality of labour ensured by schemes such as PMKVY. The onus of this gap falls on learning
outcomes and deepen the Acad-Ind Gap. The NEP’s focus on learning outcomes through flexible approaches for subject selection is
refreshing. However, teachers training is of utmost importance for this change to materialize. More pilot studies must be conducted to
ensure efficacy of the policy.
CONCLUSION
InfoSphere

VARIABLES GER
lgPCGDP 12.483***-2.484
Constant -19.648-23.177
Observations 17
R-squared 0.627
Standard errors in parentheses*** p<0.01, ** p<0.05, * p<0.1
Regression Output

For any inputs, comments or clarifications please contact The Centre for New Economics Studies at [email protected].
Thank you!
InfoSphere