
Analyzing the Evolution of Card-Not-Present Fraud from Q1 ...
21
Analyzing the Evolution of Card-Not-Present Fraud from Q1 2020 through Q1 2021
Transcript of Analyzing the Evolution of Card-Not-Present Fraud from Q1 ...

Analyzing the Evolution of Card-Not-Present Fraud from
Q1 2020 through Q1 2021

Introduction
Section 1 | A Global View of CNP Fraud
Section 2 | CNP Fraud in the US vs. Mexico
Section 3 | CNP Fraud By Operating System
Section 4 | Direct and Indirect Linkage
Conclusion
The Vesta Difference
Contact Us
3
5
10
13
16
18
19
20
CONTENTS
Vesta | 2© 2021 | All rights reserved.

eCommerce transactions have been on the rise for years, but whenyou look at the number of digital transactions in 2020, it’s clear the COVID-19 pandemic has significantly accelerated eCommerce growth. According to Digital Commerce 360, in 2020 consumers spent $861.12 billion online with U.S. merchants alone, which is an increase of 44% year-over-year. The research group notes this is the highest annual rate in eCommerce growth in the U.S. for at least two decades, and is triple the 15.1% growth we saw in 2019. Global eCommerce growth, while not quite as high as growth in the U.S., was very robust in 2020. eMarketer estimates that worldwide eCommerce sales grew 27.6% annually for a total of $4.28 trillion.
While consumers’ affinity for online shopping is good news for ecommerce merchants, the costs of fraud can be much higher for ecommerce merchants than physical retailers. Because most online transactions are considered Card Not Present (CNP), most of the liability associated with fraud lies with the merchant, unlike in Card Present transactions, where most of the liability lies with the issuing banks. This means that when fraud does happen in ecommerce, the costs to the merchant is much higher.
27.6%
2020 worldwide increase in eCommerce sales
CNP fraud risks are higher than ever
Consumer spend in 2020 with U.S. merchants
$861 B 44%INCREASE
YOY
Worldwide and US eCommerce sales
$861 B
$4.28 T
US
WORLD
INTRO
Vesta | 3© 2021 | All rights reserved.

At Vesta, we process billions of dollars of CNP transactions and work with merchants across the globe to prevent CNP fraud. Our deep, well honed insights in how fraudsters operate and how damaging their attacks can be for every company considering or engaging in onlinetransactions. With a problem as complex as CNP fraud, it’s important to use an array of tools tactics to stop it, which is exactly how we approach fraud prevention.
Merchants are constantly looking for insights into how fraudsters operate, which is why we’re publishing this report: A Global Analysis of How CNP Fraud Evolved, from Q1 2020 through Q1 2021.
In this report, you’ll find insights into how much fraudsters tried to steal, how their attacks in the U.S. compared to those in Mexico, which operating systems they’re using to make fraudulent transactions, and how they’ve become more sophisticated over time.
INTRO
Vesta | 4© 2021 | All rights reserved.

Vesta has created a global breakdown of how CNP fraud has changed over the five past quarters. We analyzed the percentage of total transactions that our transaction guarantee platform identified as having a very high likelihood of being fraudulent, as well as the average value of each of transactions.
OUR FINDINGS:
Q1 2020
13%FRAUDULENT
TRANSACTIONS
$126DOLLAR AMOUNT
OF AVERAGE FRAUDULENT TRANSACTION
Q2 2020
12%FRAUDULENT
TRANSACTIONS
$139DOLLAR AMOUNT
OF AVERAGE FRAUDULENT TRANSACTION
Q3 2020
13%FRAUDULENT
TRANSACTIONS
$108DOLLAR AMOUNT
OF AVERAGE FRAUDULENT TRANSACTION
Q4 2020
10%FRAUDULENT
TRANSACTIONS
$155DOLLAR AMOUNT
OF AVERAGE FRAUDULENT TRANSACTION
Q1 2021
11%FRAUDULENT
TRANSACTIONS
$134DOLLAR AMOUNT
OF AVERAGE FRAUDULENT TRANSACTION
2020 2020 2020 2020 2021
Q1 Q2 Q3 Q4 Q1
SECTION 1 A GLOBAL VIEW OF CNP FRAUD
Vesta | 5© 2021 | All rights reserved.

The overall percentage of attempted fraud was lowest in Q4 2020, and is likely due to larger volume of seasonal transactions during the holidays. The fact that the average dollar amount per fraudulent transaction was the highest in Q4 ($155) out of every quarter we analyzed indicates that fraudsters are particularly aggressive around the holidays. We advise our merchants to take extra precautions during this holiday shopping season and consumers should be wary of buying from third-party sellers.
Vesta’s customers saw a 1% dip in fraud from Q1 2020 to Q2 2020; however the average dollar amount per fraudulent transaction increased by $13 to $139, which represents a 10% increase. This timing aligns with the start of most COVID-related lockdowns in March and April of 2020. This could be due to merchants being overwhelmed by an increase in overall online transactions while people were stuck at home, making it more difficult for them to spot fraud and easier for fraudsters to get away with larger transactions.
Q1 2021 saw less fraud overall compared to Q1 2020, but the average dollar amount increased by $8 per transaction, suggesting fraud could become an even more expensive problem in 2021 than it was in 2020.
13%
Q1 Q2
2020 2021
Q3 Q4 Q1
12%13%
10%11%
FR
AU
D
FR
AU
D
FR
AU
D
FR
AU
D
FR
AU
D $126
Q12020
$139
Q22020 $108
Q32020
$155
Q42020
$134
Q12021
Q1 2020 TO Q1 2021 - INCREASE OF $8
FRAUDULENT TRANSACTIONS
1% DIP
IN FRAUD
10% RISE
INDOLLAR
AMOUNT
FROM Q1 2020
TO Q2 2020
SECTION 1 A GLOBAL VIEW OF CNP FRAUD
Vesta | 6© 2021 | All rights reserved.

WHAT DOES THIS MEAN FOR MERCHANTS?
• As outlined in the previous pages, we saw that 10-13% of all transactions each quarter were potentially fraudulent. Our robust machine learning models analyze tens of thousands of transactions and make a real-time decision in less than a second on whether to deny or to approve it. This means you are always protected by Vesta’s guarantee and your customers have a great checkout experience every time they do business with you.
• Merchants that do not work with Vesta solution or don’t have a sophisticated system in place to carefully vet their digital transactions could inadvertently be approving many fraudulent transactions. This adversely affects merchants in two ways, which we’ll explore in detail in the next pages.
SECTION 1 A GLOBAL VIEW OF CNP FRAUD
Vesta | 7© 2021 | All rights reserved. Vesta | 7

If you were to approve these fraudulent transactions you’ll receive the initial revenue; however you’ll end up incurring unsustainably high losses. In fact, this will inevitably end up catching the attention of banks and networks who will impose restrictions on your business. Fraudulent transactions lead to chargebacks, and chargebacks come with fees. If a network flags your business as having an unusually high number of chargebacks, they will increase these fees by as much as $25 per chargeback.
• For example, if you’re a company doing 5 million transactions per year and 13% are fraudulent, you’re looking at 650,000 annual fraudulent transactions. If you’re incurring a fee of $25 per chargeback, you’re now dealing with $16,250,000 in annual chargeback fees.
! !MORECHARGEBACKS
MOREFRAUD
MOREFEES
5 MILLIONTRANSACTIONS
PER YEAR
FRAUDULENTTRANSACTIONS
13%
$16.25 MCHARGEBACK
FEES
!SECTION 1 A GLOBAL VIEW OF CNP FRAUD
Vesta | 8© 2021 | All rights reserved.

On the other end of the spectrum, if you’re overly concerned about fraud and your defenses are too blunt, you’ll end up rejecting legitimate transactions along with the fraudulent ones.
For example, some merchants might reject 30% of transactions just to block 13% that are actually fraudulent. That 17% difference is lost revenue. If you’re doing 5 million transactions per year with an average order value of $125, you’re now losing $102,000,000 in annual revenue.
On top of that, rejecting legitimate transactions puts your brand reputation at risk. Today’s consumers expect a seamless online shopping experience, and if their order is rejected for no apparent reason, you will likely lose them as a customer for life.
REJECTINGGOOD
TRANSACTIONS
POORCUSTOMER
EXPERIENCE
13%FRAUDULENT
17% LEGITIMATE(LOST REVENUE)
30%REJECTED
TRANSACTIONS
SECTION 1 A GLOBAL VIEW OF CNP FRAUD
Vesta | 9© 2021 | All rights reserved.

Vesta works with merchants all over the world, but we have a particularly strong concentration of customers in the US and Mexico. We chose to compare the US and Mexico in this report to show trends in two very different types of markets – a mature credit card market with lower overall fraud risk versus a rapidly emerging credit card market with high overall fraud risk.
OUR FINDINGS:
Percentage of Fraudulent TransactionsDollar Amount of Fraudulent TransactionsUNITED STATES Percentage of Fraudulent Transactions
Dollar Amount of Fraudulent TransactionsMEXICO
Q1 2020 Q2 2020 Q3 2020 Q4 2020 Q1 2021
3%
$169 $176 $189
$149
$175
2% 3% 4% 4%
Q1 2020 Q2 2020 Q3 2020 Q4 2020 Q1 2021
$118$136
$98
$155$135
36%26% 23% 18%
24%
SECTION 2 CNP FRAUD IN THE US VS. MEXICO
Vesta | 10© 2021 | All rights reserved.

US VS. MEXICO INSIGHTS
Overall, the percentage of attempted fraudulent transactions in the US is substantially lower than in Mexico, but the value of these transactions is higher in the US with the exception of Q4 2020 ($149 in US vs $155 in Mexico).
• This shows that while fraud might not be as prevalent in the US as it is in Mexico, merchants should still put a system in place to carefully vet US transactions to protect their margins given the higher value of each fraudulent transaction.
• It’s also important to note that Mexico’s eCommerce market is still quite nascent compared to the US, so one would expect to see a higher percentage of fraud attempts until the market matures.
The steady drop in percentage of fraudulent transactions in Mexico throughout 2020 suggests that merchants have gotten savvier about protecting their networks, but the 6% increase from Q4 2020 to Q1 2021 shows they cannot let their guard down.
The differences in how CNP fraud is executed in the US compared to Mexico is just one example of how it varies by region, which is why it’s so important that merchants partner with a payment fraud prevention provider that can offer a global solution that accounts for these differences. There’s no one-size-fits-all solution for preventing CNP fraud - you have to look carefully at where the fraud is taking place and adjust your approach as needed.
INCREASE IN FRAUDFROM Q4 2020 TO Q1 2021
IN MEXICO
6%
LESS FRAUDHIGHER VALUE
MORE FRAUDLOWER VALUE
US
MX
SECTION 2 CNP FRAUD IN THE US VS. MEXICO
Vesta | 11© 2021 | All rights reserved.

<74M AMERICANS WHO HAVE BEEN VICTIMS OF FRAUD
VICTIMS BELIEVE FRAUD WAS DUE TO:
Data breach on mobile device
Lack of awareness of scams and fraud
Lack of personal details protection
Lack of password protection
Lack of electronic device protection
Being gullible
59%
56%
53%
52%
52%
51%
AGES23% 55-64 YEARS OLD
18% 25-34 YEARS OLD
10% 18-24 YEARS OLD
VICTIMS’
HOW DOES CNP FRAUD IMPACT CONSUMERS?
• According to data from YouGov, more than 74 million Americans have been victims of bank, credit account, or shopping fraud.
• When asked why they believe they fell victim to fraud, top reasons included a data security breach on mobile devices and lack of awareness of scams and fraud.
• While 23% of fraud victims are between 55 and 64 years old, 18% are between 25 and 34 years old, and 10% are between 18 and 24 years old, this shows that even digital natives can be taken advantage of.
• Clearly, fraud is not only impacting merchants but consumers as well. That’s why it’s more important than ever for merchants to implement a sophisticated fraud prevention solution to increase consumer confidence and protect their businesses.
SECTION 2 CNP FRAUD IN THE US VS. MEXICO
Vesta | 12© 2021 | All rights reserved.

There are two primary devices for making an online purchase - mobile phone and desktop computer. Within those categories, there are five operating systems that make up the majority of eCommerce orders:
Android iOS Linux macOS Windows
To gain a better understanding of how operating systems impact CNP fraud, Vesta analyzed the percentage of fraudulent transactions made on each, as well as the average value of those transactions.
SECTION 3 CNP FRAUD BY OPERATING SYSTEM
Vesta | 13© 2021 | All rights reserved. Vesta | 13

ANDROID iOS LINUX macOS WINDOWS
Q1 2020 Q2 2020 Q3 2020 Q4 2020 Q1 2021
26% 21% 19%10%
17%14% 11% 11% 6% 4%9% 11% 11%
4% 5%7% 6% 5% 4% 3%
17% 12% 13% 9% 10%
Percentage of Fraudulent Transactions by Operating System
Q1 2020 Q2 2020 Q3 2020 Q4 2020 Q1 2021
$45 $52 $55 $59 $63$76 $79 $69 $87$116
$56 $60$82 $79
$311
$128
$176
$85$120
$172$156$183
$97 $113 $105
Dollar Amount of Average Fraudulent Transaction by Operating System
SECTION 3 CNP FRAUD BY OPERATING SYSTEM
Vesta | 14© 2021 | All rights reserved.

OPERATING SYSTEM INSIGHTS
• Android is the operating system with the highest percentage of fraudulent transactions, but the lowest average dollar amount, suggesting fraudsters use it frequently for lower value transactions.
• While the percentage of overall Android transactions that are fraudulent declined steadily quarter-by-quarter during 2020, it rose 7% in Q1 2021, so merchants should continue to keep a close eye on Android transactions.
• Both iOS and Android saw the average value of a fraudulent transaction peak in Q1 2021, which shows fraudsters could be getting more sophisticated and confident in their mobile attacks.
• Generally speaking, the value of fraudulent transactions is highest on macOS and Windows, suggesting fraudsters make their most expensive attacks via desktop computers. One reason for this may be that fraudsters can more easily automate attacks from a desktop.
DESKTOP ATTACKSARE THE MOST EXPENSIVEmacOS / WINDOWS
HIGHEST PERCENTAGE OF FRAUD
LOWEST AVERAGE DOLLAR AMOUNT
FRAUD PEAKEDIN Q1 2021 FOR BOTH
iOS AND ANDROID
INCREASEIN FRAUD
IN Q1 2021 FOR ANDROID
7%
SECTION 3 CNP FRAUD BY OPERATING SYSTEM
Vesta | 15© 2021 | All rights reserved.

There are two types of CNP fraud that merchants need to watch out for.
Direct linkage means there is some common connection within these transactions that merchants can look for to determine a transaction is fraudulent and decide not to accept it.
For example, if five orders come in at the same time for the same item and from the same email address, that’s a clear link that suggests the transactions could be fraudulent.
Indirect linkage means there is no single data element that links the orders together. Instead, they are linked through a more complex web of elements, such as email addresses, payment devices and phone numbers. Because there is no clear connection, it is much more difficult for a merchant to spot the fraud before the transaction has already been approved, at which point there is no way to undo it.
1
2
SECTION 4 DIRECT AND INDIRECT LINKAGE
Vesta | 16© 2021 | All rights reserved. Vesta | 16
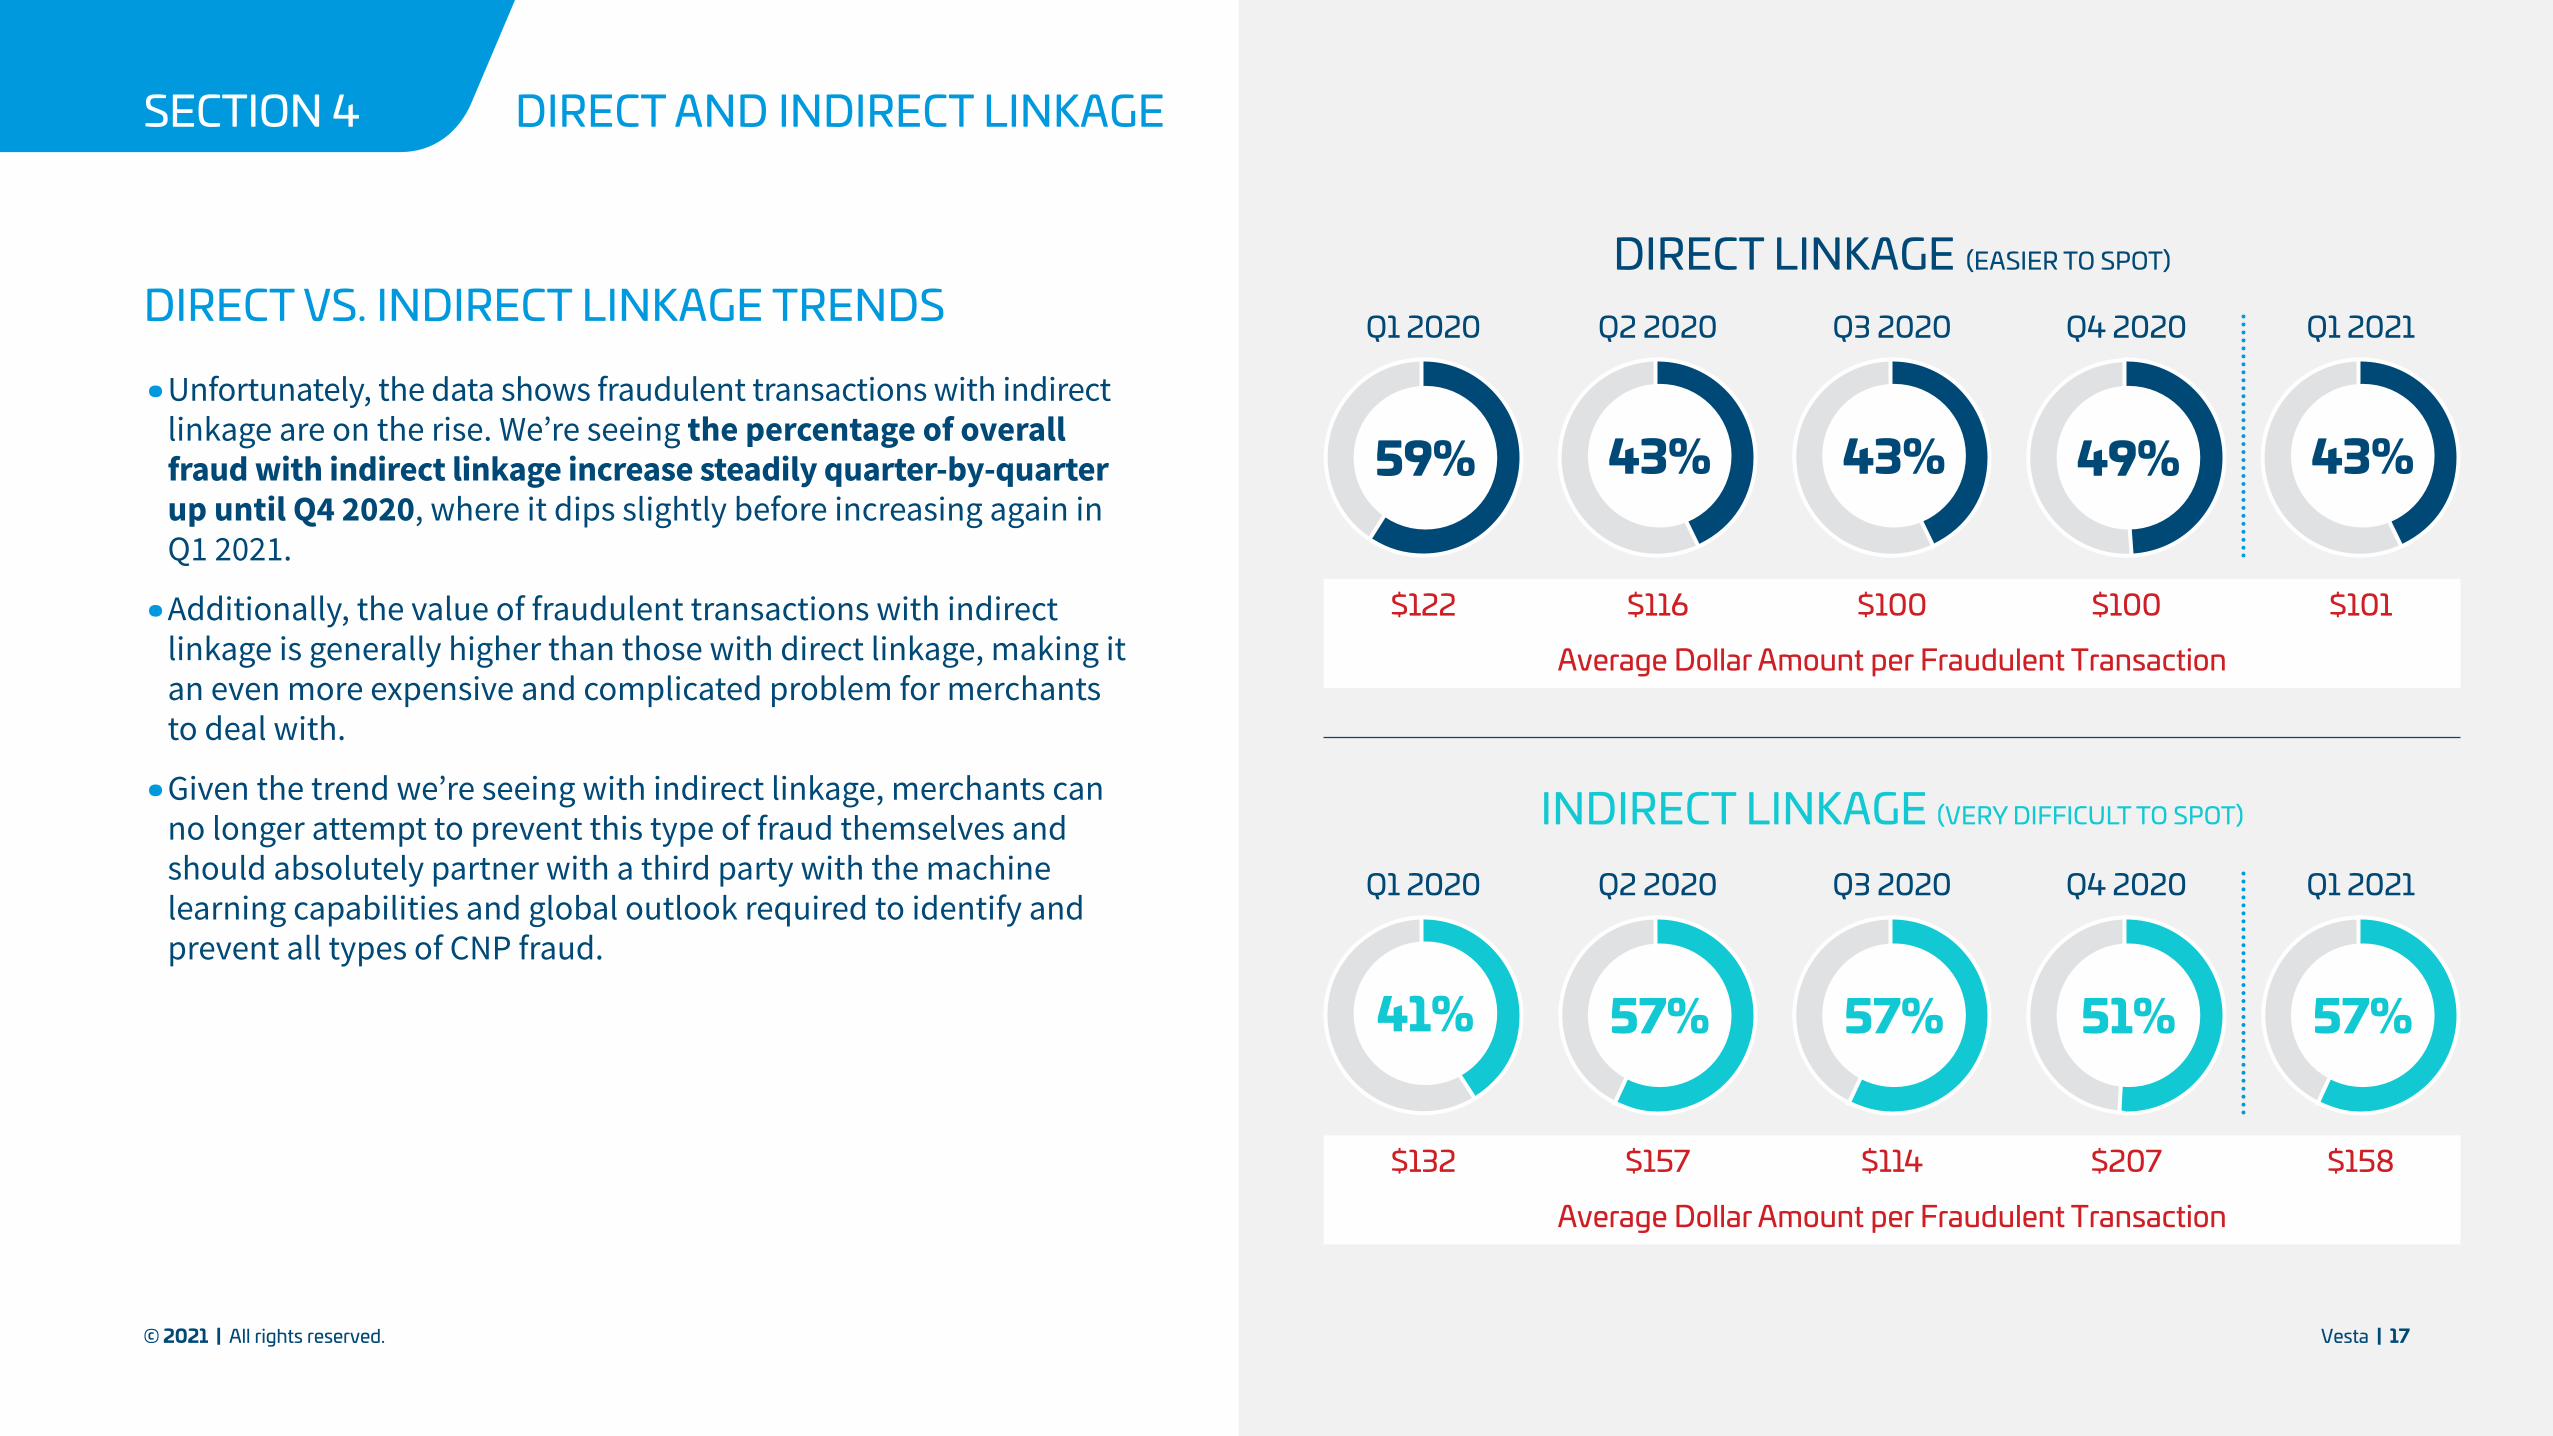
DIRECT VS. INDIRECT LINKAGE TRENDS
• Unfortunately, the data shows fraudulent transactions with indirect linkage are on the rise. We’re seeing the percentage of overall fraud with indirect linkage increase steadily quarter-by-quarter up until Q4 2020, where it dips slightly before increasing again in Q1 2021.
• Additionally, the value of fraudulent transactions with indirect linkage is generally higher than those with direct linkage, making it an even more expensive and complicated problem for merchants to deal with.
• Given the trend we’re seeing with indirect linkage, merchants can no longer attempt to prevent this type of fraud themselves and should absolutely partner with a third party with the machine learning capabilities and global outlook required to identify and prevent all types of CNP fraud.
Average Dollar Amount per Fraudulent Transaction
DIRECT LINKAGE (EASIER TO SPOT)
INDIRECT LINKAGE (VERY DIFFICULT TO SPOT)
59% 43% 43% 49% 43%
57%51%57%57%41%
Q1 2020
Q1 2020
Q3 2020
Q3 2020
Q1 2021
Q1 2021
$122
$132
$116
$157
$100
$114
$100
$207
$101
$158
Q2 2020
Q2 2020
Average Dollar Amount per Fraudulent Transaction
Q4 2020
Q4 2020
SECTION 4 DIRECT AND INDIRECT LINKAGE
Vesta | 17© 2021 | All rights reserved.
Everything we have observed from Q1 2020 through Q1 2021 indicates that CNP fraud is not going away, and will continue to wreak havoc on merchants that aren’t prepared to handle it. That said, it’s critically important for merchants to strike the right balance between preventing fraud, maximizing approvals of legitimate transactions, and delivering an exceptional customer experience. In theory, you could manually review every transaction before deciding whether to accept or reject it, but that would compromise the customer experience to the point that they won’t come back. Would you make a second purchase if your first purchase took 5 minutes to go through? Probably not, and neither will most consumers.
That’s why merchants need a system in place to make real-time transactional decisions that are data-driven. It’s possible to build this infrastructure in-house, but given the time and capital required you’ll likely come out ahead by outsourcing to a trusted third party. When evaluating a fraud prevention partner, make sure they’re using advanced machine learning models and operating on a global scale so you can confidently conduct cross-border commerce and grow your business worldwide. And if you want to completely eliminate the fear of fraud and the cost that comes with it, drop us a line to learn about our Payment Guarantee solution and we’ll have you up and running with zero fraud risk in no time.
CONCLUSION
Vesta | 18© 2021 | All rights reserved.
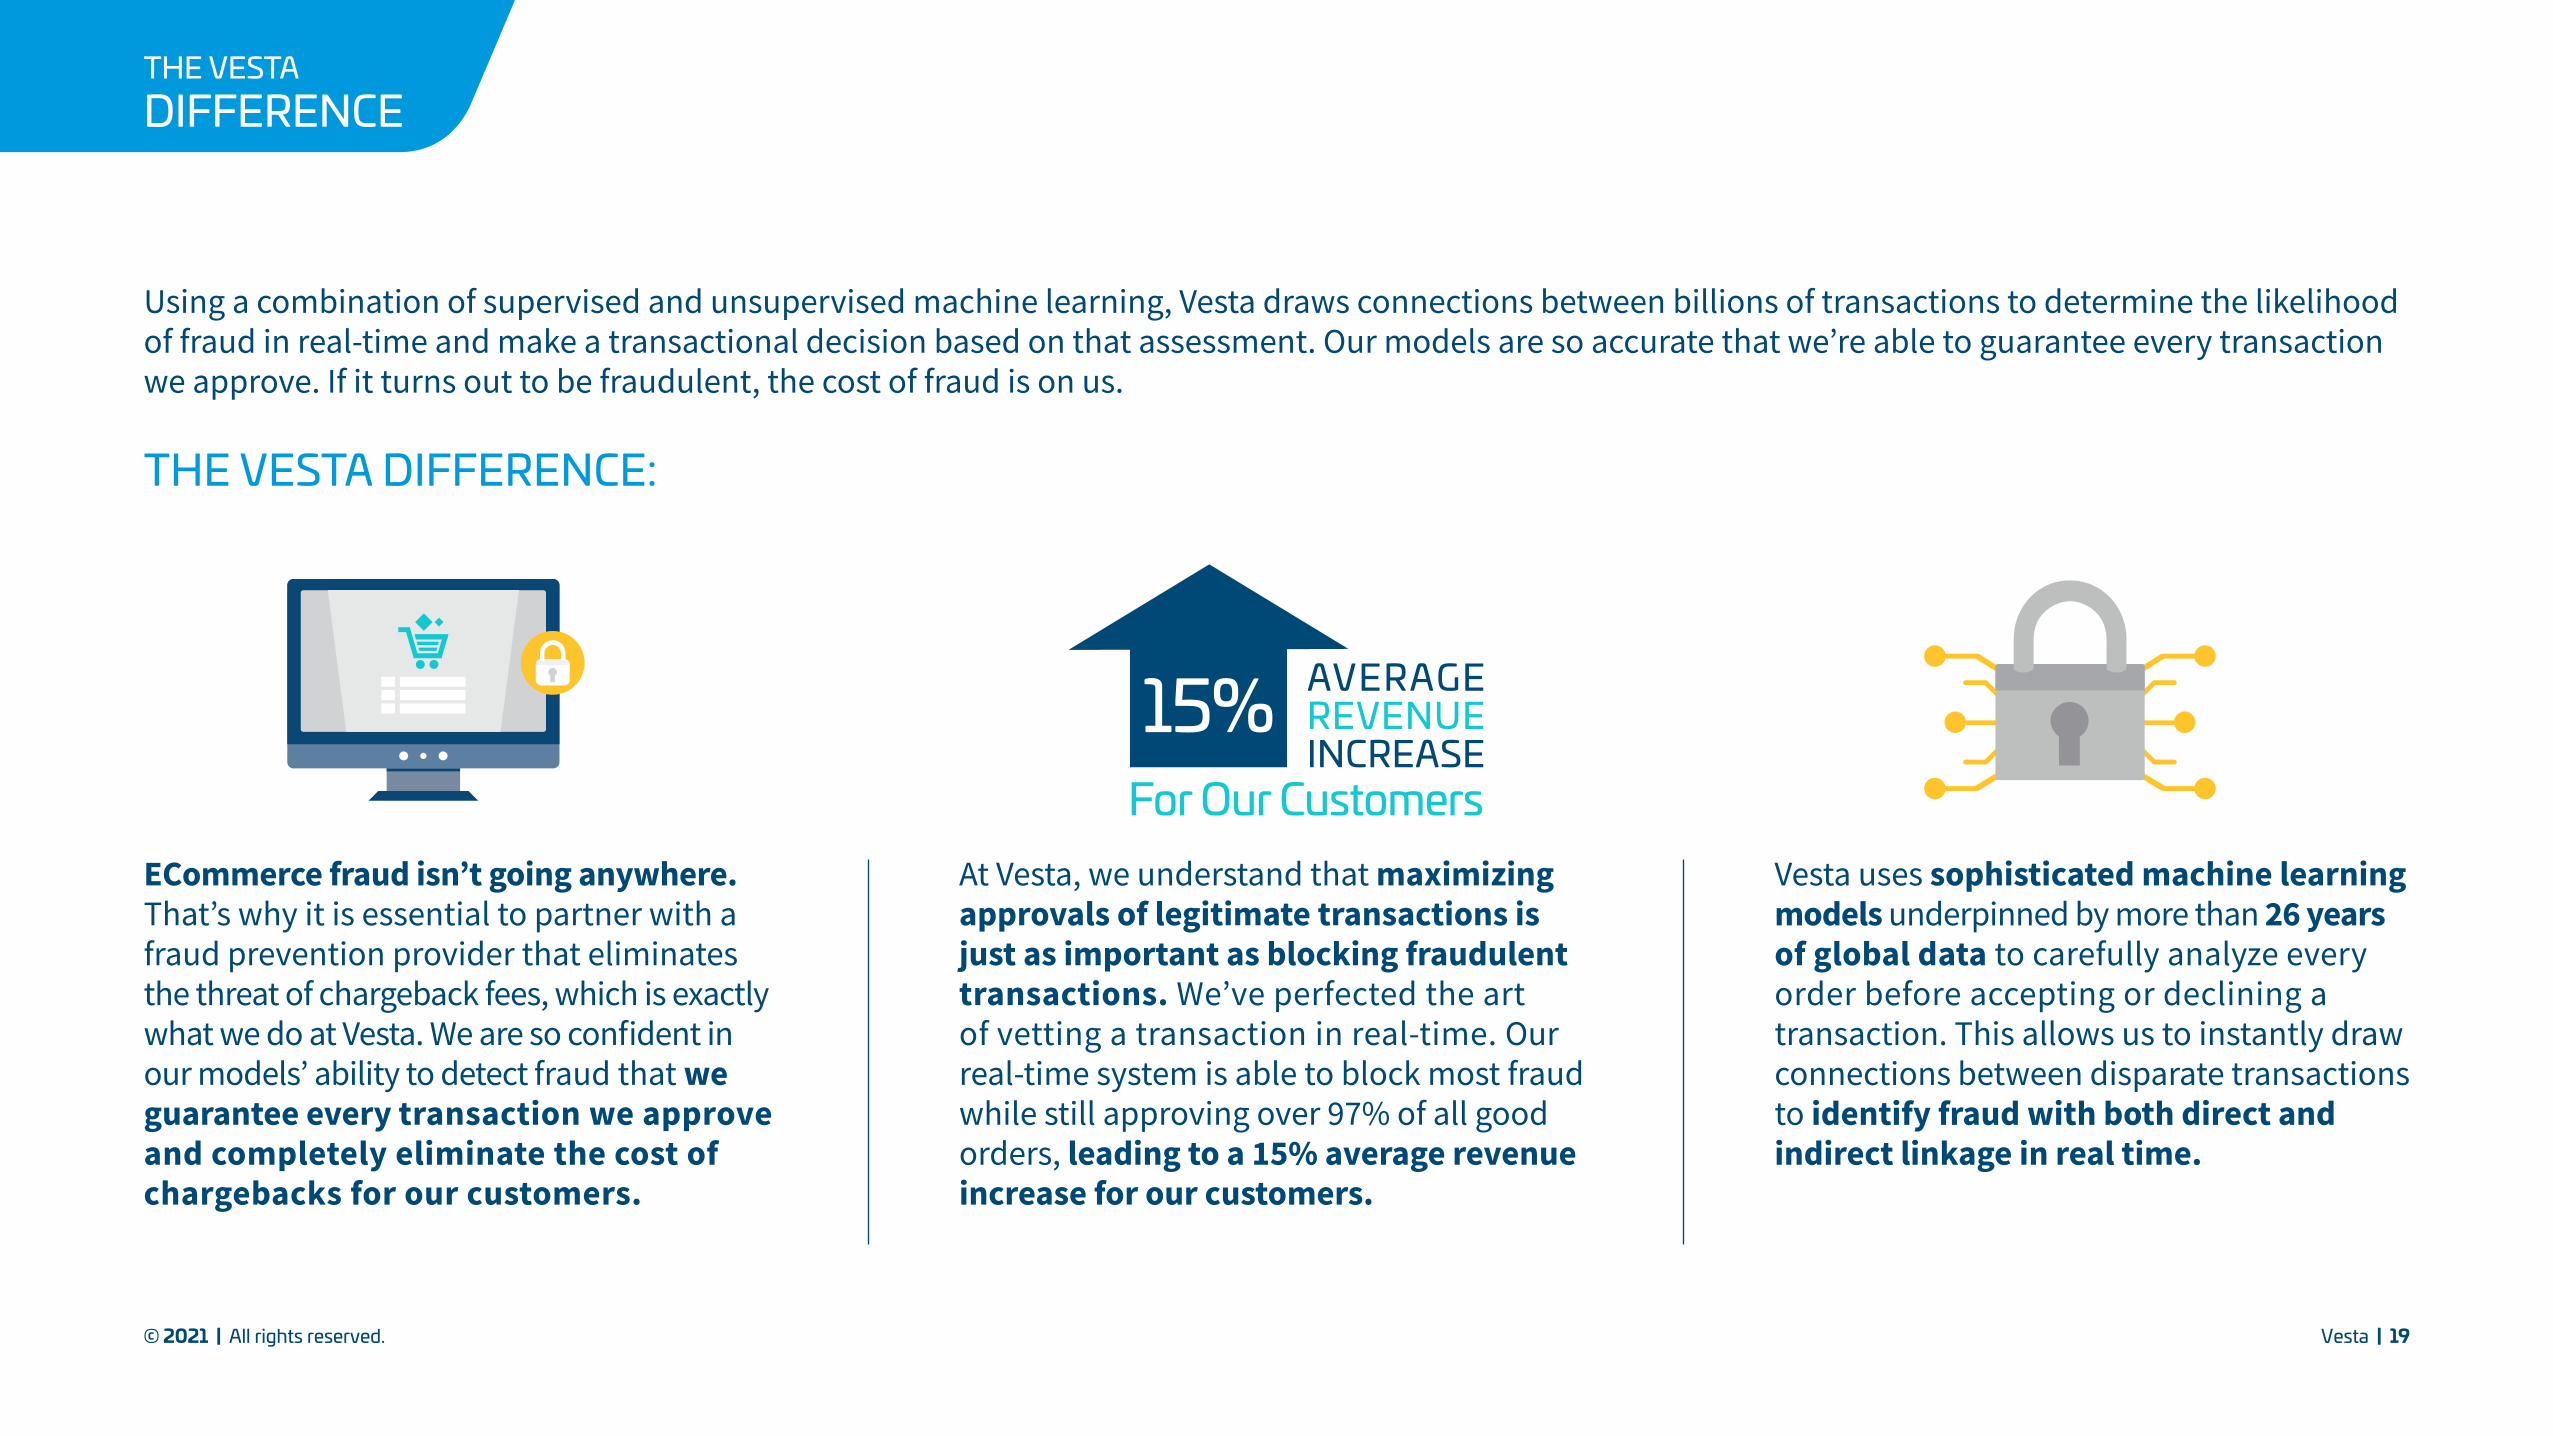
ECommerce fraud isn’t going anywhere. That’s why it is essential to partner with afraud prevention provider that eliminates the threat of chargeback fees, which is exactly what we do at Vesta. We are so confident in our models’ ability to detect fraud that we guarantee every transaction we approve and completely eliminate the cost of chargebacks for our customers.
Using a combination of supervised and unsupervised machine learning, Vesta draws connections between billions of transactions to determine the likelihood of fraud in real-time and make a transactional decision based on that assessment. Our models are so accurate that we’re able to guarantee every transaction we approve. If it turns out to be fraudulent, the cost of fraud is on us.
THE VESTA DIFFERENCE:
At Vesta, we understand that maximizing approvals of legitimate transactions is just as important as blocking fraudulent transactions. We’ve perfected the art of vetting a transaction in real-time. Our real-time system is able to block most fraud while still approving over 97% of all good orders, leading to a 15% average revenue increase for our customers.
Vesta uses sophisticated machine learning models underpinned by more than 26 years of global data to carefully analyze every order before accepting or declining a transaction. This allows us to instantly draw connections between disparate transactions to identify fraud with both direct and indirect linkage in real time.
15%For Our Customers
AVERAGEREVENUEINCREASE
DIFFERENCETHE VESTA
Vesta | 19© 2021 | All rights reserved.

Request a Demo
Contact Us
Visit vesta.io
CONTACT US
Vesta | 20© 2021 | All rights reserved.

©2021 Vesta | All rights reserved.