Analyzing the Competitive Performance of the South African Wine ...
22
2011 International Food and Agribusiness Management Association (IFAMA). All rights reserved 179 International Food and Agribusiness Management Review Volume 14, Issue 4, 2011 Analyzing the Competitive Performance of the South African Wine Industry Johan Van Rooyen a Dirk Esterhuizen b and Lindie Stroebel c a Director: Centre for AgriBusiness Leadership and Mentorship Development, University of Stellenbosch, Private Bag x1, Matieland, Western Cape 7602, South Africa b Senior Agricultural Specialist, Foreign Agricultural Service, Embassy of the United States of America P.O. Box 9536, Pretoria 0001, South Africa c Manager, Economic Intelligence, Agricultural Business Chamber, PO Box 76297 Lynnwood Ridge, South Africa 0040, South Africa Abstract This article describes a methodology and a four-step framework to measure and analyze com- petitive performance of the South African wine industry. Competitive performance is viewed as the ability to sustain trade against the competition in the global market. The economic sustaina- bility of the South African wine industry is found to be highly dependent on its trading perfor- mance, with more than 40 percent of production consistently being exported since 2005. The views and opinions of South African wine executives through the Wine Executive Surveys of 2005 and 2008 are used to identify, describe and explain these competitiveness trends and to qualitatively comment on factors impacting on performance. The Porter Diamond is applied to derive the most important industry determinants of competitive performance. From this analysis changes in the “competitiveness space” of the South African wine industry are described and an- alyzed and a wine industry agenda is proposed to enhance competitive performance. Keywords: South African wine industry, competitive performance and competitive space, rela- tive trade advantage (RTA), wine executive surveys, Porter Diamond. Corresponding author: Tel: + 27.0827853300 Email: [email protected] D. Esterhuizen: [email protected] L. Stroebel: [email protected]
Transcript of Analyzing the Competitive Performance of the South African Wine ...

2011 International Food and Agribusiness Management Association (IFAMA). All rights reserved
179
International Food and Agribusiness Management Review
Volume 14, Issue 4, 2011
Analyzing the Competitive Performance of the
South African Wine Industry
Johan Van Rooyena Dirk Esterhuizen
b and Lindie Stroebel
c
aDirector: Centre for AgriBusiness Leadership and Mentorship Development, University of Stellenbosch,
Private Bag x1, Matieland, Western Cape 7602, South Africa
b Senior Agricultural Specialist, Foreign Agricultural Service, Embassy of the United States of America
P.O. Box 9536, Pretoria 0001, South Africa
c Manager, Economic Intelligence, Agricultural Business Chamber, PO Box 76297
Lynnwood Ridge, South Africa 0040, South Africa
Abstract
This article describes a methodology and a four-step framework to measure and analyze com-
petitive performance of the South African wine industry. Competitive performance is viewed as
the ability to sustain trade against the competition in the global market. The economic sustaina-
bility of the South African wine industry is found to be highly dependent on its trading perfor-
mance, with more than 40 percent of production consistently being exported since 2005.
The views and opinions of South African wine executives through the Wine Executive Surveys of
2005 and 2008 are used to identify, describe and explain these competitiveness trends and to
qualitatively comment on factors impacting on performance. The Porter Diamond is applied to
derive the most important industry determinants of competitive performance. From this analysis
changes in the “competitiveness space” of the South African wine industry are described and an-
alyzed and a wine industry agenda is proposed to enhance competitive performance.
Keywords: South African wine industry, competitive performance and competitive space, rela-
tive trade advantage (RTA), wine executive surveys, Porter Diamond.
Corresponding author: Tel: + 27.0827853300
Email: [email protected]
D. Esterhuizen: [email protected]
L. Stroebel: [email protected]
Van Rooyen et al. / International Food and Agribusiness Management Review / Volume 14, Issue 4, 2011
2011 International Food and Agribusiness Management Association (IFAMA). All rights reserved.
180
Introduction
What determines the ability of an industry to perform competitively and sustain such perfor-
mance?
How is competitiveness performance measured? How is it analyzed; and can such “industry in-
telligence” be used for the strategic positioning of an industry? What is the role of government
viz-a-viz that of private firms to enhance competitiveness performance?
Answers to these questions are important as they provide the basis for understanding the evolv-
ing situation in an industry which needs to compete for survival and growth (Porter 1990; Mas-
ters 1995; Stroper 1995; Papanastassou and Pearce 1999; Veiyath and Zahra 2000; Lall 2001;
and Sledge 2005). Such answers thus support the notion of comprehensive industry level strate-
gic planning.
A four-step framework is developed and applied in this article to advance answers to these ques-
tions. The framework is used to measure and analyze competitive performance of the South Af-
rican wine industry - an export based agri-industry that recently faced many strategic challenges
of a political, economic, technical, and social nature.
The focus of the study is on the environment in which wine industry players make decisions.
Wine firms and the industry will therefore constitute the level of analysis (Stroper 1995; Sledge
2005). The analysis is based on the initial approach advanced by the ISMEA Report in 1999 and
on earlier work on the competitiveness of the South African agribusiness sector (Van Rooyen
and Van Rooyen1998; Van Rooyen, Esterhuizen and Doyer 2000; ABC 2000; Esterhuizen 2006)
and expanded on in the analysis of the wine industry by Esterhuizen and Van Rooyen in 2005
and 2007, SAWB, 2005 and Van Rooyen, 2007.
The research questions explored are:
How competitive has the South African wine industry been over time and how can this be
measured?
Why did it perform as such and did the industry change over time?
What are the factors determining this performance?
How can such information be used to establish an industry agenda to promote greater
competitiveness?
The next section gives a concise description of the South African wine industry and competitive-
ness is defined in section 3. A comprehensive four-step framework of analysis is then applied in
section 4 to measure and analyses the competitive performance of the wine industry. Changes in
the “competitiveness space” of the industry are considered and from this a wine industry agenda
is proposed. Conclusions are drawn in section 5.

Van Rooyen et al. / International Food and Agribusiness Management Review / Volume 14, Issue 4, 2011
2011 International Food and Agribusiness Management Association (IFAMA). All rights reserved.
181
0
100000
200000
300000
400000
500000
600000
700000
800000
1961
1963
1965
1967
1969
1971
1973
1975
1977
1979
1981
1983
1985
1987
1989
1991
1993
1995
1997
1999
2001
2003
2005
2007
Quantity (tonnes) Value ($000)
The South African Wine Industry at a Glance
The wine industry contributed an estimated R20 billion (around USD $ 1.6 billion) to the South
African gross domestic product (GDP) in 2009. This figure rises to R23.5 billion when tourism is
included. An amount of R4.2 billion per annum (2008) is contributed to government revenue via
excise taxes and wine farm producers’ income amounted to R3.32 billion in 2008. The industry
sustains about 275,000 job opportunities (including around 20 percent through wine tourism),
although some of this is seasonal in nature. Investment capital in 2008 is in excess of R50 billion
(US$5 billion).
In 2008, 124,993ha were cultivated for wine production (93,889 ha in 1995). 3,839 producers
and 870 cellars – mostly in the Western Cape Province, with some in the Northern Cape and Free
State – produced 1,089 million liters of wine, brandy and grape juice concentrate. This was done
from a harvest of 1.4 million tons of grapes, making South Africa the world’s 7th largest wine
producer. About 63 million liters of drinking wine were produced from this harvest, of which
38% was red and 62% was white wine, compared to a yield of 12% red wine and 88% white
wine in 1995.
South Africa produces 3.7% of the world’s wines and exports 54% of its wine production or
411.8 million liters in 2008 to the value of R6.27 billion (US$385 million). In 1994 only 50.7
million liters were exported or 12% of wine production. The South African wine industry is
therefore characterized as highly trade oriented. In Figure 1 the long term export performance, in
terms of value and volume is shown, noting the dramatic increase since the early 1990’s. This
feature is directly related to the competitive performance of the industry.
Figure 1. Exports of South African wine in quantity (tons) and value ($) – 1961 to 2008. Source: FAOSTAT

Van Rooyen et al. / International Food and Agribusiness Management Review / Volume 14, Issue 4, 2011
2011 International Food and Agribusiness Management Association (IFAMA). All rights reserved.
182
The UK (27%), Germany (17%) and the Netherlands (7%) are currently the major export desti-
nations for South African wines, with the African continent (Nigeria and Kenya) rapidly grow-
ing. Per capita consumption of wine in South Africa is stagnant at 7.5 liters in comparison with
53.9 liters in France, 22.4 liters in Australia, 28.1 liters in Argentina and 8.5 liters in the USA.
Comprehensive information on the South African wine industry can be obtained from the SA
Wine Industry Directories, 1998 – 2011 and SAWIS (www.sawis.co.za).
Defining Competitiveness in the Wine Business Environment
Competitiveness has always been a somewhat difficult and controversial concept, and there is
also disagreement about its measurement and the appropriate indexes to be used. Several studies
argue that trade performance measures do not adequately reflect the state of competitiveness.
However, despite these views, it is noted that competitiveness is most often associated with trade
performance (Roa and Lempriere 1992; Arndt 1993; Frohberg and Hartman 1997; Ezeala- Harri-
son 2005; Esterhuizen 2006). In this view industries and firms are competitive when they are
able to continue to grow their trade in today’s global environment, through product offers – qual-
ities, prices and services- that are as good as, or better than their competitors. This will enable the
most competitive players to attract sufficient scarce production factors - capital, land, labor,
technology and management- from competing economic activities to sustain and expand their
performance (Freebairn 1986; Van Rooyen, Esterhuizen and Doyer 2000; Cho and Moon 2002;
Esterhuizen & Van Rooyen 2005). Actions such as opportunistic, short term ‘price wars and cost
cutting’ therefore seldom sustain competitive performance. Measuring long-term, sustained per-
formances are thus relevant in analyzing competitiveness performance (Boehlje 1996; Cho 1994;
Esterhuizen 2006). In short, to be competitive in today’s world is to be in a position to continue
to trade successfully relative to the competition i.e. to consistently outperform the competition.
With the above in mind and in view of the importance of open global trade, competitive perfor-
mance in the South African wine industry is strongly linked to trade performance and is defined
as:
“The ability to expand the trade of South African wines relative to their competitors, in order to
attract investment and other scarce resources to achieve sustainable returns”.
A Four-Step Framework for Analyzing Competitive Performance
The following sequential steps are followed to measure and analyze competitive performance
and is derived from work by Ismea, 1999; Van Rooyen, Esterhuizen and Doyer, 2000, Ester-
huizen and Van Rooyen, 2005, 2007; and Esterhuizen, 2006 and van Rooyen, 2007. Each step
takes full cognizance of the information gathered in previous steps i.e. an interactive process is
followed during the data gathering and analysis processes.
Step 1: Measure competitive performance through the Wine Competitiveness Rating (WCR),
based on trade performance as measured by the Relative Trade Advantage (RTA) method
(Balassa 1989; Volrath 1991).

Van Rooyen et al. / International Food and Agribusiness Management Review / Volume 14, Issue 4, 2011
2011 International Food and Agribusiness Management Association (IFAMA). All rights reserved.
183
Step 2: Identify through interviews with industry experts and knowledgeable stakeholders and
through the Wine Executive Survey (WES) the major factors impacting on competitive perfor-
mance;
Step 3: Analyze these factors and establish the Determinants of Competitiveness (DC), through
“new” competitiveness theory (Porter, 1990);
Step 4: Use the above information to identify and analyze changes over time in the “competitive
space” of the SA wine industry and from this determine an industry agenda for enhancing com-
petitiveness performance.
STEP 1: Measuring Competitive Performance of the South African Wine Industry
The Relative Trade Advantage (RTA) method: To measure how competitive the wine
industry in South Africa performed, it is necessary to determine how successful this sector
competed with other wine producing countries i.e. how South Africa traded its products over
time in the local and global environment in comparison with its trade competitors. To this
measure must be added the ability of the sector to compete with other business opportunities to
attract the required scarce economic resources. The Relative Trade Advantage (RTA) method,
as originally developed by Balassa (1989) and extended by Volrath (1991) is based on actual
trade performance and measures such performances. This method was used by many scholars
over recent years (Van Rooyen and Van Rooyen 1998; ISMEA 1999; Van Rooyen, Esterhuizen
and Doyer 2000; Valentine & Krasnik 2000; Pitts and Lagnevic 1997; Pitts, O’Connell &
McCarthy 2001; Ferto & Hubbard 2001; Esterhuizen 2006; SAWB 2005; Esterhuizen and Van
Rooyen 2005, 2007) for the quantitative measurement of competitive performance.
In this quantitative method, using global trade flows of all the competing industries viz-a-viz the
industry under consideration, it is argued that competitive advantage is indicated by relative trade
performance i.e. the ability to trade in the global market because this effectively reflects all
relative market costs as well as all non-competitive factors, government policies and other
measures affecting actual trade patterns between competitors (Balassa 1989; Volrath 1991).
This method therefore determine the “revealed” comparative advantage, reflecting competitive
performance and competitiveness under real world conditions. Other more restricted measures
only describe certain aspects influencing competitiveness, such as factor productivity, product
characteristics, unit production cost and profit ratios, organizational performance and bench
marking or applied comparative advantages analysis (Porter,1990) as quoted by Ezeala- Harrison
2005; Augusto et al. 2005). Situations such as “uneven economic playing fields” due to distorted
economies, protective trade policies and trade regimes impact directly on trade patterns and
competitive performance, but are effectively accounted for in the RTA measure.
The RTA is formulated as:
(1) RTAiv = RXAiv – RMPiv
Where for (n + v) countries and (m + i) products,

Van Rooyen et al. / International Food and Agribusiness Management Review / Volume 14, Issue 4, 2011
2011 International Food and Agribusiness Management Association (IFAMA). All rights reserved.
184
u h h u
(2) RXA i v = [ X i v / X i n ] / [ X m v / X m n ]
n=1 m=1 m=1 n=1
u h h u
(3) RMA i v = [ M i v / M i n ] / [ M m v / M m n ] n=1 m=1 m=1 n=1
Where X and M refer to exports and imports, respectively
The numerator in equations [2] and [3] is equal to a country’s export (imports) of a specific
product category relative to the exports (imports) of this product from all countries except for the
country in consideration. The denominator reveals the exports (imports) of all products except
for the commodity in consideration from the respective country as a percentage of all other
countries’ exports (imports) of all other products.
While the calculations of indices RXA and RMP are exclusively based on either export or import
values, the RTA considers both export and import activities. This seems to be important in view
of trade theory and globalization trends and due to the growth in intra-industry and/or entrepot
trade, as this aspect is increasing in importance (ISMEA 1999). The level of these indicators
represents the degree of revealed export competitiveness/import penetration and is based on the
relative trade performance of all competitors. When this performance is measured over time the
historical trend in competitive performance can be determined, viz-a-viz that of the competitors.
The Wine Competitiveness Rating (WCR) data is shown in Table 1 and trends from 1960 to
2008 are illustrated in Figure 2.
Table 1. The competitiveness rating of the wine industry in South Africa (2000 – 2008) based on
the Relative Revealed Trade Advantage (RTA)
Product RTA RTA RTA RTA RTA RTA RTA RTA RTA
2000 2001 2002 2003 2004 2005 2006 2007 2008
Wine 4.05 3.76 4.31 4.96 5.36 5.84 4.74 4.42 4.55
Source: Own calculation based on data from FAOSTAT; Esterhuizen and van Rooyen 2005,
2007.
From this graph it can be noted that South Africa’s wines performed increasingly internationally
competitive over the past two decades, reached a high point in 2005. Recently some decline is
being recorded to levels just above 2002 levels. The impacts of the regulation period and politi-
cal sanctions (until early 1990s) and the changes related to political liberation, deregulation of
the wine industry and increased exports due to the open access to global markets since the early
1990’s, are dramatically captured in the competitive performance of the wine industry. Events
related to changing consumer preferences and style changes, trade policies, exchange rate fluctu-
ations and technological innovation are also reflected in the WCR. These trends are analyzed in
the Step 2.

Van Rooyen et al. / International Food and Agribusiness Management Review / Volume 14, Issue 4, 2011
2011 International Food and Agribusiness Management Association (IFAMA). All rights reserved.
185
Australia
Chile
(5.00)
-
5.00
10.00
15.00
20.00
1990 1991 1992 1993 1994 1995 1996 1997 1998 1999 2000 2001 2002 2003 2004 2005 2006 2007
Argentina Australia Chile France Italy New Zealand Portugal Spain United States of America South Africa
France
New ZealandPortugal
ItalySpain
South Africa
Argentina
(1.00)
-
1.00
2.00
3.00
4.00
5.00
6.00
7.00
19611963
19651967
19691971
19731975
19771979
19811983
19851987
19891991
19931995
19971999
20012003
20052007
Phase 1
Phase 2
Phase 3
Phase 4
Phase 5
Phase 6
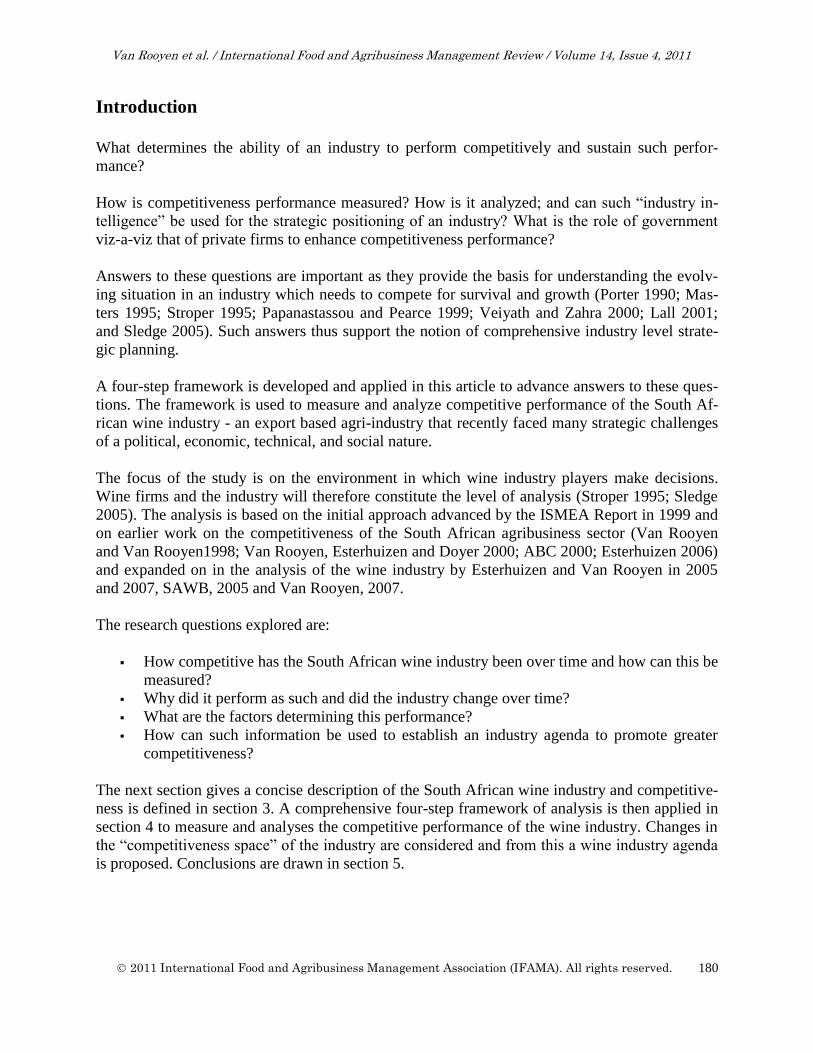
In Figure 3 the general upward and relative “middle” position of South African is indicated. The
recent decline is also shown. Countries with recent increasing performances are Argentina, New
Zealand and particular the highly competitive Chile, after its considerable decline from 2000 to
2005.
Figure 2. Competitive trends of the wine industry in South Africa (1960 – 2008) Source: FAOSTATS
Notes: Competitive (RTA > 1), marginally competitive (1 > RTA > 0), not competitive (RTA < -0);
Figure 3. Trends in the competitiveness of selected wine producing countries (1990-2007) Source: FAOSTATS

Van Rooyen et al. / International Food and Agribusiness Management Review / Volume 14, Issue 4, 2011
2011 International Food and Agribusiness Management Association (IFAMA). All rights reserved.
186
International comparisons: Wine trading (both at import and export levels) is one of the most
dynamic and competitive activities in the agri-food environment. Since the late 1980s, the share
of wine production that is traded internationally has nearly doubled and wine trade has brought
major gains to participants in expanding countries, but pain to many traditional producers (An-
derson, 2004). A view of South African competitive performance measured by the RTA, in com-
parison with some other major wine trading economics is instructive.
STEP 2: Factors of Competitiveness in the SA Wine Industry
Step 2 of the comprehensive analysis employs a qualitative methodology, based on opinions and
perceptions of persons responsible for strategic direction and executive decisions in the SA wine
industry. This qualitative approach, based on personal discussions, focus group sessions and
qualitative surveys, explain the measured trends and then identify and analyze the factors influ-
encing these competitive trends in the wine industry.
Commenting on Trends and Phases in Competitiveness Performance
From the graphical illustrations in Figures 2 and 3, and based on interviews with prominent wine
analysts, executives and stakeholders, a number of phases in the competitiveness performance of
the South African wine industry since 1960 can be constructed and described i.e. a short com-
mentary on the recent history of the competitive performance of the South African wine industry
(SAWB 2005; SAWC 2007, 2010; Van Rooyen 2007; Bayley 2008; Le Roux 2008; Joubert
2010; Bruwer 2010).
Phase 1 - Regulated competitiveness ( – up to 1970): During this period (effectively starting in
the late 1930s), the South African wine industry was heavily regulated through centralized con-
trols on varietal choices and vine material, wine and wine grape production quotas, production
cost based regulated pricing, surplus removal schemes and price agreements. The KWV (Koper-
atiewe Wijnboere Vereniging) established in 1918 and representing wine grape producers, was
granted statutory powers to regulate supply in the industry. This period was characterized by a
focus on high volume production of relatively lower quality wines, producer income stabilization
and an overall orientation towards brandy and fortified wine production as a “surplus removal”
type scheme (Vink, Williams and Kirsten 2004).
Phase 2 – Competing in a constrained economic and political environment (1970-1990): In-
creasing political pressures on South Africa by the international environment during the 1970s
and the imposing of “anti-apartheid” trade sanctions brought the highly regulated industry almost
to a halt. Economic survival was possible through occasional exports of large volumes of low
quality wine to Eastern Europe and domestic consumption (Vink, Williams and Kirsten 2004).
One important technical innovation during this period was the introduction of the “Wine of
Origin” scheme which brought strictly enforced local wine industry regulations in line with those
in European countries. Cultivar based and classic wines also became more popular. Wine tour-
ism and ‘wine routes’ were introduced, together with the “estate wine label” concept where es-
tates produced their own brands.
Van Rooyen et al. / International Food and Agribusiness Management Review / Volume 14, Issue 4, 2011
2011 International Food and Agribusiness Management Association (IFAMA). All rights reserved.
187
Phase 3 – The ‘Madiba Magic’ period (1990-1995): With the release of Nelson “Madiba”
Mandela in 1990 and the following political liberation of the South African society, the wine in-
dustry started with a remarkable period of activity and transformation. Economic sanctions were
lifted, leading to international business exposure, access to international markets, interaction with
trade supply chains and increased investments. The South African wine business scene however
also changed dramatically as the impact of international competitiveness hit “local shores”. By
1997 the industry was fully deregulated and wine surpluses, quota allocations, and administrative
pricing schemes were removed. The Wine of Origin scheme was maintained and the Integrated
Production of Wine (IPW) programme, to support environmentally sustainable production and
wine making practices, was widely implemented. International sales of South African wines in-
creased from 20 million liters in 1992 to over 72.8 million liters (still only 14.6 % of the wine
crop) in 1995.
Phase 4 – Facing competitive realities (1996-2000): Despite increased sales (at relative low
price points) certain cracks started to appear in 1996 in the South African wine success story.
Internationally renowned wine writers and wine judges called for changes in style and quality
and the need for South Africa to produce internationally accepted “new world” wines – fruity,
non-grassy, less tannins, great consistency, more quality reds, etc.. Australia also became a much
more aggressive player in the UK, South Africa’s most important market – especially in the su-
per market environment.
This resulted in a range of technical innovations, including the planting of improved grape varie-
ties and virus-free plant material. The terroir system was extended, together with cultivar specific
site solutions and the planting of more red varieties to strengthen the “Wine of Origin” scheme.
Supply chain efficiency and reliability became a major success factor for the wine business
(SAWB, 2002 and 2005). At the start of the new millennium, the South African wine industry
responded positively on competitive realities, producing “good value for money” wines in the
new world style, and with a distinctly South African character. Exports rose from 99.9 million
liters in 1996 (17.3% of the wine crop), to 141 million liters in 2000 (26% of the wine crop).
Phase 5 – Towards becoming a global player (2000 - 2005): The industry mobilized and joint-
ly decided on a strategic ‘course for excellence’ through the acceptance of Vision 2020, the es-
tablishment of the SA Wine & Brandy Company (SAWB) [trading as the SA Wine Industry
Council (SAWC) since 2007] as a coordinating body and the setting of a framework for a part-
nership with government through the ‘Wine Industry Strategy Plan’ (WIP) in 2003. This phase
also records a sustained increase in exports, in particular to the UK, Netherlands and Germany.
Brand development and promotion became noted business strategies, with a particular effort by
the wine industry to establish an identity through unique ‘Brand SA’ properties, emphasizing the
great diversity and value for money of South African wines. “Variety is our nature” with an in-
creasing environmental focus (the Wine Bio-Diversity Initiative) and social responsibility and
transformation - see the Wine Industry Transformation Charter and Score Card (SAWC, 2007),
featured prominently in this “Brand SA” drive. Concepts such as integrity, authenticity and sus-
tainability became key pointers in the industry (see the SA Wine Industry Directory, 2002-2010)
as well as the notion of unique and typical South African wines (Pinotage-red; Chenin Blanc-
white).

Van Rooyen et al. / International Food and Agribusiness Management Review / Volume 14, Issue 4, 2011
2011 International Food and Agribusiness Management Association (IFAMA). All rights reserved.
188
The impact of world market changes, in style and content, fluctuating exchange rates and the
presentation of unique lifestyle experiences (wine + food + tourism + value for money) became
integrated in South African wine business strategies. Efforts to expand the local market were also
implemented, in particular through the expanding of “black diamonds” markets and in the histor-
ical black town ships (Ndanga, Louw and Van Rooyen 2010). Since 2000, exports again in-
creased to 281 million liters or 44.7% of wine production in 2005.
Phase 6 - Operating in a constrained competitive environment (since 2006): Since the 2005
high point, the wine industry in South Africa is in a declining phase in terms of competitive per-
formance relative to its competitors. This negative trend in competitiveness started in 2006 after
the definite positive trend in competitiveness which started in 1990. The main reasons for this
decline in competitiveness can be found in the broader wine industry environment in which
South African wine businesses now operate. This constrained environment include factors such
as the world economic slowdown, declining levels of wine consumption, sustained international
strengthening in the value of the local currency, global warming/drought conditions and climatic
fluctuations, increases in interest rates, lack of infrastructure maintenance and export facilities,
lack of skilled labor, and government’s inability to provide sufficient regulatory, certification and
support services to the needs of the dynamic wine industry.
Exports dropped in 2006 to 271 million liters – 38.3 percent of the total wine production. In
2008, 39 percent of wine production was exported, although the export volume increased to 411
million liters.
This downward trend in competitiveness is also in line with the findings of the IMD in their
World Competitiveness Yearbook on South Africa (IMD, 2001-2011), which showed a drop in
South Africa's ranking, from 38th to 50th out of 55 countries in 2007 to 48th out of 57 countries
in 2009. In explaining South Africa’s drop in global competitiveness rankings, the five most
problematic factors for doing business in South Africa were identified by the IMD to be: crime
and theft, inefficient government bureaucracy, inadequately educated workforce, restrictive labor
regulations and inadequate supply of infrastructure.
A general comment on performance over time is the relative absence of impacts due to climate
variations, especially droughts; no serious droughts or adverse climatic conditions were experi-
ences in the wine industry over the last twenty years (SAWID). The SA industry is also quite di-
verse across a range of climatological types and this, together with the “Integrated Production of
Wine (IPW)” scheme mitigated climate risk for the industry as a whole (Le Roux, 2008; Bayley
2008; Bruwer 2010).
The Wine Executive Survey (WES)
Executive views and expert opinions: The WES aim to determine the key factors enhancing or
constraining the competitive performance of wine businesses. The focus of this inquiry is at the
firm level i.e. individual firms. Executives surveyed are responsible for the success and failure of
strategy and operations. Whereas the hard/quantitative data in Step 1 was used to measure com-
petitiveness performance over a specific period, the qualitative survey data of the WES is used to
identify factors determining competitive performance - as it is perceived at certain points in time
at strategic levels of decision making. The WES provides many unique measures and captures

Van Rooyen et al. / International Food and Agribusiness Management Review / Volume 14, Issue 4, 2011
2011 International Food and Agribusiness Management Association (IFAMA). All rights reserved.
189
the informed judgments of business leaders and decision-makers in the wine industry of South
Africa.
Data base and time periods of analysis: Whereas Step 1 of the analysis measured the long term
trends in competitive performance (1960-2008), the WES was only implemented in 2005 and
repeated in 2008.
The WES’s provides information on the prevailing perceptions of wine executives and specialists
during two periods, situated within the most recent two phases of the competitive performance of
the industry i.e. phases 5 and 6 (see Figure 1). The 2005 survey was at the height of competitive
performance and the 2008 survey recorded views during the recent declining phase. Respondents
were asked to identify and rate factors impacting competitive performance in terms of most en-
hancing (3), modestly enhancing (2) and most constraining (1).
The 2005 WES: The 50 respondents identified the following as the five most enhancing factors:
size of the export market;
opportunities in “environmentally aware” markets for wine;
local infrastructure and transportation networks;
technical information flows;
competitiveness amongst local suppliers to the industry;
The five most constraining factors in 2005 were:
the strong currency (Rand);
cost of crime;
difficulty of starting a new business;
trust in the political system;
the incompetency of government administration and bureaucracy;
The 2008 WES: The factors affecting the competitiveness in the wine industry in South Africa in
2008 were identified and rated through responses from 46 executives in the wine industry. The
five most enhancing factors for the industry were:
the strong competition and rivalry in the local market;
strong international competition;
the affordability of high quality South African products;
the entry of new competitors in to the local market;
quality production services and processes;
The five most constraining factors for the industry during the 2008 period were:
the low confidence and trust in the political/governance environment;
reliability of electricity supply;
the high cost of crime;
the incompetence of service personnel in the public sector;
the quality of low skilled labor.
The full list of factors and their ratings are shown in Table 3.

Van Rooyen et al. / International Food and Agribusiness Management Review / Volume 14, Issue 4, 2011
2011 International Food and Agribusiness Management Association (IFAMA). All rights reserved.
190
STEP 3: Determinants of Competitive Performance
The third step in the analysis compliments the first two, where competitive performance was
firstly quantitatively measured; and secondly qualitatively explained and the various factors im-
pacting on competitiveness identified by industry experts and executives. The methodology de-
veloped by Michael Porter (1990) to analyze competitiveness (Porter’s Diamond) is used, in an
adapted form, in Step 3 to derive the determinants of competitive performance in the wine indus-
try in South Africa from the data previously generated.
The four key determinants of competitive performance of the Porter Diamond – factor condi-
tions, demand conditions, related and supporting industries and firm strategy, structure and rival-
ry – are all well suited to determine the forces and factors driving competitiveness performance
in the trade orientated South African wine industry. However, due to the high degree of regula-
tion of the South African wine industry, related to aspects of quality, certification and also to so-
cial, labor and political transformation, the concept of government policy and interventions must
be considered in this enquiry. The notion of “luck or chance” is also relevant, as the South Afri-
can wine industry is highly exposed to changes in macro-economic trends and international fac-
tors such as changes in currency values, as well as a range of external factors impacting on costs,
such as crime and health situations.
In Step 3 of the analysis, Porter’s Diamond is extended to include the impacts that government
and chance forces have on competitiveness (Sledge 2005; Esterhuizen and Van Rooyen 2001 and
2005). Accordingly six broad criteria or attributes that shape the environment in which firms
compete are analyzed, namely:
Factor conditions– the industry’s endowment in factors of production, such as climate,
terroir, skilled labor, infrastructure, etc. necessary to compete.
Demand conditions– the nature, changes and knowledge of the market demand for the in-
dustry’s products or service.
Relating and supporting industries– the presence or absence of competitive supplier and
other related industries.
Firm strategy, structure and rivalry– the way companies are created, organized and man-
aged, as well as the nature of domestic rivalry.
Government support and policy– government plays a vital role. Government can influ-
ence each of the above determinants, either positively or negatively, through policies and
the environment that is created, funding support and the provision of public goods to
support private operational capacity and social stability.
The role of chance (or luck) – chance factors/events/ luck are occurrences largely beyond
the power of firms and national governments. Such events can nullify sources of compet-
itive advantage and create new ones. The South African wine industry, operating in an
“open” global environment and under free market policies with limited government pro-
tection and subsidies, will be highly prone to such influences.
In Table 3 the factors listed and rated in the WES’s are grouped in terms of the various Porter
Diamond determinants. From these the impact of the determinants is then rated to allow for
comparisons between the 2005 and 2008 surveys.

Van Rooyen et al. / International Food and Agribusiness Management Review / Volume 14, Issue 4, 2011
2011 International Food and Agribusiness Management Association (IFAMA). All rights reserved.
191
Table 3a. The determinants of competitive performance in the South African wine industry-
2005 and 2008.
Determinants 2005 2008 Determinants 2005 2008
(i) Production factor conditions 1.9 (ii) Related & supporting industries 1.9 1.6
Quality of low-level skilled labor 2 1 Electricity supply 1.5 0.5
Cost of Transport NA 1.4 Collaboration with scientific
research institutions in R&D 2 1.5
Cost of financing 1
Telecommunication 2 1.5
Availability of Skilled labor 2 1 Suppliers of packaging material 2 1.5
Overall cost of doing business 1.5 1 Financial institutions 1 1.5
labor administration cost 1 1 Transport companies 2 1.5
Cost of quality technology 2 1 Internet service providers 1.5 2
Quality of skilled labor 1.5 1.5 Specialized information services 2 2
Cost of skilled labor 2 1.5 Sustainability of local suppliers 2.5 2
Cost of infrastructure 1.5 1 Status of scientific
research institutions 2.5 2
Cost of low level skilled labor 2 1.5 Quality of local suppliers 2
Efficiency of general infrastructure 2 1.5
Credit availability 1.5 2
Availability of quality technology 2.5 2
Quality of technology 2.5 2
Availability of water for
industrial purposes 2 2
Availability of low level skilled labor 3 2

Van Rooyen et al. / International Food and Agribusiness Management Review / Volume 14, Issue 4, 2011
2011 International Food and Agribusiness Management Association (IFAMA). All rights reserved.
192
Table 3b. The determinants of competitive performance in the South African wine industry-
2005 and 2008 Determinants 2005 2008
Determinants 2005 2008
(iii) Firm strategy, structure
& rivalry 2.3 2.1
(iv) Government support
& policies 1.3 1.5
Expenditure on R&D 2 1.5 Confidence/ trust in political
systems and governance 0.5 0.5
Incentives for management 2 1.5 Competence of personnel
in the public sector 1 1
Flow of information from
Customers 1.5 2 Labor policy and regulation 1 1
Information flow from
primary suppliers to company 1.5
2
Administrative/bureaucratic
regulations in South Africa 1 1
Substitutes of your company’s
product or services 2.5
2 Land reform policy 1 1
Continuous innovation 2.5
2
Black Economic
Empowerment policy 1 1
Regulatory standards 2.5 2 The tax system 1 1.5
Efficiency of technology in
production processes 2.5 2 Political changes 1 2
Environmental awareness 2 2 Environmental regulations 2 2
Invest in staff 2.5 2 Trade policy 2 2
Unique services & processes NA 2 Macro-economic policy 2 2
Entry of new competitors 3 2.5 Competition law NA 2
International entry in local market NA
2.5
Complying with
environmental standards 2.5 2
Affordable high quality products NA 2.5
Competition in the local market 3 3
Industry structure and rivalry 2 NA

Van Rooyen et al. / International Food and Agribusiness Management Review / Volume 14, Issue 4, 2011
2011 International Food and Agribusiness Management Association (IFAMA). All rights reserved.
193
Table 3c. The determinants of competitive performance in the South African wine industry-
2005 and 2008 Determinants 2005 2008 Determinants 2005 2008
(v) Demand conditions 2 1.8 (vi) Chance factors 1.3 1.4
Growth in local market 1.5 1.5 Cost of Crime 0.5 0.5
Local market size 1.5 1.5 Cost of HIV/Aids NA 1.5
Demand for environmental
friendly products 2
1.5 Exchange rate 1.5 1.5
Internationalization of local
Buyers NA 1.5 Global developments 2 2
Growth in international markets 2.5 2
Knowledge of markets 2.5 2.5
Sophistication of local buyers NA 2
*Ratings: 1 = most constraining; 2 = modestly enhancing; 3 = most enhancing
Source: Adapted from the “the Agricultural Business Chamber and SAWB/SAWC Wine Executive Surveys 2005,
2008”
The factors with an enhancing effect on the competitiveness of the wine industry in South Africa
in both 2005 and 2008 are the availability/cost of low-level skilled labor, the quality and availa-
bility of technology in South Africa, water availability and the general efficiency of infrastruc-
ture.
From 2005 to 2008 most factors however decline. In 2005 the high cost of financing and labor
administration cost were rated as most constraining. These were also included as the most con-
straining factors in 2008, in addition to the quality of low-skilled labor, cost of transport, infra-
structure and technology, availability of skilled labor and the overall cost of doing business.
This all indicates that on average the production factor conditions in South Africa have an in-
creasingly constraining effect on the wine industry’s competitive performance.
Related and supporting industries: The related and supporting industries, as a determinant of
competitiveness in 2008, were rated 1.6, which records a modestly constraining impact on the
South African wine industry (Table 3a). In 2005 this factor were rated to have contributed at 1.9.
For this determinant 2008 therefore shows a decline in the competitive space of the industry.
Most factors, except financial institutions and internet services, which recorded higher ratings in
2008, showed declining ratings, with electricity supplies recording the biggest decline. The status
of supporting research institutions and the sustainability of local suppliers rated as the highest
contributors in both periods.

Van Rooyen et al. / International Food and Agribusiness Management Review / Volume 14, Issue 4, 2011
2011 International Food and Agribusiness Management Association (IFAMA). All rights reserved.
194
Firm strategy, structure and rivalry: The third determinant of competitive advantage is the
context in which firms are created, organized and managed as well as the nature of rivalry in the
industry (Table 3b). With an average score of 2.1 for 2008, firm strategy, structure and rivalry as
a whole, have an enhancing impact on competitiveness of wine businesses in South Africa. The
only constraining factors, even though only slight constraining, are the declining expenditure on
R&D and incentives to support management performance. In 2008, the most enhancing factors
were the ease of entry of new competitors, international entry into the local market, affordability
of high quality products and the fierce competition in the local market.
This determinant was rated as highly enhancing in 2005 with 2.5, with the strong enhancing
factors the industry regulatory structures and standards, integrity systems, intense internal
competition, entry of new competitors on a regular basis, the production of affordable high
quality products, firm level investment in human resources, employment of quality technology,
the production of unique products, services and processes, the production of environmental
friendly products, and continuous technical innovation.
A positive status is generally experienced in this determinant, although a decline from 2005 to
2008 is observed. This can be related to tighter market conditions and factors constraining
innovation and technical progress.
Government support and policies: The wine industry in South Africa is highly regulated and to a
large degree dependent on good partnership arrangements and effective lobby strategies with
government departments and agencies (Table 3b). Government policy and support on matters
related to export and trading, science and innovation, empowerment and transformation, tax and
excise duties, access to natural resources such as land and water, labor relations, financial
arrangements to name some, directly impact this sensitive and highly market orientated industry.
With an average score of 1.5 in 2008, government services, policies and support systems are
viewed to act in a constraining manner to the competitive success of the wine industry. However
in 2005, with a rating of 1.3, this determinant was rated as more constraining with the major
constraining factors burdensome administrative regulations, the impact of legal change, the
competence of personnel in the public sector and the tax system’s impact on investment and risk-
taking. South Africa’s resources policies (labour and land) and the lack of clarity of
transformation policy also negatively impacted competitive performance in 2005.
Government support and policies were however viewed to become less constraining in 2008. It
shows a positive trend towards, partly due to many policy and government level interactions by
the industry; the finalisation of the Transformation Charter and Score Card, the Wine Industry
Plan, the restructuring of the wine industry’s body to become more representative (the SA Wine
Industry Council (SAWC)), and on-going supportive trade and promotion interactions. In 2008,
the trust in the honesty of politicians, competence of personnel in the public sector, the current
impact of the labour policies, administrative regulation in South Africa, the land reform process
and the tax system were considered the most constraining factors resulting in the sustained
negative overall rating of this determinant.

Van Rooyen et al. / International Food and Agribusiness Management Review / Volume 14, Issue 4, 2011
2011 International Food and Agribusiness Management Association (IFAMA). All rights reserved.
195
It is interesting to note that complying with environmental regulations were rated by the wine
industry in South Africa in 2005 to have a positive impact on their competitiveness, while
macro-economic and trade policy provided moderate enhancements. In 2008, again the
compliance with environment standards is considered to enhance competitiveness, as well as
trade-, and macro-economic policies and competition law.
Demand conditions: In 2008, the demand conditions had a rating of 1.8 which indicates that the
demand conditions may be somewhat constraining the South African wine industry’s
competitiveness(Table 3c). The rating in 2005 of 2 reflects a more positive view on the market
conditions facing South African wines. This view can be partly related to currency revaluation
and fluctuations and tighter competition in the global markets.
The Wine Executive Survey (WES) in both 2005 and 2008 indicated that the size of and growth
in the local market are constraining the competitiveness of the wine industry in South Africa.
The issue of buyers of South African wine being knowledgeable, demanding and buying envi-
ronmentally friendly products and being concerned of ethics and the integrity of production
methods were viewed to have a modestly positive impact on the South African wine industry’s
competitiveness.
Chance factors: Chance events are occurrences that have little directly to do with circumstances
in an industry and are largely outside the power of the firms or a country to influence. Chance
events, however, are important because they create opportunities and discontinuities that could
allow shifts in competitive performance. Chance events can nullify the advantage of previously
established competitors and create the potential that a new firm can supplant them to achieve
competitive advantage in response to new and different conditions (Porter, 1998).
For the wine industry of South Africa, the impact of chance factors is considered the most
constraining to competitive performance (Table 3c). In 2008 this factor was rated 1.4 against 1.3
in 2005.
The strengthening of the South African exchange rate and the global political/economic
developments were rated to have highly constraining impacts, both in 2005 and 2008.
The cost of crime was viewed to be the most constraining factor amongst the chance factors in
2005 and 2008, at a rate of 0.5. The cost of HIV/Aids was rated as the second most constraining
chance factor in 2008; in 2005 this was not considered.
STEP 4:Determining the Changing “Competitive Space” of the SA Wine Industry
The “competitive space” for the South African wine industry changed considerably from 2005 to
2008 due to a pronounced decline in most of the determinants and related factors. This view is
confirmed by the RTA measurement of the declining competitive performance of the industry.
Wine industry executives consistently rated firm strategy and rivalry, together with de-
mand/market conditions to have an enhancing impact on competitiveness. However in
2008, firm strategy and rivalry showed a decline. Supporting industries also showed a
enhancing effect in 2005, although declining in 2008 (Figure 4);

Van Rooyen et al. / International Food and Agribusiness Management Review / Volume 14, Issue 4, 2011
2011 International Food and Agribusiness Management Association (IFAMA). All rights reserved.
196
Production factor conditions were modestly constraining in 2005 and became more con-
straining in 2008;
In both the 2005 and 2008 WES’s, executives indicated that the chance related factors
and the government support and policies were the most constraining determinants. How-
ever, in 2008, these two factors were rated somewhat less constraining - indicating a
modestly positive trend.
Figure 4. The “Porter” determinants of competitiveness in the South African wine industry,
2005 and 2008.
Ratings: 1 = most constraining; 2 = modestly enhancing; 3 = most enhancing.
Production factor conditions: The average score in 2008 achieved for production factor conditions is 1.4; in 2005
it recorded 1.9, showing a decline from a modestly enhancing state to increasingly constraining in 2008 (Figure 3a).
A strategic agenda for the SA wine industry: In strategic planning work sessions, where these
findings and the changing competitive space were discussed with industry representatives (Wine
Industry Council, 2005-2008), the decline in the competitive space were noted, in particular the
low rating of government support. The importance of a consistent and intelligent “lobby action”
with government - an open ‘red telephone line’ - was viewed as highly relevant for a competitive
wine economy in particular as it relates to domestic factors constraining wine trade.
The above analysis identifies a number of aspects to focus such “lobby discussions” and to build
the necessary trust between industry and government as important players in this environment.
These factors would include: trade agreements and policy development; international market de-
velopment - regulation and export promotion; infrastructure expansion, in particular exportation
facilities and transportation networks; research support and technological innovation; economic
empowerment and transformation support; the combating of crime; the simplification of labor
regulations; and a reduction in bureaucratic ‘red tape’ to name the main items on the agenda
(Van Rooyen 2007).

Van Rooyen et al. / International Food and Agribusiness Management Review / Volume 14, Issue 4, 2011
2011 International Food and Agribusiness Management Association (IFAMA). All rights reserved.
197
Conclusions
This article focused on the measurement and analysis of the competitive performance of the
South African wine industry. By applying a four step framework of analysis, the competitive per-
formance of the South African wine industry was traced and analyzed. The analysis established
that South Africa’s wines are increasingly internationally competitive, with a strong positive
trend since 1990. However, recently this trend started to decline.
The determinants of this declining performance were established and analyzed. The openness of
the South African wine economy was confirmed as factors such as fluctuating exchange rates
and changing market trends play an important role. The role of regulation and a supportive gov-
ernment policy environment were also found to be highly relevant for the competitive perfor-
mance of the industry.
The continued application of the four step framework will enable the industry to measure and
analyze its performance and to determine an agenda for industry level action and the lobbying
required to position the industry to operate more competitively.
Acknowledgement
The input of Yvette vd Merwe from the South African Wine Industry Information Systems is
acknowledged with appreciation.
References
Agricultural Business Chamber (ABC). 2000. How competitive is the South African agricultur-
al industry? Pretoria, South Africa.
Agricultural Business Chamber and the South African Wine and Brandy Company. 2005. The
Wine Executive Survey.
Agricultural Business Chamber and the South African Wine and Brandy Company. 2008. The
Wine Executive Survey.
Augusto, M., J. Figueira, L. Lisboa, and M. Yasin. 2005. A performance assessment approach to
the pursuit of competitiveness excellence. Global Competitiveness. 13: 1&2.
Anderson, K. 2004. The world’s wine markets: Globalization at work. Cheltenham, UK: Edward
Elgar Publishing.
Arndt, H.W. 1993. Competitiveness, Discussion Paper No.20. Centre for Economic Policy Re-
search: Australian National University.
Balassa, B. 1989. Comparative advantage, trade policy and economic development. London:
Harvester/Wheat Sheaf.

Van Rooyen et al. / International Food and Agribusiness Management Review / Volume 14, Issue 4, 2011
2011 International Food and Agribusiness Management Association (IFAMA). All rights reserved.
198
Bayley, D. 2008. Chairman, Certification Panel, SA Wine and Spirits Council. Personal commu-
nication. Stellenbosch, South Africa.
Boehlje, M. 1996. Industrialization of Agriculture. What are the implications? Choices. First
Quarter: 30-33.
Bruwer, F. 2010. Chairman, Wine Cellars SA, Personal communication. Stellenbosch, South Af-
rica.
Cho, D. S. 1994. A Dynamic approach to international competitiveness: The case of Korea.
Journal of Far Eastern Business 1(1): 17-36.
Cho, D.S. and H.C. Moon. 2002. From Adam Smith to Michael Porter. Evolution of Competi-
tiveness Theory. Singapore, New Jersey, London, Hong Kong: World Scientific.
Esterhuizen, D. 2006. An inquiry into the competitiveness of the South African agribusiness sec-
tor. PhD-thesis, University of Pretoria, Pretoria.
Esterhuizen, D. And C.J. Van Rooyen. 2001 “Winners”, “losers” and “turnarounds” in the
South African Agro-food and fiber industry. Agrekon 40(4).
Esterhuizen, D. And C.J. Van Rooyen. 2005. An inquiry into factors impacting on the competi-
tiveness of the South African wine industry. Agrekon 45(4).
Esterhuizen, D. And C.J. Van Rooyen. 2007. Determinants of competitiveness of South African
agricultural export firms. Competitiveness Review 16(3&4).
Ezeala-Harrison, F. 2005. On competing notions of international competitiveness. Advances in
Competitive Research (13)1.
Ferto, I. and L.J. Hubbard. 2001. Regional comparative advantage and competitiveness in
Hungarian agri-food sectors. Paper presented at the 77th
EAAE Seminar, 17 –18 August
2001, Helsinki.
Freebairn, J. 1986. Implications of wages and industrial policies on competitiveness of agricul-
tural export industries. Paper presented at the Australian Agricultural Economics Society
Policy Forum, Canberra.
Frohberg, K. and M. Hartman. 1997. Comparing measures of competitiveness. IAMO Discussion
Paper No. 2. Halle/Saale.
ISMEA. 1999. The European Agro-Food System and the Challenge of Global Competition.
Rome.
Joubert, E. 2010. Wine writer and analyst. Personal communication. Stellenbosch, South Africa.

Van Rooyen et al. / International Food and Agribusiness Management Review / Volume 14, Issue 4, 2011
2011 International Food and Agribusiness Management Association (IFAMA). All rights reserved.
199
Lall, S. 2001. Competitiveness, Technology and Skills. Cheltenham, UK: Edward Elgar.
Le Roux, E. 2008. Chairman, Winetech. Personal communication. Stellenbosch, South Africa.
Masters, W.A. 1995. Guidelines on National Comparative Advantage and Agricultural Trade.
Agricultural Policy Analysis Project, Phase III. USAID.
Nadanga, L., Louw, A., and C.J. Van Rooyen. 2010. Increasing Demand for SA Wines: Identi-
fying the Key Market Segments of the “Black Diamonds”. Agrekon 49(3).
Papanastassou, M. and R. Pearce. 1991. Multinationals, Technology and National
Competitiveness. Cheltenham: Edgar Elgar.
Pitts, E. and M. Lagnevik. 1997. What determines food industry competitiveness? In: Traill,
W.B. & Pitts, E. (Eds.), Competitiveness in the Food industry. London: Blackie Academ-
ic & Professional.
Pitts, E., L. O’Connell, and B. McCarthy. 2001. The competitiveness of the Irish Food
Processing industry, The National Food Centre, Castleknock, Dublin.
Porter, M.E. 1990. The competitive advantage of nations. New York: The Free Press.
Rao, P.S. and T.L. Lempriere. 1992. A comparison of the total factor productivity and total cost
performance: US and Canada. Working Paper Economic Council of Canada.
Stroper, M. 1995. Competitiveness policy options. Growth and Change 26( 2).
Sledge, S. 2005. Does Porter’s Diamond hold in the global automotive industry? Advances in
Competitive Research13( 1).
South African Wine Industry Directory (2002-2010). ISBN 978-0-620-38730-9. Goodwood,
South Africa: Ampersand Press.
South African Wine and Brandy Company (SAWB). 2002. Setting the strategic course for ex-
cellence. Paarl: VR Graphics.
South African Wine and Brandy Company (SAWB) . 2005. The Competitiveness of the South
African Wine Industry. www.sawb.co.za . Stellenbosch, South Africa.
South African Wine Industry Council (SAWC). 2007. Strategic planning work sessions with
council members and invited industry experts. Stellenbosch, South Africa.
South African Wine and Brandy Company (SAWB). 2010. The Wine Industry Transformation
Charter and Score Card, Stellenbosch, South Africa.
South African Wine Industry Information and Systems. 2010. www.sawis.co.za.

Van Rooyen et al. / International Food and Agribusiness Management Review / Volume 14, Issue 4, 2011
2011 International Food and Agribusiness Management Association (IFAMA). All rights reserved.
200
Van Rooyen, I.M. and C.J. Van Rooyen. 1998. Economic aspects of the South African flower
industry. Agrekon. December.
Van Rooyen, C.J., D. Esterhuizen, and O.T. Doyer. 2000. How competitive is agribusiness in
the South African food commodity chain? In J.H. Trienekens and P.J.P. Zuurbier (Eds).
Chain Management in Agribusiness and the Food Industry. Wageningen, The Nether-
lands: Wageningen Press.
Van Rooyen, C.J. 2007. Considering competitiveness in the wine industry. Keynote paper, Bo-
degas Argentina, Mendoza, Argentina. September.
Valentine, N. and G. Krasnik. 2000. SADC Trade with the rest of the world: Winning export sec-
tors and Revealed Comparative Advantage Ratios. The South African Journal of Eco-
nomics 68(2).
Veiyath, R. and S. Zahra. 2000. Competitiveness in the 21st century: Reflections on the growing
debate about globalisation. Advances in Competitiveness Research 13(1).
Vink, N., G. Williams, and J.F. Kirsten. 2004. In K Anderson (Ed). The world’s wine markets:
globalisation at work. Cheltenham, UK: Edward Algar Publishing.
Volrath, T.L. 1991. A theoretical evaluation of alternative trade intensity measures of revealed
comparative advantage. Weltwirtschaftliches Archive 127 (2).