
Analyzing the Absence of Renewable Portfolio Standards in ...
42
Metz1 Analyzing the Absence of Renewable Portfolio Standards in Georgia By Kerri Metz The University of Michigan Program in the Environment Honors Thesis Advisor: Irving Salmeen Reader: Carl Simon 2 April 2015
Transcript of Analyzing the Absence of Renewable Portfolio Standards in ...

Metz1
Analyzing the Absence of Renewable Portfolio Standards in
Georgia
By Kerri Metz
The University of Michigan
Program in the Environment Honors
Thesis Advisor: Irving Salmeen
Reader: Carl Simon
2 April 2015

Metz2
EIA: Energy Information Administration
GHG: Greenhouse Gases
RPS: Renewable Portfolio Standard
ABSTRACT
The United States electrical utility industry is being called upon to reduce carbon
dioxide emissions from fossil fueled electricity-generating plants, which are responsible
for 40% of the nation’s carbon dioxide output (EPA, 2014). One response to this has been
the state-level adoption of Renewable Portfolio Standards (RPS)—policy tools that
require electrical utilities to generate a pre-determined fraction of their electricity from
renewable sources. Although 37 states having adopted RPS, a block of seven
Southeastern states have not, even though these states appear to have substantial
renewable energy technical resources. The question arising is: Why have these states not
adopted RPS? This thesis focuses on the state of Georgia and explores four potential
hypotheses to answer this question: 1) The collective experiences of the 37 adopter states
show that RPS are not causally linked to increased use of renewables; 2) Contrary to
beliefs, the renewable resources in Georgia are inadequate; 3) The inherent structure of
the electric utility system in Georgia is not hospitable to large scale use of renewable
energy; 4) Conservative politics in Georgia oppose the adoption of RPS. I found that the
primary reason Georgia has not adopted RPS is within the circumstances of hypothesis
#3 and Georgia’s commitment to expanding nuclear energy for electricity generation.
Additionally, I found that circumstantial evidence suggests that Hypothesis #4 is a likely
secondary explanation.

Metz3
INTRODUCTION
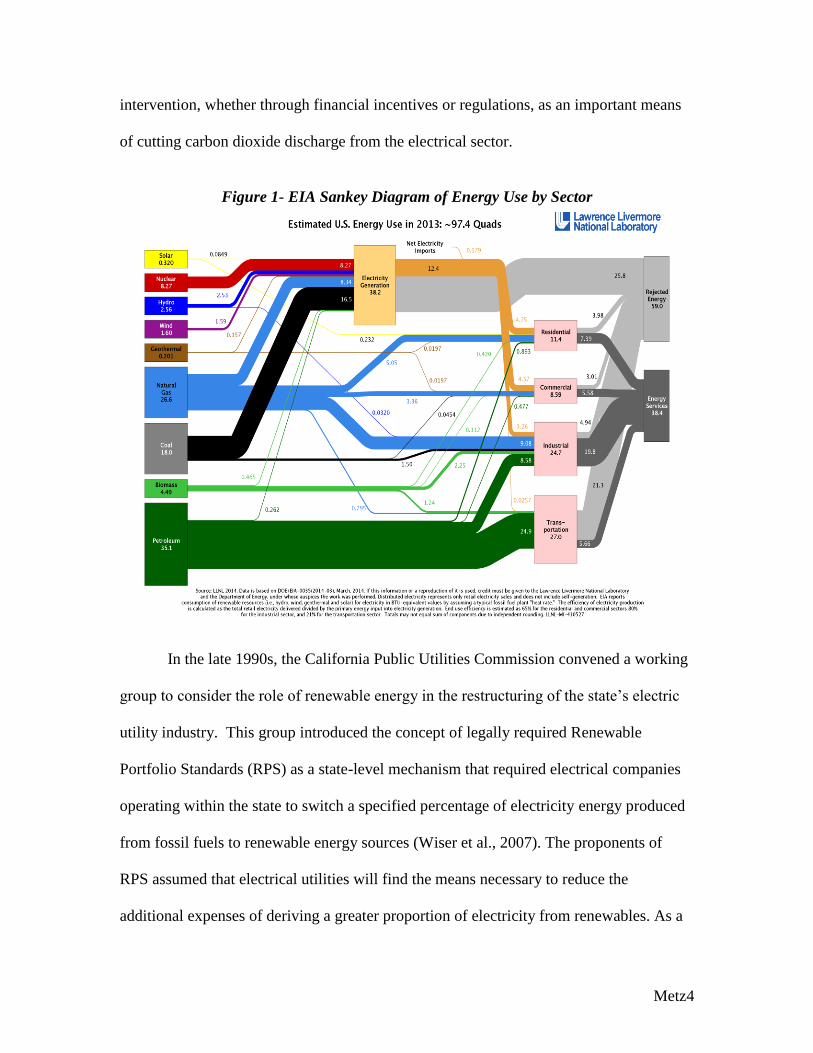
In 2013, the United States’ total primary energy consumption was approximately
97 Quads (quadrillion British Thermal Units), about 40% of which was used for the
purpose of generating electricity. From this sector, 43% came from the combustion of
coal and 20% from the combustion of natural gas (Figure 1). Electricity production from
coal and natural gas combustion account for about 30% and 10% respectively, of U.S.
total carbon dioxide emissions. (EIA Energy Annual Report, 2013). The heat-engines that
drive electrical generators are able to convert 32% of their combustion energy into the
mechanical work of electrical generation (Figure 1, designated “rejected energy.”). In
other words, about 68% of that combustion energy is lost as heat—an unavoidable
thermodynamic transaction cost of converting heat to mechanical work in a cyclic heat
engine. Considering carbon dioxide emissions and climate change, about two thirds of the
electric sector’s carbon dioxide emissions are therefore associated with waste heat.
Consequently, the electrical generation is a primary target for reducing dependence on
the combustion of fossil fuels (almost exclusively coal and natural gas).
One means of reducing carbon dioxide emissions is to replace the electricity
generated from coal and natural gas with “renewable” energy sources: some combination
of sunlight, wind, biomass, falling water (hydroelectricity), and geothermal heat.
Electricity generation from renewable energy sources has not been economically
competitive with that from well-established coal and natural gas fired power plants, and
as a result, electrical utilities have had little incentive to adopt such practices.
Consequently, advocates of expanded renewable energy production see government
Metz4
intervention, whether through financial incentives or regulations, as an important means
of cutting carbon dioxide discharge from the electrical sector.
Figure 1- EIA Sankey Diagram of Energy Use by Sector
In the late 1990s, the California Public Utilities Commission convened a working
group to consider the role of renewable energy in the restructuring of the state’s electric
utility industry. This group introduced the concept of legally required Renewable
Portfolio Standards (RPS) as a state-level mechanism that required electrical companies
operating within the state to switch a specified percentage of electricity energy produced
from fossil fuels to renewable energy sources (Wiser et al., 2007). The proponents of
RPS assumed that electrical utilities will find the means necessary to reduce the
additional expenses of deriving a greater proportion of electricity from renewables. As a

Metz5
result, RPS would ultimately catalyze the competitiveness of renewable energies through
a market-based, bottoms-up approach (Rabe, 2007). The California legislature enacted
RPS regulations in 2002, and subsequently other state governments created RPS
regulations predominantly through legislation, but also through regulatory channels and
voter-approved initiatives (Wiser et al., 2007). RPS emerged at the state-level, rather than
at the Federal level, because the legislatively delegated authority of the Federal Energy
Regulatory Commission (FERC) does not provide the scope to create and enforce a
nationwide RPS mandate. Such authorization requires Congress to pass a new law, an
event that renewable energy advocates generally see as unachievable.
Since the formulation of RPS in 2002 by the California legislature, 37 state
governments have established RPS. Therefore it is reasonable to assume that the
experiences of these 37 adopter states have established a body of information on the
environmental and social conditions and the political processes that catalyze adoption of
RPS. Currently state-level RPS are the most widespread state-level legislative approach
to encourage renewable energy sources for electricity generation. States develop their
own goals for carbon dioxide reduction, timeframe for implementation, and enforcement
mechanisms (Shrimali et al., 2012). Each state also determines what mixture of
renewable resources (wind, solar, etc) it will use.
THESIS RESEARCH QUESTION
A curious feature of RPS initiatives is their absence in the Southeastern region of
the U.S. (Figure 2). It is noteworthy because this area is commonly regarded as
“sunny”—their latitude range (below 25 degrees) is slightly south of the solar-energy hot

Metz6
spots in the Southwestern U.S.—and presumably has a similar degree of solar power
potential. Additionally, the Southeast has forestry and agriculture industries that could
produce biofuels, and at least superficially there are no reasons to assume that the wind
resources are not at a minimum as good as those of several of the 37 states with RPS. The
question then is: Why have the Southeastern states not adopted RPS if such rich
renewables potential exists? The following thesis examines this question through four
hypotheses that individually or in conjunction could answer it.
Figure 2- States with Renewable Portfolio Standards (2012)
THE FRAMEWORK OF RPS
Before attempting to answer this question, it is necessary to understand that RPS
are “local” constructions, and individual state governments, perhaps motivated by local
citizens’ advocacy groups, can choose whether or not to institute mandates. There are no
federal governance mechanisms for standardizing RPS among states, and consequently

Metz7
comparisons of the efficacy of RPS frameworks among states are subject to consideration
of local resource conditions and political structure. Some states that have adopted RPS
may base their goals upon delivered electrical energy (expressed as megawatt hours-
MWH), while others could base their goals on electrical generating power capacity
(expressed as megawatts-MW). The distinction between delivered electrical energy
(MWH) and power (MW) must be made because power (MW) is a metric for the
capacity to generate electrical energy (MWH). Delivered energy (MWH) is the metric for
how that capacity was actually used. Hypothetically, a utility could claim that 15% of its
capacity is from renewable energy, but if the utility doesn’t use that capacity it obviously
accomplishes nothing. Among the 37 states that have adopted RPS, the goals for the
fraction of total electrical energy generated (MWH) from renewables fall between 4%
and 30%, depending upon resource availability, electricity demand, and population
distribution. Additionally, some states’ goals reflect local secondary objectives. For
example, some states may see opportunities for “new jobs” associated with renewable
energy technologies (e.g. solar panels and wind turbines); others could perceive
opportunities to exploit federal fiscal stimulus packages. Others may see disincentives
because of the costs to taxpayers if their utilities were subsidized to implement RPS
goals, alongside the increased cost of electricity to end-users.
RPS are predominantly aimed at “large” central regulated electric utilities that
generate the majority of electrical energy within a state. States also may have municipally
owned generators and cooperatives that could constitute “special cases” in the RPS
context because they could fall outside of the state’s regulatory structure, depending on
the state. In terms of the large central utilities, however, there are conventionally three
Metz8
options for meeting RPS requirements. The first is by operating independent and
exclusively renewables-derived electrical generating facilities. The second is by
purchasing Renewable Energy Certificates (RECs) from qualified “green” energy
producers, who then allocate the right to the benefits achieved from their clean energy
back to the buyer. The third is the purchase of “bundled renewable electricity”, meaning a
group can buy energy directly from a solar, wind, biofuel/biomass, or geothermal facility
(EIA, 2014).
The emergence of RPS in California was initially the outcome of a political
experiment to reduce the environmental impacts of electricity generation while
simultaneously creating a healthy market for renewable technologies. Since the early
2000’s 37 states have now adopted RPS. Whether their adoption was the outcome of
activist groups or the initiatives of governance, it seems reasonable to conclude that these
states have determined that the RPS mechanism is a feasible method for increasing the
integration of renewable energy sources into the electricity system. The question then
arises, in view of the experiences of 37 states and their interest groups, why does a block
of the Southeastern U.S. not have RPS in place?
Narrowing the Research Scope
This thesis examines four hypotheses for explaining the absence of RPS.
1. Contrary to beliefs and assumptions, the experiences of the 37 adopter states show
that RPS do not result, in practice, in an increased use of renewable energy
sources for electrical generation. In other words, data among the 37 states may
demonstrate increased use of renewables, but the increase was the result of “some
other” mechanisms or conditions, which cannot irrefutably be credited to RPS.

Metz9
Thus, the Southeastern states may see no reason to adopt RPS if they do not prove
useful in the experience of the adopting states.
2. The Southeastern states, although they superficially appear to have abundant solar
and wind potential, do not have sufficient renewable energy resources to provide
the electrical generation necessary to support RPS.
3. The organizational and technical infrastructure of the Southeastern states’
electrical generation and distribution system makes RPS an impractical method
for achieving increased renewables-derived electricity.
4. The political and social attitudes of the Southeastern states reject the need for
renewable energy. Or, if they accept the need for renewable energy, they reject a
government mandate, such as RPS, as a means of promoting their expansion into
the electricity sector.
These four hypotheses are examined within the scope of Georgia as a case study, and
my findings ultimately conclude that the lack of RPS in Georgia is likely a combination
of the circumstances found within Hypotheses #3 and #4.
THE SOUTHEAST’S SIGNIFICANCE IN U.S. ENERGY
Before examining these hypotheses, a foundational question must be addressed:
Are the Southeastern states relevant for study in terms of their percentage of national
energy consumption and carbon dioxide emissions? This region first garnered particular
interest because of their RPS absence, seemingly ample renewables resource potential,
and nationwide impact in terms of size and emissions. Although Georgia will be
examined as a case study, it is worth putting Georgia into the context of a holistic view of

Metz10
the Southeast. This thesis, however, is not a comparative study of similarities and
differences among the Southeastern states.
According to the U.S. Census Bureau, the Southeastern states include the
following: Delaware, Florida, Georgia, Maryland, North Carolina, South Carolina,
Virginia, West Virginia, Alabama, Kentucky, Mississippi, and Tennessee. Only five of
the twelve above employ RPS mandates. Those that do not, and will thus be evaluated for
significance, are: Mississippi, Alabama, Florida, South Carolina, Tennessee, Kentucky,
and specific to this study, Georgia.
These seven states collectively account for 17% of the total U.S. population. Their
CO2 emissions from electricity production are summarized in the table below. Electricity
production in the 7 non-RPS Southeastern states collectively account for about 448/1984
= 25% of U.S. total electrical energy related CO2.
State Million metric Tons Carbon
Dioxide for Electric Power (U.S. total Electricity CO2 ~1984)
U.S. TOTAL CO2 ~ 5300
Electric Power’s Share of State
Carbon Dioxide Emissions
Alabama 74 57.5%
Florida 110 48.7%
Georgia 68 44.1%
Kentucky 94 63.4%
Mississippi 23 38.2%
South Carolina 38 48.7%
Tennessee 41 39.4%
Coal, the “dirtiest” of the fossil fuels, is the most heavily used energy source
within the electricity sector and is responsible for 43% of the U.S. total generation

Metz11
(Figure 1). Nationally, CO2 emissions from coal-fired electricity generation are about
1600 million metric tons, and the seven non-RPS states alone produce approximately
18% of these national coal emissions. In 2014, Florida, Alabama, and Georgia electrical
energy production was 19,000 MWH, 11,000 MWH, and 9000 MWH respectively,
ranking them nationally among states #2, #6, and #9, respectively in net electrical energy
generation. Collectively all seven of the Southeastern states lacking RPS produced about
20% of the nation’s net electricity in 2014 (EIA, 2014).
Another perspective on electrical energy consumption within the Southeast is
their per-capita electrical energy consumption, which is higher than national averages.
The EIA annually tabulates electrical energy retail sales and the number of customers
served by individual utilities. From these data, I plotted electrical energy sales as a
function of the number of customers for all the nation’s utilities (Graph 1). The slope of
the linear regression least squares best fit of electrical energy/customer estimates the
national average per-capita consumption, which is then found to be 20MWH/customer.
The highlighted utilities, Georgia Power, Alabama Power, and Florida Light and Power,
are chief generators for their respective states. The per-capita electrical energy sales of
these utilities are again considerably above the national average. This trend is likely the
result of the Southeast’s hot, humid climate, because seasonal air-conditioning requires
large amounts of electricity. By contrast, states with severe winters rely more heavily on
heating by natural gas than by electricity.
After gathering these data together, it can be seen that the non-RPS states are
collectively significant contributors to the total U.S. carbon dioxide emissions associated

Metz12
with electrical energy production. Therefore, an examination of why these states have not
adopted RPS is indeed a substantial piece in the nation’s energy accounting.
Graph 1- Electrical Companies # of Customers vs. Sales
Georgia as a Case Study
As the resources necessary for examining the absence of RPS in the entirety of the
Southeast are beyond the scope of this study, a single state will be researched as a
particular case study. These findings can then be used, at least foundationally, for future
research into the absence of RPS throughout the region. Georgia will be the focus of this
research for several reasons. Firstly, Georgia’s per capita electrical retail sales are
markedly higher than regional and national averages, suggesting they would benefit more
than others from RPS adoption (Graph 2). Georgia’s population (about 10 million) ranks
it 8th
among the states. Although Florida ranks 3rd
in population (20 million), its
geographical population distribution spans nearly 400 miles north to south, whereas the
population of Georgia is concentrated in the greater Atlanta area. The condensed Atlanta

Metz13
metropolitan area accounts for about 60% of Georgia’s population and the majority of
electricity will therefore be transmitted to Atlanta from nearby generating facilities,
meaning the larger corporations that would fall under RPS legislation.
Graph 2- Georgia’s Energy and Electrical Standing
As discussed in a later section, I discovered in the course of this study that
Georgia is unique within the Southeastern states in its recent investments into nuclear
power for its electricity generation. The use of nuclear energy is likely to achieve greater
carbon dioxide reductions than could be achieved by practical implementation of solar,
wind, and biofuels. In retrospect, the choice of Georgia as the focus for this study could
have been motivated by the nuclear story by itself.
The geographic, social, economic, and demographic characteristics among non-
RPS states are sufficiently diverse that the results of this focus on Georgia will likely not
be wholly applicable to all non-RPS states. The scope of my research is not wide enough
to fully delve into the intricacies of each state’s electrical production system, and I chose
to focus on Georgia. While not a comparative study among Southeastern states, the
following research will exploring the factors that may be plausible explanations for
Georgia’s lack of RPS. The findings taken from this state can later be used as an example
and template for future examinations of other non-RPS states in future studies.

Metz14
HYPOTHESIS #1- The Effectiveness of RPS
Have RPS proven effective at increasing the consumption of renewably derived
electricity among the 37 states that have adopted them? In principle, it is plausible that
the Georgia energy decision-making process, whether by state legislature or state
regulatory agencies, looked for and did not find evidence that RPS actually do increase
renewable energy use. Due to their variation in policy stringency, goals, and resource
capacity among states, the effectiveness of RPS is indeed hard to assess. As an additional
confounding variable, there is also a time lag of several years between adoption of RPS
and implementation of renewable energy technologies, and the existent RPS may not
have been in place for a long enough time that their value can be sufficiently judged.
In a study conducted by Shrimali et al. (2012), however, they have assessed
several econometric models designed to explore this question of RPS effectiveness in
achieving implementation of renewable energy sources. Their research removed the
confounding influence of outliers in previous experiments and tested the findings of those
publications. Shrimali et al found that no definitive conclusion could be made over the
effectiveness of RPS as a means to bring about an increase in the consumption of
electricity generated from renewable resources.
Noteworthy in Shrimali et al.’s research is the finding that “the presence of RPS
schemes in neighboring states apparently has a positive effect” (Shrimali et al., 2012).
Therefore RPS approval by one state may influence the adoption of renewables for
electrical generation by states in proximity. This occurs because, as one state increases
their development of renewable resource technologies, they create an atmosphere

Metz15
conducive to further investment throughout the surrounding area. Therefore, a larger
proportion of electricity regionally can be derived from renewables.
Their research also found that state income and wealth have a significant positive
correlation with investment into technology that generates “clean” electricity. The
outcome is logical, as states with stronger economies are better able to support
entrepreneurs and companies who accept the higher upfront costs of purchasing
renewable technologies and infrastructure. When evaluating the seven Southeastern non-
adopter states, their economic rankings are as follows:
Overall Rank State Income Rank GDP per Capita Rank
32 Georgia 32 37
38 Florida 37 46
41 Tennessee 44 38
46 Kentucky 47 44
48 South Carolina 45 49
49 Alabama 48 47
51 Mississippi 51 51
Each state falls within the lower half of the nation in terms of income and GDP ranking,
diminishing their capacities to invest in costly infrastructure and electrical grid changes.
Lastly, Shrimali et al. found that states with political atmospheres that previously
supported various environmental policies other than energy have significantly higher
levels of renewables-derived electricity development than those without. This final factor
may play a significant role in explaining the Southeast’s lack of RPS, as the political

Metz16
climate has been strongly conservative in recent history in environmental matters—a
point discussed beneath Hypothesis #4.
In summary, published econometric analyses of RPS are inconclusive in their
attempts to establish the effectiveness of RPS in achieving greater development of
renewable energy technologies and consequentially in mitigating carbon dioxide
emissions. The Schrimali et al study suggests, however, that as the 37 states continue to
follow their RPS mandates, they may have a future subtle influence in furthering the
adoption of renewable energies. We can conclude, therefore, that Hypothesis #1 cannot
be the reason for the absence of RPS, because there is no evidence that they are indeed
ineffective. Finding ambiguous results, RPS remain a plausible political tool for requiring
investment into renewable technologies. On the other hand, the ambiguous results can be
turned around to argue that since you can’t show they were effective, why take the risk of
conducting an expensive public experiment?
HYPOTHESIS #2: Georgia’s Renewable Resource Potential
A primary consideration in evaluating RPS is the solar, wind, and biomass
resources available in a state. National accounting of renewable energy includes
hydroelectric generation (Figure 1). Renewable sources are: solar (0.8 Q), hydro (2.53
Q), wind (1.6 Q), geothermal (0.16 Q), biomass (0.46 Q) for a total of 5.25 Q (Figure 1).
This list accounts for 13.7% of total U.S. primary energy used in electrical energy
generation. Yet very few states have any opportunities to further expand hydroelectric
capacities because there are no remaining sites. Thus nationally, renewable energy
excluding hydroelectricity currently accounts for about 6% of the U.S. total primary

Metz17
energy for electricity generation. Consequently, the assessment of RPS resources within
this study excludes hydroelectricity. In Georgia specifically, hydropower potential (rivers
on which dams can be built) is largely tapped out and the state obtains about 4% of its
electricity from renewable resources after excluding hydroelectricity.
Graph 3- Electrical Generation by Source
Estimating Georgia’s Renewable Resources
The following sections estimate the technical potential of “green” resources, not
their economic or political viability. RPS are aimed at replacing fossil-fuel energy, so the
estimate begins with determining the electrical energy currently produced by fossil fuels.
Important to emphasize however, is that RPS goals are expressed as a fraction of the
delivered electrical energy at retail, not the energy required to produce that electrical
energy. Phrased another way, most RPS are ultimately expressed as a fraction of the
state’s retail electrical energy sales.

Metz18
In 2014, Georgia’s retail electrical energy was 131 million MWH. About 4%
came from non-hydro renewables. Nuclear power plants generated about 23% (30 million
MWH). (Nuclear power in Georgia is examined in detail in a later section in the context
of its importance for RPS adoption.) Thus the “target” for RPS in Georgia, excluding
nuclear because it cannot be considered either a renewable or fossil fuel, is about 100
million MWH derived from electricity now generated by coal or natural gas and to be
replaced by renewables.
Suppose that we aimed for a future goal of 15% from renewables, in line with
many state’s RPS. Following this, we seek to generate 15 million MWH from renewable
resources. I will estimate the requirements for solar, wind, and biomass, individually and
ask, what is required if one source alone had to produce 15 million MWH. After running
the initial calculations, I found that the problem of generating clean energy for an RPS
evolves into a land-use and space problem.
Solar Power in Georgia
The estimate for “solar” is based on current technology available for silicon solar
panels (photovoltaic effect.) The calculation proceeds as follows. I used National
Renewable Energy measurements for the solar power (watts)/square meter incident at an
appropriately oriented surface, averaged over 24 hours, and over a year. The average
power multiplied by 24 hours yields the energy collected in 24 hours. The NREL data are
expressed as (kilowatt hours)/(square meter of solar panel area) in 24 hours. About half
of the incident solar energy cannot be converted to electrical energy either because its
energy is less than the band-gap of silicon or its energy is in the range where fundamental
physical limitations inherent in the photoelectric effect limit the conversion efficiency
Metz19
(NREL, 2015). As is conventional in the solar panel industry, we assume that about 10%
of the potentially effective solar energy can ultimately be converted to electrical energy
by practical devices in the field.
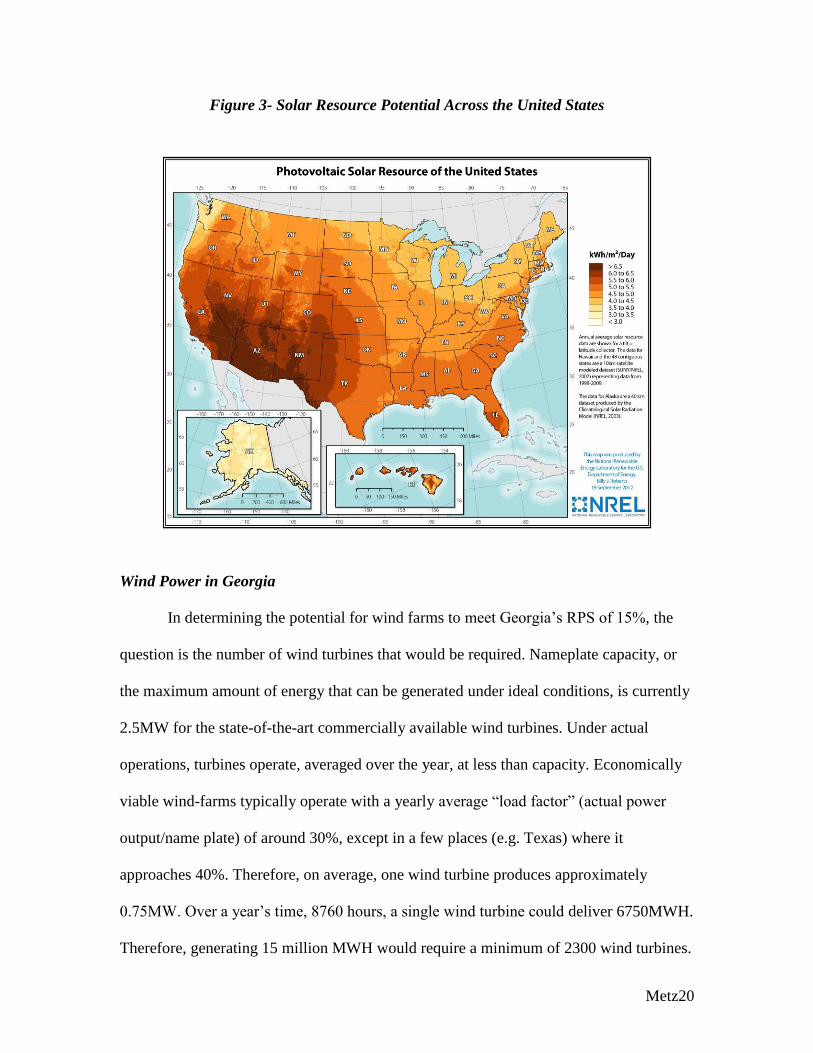
NREL data (Figure 3) show Georgia’s photovoltaic resources to be in the range
of 5 to 5.5 kwH/m2 /24 Hour day. As described in the above paragraph, about half the
energy fulfills the conditions for generation of photocurrent, and the efficiency of that
latter conversion is about 10%. Thus solar panels can produce about 0.50 to 0.55
kwh/m2/day. In terms of a 15% RPS the question becomes how much land area would be
needed for a utility-scale solar farm to supply the 15 million MW?
In one year, on average, solar panels would deliver about .0055 MWH/day/m2 of
electrical energy, which corresponds to about 0.182 MWH/m2 in 1 year. Thus, 15 million
MWH annual electrical energy, divided by the 0.182 MWH/m2, the annual electrical
energy produced by 1 square meter of solar panel, yields 82 million m2
of solar-panel
area.
As a means of getting an intuitive sense for 82 million square meters of solar
panel, assume that the main customer for this electrical energy is Atlanta. The land area
of the Atlanta Statistical Metropolitan area (population 6 million in 39 counties) is 27,000
km2 (27 x 10
9 m
2) (U.S. Census Bureau, 2015). Thus a solar farm with panel area of 82
million square meters would occupy about 0.3% of Atlanta metropolitan land area (82 x
106 /27 x 10
9 = 0.003 = 0.3%). When put into practice the land area occupied by utility
scale solar farms is about double that of the solar-panel area (NREL, 2015). So a utility
scale solar farm would require 0.6%, or rounded up, 1% of the metropolitan Atlanta land
area.
Metz20
Figure 3- Solar Resource Potential Across the United States
Wind Power in Georgia
In determining the potential for wind farms to meet Georgia’s RPS of 15%, the
question is the number of wind turbines that would be required. Nameplate capacity, or
the maximum amount of energy that can be generated under ideal conditions, is currently
2.5MW for the state-of-the-art commercially available wind turbines. Under actual
operations, turbines operate, averaged over the year, at less than capacity. Economically
viable wind-farms typically operate with a yearly average “load factor” (actual power
output/name plate) of around 30%, except in a few places (e.g. Texas) where it
approaches 40%. Therefore, on average, one wind turbine produces approximately
0.75MW. Over a year’s time, 8760 hours, a single wind turbine could deliver 6750MWH.
Therefore, generating 15 million MWH would require a minimum of 2300 wind turbines.

Metz21
The land area required for an on-shore wind turbine ranges from 25-100 acres per
turbine, which includes the necessary infrastructure like roads, service areas, etc. (NREL,
2015). Current best technology is 100-meter diameter rotor (propeller) and generator
assembly mounted on a 100-meter tower. Wind turbine placement depends on the
geometric configuration (lines versus grid)—in grid configurations, about 100 turbine
blade diameters spacing is necessary to avoid wind-flow interference between turbines.
Assuming a fairly uniform terrain, at 50 acres per turbine, 2300 turbines x 50 acres=
115,000 acres. This 115,000/3,800,000 acres, is equal to 3.73% of Georgia’s total land
area.
Returning to the NREL data, the onshore wind potential energy is 323,000 MWH.
Applying the hypothetical RPS standard of 15%, onshore wind has the potential to
generate about 2% of the 15 million MWH. The above onshore wind data, however, was
limited to areas with an annual gross capacity factor of 30% or greater from average
utility scale wind turbines at 80-meter heights. Offshore wind measurements were made
at heights of 90-meters and within 50 nautical miles of the U.S. coastline. Including these
offshore wind sources greatly increases wind power’s potential, swelling to 220,807,000
MWH. Cumulatively, a combination of onshore and offshore wind turbines could
generate 221,130,000 MWH. Meeting the RPS standard would require 14.72% of this
total energy, therefore not even the full technical potential of wind power would need to
be utilized to achieve a modest RPS.
Offshore Wind Onshore Wind
GA’s potential 220,807,000 MWH 323,000 MWH

Metz22
BioMass in Georgia
Biomass, plant-based organic materials, can be used to obtain energy either
directly (by burning it) or indirectly (by converting it to a liquid or gaseous fuel).
Combustible wood and grass biomass are essentially cellulose/lignocellulose, the
standard enthalpy of combustion (about 15 kjoule/gram) of which is about 60% that of
high-grade coal. As a direct energy source it is combusted to generate heat. Indirectly,
biomass is converted to biofuel chemically, thermally, or biochemically (for example,
ethanol via fermentation, methane via anaerobic digestion). Deriving the greatest amount
of energy possible from biomass therefore requires a fast growing, cultivatable dried
plant to substitute for coal or natural gas. Subsequently, the question is: How much land
area will be required to grow enough of a biofuel to generate 15 million MWH?
This study will investigate switchgrass, a common contemporary biofuel. To keep
costs low, switchgrass farming would minimize expensive synthetic fertilizers, and
natural rain will assumedly be sufficient hydration. Switchgrass’ yield, measured under
controlled study conditions, ranges from 3-10 tons of drymass/acre depending on where it
is grown. For purposes of estimating in this thesis, we use an average yield of 5 tons of
drymass/acre (Vogel et al., 2002). This converts to 4500kg/acre. Complete combustion of
switchgrass produces about 15 megajoules/kg. Therefore, 4500kg/acre x 15MJ/kg=
67500 megajoules/acre. Since 1-kilowatt hour is the equivalent of 3.6 megajoules,
therefore, 67500 megajoules x KWH/3.6mJ/acre= 18,750 KWH/acre = 18.75 MWH per
acre of land. Using conventional thermal electrical generation, roughly 30% of the
combustion energy can be converted into usable electrical energy. Therefore, the
effective electrical energy is approximately 6 MWH per acre. Achieving 15 million

Metz23
MWH of electrical energy (15% of the total Georgia production) by biomass alone would
demand 2,500,000 acres of switchgrass. Singularly, this entails 2,500,000/38,000,000
acres, or 6.57% of Georgia. It must be noted however, that this figure does not account
for energy loss during harvesting the biomass, processing/drying it, and shipping it to the
generator.
The NREL chart below further illustrates the higher efficiency of utilizing a solid
biopower, like switchgrass, over a gaseous biopower. Referencing both the below NREL
data as well as the above calculation, it would take from 2-2.5 million acres to generate
15 million MWH. These calculations suggest that biopower should not be used as the
sole renewable resource, but instead to augment other fuels when the land and farming
prerequisites are available.
BioPower- Solid BioPower- Gaseous
GA’s potential 14,682 GWh 2,221 GWh
Hydropower in Georgia
Hydropower as a renewable resource in the scope of this study will be excluded
for the following reasons: 1) Hydropower has largely been utilized to its utmost extent
and offers little increased potential in the future, and there is a lack of opportunity for
future growth along the coast. 2) Many hydropower facilities are being closed due to
outdated equipment and inefficiency. 3) The economic costs required to update Georgia’s
existing hydropower facilities are high, discouraging further development.

Metz24
Total Renewable Energy Analysis for Georgia
Cumulatively, by combining the energy that could be obtained through solar and
wind’s nameplate capacities, Georgia could generate 15 million MWH by constructing
farms for these renewables on about 4% of the state’s land area. The greatest hindrances
to achieving the renewables-derived electricity necessary for RPS are therefore the
economic expenses and land-use complications. The cost of building and maintaining a
utility-scale solar farm for large-scale generation would be in the billions. A single wind
turbine costs anywhere from $1-3 million, and a few thousand would entail an investment
of several billion. Offshore wind however, is likely to be more expensive and is largely
underdeveloped throughout the U.S. The strategy for applying wind power for an RPS
would therefore need to consider the energy and fiscal tradeoff between investing in
onshore versus offshore wind turbines.
While large tracts of land would be necessary to achieve a 15% reduction in fossil
fuel generated electricity, it is unclear if this has been an operational disincentive for RPS
in Georgia. I was unable to find any publically available document that invoked land-
requirements as a deterrent. It may be the case that consideration of RPS in Georgia never
reached a stage of political consideration where land-requirements were brought to
attention.
My analysis shows that the development of renewables-derived electricity would
require a high upfront investment, but Georgia does indeed possesses the technical
capacity to generate substantial proportions of clean electricity by the integration of
various resources. However, it must again be noted that resource potential is not the same
as the resource itself. Conversion rates, technological efficiency, differences in

Metz25
geography and resource quality must be assessed. Even after noting these variables
however, an RPS goal could be achieved through a mixture of solar panels, switchgrass
combustion, and offshore wind power. Acknowledging realistic constraints, these three
sources in particular could provide Georgia with a substantial proportion of its electricity
consumption demands.
HYPOTHESIS #3: Structure of Georgia Electrical System Today
Georgia Power, a wholly owned subsidiary of Southern Company, supplies
approximately 62% of Georgia’s electricity, with the majority of their customers residing
in the Atlanta area (GAPower, 2015). The rest of Georgia’s electricity is generated by 40
cooperatives and 29 municipals, disseminated throughout rural Georgia. The retail energy
sold and the number of customers of these cooperatives and municipals span a wide
range. Cooperatives play a larger role than municipals in the state, quadrupling them in
the amount of retail energy sold. Furthermore, these cooperatives and municipal suppliers
can either generate their own electricity, or purchase it from larger generating
corporations. It is worth noting again that the ensuing research examines Georgia’s
electrical layout alone, and detailed comparisons to the situations in other states will
require further study to determine common explanatory variables throughout the
Southeast.
The Role of Cooperatives and Municipalities
A challenge to implementing RPS would be the role of regulation over small-
scale utilities. How could they be ordered to obtain a percentage of their electrical
generation from renewable resources if they have neither the storage capacity nor

Metz26
financial ability to invest in solar, wind, or biomass technology? Yet, they generate
electricity for 1/3 of the customers throughout Georgia.
Graph 4- Georgia’s Electric Utilities Ranking
The above graph demonstrates that a large number of smaller generating
companies exist throughout the state, electricity generating companies completely
separate from Georgia Power. It is difficult to envision an RPS mechanism that would
equitably bring the cooperatives and municipals under the same regulation imposed on a
corporation like Georgia Power. In all likelihood these smaller generating facilities would
then not be regulated by RPS legislation, a situation probably not unique to Georgia’s
electrical layout. If administration was attempted, however, there are several routes for
bringing these groups under an RPS mechanism. Georgia’s state government could
provide fiscal packages to help shoulder a proportion of the upfront cost of developing
renewable technologies, easing the challenge of transforming their current methods of

Metz27
electrical generation. These fiscal incentives would require the reapportionment of
existing tax revenues, making the passing of such legislation perhaps politically
unfeasible. In the context of this thesis, the structure of Georgia’s electrical industries
may present the barriers that would make such policies, which would ultimately support
RPS, politically insurmountable. Additionally, as cooperatives and municipalities already
often purchase electricity from larger corporations and then distribute it to their
customers, an RPS could require them to only purchase electricity generated from clean
sources, instead of obliging them to generate it independently. Lastly, where several
cooperatives are concentrated in certain regions, they could be held collectively
responsible for generating a pre-determined percentage of clean electricity (Figure 4).
Some companies generating more clean energy than others could also sell their rights to
those generating solely through fossil fuels. Therefore a small-scale exchange system
could arise, facilitated by permits and an overall reduction objective.
Neglecting to regulate cooperatives and municipalities by RPS would place a
larger burden upon Georgia Power to generate clean energy. Georgia Power would then
almost undoubtedly reject RPS, and because they have a larger political clout than the
smaller companies, the legislative likelihood of such an environmental mandate passing
would diminish.

Metz28
Figure 4- Distribution of Georgia Electrical Suppliers
Nuclear Power Development in Georgia
The potential influence of nuclear power was discovered in the course of this
research, and emerged as a potential explanation for the absence of RPS in Georgia. The
nuclear-powered electricity generation process produces no greenhouse gas emissions

Metz29
and accounts for about 20% of the primary energy used for electricity generation in the
U.S. (Figure 1). Although nuclear energy is “clean” in the sense of carbon dioxide
emissions, it is not classified as renewable because uranium and other fissionable
elements suitable for fueling electricity generation are in the long term not renewable,
and nuclear fission also produces long-lived radioactive waste. Despite this, Georgia
Power is currently in progress to open two nuclear power plants in 2017, Vogtle units 3
and 4 that will each add 1700 MW (nameplate capacity). Thus the two plants together
will have the capacity to generate about 30 million MWH (each plant: 1700 MW x 8760
H/year = 15 million MWH annually); a typical annualized load factor of 80%
(combination of season fluctuations in demand and necessary operating down-time) will
yield about 25 million MWH of “new” power—10 MWH more than would be legally
required for a 15% RPS.
The new generators will be jointly owned by four Georgia-based electrical
companies- Georgia Power (45.7%), Oglethorpe Power Corporation (30%), Municipal
Electric Authority of Georgia (22.7%), and Dalton Utilities (1.6%) (GAPower, 2015).
Oglethorpe Power’s co-ownership, as they are already an Atlanta-based supplier,
suggests that a large proportion of the newly generated electricity will be transmitted to
the metro-Atlanta area. Oglethorpe Power’s role as a “supplier” simply means they
distribute electricity to their customers that was generated elsewhere. A generating
company by contrast, produces electrical energy itself. Construction of Vogtle 3 and 4 is
being overseen by Southern Nuclear, which in turn is owned by Southern Company, the
holding company that also owns Georgia Power. Southern Nuclear has previously been
responsible for six nuclear units in co-operation with both Georgia Power and Alabama

Metz30
Power. Theoretically then, the newly generated electrical energy could be sold among
various subsidiaries of Southern Company, although transmissions would likely be
limited predominantly to Alabama and Georgia.
Nuclear Power, Georgia Power, and Southern Company
Southern Company has an established history of nuclear generation, and through
its subsidiaries meets 16% of its total electrical generation demands for all states from
nuclear power plants. Within Georgia alone, Southern Company operates all four of
Georgia’s nuclear facilities, two of which, Hatch and the original Vogtle, collectively
provide about 20% of Georgia’s electrical energy demand. Beyond these and the two new
Vogtle constructions, however, there are three main facilities currently in operation,
housing six nuclear reactors total. These are the Alvin W. Vogtle Electric Generating
Plant, the Edwin I. Hatch Nuclear Plant, and the Joseph M. Farley Nuclear Plant.
Vogtle and Hatch cumulatively produce nearly 20% of Georgia Power’s
electricity already, and with the supplements of Vogtle 3 and 4, Southern Company
declares that future prospects will be even higher. This vision of zero emissions, coupled
with increased generation potential, could specifically appeal to Georgia Power and
Southern Company after receiving backlash from their ranking as one of the top carbon
dioxide emitters in the U.S. in recent years (CGD, 2007).
Considering their heavy investment into nuclear power, the imposition of an RPS
would be unacceptable to Georgia Power. Increased nuclear energy generation, as it is
not a fossil fuel, would mean that a smaller percentage of the state’s electricity is being
produced by fossil fuels, and the proportion of energy sources able to be targeted for a
transition to renewables would decrease. This increases the challenge to achieving a RPS,
Metz31
as there is a smaller percentage of energy sources to change to renewables. Particularly
with the construction of Vogtle 3 and 4, and their venture into developing existing
nuclear technology, Georgia Power and the overarching Southern Company have no
incentive to accept or encourage RPS. Once the two plants are functioning, the carbon
footprint for Georgia Power’s electricity generation will be reduced to the extent that the
need for more expensive alternatives, such as renewables and RPS, will be negated.
HYPOTHESIS #4: A Hindering Political Atmosphere in Georgia
Georgia’s Political Background
The Republican Party has managed Georgia’s government in recent years,
apparent in GOP Governor Nathan Deal, and his entirely Republican board of elected
officials. Acknowledging this political atmosphere, it must be noted that it is the
Democratic Party that is usually more favorable than the GOP toward passing
environmental legislation. Furthermore, when settings are different and the Democratic
Party dominates a state’s politics, their influence is found to be a key explanatory
variable in RPS adoption (Lyon and Yin, 2010). Demonstrating some flexibility to this
pattern however, there are historically Republican and conservative states that have
nonetheless successfully passed RPS, such as Texas, Kansas, Utah, and the Dakotas
(Figure 2). Therefore, although a strong GOP presence in a state may increase the
political challenges to implementing an RPS, it is still very possible.
Gathering the political will to pass ambitious legislation, like RPS, often requires
the presence of political actors deeply motivated by their personal beliefs. Without
political activists, working groups, or state legislatures promoting RPS, like those found
Metz32
in the 37 adopter states, the likelihood of such legislation arising is small. If there has not
been a political entrepreneur emphasizing RPS in Georgia, this deficiency could be a key
factor in explaining its absence. Or if a political entrepreneur in Georgia exists, perhaps
his/her efforts are currently insufficient to garner the political will necessary to pass an
RPS through the state’s predominantly Republican legislature. Therefore, is it simply a
lack of powerful pro-RPS politicians in Georgia or is there a mentality of opposition
throughout the state that blocks RPS adoption? The final hypothesis will delve more
deeply into this inquiry.
Southern Company Background
As previously mentioned, Southern Company is a holding company that owns
Georgia Power. Southern Company is currently the 16th
largest utility company in the
world, and the 4th
largest in the U.S. In the 2007 report released by the Center for Global
Development, Southern Company was judged the largest GHG emitter in the U.S. utility
industry, with 172 million tons of carbon dioxide equivalent gases emitted annually
(CGD, 2007). By 2013, this number was reduced to 100 million tons of carbon dioxide
(Carbon Disclosure Report, 2014).
As a whole, Southern Company has largely been moving to displace coal
generation by natural gas since 1990. Their overall reduction of carbon dioxide emissions
has occurred through both this transition to natural gas-fired plants and the lower
electrical generation rates that followed the country’s economic downturn in 2008
(SouthernCompany, 2015). Adding further increases to their clean energy production,
Georgia Power voluntarily adopted an Advanced Solar Initiative (GPASI) in 2012, a
purchase program that contracted the company to obtain an additional 210MW from solar

Metz33
by 2014. Then, in 2013, after approval by the Georgia Public Service Commission, the
GPASI added another 525MW of solar power to the earlier commitment (GeorgiaPower,
2015). The electricity produced by this solar generation however, is insignificant on the
scale of statewide electricity demand, and may be more of a political statement than a
genuine push for renewables-derived energy. If Georgia Power were indeed serious about
pursuing cleaner energy and initiatives, why would it not encourage the acceptance of an
RPS?
The lack of RPS in Georgia, and perhaps in several other Southeastern states, can
potentially be traced back to Southern Company, as they are the parent holding company
that would be most heavily impacted by RPS implementation. This corporation is the
owner of four subsidiary companies: Georgia Power, Alabama Power Company, Gulf
Power Company, and Mississippi Power Company. These vertically integrated utilities
are responsible for electricity generation in Florida, Mississippi, Georgia, and Alabama,
which are four of the states lacking RPS (SouthernCompany, 2015).
Company # Of
Customers*
Southern Company Total
Electrical Retail Sales (MWH)
2014
Georgia Power 2,396,537 84,700,000
Alabama Power 1,444,809 58,637,410
Gulf Power 439,783 2,333,984
Mississippi Power 186,490 1,4592,000
Southern Company (Total) ~4,400,000 183,400,000

Metz34
* The number of customers is the number of electrical meters; meaning, the number of monthly
bills sent out by the utility. For example, a household of one person would have one meter, as would an
apartment building housing an indeterminate number of people.
These data illustrate the significance of Southern Company in their range of
electrical generation throughout the Southeast. Although the focus of this research is on
Georgia as a case study, Southern Company’s role in other states is discussed to
demonstrate the span of their influence.
Georgia Power’s Political History
Georgia Power reflects the state’s partisan standing and appears to be guided by
political preferences that incentivize investments into nuclear power development over
renewables. The Democratic and liberal agenda has consistently been more favorable
towards environmentally beneficial policy, such as RPS, while the conservative GOP has
prioritized economic security. Evidence supporting this political trend, in recent election
years, Georgia Power has made significant contributions to the Republican Party of
Georgia, and comparatively small contributions to the Democratic Party. While there
indeed have been conservative GOP states that nonetheless have adopted RPS, these
states are the exception to this political trend. The question then becomes what political
roadblock exists in Georgia to prevent their acceptance, or what assistance was present in
conservative states that facilitated RPS adoption despite counterintuitive partisan
interests?
Georgia’s Transparency and Campaign Finance Commission publish all political
contributions, including those donations made by corporations. In a report detailing 304
political contributions made by Georgia Power, there were twenty-nine donations to

Metz35
partisan groups. Of these twenty-nine, twenty-six were received by various Republican
groups, while three went to the Democratic Party of Georgia.
Georgia Power has given cash gifts to numerous Republican affiliates, markedly
the Georgia Republican Party, the Henry County Republican Party, Georgia House
Republican Trust, Inc., Georgia Republican Senatorial Trust, and the Georgia Republican
Senatorial Committee. In contrast, the three donations received since 2006 by the
Democratic Party in Georgia went solely to the Democratic Party. Roughly $181,430 was
contributed to the Georgia Republican Party, while only $20,000 was given to the
Georgia Democratic Party (Georgia.gov, 2015). Although it may be expected that utilities
would inherently support the more fiscally conservative political party, the degree to
which Georgia Power appears to be favoring the Republican Party is noteworthy and
could perhaps hint at an alliance or regulatory capture between the two. While other
GOP-leaning states have passed RPS, either through advocacy groups or other legislative
pathways, the extent to which Georgia’s companies have been evidenced to support their
GOP affiliates could effectively hinder possible enactment. Energy corporations like
Georgia Power, motivated to preserve the status quo of electrical generation and
distribution, may support conservative political parties as a method of preventing the
deregulation of electrical utilities. The initial creation and adoption of RPS in California
after all, did not occur until the deregulation of the state’s electric utilities in 1998
(Ca.gov, 2015).
Political Leanings of The Southern Company and Georgia Power
As the largest subsidiary of Southern Company, and the producer of the majority
of Georgia’s electricity (62%), Georgia Power’s apparent alignment with the Republican

Metz36
Party could effectively hinder legislative approval for RPS in the state. A significant
advocate against RPS and clean energy standards is the American Legislative Exchange
Council (ALEC). The group has claimed that RPS adoption results in negative economic
and environmental externalities. Their argument stems from the belief that corporations
and utilities are not driven to purchase higher than necessary proportions of clean energy
once RPS has been adopted (ALEC.org, 2014). Furthermore, ALEC is a strong supporter
and benefactor of nuclear power facilities through their lobbying effort Nuclear Matters.
Interestingly, a supporting member of ALEC is Southern Company (Energy&Policy,
2015). Therefore, although Southern Company’s relationship with Georgia’s Republican
Party remains speculative, their connection with pro-nuclear and anti-RPS affiliates is
not.
Returning to Nuclear Power
Significant in this research, nuclear energy today is often considered a right-wing
platform, according to the American Nuclear Society (ANS, 2012). Typically,
environmental groups oppose the creation of nuclear facilities and their radioactive waste.
Nuclear power can still be appealing, however, because of its freedom from the pressures
and variability of the international energy market. The development of nuclear power
therefore offers a reliable source of income and security to Georgia Power. As the
Republican Party, as aforementioned, is generally the partisan group more likely to
support nuclear power, their likelihood of pursuing nuclear energy as a means of
achieving energy stability is higher than that of the Democratic Party.
In a strictly structural sense, nuclear plants have infrastructure costs comparable
to those of fossil-fueled generating facilities, posing no exorbitant costs post-

Metz37
construction. However, after including regulatory expenses and the construction
requirements to handle long-term radiation exposure, the upfront expenditures of creating
a nuclear facility are 10x greater than that of a conventional thermal plant. But once in
place and operating, nuclear power plants are cheaper to operate than conventional
thermal plants. Moreover, if at some future date, conventional thermal plants will by
Federal regulation be required to capture and sequester carbon dioxide, the nuclear plants
will likely have a very large, operational cost advantage over thermal plants.
Investors bear the burden of the “carrying cost”, or upfront capital that cannot be
returned until revenue is generated. Here is where supporters like ALEC can be pivotal,
providing initial investments for struggling nuclear facilities. If the political and fiscal
expenses incurred by the nuclear power plant siting process could be reduced, or the
process of creating a new facility expedited, the construction of a new nuclear utility
could feasibly be economically competitive with fossil fuel generating facilities. As the
GOP agenda is typically more concerned with securing financial stability over
environmental health, this could be an enticement to transition to nuclear power over the
more costly wind and solar farms (ANS, 2012).
CONCLUSION
Renewable Portfolio Standards have become a key state-level policy tool aimed at
mitigating carbon dioxide emissions and legislating a transition to the use of renewable
resources for electrical generation. As this tool has been implemented in 37 states across
the nation, their potential significance cannot be ignored. Yet, as Shrimali et al. found
(Hypothesis #1), studies have been unable to demonstrate that RPS adoption has caused

Metz38
an increased use of renewables or reduced the consumption of fossil fuels. These studies
are, however, complicated by outlying variables and the short history of implemented
RPS. Incidental to the direct impacts of RPS, Schrimali et al. found that network effects,
a state’s economic strength and previous political atmosphere are also explanatory in the
implementation of renewable energies as a whole. Consequentially, RPS cannot be
discounted as a means for reducing carbon dioxide emissions and both adapting to and
mitigating climate change.
Technically, although limited economically, there are sufficient environmental
resources available to meet Georgia’s electricity demands via renewables (Hypothesis
#2). Adopting a modest RPS, a 15% reduction goal, is therefore a viable possibility and
not the reason for RPS’s deficiency. Upon delving into the prerequisites for these
resources to provide 15 million MWH, the question of an RPS quickly evolves into a
question of land availability. Even accounting for this, the results showed the potential of
both wind power and solar power, augmented by biomass in the form of switchgrass, to
support at least a 15% RPS mandate.
Georgia’s current electrical organizational and technical structures reflect the
conflicting reappearance of nuclear utilities (Hypothesis #3). Nuclear power, particularly
the creation of Vogtle plants 3 and 4 by Georgia Power, offers an alternative option to
RPS toward achieving the specific goal of reducing carbon dioxide emissions. The
corporation can produce their necessary electricity to meet consumer demand, 81 million
MWH, and supplement it with their previous generation methods without requiring vast
tracts of land. By focusing efforts on this means of generation, Georgia Power, and by
association Southern Company, are able to lower emissions and gain the commercial

Metz39
label of being “green” and innovative without incurring the high upfront costs of
renewables infrastructure, or placing themselves within political constraints.
As Georgia Power’s focus has been to invest in nuclear energy, and their political
inclinations have been dominated by a conservative Republican ideology in recent
history, the adoption of RPS appears unlikely (Hypothesis #4). Hindered not simply by
the lack of a political entrepreneur advocating for RPS, but by the dominance of a
political party that stereotypically opposes environmental legislation, this state policy tool
has little political foundation upon which to build support in Georgia.
Based upon the findings of this research, the absence of a RPS in Georgia appears
to be predominantly the accumulation of factors examined within Hypotheses #3 and #4:
Georgia’s investment into nuclear power, coupled with a political atmosphere that would
deter the success of passing environmental legislation, supplemented by Georgia Power
and Southern Company’s control in generating and transmitting electrical energy
throughout the Southeast. Although RPS still have the potential to be adopted throughout
the Southeast in the future, political, economic, and environmental hurdles will need to be
overcome before the likelihood of proposal and implementation make them a feasible
political tool for addressing the dangers of climate change and carbon dioxide emissions.
Metz40
WORKS REFERENCED "Annual Energy Review." US Energy Information Administration. Independent Statistics
and Analysis, Oct. 2014. Web. Dec. 2014.
Bernardo, Richie. "2014′s Richest and Poorest States." Wallet Hub. WalletHub, Jan.
2015. Web. 11 Feb. 2015.
Carbon Disclosure Report. Rep. Southern Company, 2014. Web.
http://www.southerncompany.com/what-
doing/pdf/Carbon_Disclosure_Report.pdf
United States of America. California Energy Commission. Renewable Energy Program.
California Renewable Energy Overview and Programs. N.p.: California Energy
Commission, 2015. Ca.gov. Web. 31 Mar. 2015.
http://www.energy.ca.gov/renewables/
"CGD Ranks CO2 Emissions from Power Plants Worldwide." Center for Global
Development (2007): n. pag. EurekAlert. Web. Nov. 2014.
http://www.eurekalert.org/pub_releases/2007-11/cfgd-crc111207.php
Dunlap, Riley E. and McCright, Araon M.(2008) 'A Widening Gap: Republican and
Democratic Views on Climate Change', Environment: Science and Policy for
Sustainable Development, 50: 5, 26-35
http://dx.doi.org/10.3200/ENVT.50.5.26-35
Georgia's Electric Membership Corporations. N.p.: Georgia's Electric Membership
Corporations, n.d. Opc.com. Oglethorpe Power, 2007. Web. 2015.
http://www.opc.com/oracle_cons/groups/public/@opc-
web/documents/webcontent/ct_000345.pdf
Georgia Power Company. (2012).Annual Report. Retrieved from
http://www.georgiapower.com/docs/about-us/2012-Annual-Report.pdf
Hopf, Jim. "The Party Platforms on Energy–and Nuclear." ANS Nuclear Cafe. American Nuclear
Society, 18 Sept. 2012. Web. 31 Mar. 2015.
http://ansnuclearcafe.org/2012/09/18/the-party-platforms-on-energy-and-nuclear/
"Overview." Georgia Power Company Home. A Southern Company, n.d. Web. 26 Feb.
2015. http://www.georgiapower.com/
Kasper, Matt. "ALEC’s Anti-Renewable Energy Agenda - July 2014."Energy and Policy
Institute (2014): n. pag. Energy and Policy Institute. Web. Jan. 2015.
http://www.energyandpolicy.org/alec_s_attack_on_clean_energy
Lyon, Thomas P., and Haitao Yin. "Why Do States Adopt Renewable Portfolio
Standards?: An Empirical Investigation." The Energy Journal31.3 (2010): 131-
56. IAEE. Web. 2 Feb. 2015

Metz41
Rabe, Barry. "Race to the Top: The Expanding Role of U.S State Renewable Portfolio
Standards." Sustainable Development Law & Policy, Spring 2007, 10-16, 72.
Renewable Portfolio Standards." ALEC. American Legislative Exchange Council, Oct.
2013. Web. Jan. 2015. <Kasper, Matt. "ALEC’s Anti-Renewable Energy Agenda
- July 2014." Energy and Policy Institute (2014): n. pag. Energy and Policy
Institute. Web. Jan. 2015>
Ryerson, T. B. "Observations of Ozone Formation in Power Plant Plumes and
Implications for Ozone Control Strategies." Science 292.5517 (2001): 719-
23. MITei. MIT Energy Initiative. Web. Jan. 2015.
Shrimali, Gireesh and Jenner, Steffen and Groba, Felix and Chan, Gabriel and Indvik,
Joe, Have State Renewable Portfolio Standards Really Worked? Synthesizing Past
Policy Assessments to Build an Integrated Econometric Analysis of RPS
effectiveness in the U.S. (October 25, 2012). USAEE Working Paper No. 12-099;
DIW Berlin Discussion Paper No. 1258.
Southern Company. N.p.: Southern, n.d. Plant Vogtle Units 3 and 4. Southern Company,
2012. Web. http://www.southerncompany.com/what-doing/energy-
innovation/nuclear-energy/pdfs/vogtle-nuclear-brochure.pdf
"Top Headlines." Smart Energy. Smart Grid. Smart Choices. New Nuclear, Biomass and
Solar Plants, Intelligent Transmission Equipment and Efficiency
Programs. Southern Company, n.d. Web. 26 Feb. 2015.
http://www.southerncompany.com/
United States of America. Department of Commerce. US Census Bureau. N.p.: n.p.,
n.d. US Census Bureau. Web. Dec. 2014
United States of America. Georgia Government Transparency and Campaign Finance
Commission. Campaign Finance Commission. Campaign Reports- By
Contribution. CFC, n.d. Web. Dec. 2014.
United States of America. US Energy Information Administration. Georgia Energy Data.
N.p.: n.p., n.d. Southface. Web. Feb. 2015
United States of America. US Energy Information Administration. Independent Statistics
and Analysis. Georgia/ State Profile and Energy Estimates. US EIA, Oct. 2014.
Web. Oct. 2014
http://www.eia.gov/state/seds/data.cfm?incfile=/state/seds/sep_fuel/html/fuel_te.html&si
d=US&sid=GA
United States of America. US Energy Information Administration. Independent Statistics
and Analysis. N.p.: n.p., n.d. US Department of Energy. Web. Oct. 2014.
http://www.eia.gov/todayinenergy/detail.cfm?id=4850
United States of America. The Environmental Protection Agency. Department of
Energy. Clean Energy. N.p.: n.p., n.d. US EPA. Web. Oct. 2014

Metz42
Vogel, K.P., J. Brieda, D. Walters, D. Ruxton “Switchgrass biomass production in the
Midwest USA: Harvest and Nitrogen Management. Agronomy Journal 94: 413-420
(2002)
Wiser, Ryan, Christopher Namovicz, Mark Ielecki, and Robert Smith. "Renewables Portfolio
Standards: A Factual Introduction to Experience from the United States." The Electricity
Journal (2007): 1-15. Berkeley Laboratory. ERNEST ORLANDO LAWRENCE
BERKELEY NATIONAL LABORATORY, Apr. 2007. Web. 20 Mar. 2015.
http://emp.lbl.gov/sites/all/files/lbnl%20-%2062569.pdf