ANALYZING STANDARDIZED WORKS OF NONCYCLICAL …
107
ANALYZING STANDARDIZED WORKS OF NONCYCLICAL PROCESS WORKERS THROUGH KAIZEN IMPLEMENTATION By Irfan Zidni ID No. 004201300024 An Thesis Report Submitted to the Faculty of Engineering President University in partial Fulfillment of the requirements of Bachelor Degree Engineering Major in Industrial Engineering 2017
Transcript of ANALYZING STANDARDIZED WORKS OF NONCYCLICAL …
ANALYZING STANDARDIZED WORKS
OF NONCYCLICAL PROCESS WORKERS
THROUGH KAIZEN IMPLEMENTATION
By
Irfan Zidni
ID No. 004201300024
An Thesis Report Submitted to the
Faculty of Engineering President University in partial
Fulfillment of the requirements of Bachelor Degree
Engineering Major in Industrial Engineering
2017
i
THESIS ADVISOR
RECOMMENDATION LETTER
This thesis entitled “Analyzing Standardized Works of Noncyclical
Process Workers through Kaizen Implementation” prepared and
submitted by Irfan Zidni in partial fulfillment of the requirements for
the degree of Bachelor Degree in the Faculty of Engineering for a thesis
fit to be examined. I therefore recommend this thesis for Verbal
Defense.
Cikarang, Indonesia, May 10th 2017
Johan K. Runtuk, S.T., M.T
ii
DECLARATION OF ORIGINALITY
I declare that this thesis, entitled “Analyzing Standardized Works of
Noncyclical Process Workers through Kaizen Implementation” is,
to the best of my knowledge and belief, an original piece of work that
has not been submitted, either in whole or in part, to another university
to obtain a degree.
Cikarang, Indonesia, May 10th 2017
Irfan Zidni
iii
ANALYZING STANDARDIZED WORKS
OF NONCYCLICAL PROCESS WORKERS
THROUGH KAIZEN IMPLEMENTATION
By
Irfan Zidni
ID No: 004201300024
Approved by,
Johan K. Runtuk S.T., M.T
Thesis Advisor
Ir. Andira Taslim, M.T
Head of Study Program Industrial Engineering
iv
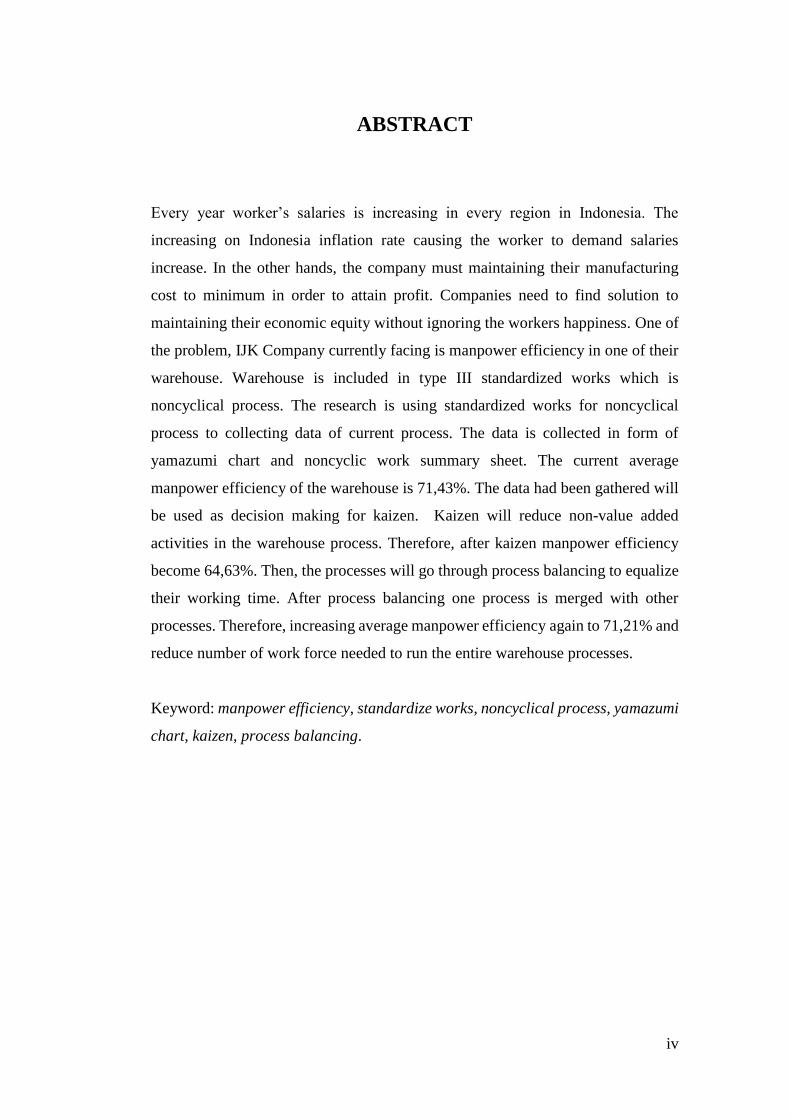
ABSTRACT
Every year worker’s salaries is increasing in every region in Indonesia. The
increasing on Indonesia inflation rate causing the worker to demand salaries
increase. In the other hands, the company must maintaining their manufacturing
cost to minimum in order to attain profit. Companies need to find solution to
maintaining their economic equity without ignoring the workers happiness. One of
the problem, IJK Company currently facing is manpower efficiency in one of their
warehouse. Warehouse is included in type III standardized works which is
noncyclical process. The research is using standardized works for noncyclical
process to collecting data of current process. The data is collected in form of
yamazumi chart and noncyclic work summary sheet. The current average
manpower efficiency of the warehouse is 71,43%. The data had been gathered will
be used as decision making for kaizen. Kaizen will reduce non-value added
activities in the warehouse process. Therefore, after kaizen manpower efficiency
become 64,63%. Then, the processes will go through process balancing to equalize
their working time. After process balancing one process is merged with other
processes. Therefore, increasing average manpower efficiency again to 71,21% and
reduce number of work force needed to run the entire warehouse processes.
Keyword: manpower efficiency, standardize works, noncyclical process, yamazumi
chart, kaizen, process balancing.
v
ACKNOWLEDGEMENT
I express my deep sense of gratitude my mother Chotimah and my
father Markim for always encouraging me to finish my thesis. Thanks
for all love and support you always give to me. Please, always love and
believe your son.
I am very much thankful to Mr. Johan K. Runtuk S.T., M.T., thesis
advisor for your valuable guidance and suggestion also encouragement
at various stage of my thesis. Also, all Industrial Engineering lecturer
for sharing us your knowledge.
I acknowledge with thanks for every support that had been given by my
friends. All of my friends that really care and help me finishing my
university year. Furthermore, thanks for life lesson you teach me during
my lifetime.
vi
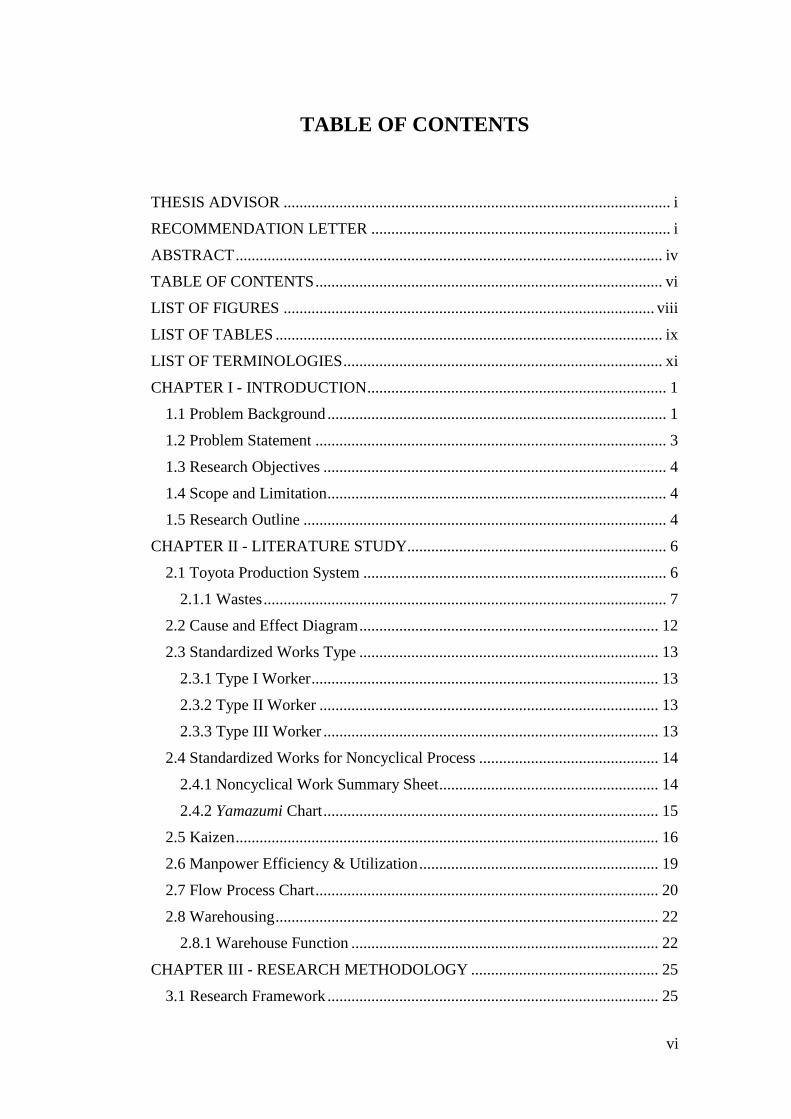
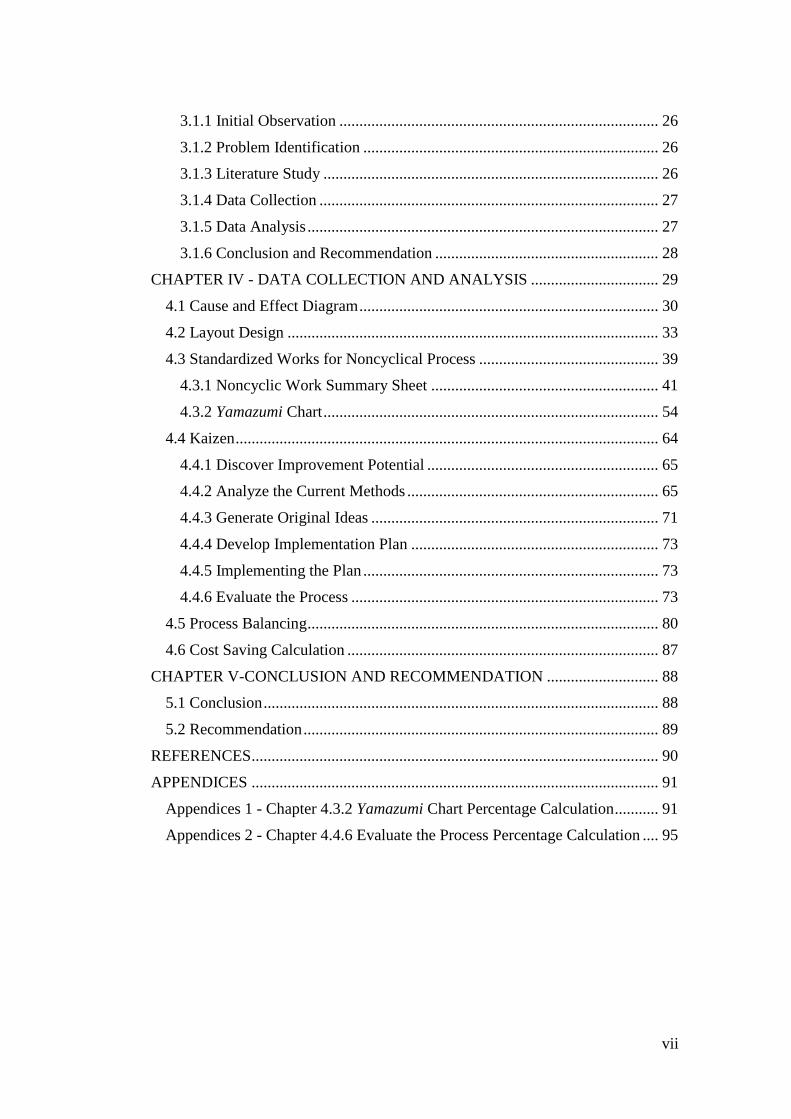
TABLE OF CONTENTS
THESIS ADVISOR ................................................................................................. i
RECOMMENDATION LETTER ........................................................................... i
ABSTRACT ........................................................................................................... iv
TABLE OF CONTENTS ....................................................................................... vi
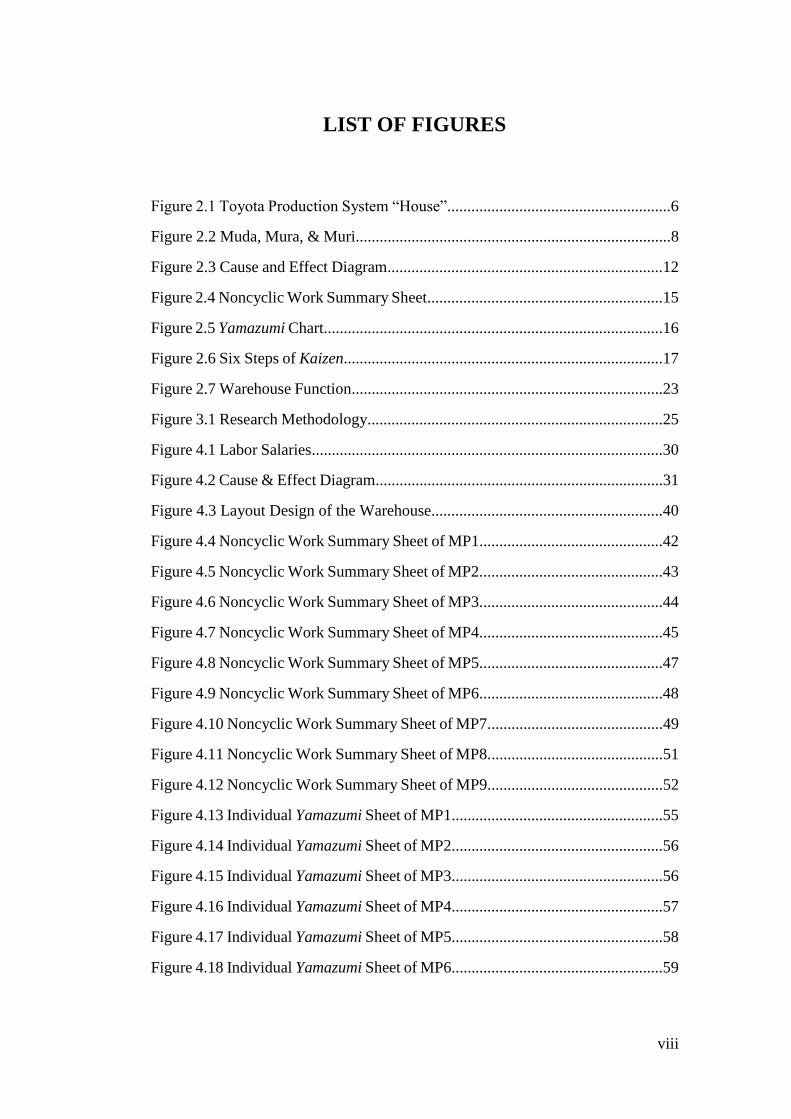
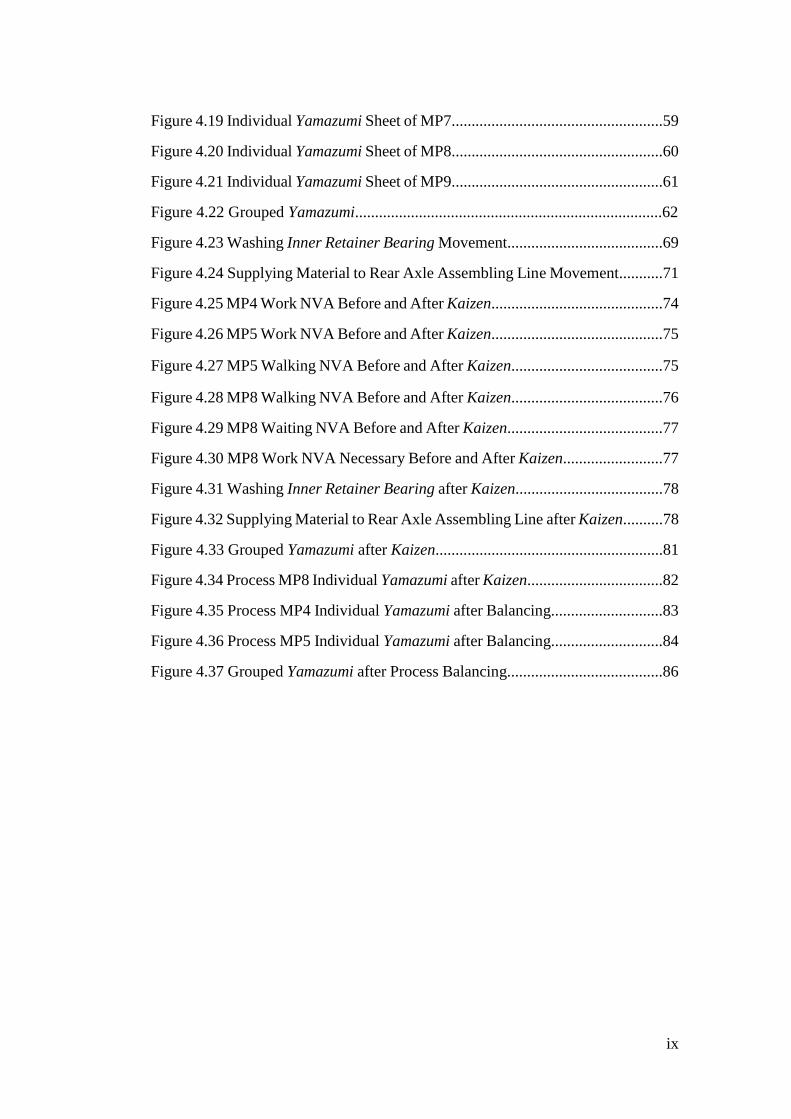
LIST OF FIGURES ............................................................................................. viii
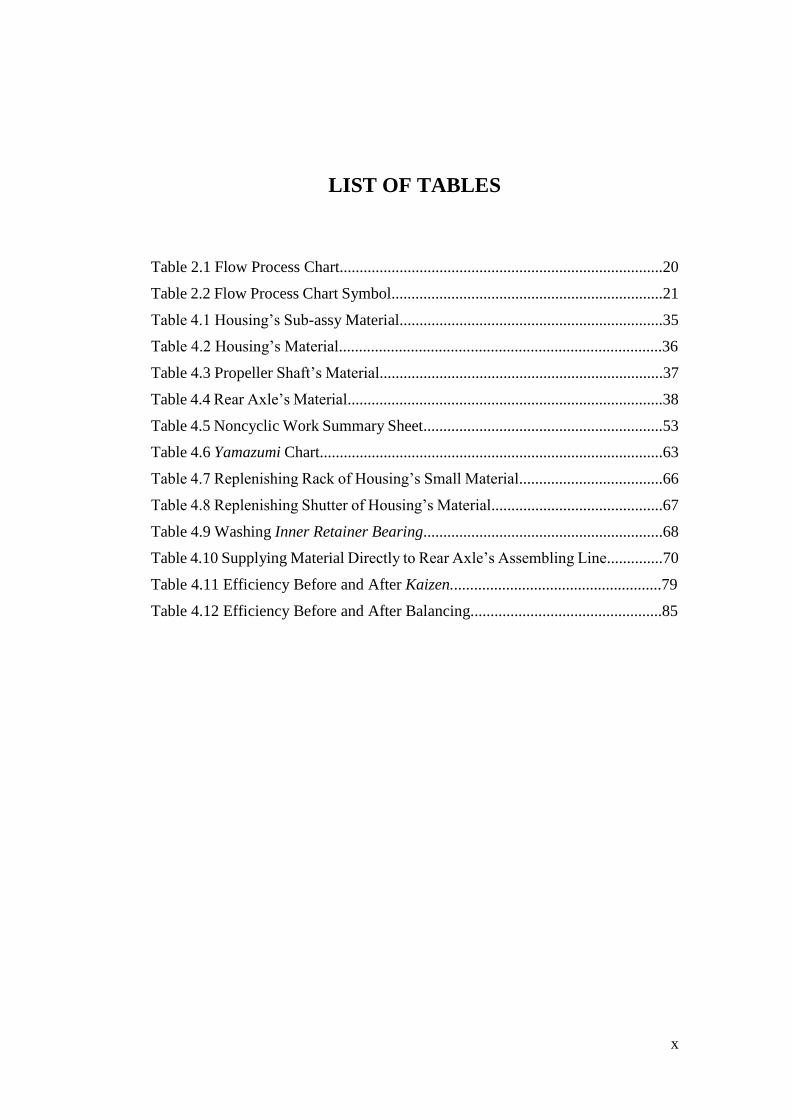
LIST OF TABLES ................................................................................................. ix
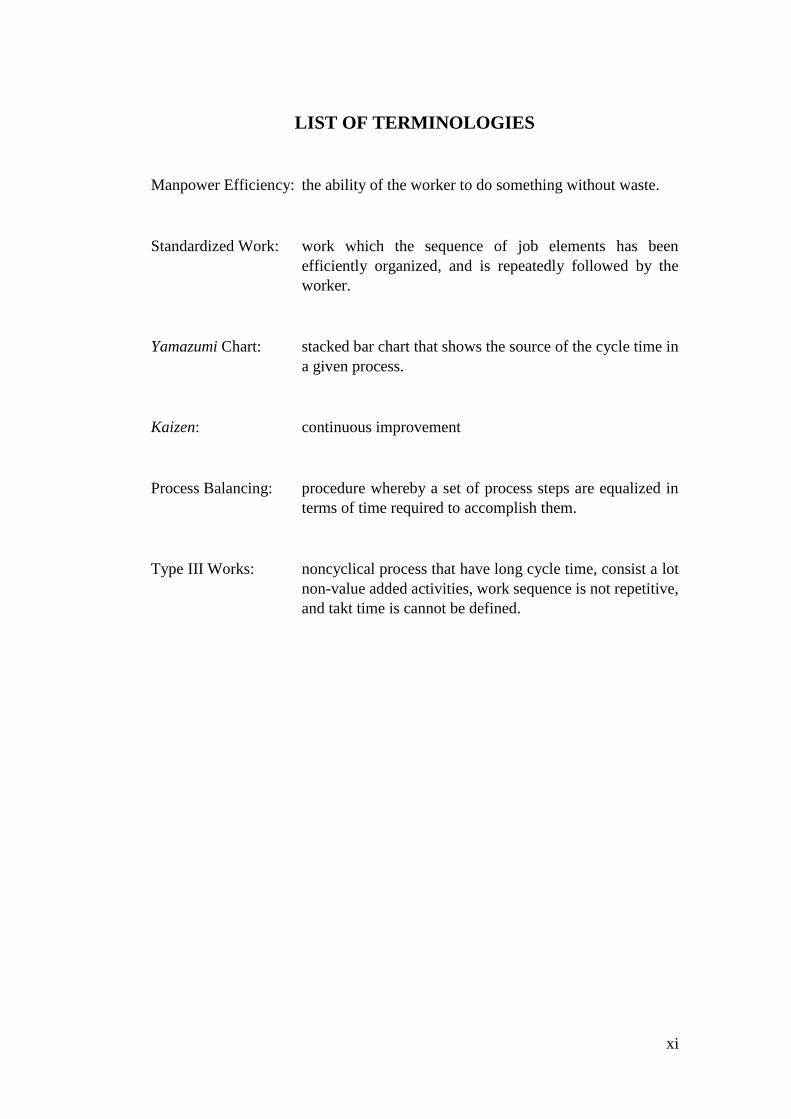
LIST OF TERMINOLOGIES ................................................................................ xi
CHAPTER I - INTRODUCTION ........................................................................... 1
1.1 Problem Background ..................................................................................... 1
1.2 Problem Statement ........................................................................................ 3
1.3 Research Objectives ...................................................................................... 4
1.4 Scope and Limitation ..................................................................................... 4
1.5 Research Outline ........................................................................................... 4
CHAPTER II - LITERATURE STUDY................................................................. 6
2.1 Toyota Production System ............................................................................ 6
2.1.1 Wastes ..................................................................................................... 7
2.2 Cause and Effect Diagram ........................................................................... 12
2.3 Standardized Works Type ........................................................................... 13
2.3.1 Type I Worker ....................................................................................... 13
2.3.2 Type II Worker ..................................................................................... 13
2.3.3 Type III Worker .................................................................................... 13
2.4 Standardized Works for Noncyclical Process ............................................. 14
2.4.1 Noncyclical Work Summary Sheet....................................................... 14
2.4.2 Yamazumi Chart .................................................................................... 15
2.5 Kaizen .......................................................................................................... 16
2.6 Manpower Efficiency & Utilization ............................................................ 19
2.7 Flow Process Chart ...................................................................................... 20
2.8 Warehousing ................................................................................................ 22
2.8.1 Warehouse Function ............................................................................. 22
CHAPTER III - RESEARCH METHODOLOGY ............................................... 25
3.1 Research Framework ................................................................................... 25
vii
3.1.1 Initial Observation ................................................................................ 26
3.1.2 Problem Identification .......................................................................... 26
3.1.3 Literature Study .................................................................................... 26
3.1.4 Data Collection ..................................................................................... 27
3.1.5 Data Analysis ........................................................................................ 27
3.1.6 Conclusion and Recommendation ........................................................ 28
CHAPTER IV - DATA COLLECTION AND ANALYSIS ................................ 29
4.1 Cause and Effect Diagram ........................................................................... 30
4.2 Layout Design ............................................................................................. 33
4.3 Standardized Works for Noncyclical Process ............................................. 39
4.3.1 Noncyclic Work Summary Sheet ......................................................... 41
4.3.2 Yamazumi Chart .................................................................................... 54
4.4 Kaizen .......................................................................................................... 64
4.4.1 Discover Improvement Potential .......................................................... 65
4.4.2 Analyze the Current Methods ............................................................... 65
4.4.3 Generate Original Ideas ........................................................................ 71
4.4.4 Develop Implementation Plan .............................................................. 73
4.4.5 Implementing the Plan .......................................................................... 73
4.4.6 Evaluate the Process ............................................................................. 73
4.5 Process Balancing ........................................................................................ 80
4.6 Cost Saving Calculation .............................................................................. 87
CHAPTER V-CONCLUSION AND RECOMMENDATION ............................ 88
5.1 Conclusion ................................................................................................... 88
5.2 Recommendation ......................................................................................... 89
REFERENCES ...................................................................................................... 90
APPENDICES ...................................................................................................... 91
Appendices 1 - Chapter 4.3.2 Yamazumi Chart Percentage Calculation ........... 91
Appendices 2 - Chapter 4.4.6 Evaluate the Process Percentage Calculation .... 95
viii
LIST OF FIGURES
Figure 2.1 Toyota Production System “House”........................................................6
Figure 2.2 Muda, Mura, & Muri...............................................................................8
Figure 2.3 Cause and Effect Diagram.....................................................................12
Figure 2.4 Noncyclic Work Summary Sheet...........................................................15
Figure 2.5 Yamazumi Chart.....................................................................................16
Figure 2.6 Six Steps of Kaizen................................................................................17
Figure 2.7 Warehouse Function..............................................................................23
Figure 3.1 Research Methodology..........................................................................25
Figure 4.1 Labor Salaries........................................................................................30
Figure 4.2 Cause & Effect Diagram........................................................................31
Figure 4.3 Layout Design of the Warehouse..........................................................40
Figure 4.4 Noncyclic Work Summary Sheet of MP1..............................................42
Figure 4.5 Noncyclic Work Summary Sheet of MP2..............................................43
Figure 4.6 Noncyclic Work Summary Sheet of MP3..............................................44
Figure 4.7 Noncyclic Work Summary Sheet of MP4..............................................45
Figure 4.8 Noncyclic Work Summary Sheet of MP5..............................................47
Figure 4.9 Noncyclic Work Summary Sheet of MP6..............................................48
Figure 4.10 Noncyclic Work Summary Sheet of MP7............................................49
Figure 4.11 Noncyclic Work Summary Sheet of MP8............................................51
Figure 4.12 Noncyclic Work Summary Sheet of MP9............................................52
Figure 4.13 Individual Yamazumi Sheet of MP1.....................................................55
Figure 4.14 Individual Yamazumi Sheet of MP2.....................................................56
Figure 4.15 Individual Yamazumi Sheet of MP3.....................................................56
Figure 4.16 Individual Yamazumi Sheet of MP4.....................................................57
Figure 4.17 Individual Yamazumi Sheet of MP5.....................................................58
Figure 4.18 Individual Yamazumi Sheet of MP6.....................................................59
ix
Figure 4.19 Individual Yamazumi Sheet of MP7.....................................................59
Figure 4.20 Individual Yamazumi Sheet of MP8.....................................................60
Figure 4.21 Individual Yamazumi Sheet of MP9.....................................................61
Figure 4.22 Grouped Yamazumi.............................................................................62
Figure 4.23 Washing Inner Retainer Bearing Movement.......................................69
Figure 4.24 Supplying Material to Rear Axle Assembling Line Movement...........71
Figure 4.25 MP4 Work NVA Before and After Kaizen...........................................74
Figure 4.26 MP5 Work NVA Before and After Kaizen...........................................75
Figure 4.27 MP5 Walking NVA Before and After Kaizen......................................75
Figure 4.28 MP8 Walking NVA Before and After Kaizen......................................76
Figure 4.29 MP8 Waiting NVA Before and After Kaizen.......................................77
Figure 4.30 MP8 Work NVA Necessary Before and After Kaizen.........................77
Figure 4.31 Washing Inner Retainer Bearing after Kaizen.....................................78
Figure 4.32 Supplying Material to Rear Axle Assembling Line after Kaizen..........78
Figure 4.33 Grouped Yamazumi after Kaizen.........................................................81
Figure 4.34 Process MP8 Individual Yamazumi after Kaizen..................................82
Figure 4.35 Process MP4 Individual Yamazumi after Balancing............................83
Figure 4.36 Process MP5 Individual Yamazumi after Balancing............................84
Figure 4.37 Grouped Yamazumi after Process Balancing.......................................86
x
LIST OF TABLES
Table 2.1 Flow Process Chart.................................................................................20
Table 2.2 Flow Process Chart Symbol....................................................................21
Table 4.1 Housing’s Sub-assy Material..................................................................35
Table 4.2 Housing’s Material.................................................................................36
Table 4.3 Propeller Shaft’s Material.......................................................................37
Table 4.4 Rear Axle’s Material...............................................................................38
Table 4.5 Noncyclic Work Summary Sheet............................................................53
Table 4.6 Yamazumi Chart......................................................................................63
Table 4.7 Replenishing Rack of Housing’s Small Material....................................66
Table 4.8 Replenishing Shutter of Housing’s Material...........................................67
Table 4.9 Washing Inner Retainer Bearing............................................................68
Table 4.10 Supplying Material Directly to Rear Axle’s Assembling Line..............70
Table 4.11 Efficiency Before and After Kaizen.....................................................79
Table 4.12 Efficiency Before and After Balancing................................................85
xi
LIST OF TERMINOLOGIES
Manpower Efficiency: the ability of the worker to do something without waste.
Standardized Work: work which the sequence of job elements has been
efficiently organized, and is repeatedly followed by the
worker.
Yamazumi Chart: stacked bar chart that shows the source of the cycle time in
a given process.
Kaizen: continuous improvement
Process Balancing: procedure whereby a set of process steps are equalized in
terms of time required to accomplish them.
Type III Works: noncyclical process that have long cycle time, consist a lot
non-value added activities, work sequence is not repetitive,
and takt time is cannot be defined.
1
CHAPTER I
INTRODUCTION
1.1 Problem Background
Every year worker’s salaries is increasing in every region in Indonesia. The
increasing on Indonesia inflation rate causing the worker to demand salaries
increase. In the other hands, the company must maintaining their manufacturing
cost to minimum in order to attain profit. Companies need to find solution to
maintaining their economic equity without ignoring the workers happiness.
According to Beach (1975), manpower management is a process for determining
and assuring that the organization will have an adequate number of qualified
persons, available at the proper times, performing jobs which meet the needs of the
enterprises and which provide satisfaction for the individuals involved. According
to Yoshiki, Aura, and Lorelie (2015), effective utilization of manpower comes with
a lot of advantage such as cost reduction, clarity in performing tasks, saves money
as well as time, less wastage, and organizational goals can be achieved faster.
The company have to consider total amount of human resources needed to run their
production line. In other words, the company need to manage their manpower to
increase their efficiency. The amount of manpower needed to run the system need
to be considered carefully. If the number of manpower inside the facility is
exceeding the amount needed to run the system properly, it will result in high idle
time and low manpower efficiency. Otherwise, if the number of manpower is less
than amount needed, it will reduce the overall productivity of the company and
could risk the health and safety of manpower.
Manpower efficiency greatly affect the total cost to produce the product. Wages is
calculated from hours of working. The company assume workers to be working all
the time with some allowance, but in reality the workers must have idle time. There
is limited amount of idle time allowed in one shift of works. But, in some cases the
2
idle time exceeding the allowed limit. Consequently, the money that used to pay the
worker is not used optimally because of high number of idle time.
Toyota Production System (also called Lean Manufacturing) is a concept whereby
all production employees work together to eliminate waste (Meyers and Stewart,
2002). According to Jon Miller (2010), type I, II, and III classification is a new term
used to specifically explain the variants of standardized works to overseas Toyota
plans.
IJK Company is one of manufacturing company that followed Toyota Production
System. IJK Company produce automotive parts for light and medium duty trucks.
There are three different type of standardized works which are type I, type II, and
Type III. Type I standardized works for works with repetitive cycle. Type II
standardized works for works with variable cycle. Lastly, type III standardized
works for noncyclical works.
According to Niederstadt (2010), noncyclical work is work where the key elements
are repeatable, but the sequence in which they occur is not repeatable. Also, it is
important to define non-value added but necessary (NVA Necessary) and non-value
added (NVA) work categories in noncyclical process.
IJK Company currently facing problem of manpower efficiency in one of their
warehouse. Workers inside the warehouse are categorized as type III standardized
works. This type is include all types of process that takt time cannot be calculated.
There are nine processes of works inside the warehouse. Defining necessary and
unnecessary works of the processes is important to find solution for increasing
manpower efficiency and utilization.
According to Niederstadt (2010), noncyclic work summary sheet is a great tools
used to define the work categories into NVA Necessary and NVA. Joseph
Niederstadt (2010) also mentioned yamazumi chart is informative decision making
tools that provide great visual display that drives the impact of the data to those
3
viewing it. Yamazumi chart is mainly used in standardized work for noncyclical
process to see current state and after improvement condition of the work processes.
According to Imai (1986), kaizen is continuous improvement that involves
everyone in the process and give huge impact although the improvement is small
and incremental.
The warehouse for production plant 2 and plant 3 (also called warehouse 2,5) as
one of the largest warehouse in IJK company need to improve their manpower
efficiency and utilization. Warehouse which have noncyclical works need different
standardized works unlike regular works in assembling line or machining line.
Collecting information for decision making and improvement strategies act ivies is
totally different from cyclical works. Because of that, type III standardized works
using noncyclic work summary chart and yamazumi chart for decision making data.
In the other hand, kaizen is good for creating improvement in the process that
consist a lot of small tasks. Implementing kaizen idea will reduce waste in the
process. Finally, by balancing the process it will increase the average manpower
efficiency and utilization of the warehouse process.
1.2 Problem Statement
Based on the problem occurs on IJK Company, this research is conducted to answer
these following questions:
How does the company knows the current manpower efficiency and
utilization of warehouse 2,5 using noncyclic work summary sheet and
yamazumi chart?
What is the difference between manpower efficiency and utilization inside
warehouse 2,5 before and after kaizen idea implementation?
How does the company reduce number of workforce needed using process
balancing procedure in the warehouse?
4
1.3 Research Objectives
The main objectives of this research are as follows:
To determine current manpower efficiency and utilization inside warehouse
2,5 using noncyclic work summary sheet and yamazumi chart.
To determine the difference between manpower efficiency and utilization
before and after kaizen idea had been implemented inside warehouse 2,5.
To determine the effect of process balancing in reducing number of workforce
needed to run the warehouse process.
1.4 Scope and Limitation
Due to limited time and resources in doing this research, there will be some scopes
in the observation:
The research data analysis is based on estimation of how the improvement
effect manpower efficiency and utilization.
The data were taken from July until September 2016
The data were taken only from warehouse 2,5 and only first shift workers,
with total 9 workers.
1.5. Assumption
There are several assumptions in order to support this research:
Every shift have the same total available time.
The data of the research is accurate.
1.5 Research Outline
Chapter I Introduction
This chapter consists of problem background, problem statements as the things to
be solved, objectives to be achieved in this research, scope as the limitation,
assumption, and research outline of the study.
5
Chapter II Literature Study
This chapter provides literature review of previous studies on the same areas of this
projects. This chapter will strengthen the foundation of the project and support the
calculation and analysis of the data.
Chapter III Research Methodology
This chapter describes the flow of this research and explanation of each step to
conduct this research.
Chapter IV Data Collection and Analysis
This chapter explains about data collecting activities including output of data
processing. Then, analyze the data that have been collected to achieve the goals.
Chapter V Conclusion and Recommendation
This chapter give a final result of the research and closing statement regarding
future research and recommendation.
6
CHAPTER II
LITERATURE STUDY
2.1 Toyota Production System
The concept of lean manufacturing was developed by Taiichi Ohno at Toyota Motor
Company in the 1950’s. Toyota Production System (TPS) is an assembly-line
manufacturing methodology developed originally for Toyota and for the
manufacturing of the automobiles. Toyota Production System focuses on abolishing
or reducing waste and on maximizing or fully utilizing the activities that add the
value from the customer’s perspective.
Toyota Production System (TPS) aims at half the human effort in the factory, half
the manufacturing space, and half the engineering hours to develop a new product
in half the time. Also it requires keeping far less than half the needed inventory on
site, resulting in many fewer defects, and producing a greater and ever growing
variety of products (Womack et al., 1990).
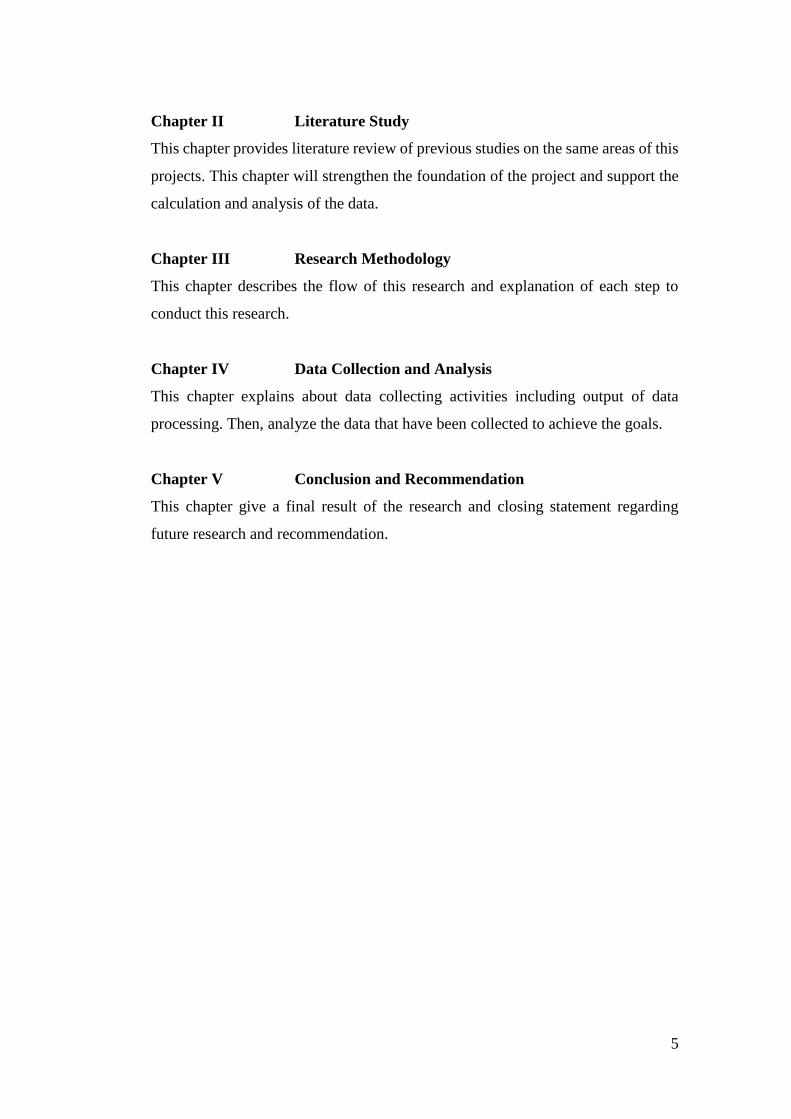
Figure 2.1 Toyota Production System “House”
7
Toyota Production System (TPS) is visualized as a house where each element plays
an important role to the entire structure. The strong foundation of the house is the
constitution of four elements – philosophy, visual management, stability and
standardization, implying its importance or presence before any other part of the
structure could be made. The house of TPS is a metaphor that was designed by
Ohno to fit objectives, strategy, tactics, skills and foundational elements of TPS
together (Wilson, 2010).
2.1.1 Wastes
The organizations’ success is dependent on the integrated working of mean,
method, material and machine at the worksite. Wastes are prevalent all over the
organization, but as one lives with it or works around it, it gets hidden. TPS
identifies series of wasteful activities in the processes and adds value to them by
the thorough and continuous elimination of waste. Value is said to be added, when
the products is physically changed towards what the customer is intending to
purchase. It is added, when a service is provided for which the customer is willing
to pay. There three types of activities classified in TPS, the three types as follows:
Non-value adding (NVA)
These are pure wastes and involve unnecessary actions which should be eliminated
if possible. For example waiting time, double handling and so forth.
Necessary but non-value adding (NNVA)
These activities may be wasteful but are necessary under the current operating
procedures, hence, are called ‘incidental waste’. The company does not find value
in these activities and does not want to pay for them but still these are required due
to the process limitations, current technology and government regulations. For
example walking long distances to pick up parts, unpacking deliveries and
transferring a tool from one hand to another, quality check and so forth.
8
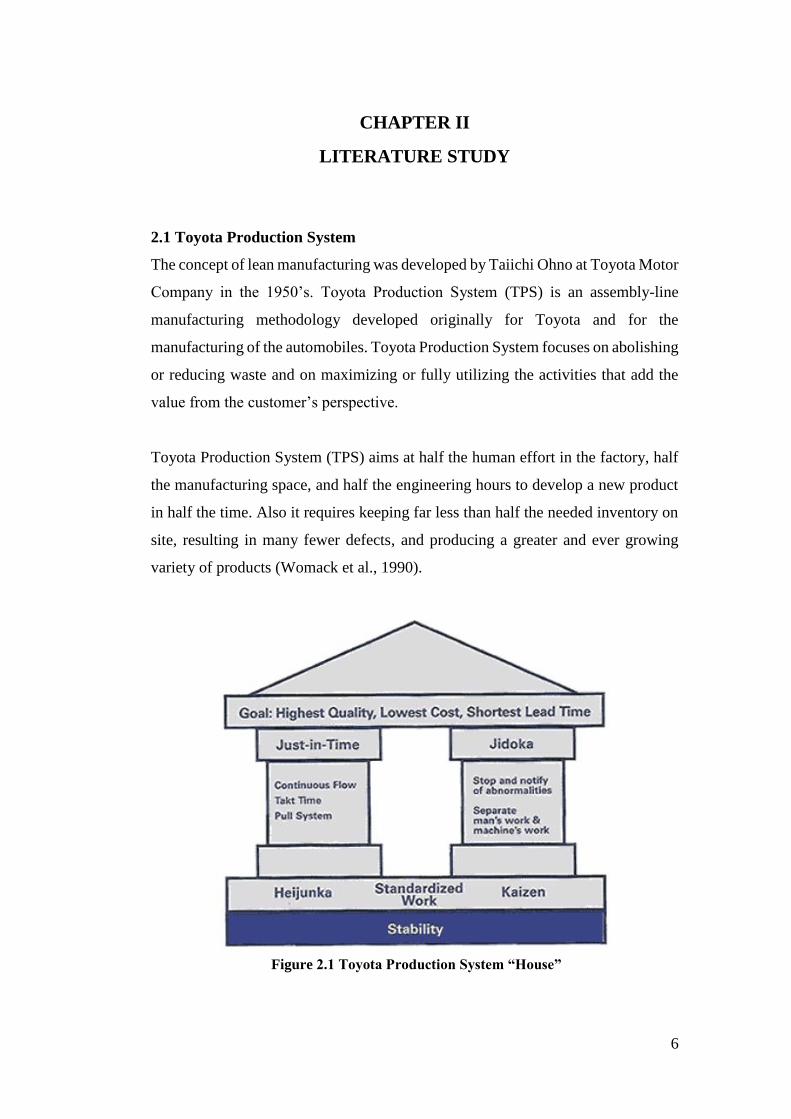
Source: Isao Kato & Art Smalley (2010)
Figure 2.2 Muda, Mura, & Muri
Value adding (VA)
These activities transform the nature, shape or characteristics of an information or
product in line with the customer requirements. Customer values these activities,
are willing to pay for it and they will know, if this activity is removed. For example
joining parts of collar, embroidering garment and so forth.
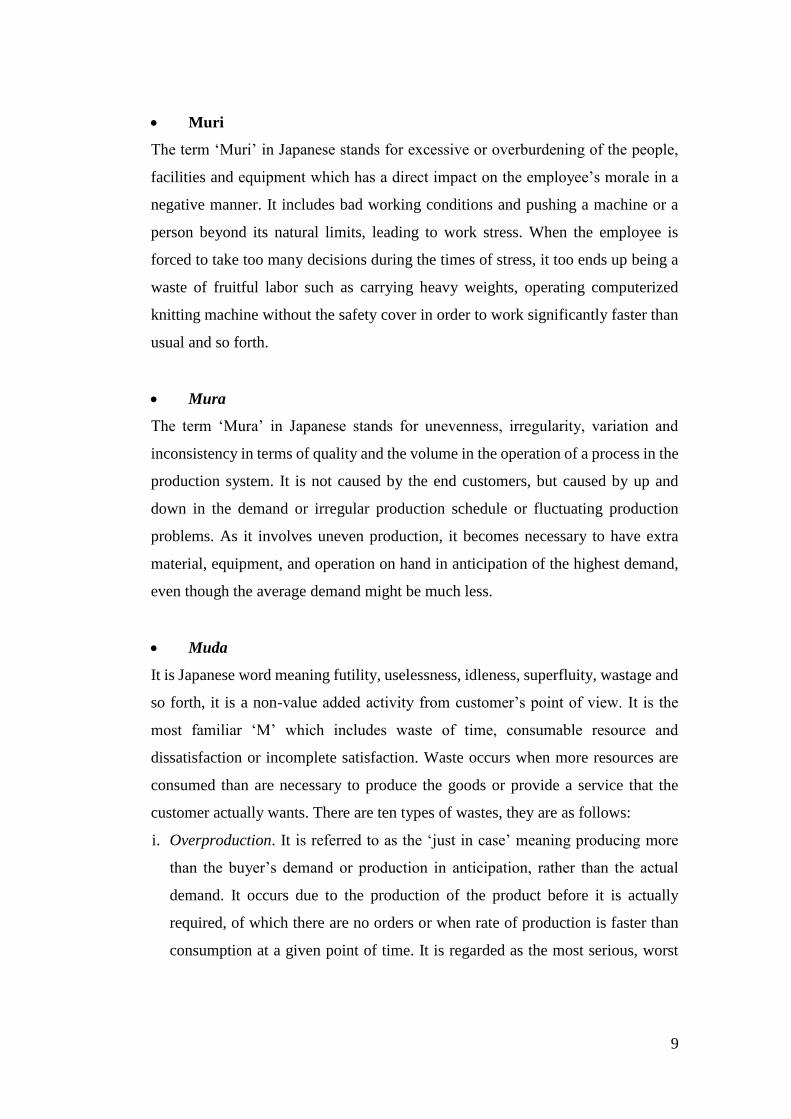
There are three forms of waste at work namely Muri, Mura and Muda These words
are interconnected and are often used together and referred to as the three M’s in
Japan. Mura means ‘unevenness’, and Muri means ‘overburden’ or ‘excess’ and
Muda means ‘waste’.
9
Muri
The term ‘Muri’ in Japanese stands for excessive or overburdening of the people,
facilities and equipment which has a direct impact on the employee’s morale in a
negative manner. It includes bad working conditions and pushing a machine or a
person beyond its natural limits, leading to work stress. When the employee is
forced to take too many decisions during the times of stress, it too ends up being a
waste of fruitful labor such as carrying heavy weights, operating computerized
knitting machine without the safety cover in order to work significantly faster than
usual and so forth.
Mura
The term ‘Mura’ in Japanese stands for unevenness, irregularity, variation and
inconsistency in terms of quality and the volume in the operation of a process in the
production system. It is not caused by the end customers, but caused by up and
down in the demand or irregular production schedule or fluctuating production
problems. As it involves uneven production, it becomes necessary to have extra
material, equipment, and operation on hand in anticipation of the highest demand,
even though the average demand might be much less.
Muda
It is Japanese word meaning futility, uselessness, idleness, superfluity, wastage and
so forth, it is a non-value added activity from customer’s point of view. It is the
most familiar ‘M’ which includes waste of time, consumable resource and
dissatisfaction or incomplete satisfaction. Waste occurs when more resources are
consumed than are necessary to produce the goods or provide a service that the
customer actually wants. There are ten types of wastes, they are as follows:
i. Overproduction. It is referred to as the ‘just in case’ meaning producing more
than the buyer’s demand or production in anticipation, rather than the actual
demand. It occurs due to the production of the product before it is actually
required, of which there are no orders or when rate of production is faster than
consumption at a given point of time. It is regarded as the most serious, worst
10
and fundamental waste, as it not only leads to other wastes but also discourage a
smooth flow of goods or services inhibiting quality and productivity.
ii. Excess inventory. It is called a mismatch between demand and supply. Waste of
inventory requires extra space for storage; time and effort; capital locked in
purchased materials and material used between processes; extensive rework;
damaged, obsolete and unfit inventory; larger material handling system to move
larger quantities of goods, and increase in lead time for delivery (Hines & Rich,
1997).
iii. Waiting. Queuing for anything is a waste. When the time is being used
ineffectively and the goods are not mobbing or being worked on, then the waste
of waiting occurs (Hines & Rich, 1997).
iv. Waste of excess motion. It involves the unnecessary movements in production
where the operators have to stretch, bend and pick up, and extra “busy”
movements while waiting when these actions could be avoided. Such waste is
tiring for the employees and is likely to lead to poor productivity and, often, to
quality problems (Hines & Rich, 1997). Causes for this type of waste are faulty
equipment and plant layout, lack of 5 S’s, lack of visual controls, inconsistent
work methods, large batch sizes and so forth.
v. Excess transportation. This includes moving materials, parts, or finished goods
between processes or into or out of storage. It leads to double handling,
deterioration in quality, delay in communication between processes and poor
quality feedback further delays corrective action (Hines & Rich, 1997).
vi. Rework. Product defects occur when the work pieces are reprocessed or repaired
due to the incapable processes, excessive variation, incapable suppliers,
management decisions, insufficient training, inadequate tools or equipment,
poor layout, unnecessary handling and high inventory levels. In mass production
defects are rarely visible as the get hidden below the inventory while in
11
continuous flow, the defects destroys the balance resulting even in a missed
shipment. Consequences of product defects are additional labor, extra floor
space, tools, equipment, effort, time, material, missed shipments or deliveries,
lower profits and money to disassemble and reassemble defective product It
becomes serious when the defective product reaches the customer and it will
cause customer dissatisfaction and may result in the loss of future business and
market share.
vii. Inappropriate processing. It means over processing, incorrect process and
inefficient processing. Causes of this type of waste are decision making at
inappropriate levels, inefficient policies and procedures, lack of customer input
concerning requirements and use of expensive, large, inflexible machine, high
precision equipment instead of several, small, flexible simpler tools (Hines &
Rich 1997).
viii. Wasting potential of people. “Our people are our greatest asset”, this proverb is
true when employees developed enough understanding about value added, not –
value added and then draw on their experience and creativity to find the
solutions. But when people’s mental, creative, and physical abilities are not used,
waste of potential of people occurs.
ix. Waste of disconnectivity. This refers to waste stemming from administrative
disconnection within the unit, and, between a unit and its suppliers creating
barriers to creativity, innovation and knowledge sharing, when different
departments work on their own without being connected or considering each
other’s demand.
x. Waste of excessive energy consumption. The tenth waste is the latest inclusion
in the list of wastes as it has become more and more important to rationalize the
consumption of energy and energy cost to give greatest advantages for the
consumer and the environment. It may be due to the use of electricity when not
12
Source : http://www.squawkpoint.com/2012/01/fish-bone-diagrams-helpful-or-not/
Figure 2.3 Cause and Effect Diagram
required, release of extra steam from boiler, and use of old inefficient machines.
Hence, overutilization as well as underutilization both creates wastes.
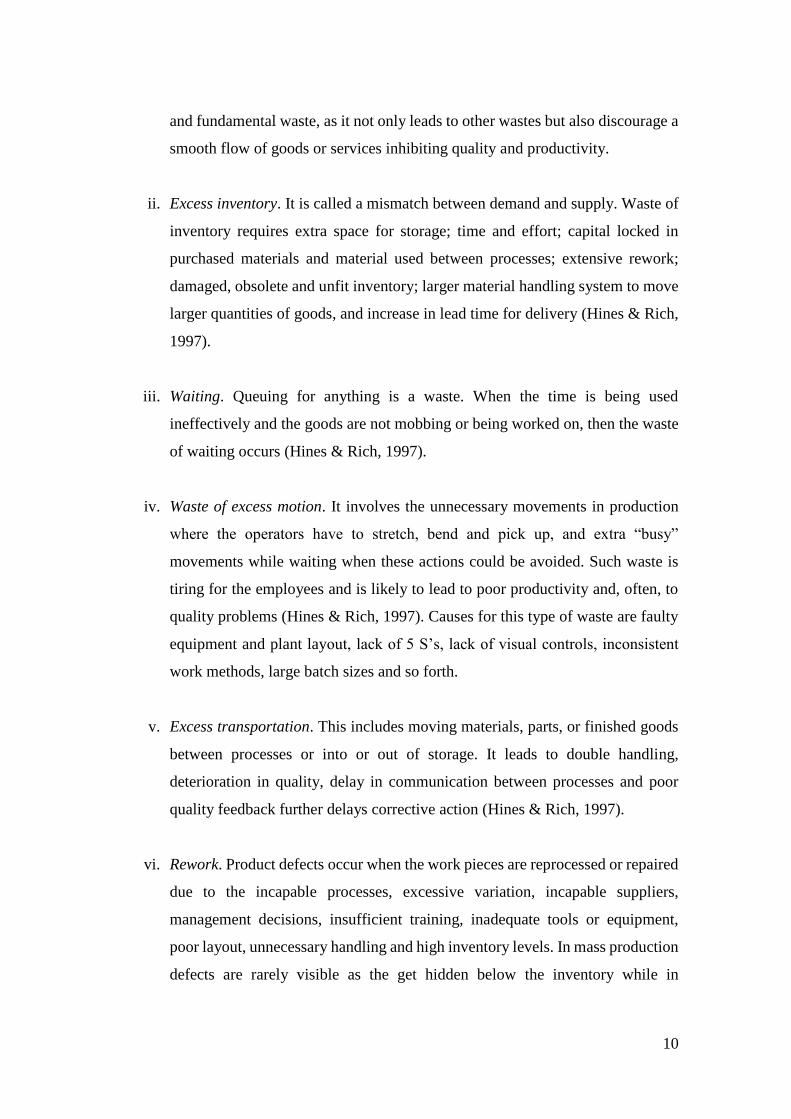
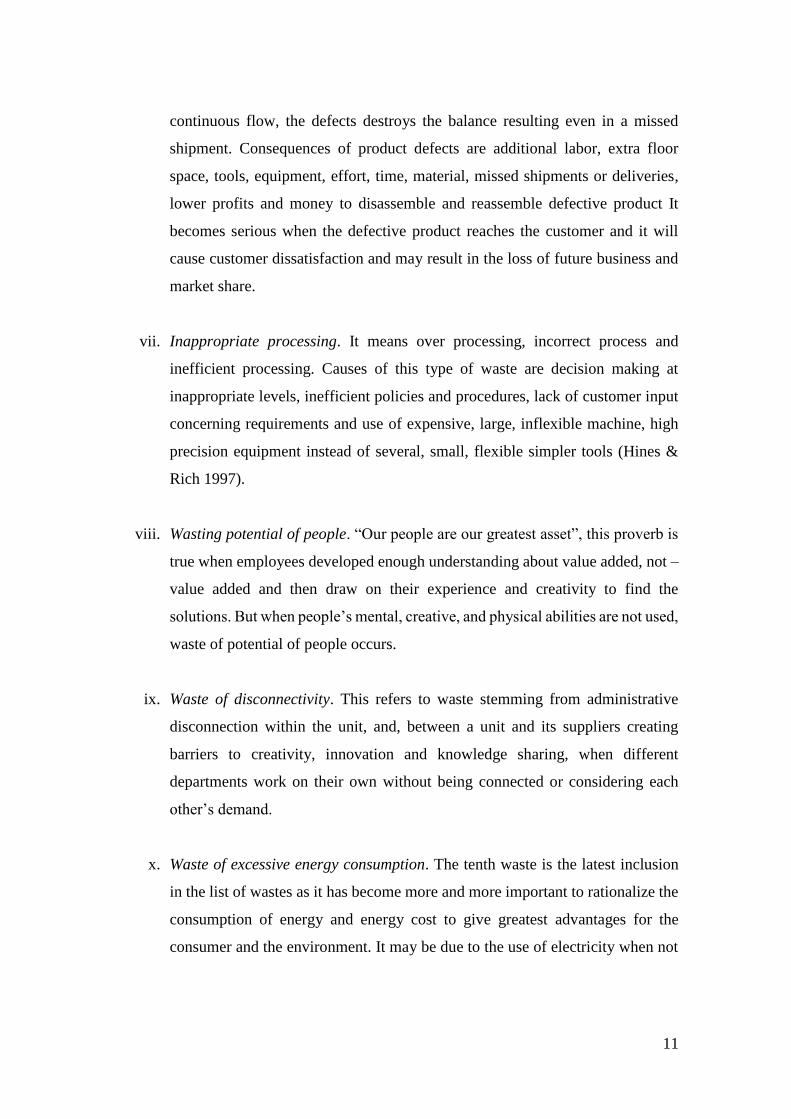
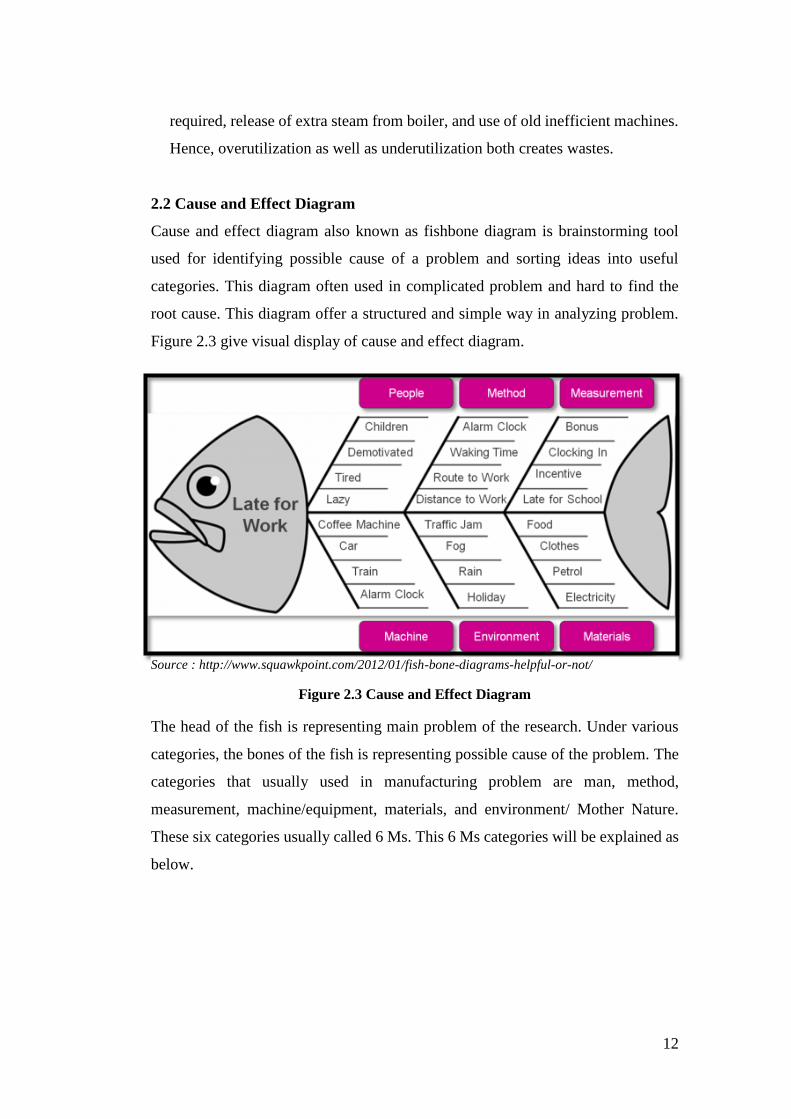
2.2 Cause and Effect Diagram
Cause and effect diagram also known as fishbone diagram is brainstorming tool
used for identifying possible cause of a problem and sorting ideas into useful
categories. This diagram often used in complicated problem and hard to find the
root cause. This diagram offer a structured and simple way in analyzing problem.
Figure 2.3 give visual display of cause and effect diagram.
The head of the fish is representing main problem of the research. Under various
categories, the bones of the fish is representing possible cause of the problem. The
categories that usually used in manufacturing problem are man, method,
measurement, machine/equipment, materials, and environment/ Mother Nature.
These six categories usually called 6 Ms. This 6 Ms categories will be explained as
below.
13
2.3 Standardized Works Type
In Toyota Production System (TPS) there three different type for standardized
works. The works is divided by its nature of process flow. There are works with
repetitive cycle, variable cycle, and long cycle. According to Miller (2010), this
type 1, 2, and 3 terminology was new addition to TPS, it possibly used to explain
the variants of standardized works to overseas Toyota plans. The details of every
type is explained below.
2.3.1 Type I Worker
The first type is standardize works for process that have repetitive cycle. The takt
time of the process can be defined. The standardized works is aim to keep the
fluctuation of worker cycle time above or below takt time to a minimum. This the
most common type of standardized works in Toyota Production System. It can be
found assembly line or u-shaped machining cell producing well defined product
family.
2.3.2 Type II Worker
The second type is standardized works for process that have short but variable cycle.
This type can be found on assembly line that consist of different type of product
models. The production pattern of the assembly line is not the same when the same
product appeared in the patter. For example, the production line have to make
models A-A-A-B-B-C. This condition may cause waiting time or prevent the
operator from meeting takt time due to tools change, different material, etc.
2.3.3 Type III Worker
The third type is standardized works for noncyclical process. Noncyclical process
usually have long cycle time, consist a lot non-value added activities, work
sequence is not repetitive, and takt time is cannot be defined. This type is the hardest
to collect data from three type of standardized works. Every details of manpower
works have to be recorded in order to get reliable data. Beside of that, the observer
must have the ability to differentiate between non-value added necessary activities
and non-value added activities. This type can be found on warehousing process.
14
2.4 Standardized Works for Noncyclical Process
Conducting type III standardized work is different from creating standardized work
for other type. Type III standardized works is for noncyclical process. Noncyclical
process characteristic is it have long cycle time, no repetitive works, and have a lot
of non-value added activity. Therefore, collecting valuable data as foundation of
the kaizen is not easy.
According to Niederstadt (2010), explain and show the tools that can be used to
gathering valuable data that can be used for decision making in conducting kaizen.
The tools are noncyclic work summary sheet and yamazumi chart. After, the data
has been gathered it can be used as decision making foundation on conducting
kaizen. Explanation will be shown below to give more details about the tools and
methods.
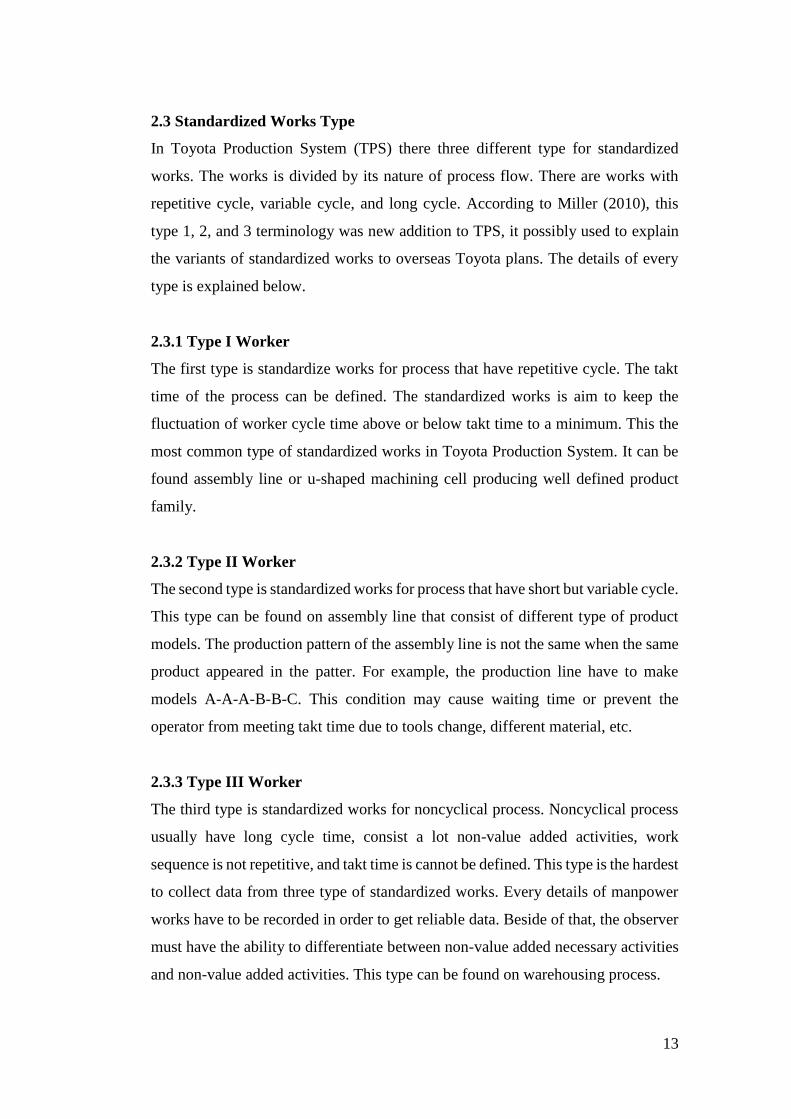
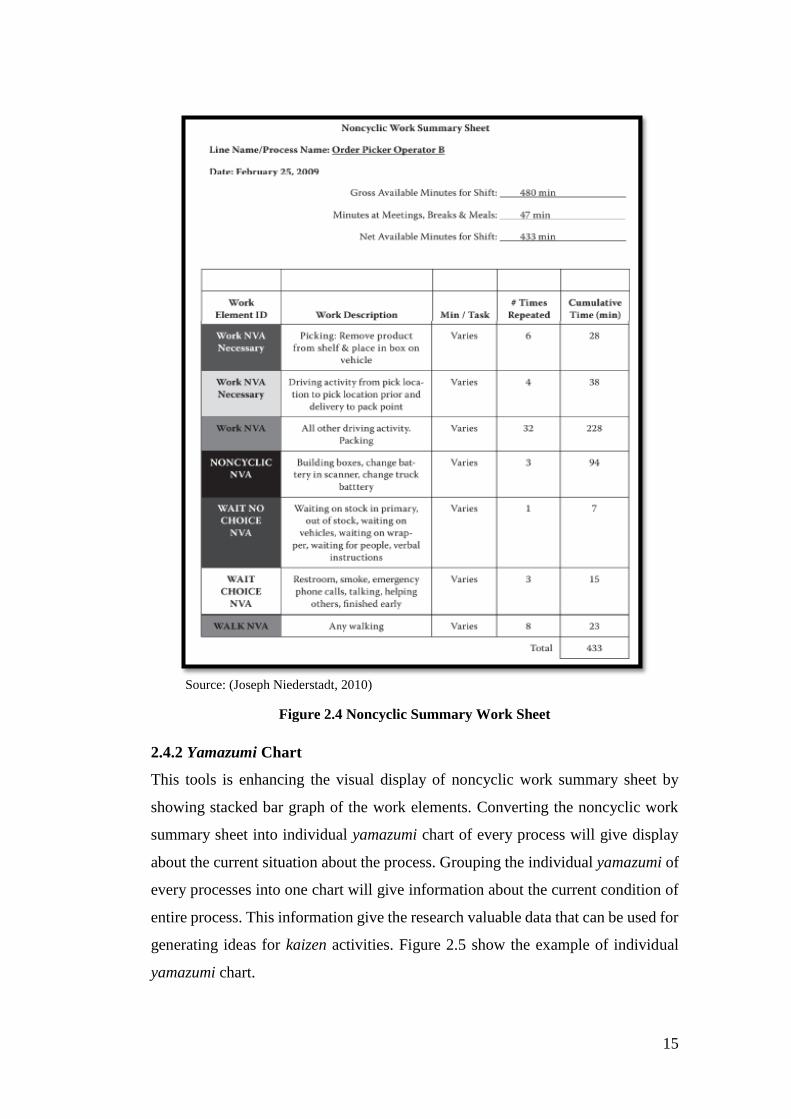
2.4.1 Noncyclical Work Summary Sheet
This tools help listing every work elements in one shift for a noncyclical works in
type III standardized works. This tools can give information about non-value added
necessary and non-value added activities. Both categories can be divided to
different names in order to give more explanation about the work elements. Figure
2.4 will show the display of noncyclical work summary sheet.
From example in figure 2.4, it is noncyclical work summary sheet for process Order
Picker Operator B. This process have net available time is 433 minutes, this come
from gross available time (480 minutes) minus break times (47 minutes). This 433
minutes is divided into non-value added necessary and non-value added activities.
Both activates is divided again to different categories for more details. Non-value
added necessary activities is divided into Work NVA Necessary. And, non-value
added activities is divided into Work NVA, Wait No Choice NVA, Walk NVA, and
so on. The total time of non-value added necessary and non-value added activities
is equal to net available time of the process. The purpose of dividing the process
into different work element ID is to help the research identify which task have
potential for improvement.
15
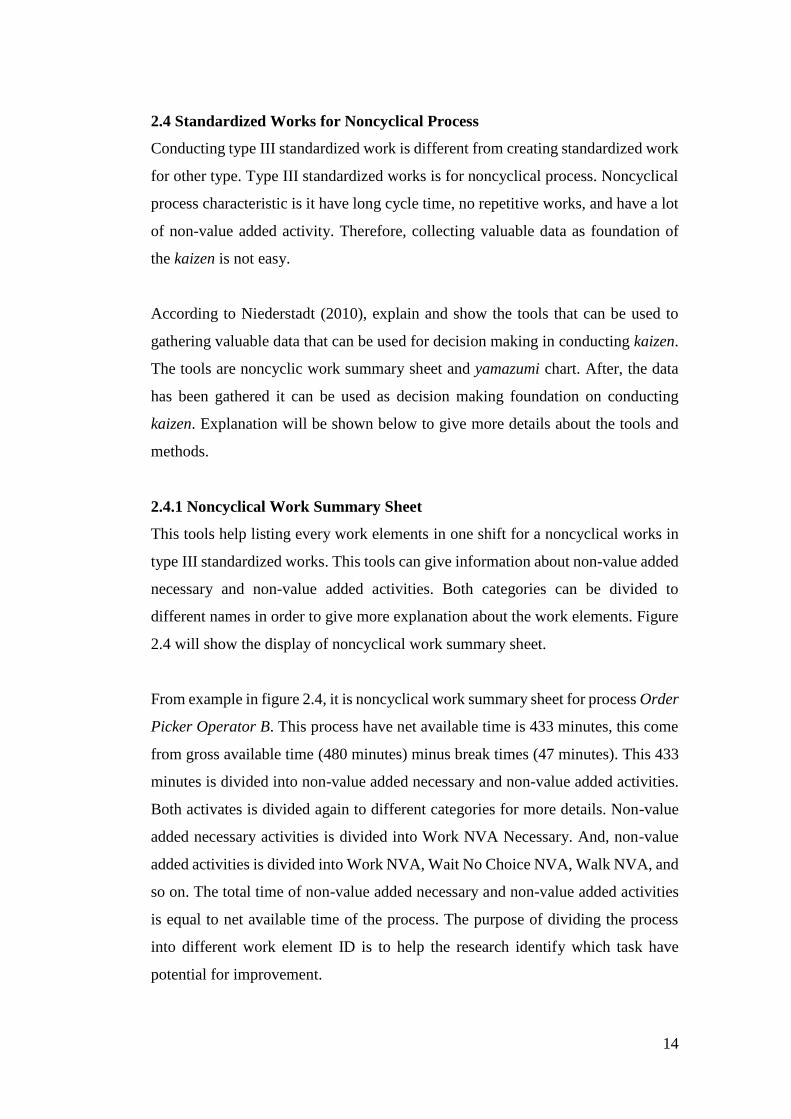
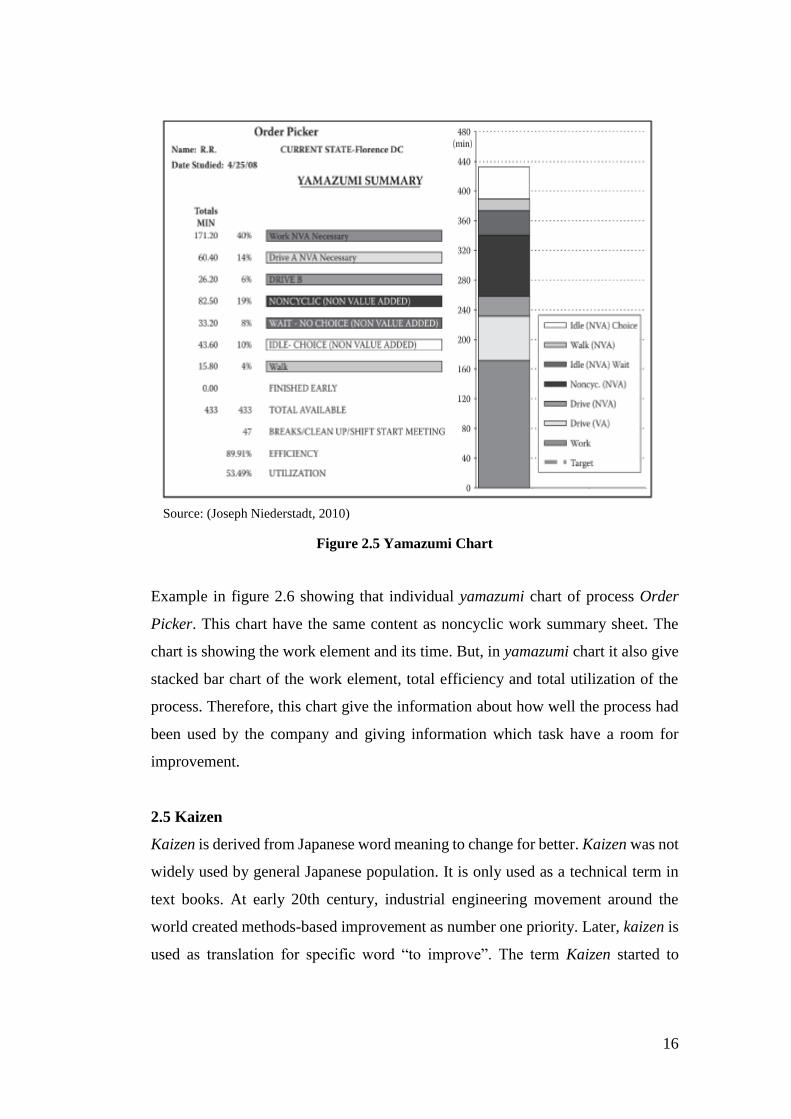
2.4.2 Yamazumi Chart
This tools is enhancing the visual display of noncyclic work summary sheet by
showing stacked bar graph of the work elements. Converting the noncyclic work
summary sheet into individual yamazumi chart of every process will give display
about the current situation about the process. Grouping the individual yamazumi of
every processes into one chart will give information about the current condition of
entire process. This information give the research valuable data that can be used for
generating ideas for kaizen activities. Figure 2.5 show the example of individual
yamazumi chart.
Source: (Joseph Niederstadt, 2010)
Figure 2.4 Noncyclic Summary Work Sheet
16
Example in figure 2.6 showing that individual yamazumi chart of process Order
Picker. This chart have the same content as noncyclic work summary sheet. The
chart is showing the work element and its time. But, in yamazumi chart it also give
stacked bar chart of the work element, total efficiency and total utilization of the
process. Therefore, this chart give the information about how well the process had
been used by the company and giving information which task have a room for
improvement.
2.5 Kaizen
Kaizen is derived from Japanese word meaning to change for better. Kaizen was not
widely used by general Japanese population. It is only used as a technical term in
text books. At early 20th century, industrial engineering movement around the
world created methods-based improvement as number one priority. Later, kaizen is
used as translation for specific word “to improve”. The term Kaizen started to
Source: (Joseph Niederstadt, 2010)
Figure 2.5 Yamazumi Chart
17
proliferate inside Toyota in the 1950s and 1960s as an ongoing part of Toyota
Production System (TPS) development (Kato & Smalley, 2010).
The advantage of conducting according to Imai (1986), worker can give ideas for
kaizen activities therefore make the worker feel responsible and improve their
involvement in the process. Brunet (2000) stated that kaizen is focusing in smaller,
self-managing groups, consolidate team-working therefore give the worker sense
of cooperation and greater understanding of change. Womack and Jones (1996) also
mentioned, kaizen is facilitating correction for activities that absorb resources but
add no value, then turning it to better process even can adding value.
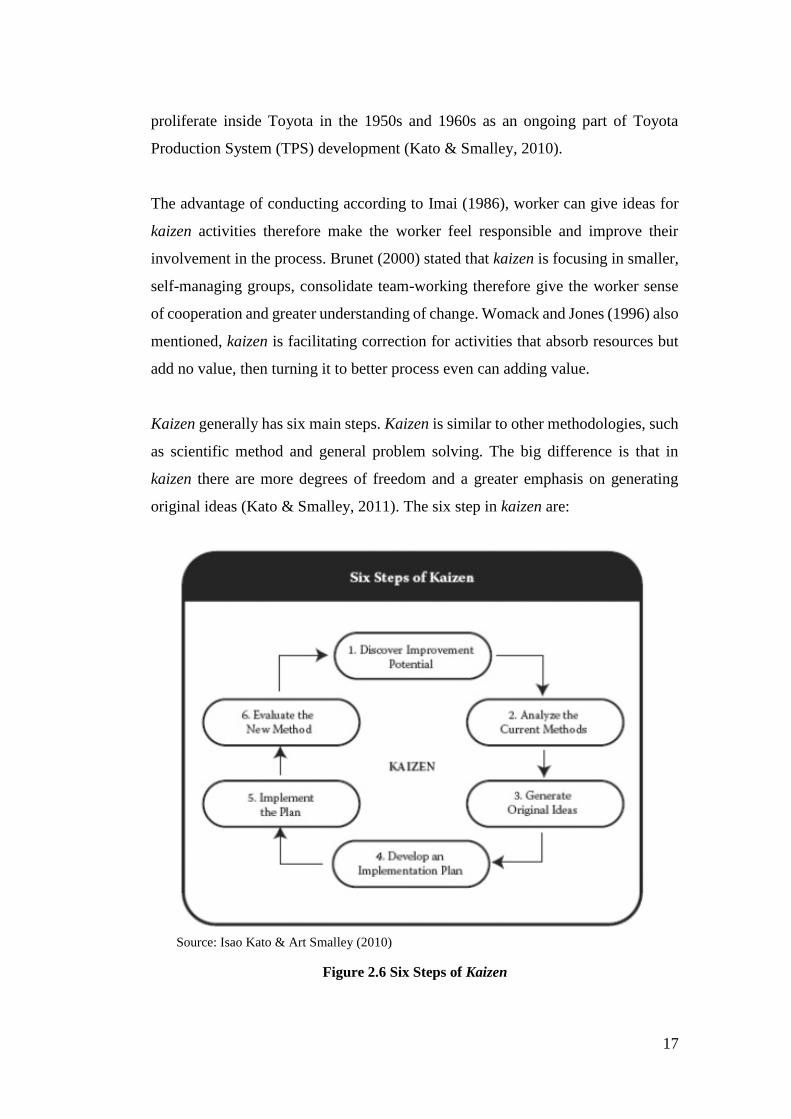
Kaizen generally has six main steps. Kaizen is similar to other methodologies, such
as scientific method and general problem solving. The big difference is that in
kaizen there are more degrees of freedom and a greater emphasis on generating
original ideas (Kato & Smalley, 2011). The six step in kaizen are:
Source: Isao Kato & Art Smalley (2010)
Figure 2.6 Six Steps of Kaizen
18
Step 1: Discover the Improvement Potential
The first step require individual to be able to see improvement potential. This first
step of kaizen is an exercise in helping individuals learn to see different types of
waste, inefficiency, problems, and areas for improvement. The knowledge can
come from experience or training.
Step 2: Analyze the Current Methods
The second step is analyzing the process of current methods. This step require
individual to understand the process inside the improvement area. Various
technique can be used to analyze the methods. The research need to choose
techniques that fit with type of works in improvement area.
Step 3: Generate Original Ideas
The third step is generating ideas to solve the problems. The third step involves
synthesis as much as or more than analysis. The ideas can come from analytical
way, however, it also can come from creative thinking of individuals.
Brainstorming the problem with kaizen team to have a lot of ideas to overcome the
problem is important. Every individual have their unique ways in viewing and
solving the problem. Therefore, resulting in ideas with low cost implementation
with big impact.
Step 4: Develop Implementation Plan
After analyze and generate ideas, the next step is to develop plan to implement the
improvement ideas. For example when to start the implementation, who is in charge
to supervise the implementation, preparing required equipment, etc.
Step 5: Implement the Plan
After implementation plan had been developed, the next step is to implement the
plan in improvement area. In implementing the plan the kaizen team must have
coordination with each other in order to keep the plan on its path.
19
Step 6: Evaluate the New Method
The last step is to review the result of kaizen implementation. The results is
measured and compare with condition before improvement. Deciding if the kaizen
is changing the process to be a better works or there are still room for improvement
in the process.
2.6 Manpower Efficiency & Utilization
Efficiency is producing desired result with a minimum of effort, expense, or waste
(Niederstadt, 2010). The formula used to calculate efficiency for type III
standardized works are:
Efficiency =Cycle Time
Total Available time × 100%
The calculation is total cycle time of the process divide by total available time
multiply with 100%. Cycle time is the cumulative time of non-value added
necessary and non-value added activities minus idle time. Available time is total
time given in one shift including break time. Efficiency showing the worker effort
to finishing their works in given available time in one shift. However, it cannot
show how well the resources is used.
Utilization is defined as optimizing resources that available. Utilization can show
how well the resources had been used. Using the worker to as optimum as possible
mean optimizing cost. The formula used to calculate based for type III standardized
works are:
Utilization =Sum of NVA Necessary
Total Available Time × 100%
The calculation is sum of non-value added necessary activities of the process
divided by total available time multiply by 100%. Sum of NVA Necessary is
cumulative time of non-value added necessary work element. Total available time
is total given time in one shift including break times. Utilization show only
(2.1)
(2.2)
20
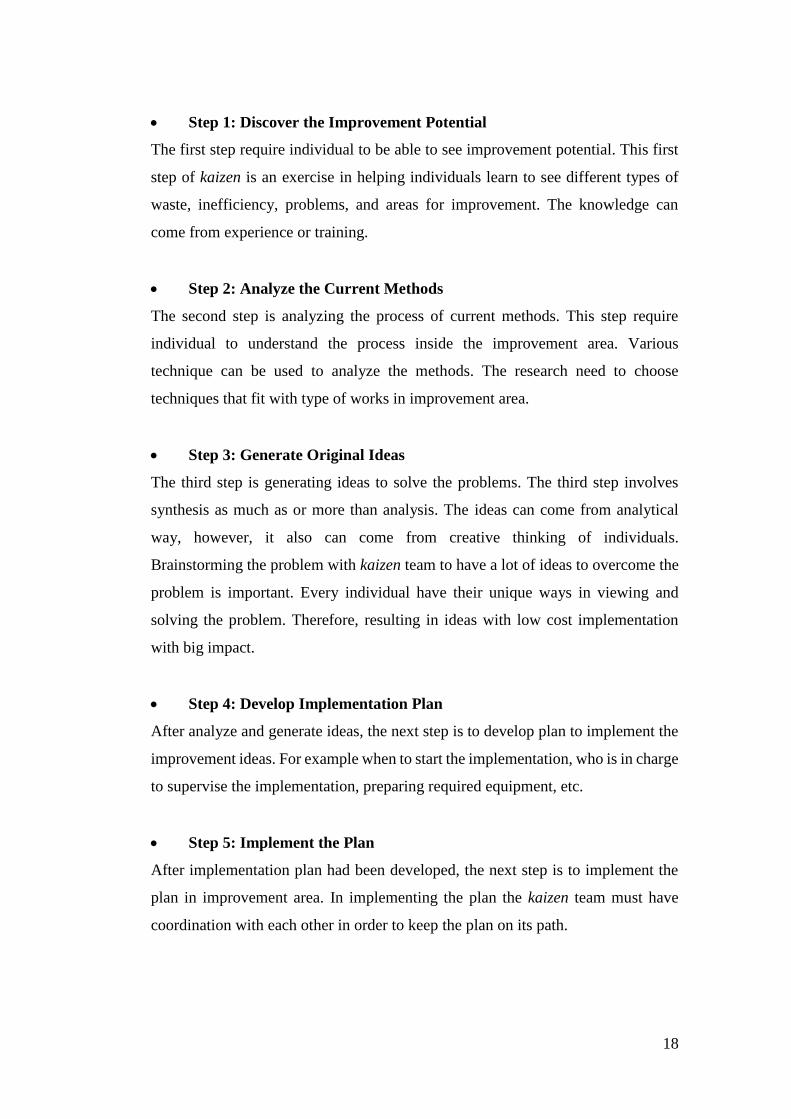
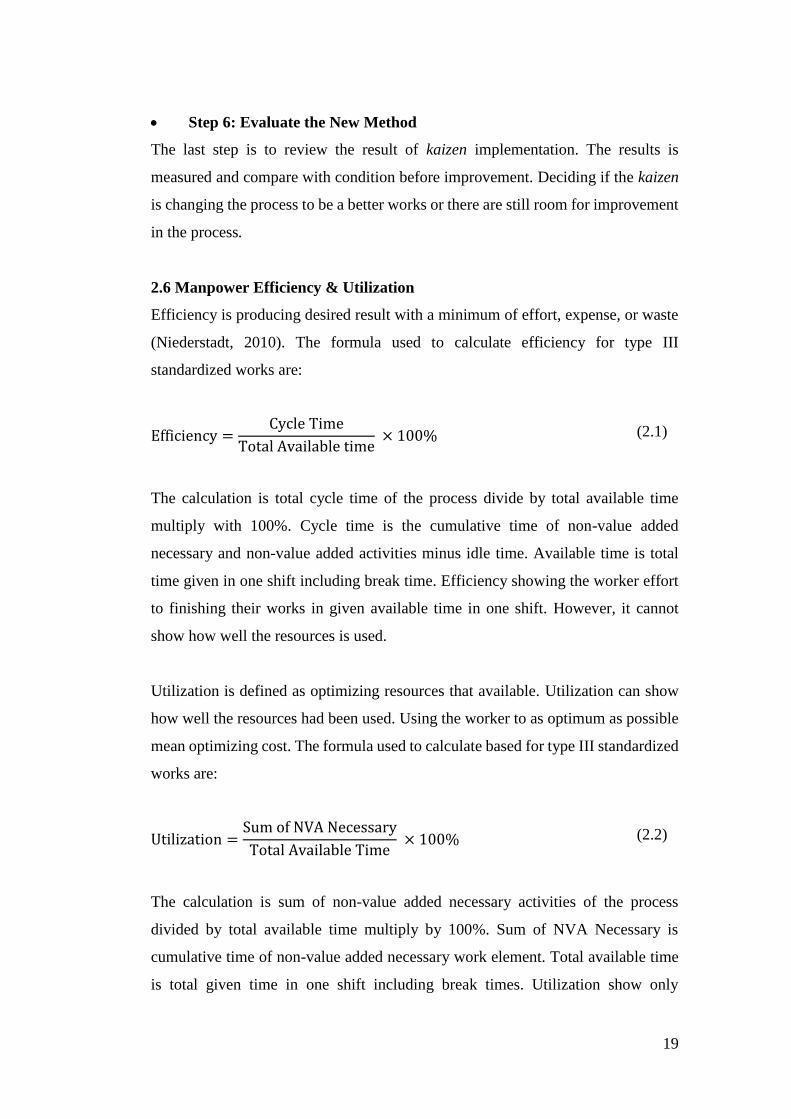
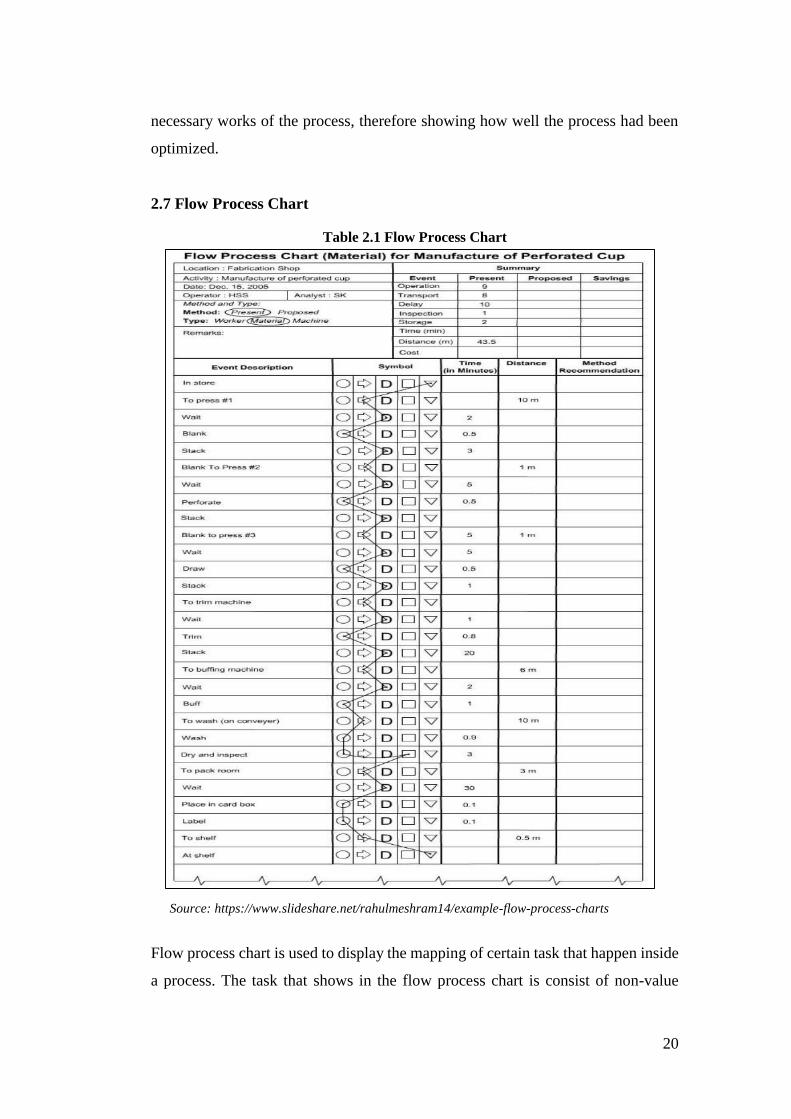
Table 2.1 Flow Process Chart
necessary works of the process, therefore showing how well the process had been
optimized.
2.7 Flow Process Chart
Source: https://www.slideshare.net/rahulmeshram14/example-flow-process-charts
Flow process chart is used to display the mapping of certain task that happen inside
a process. The task that shows in the flow process chart is consist of non-value
21
added necessary and non-value added activities. Flow process chart for this research
will be used to show which activities that can be improved to increase the manpower
efficiency and utilization. Table 2.1 will show the display of general flow process
chart.
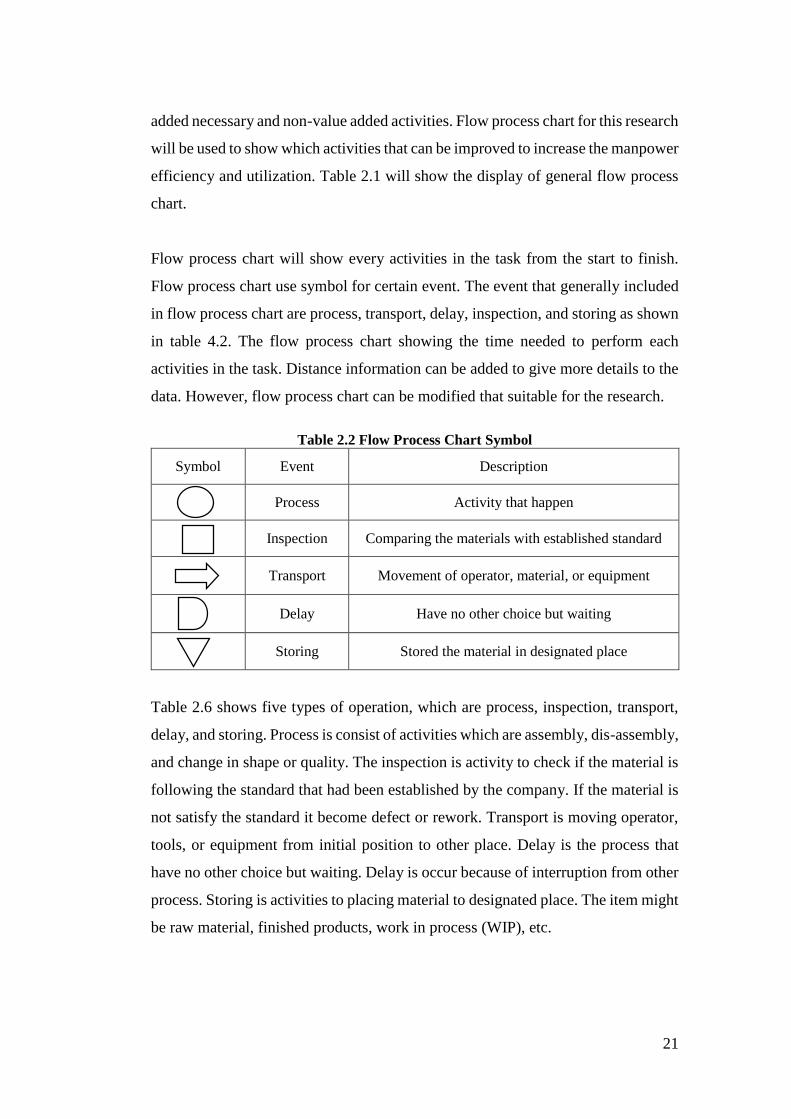
Flow process chart will show every activities in the task from the start to finish.
Flow process chart use symbol for certain event. The event that generally included
in flow process chart are process, transport, delay, inspection, and storing as shown
in table 4.2. The flow process chart showing the time needed to perform each
activities in the task. Distance information can be added to give more details to the
data. However, flow process chart can be modified that suitable for the research.
Table 2.2 Flow Process Chart Symbol
Symbol Event Description
Process Activity that happen
Inspection Comparing the materials with established standard
Transport Movement of operator, material, or equipment
Delay Have no other choice but waiting
Storing Stored the material in designated place
Table 2.6 shows five types of operation, which are process, inspection, transport,
delay, and storing. Process is consist of activities which are assembly, dis-assembly,
and change in shape or quality. The inspection is activity to check if the material is
following the standard that had been established by the company. If the material is
not satisfy the standard it become defect or rework. Transport is moving operator,
tools, or equipment from initial position to other place. Delay is the process that
have no other choice but waiting. Delay is occur because of interruption from other
process. Storing is activities to placing material to designated place. The item might
be raw material, finished products, work in process (WIP), etc.
22
2.8 Warehousing
Warehouse always deal with quantity-based activity. As one of the node in supply
chain, warehouse has to accommodate every material required for manufacturing
the products. Although warehouse mostly deal with quantity-based activity, it is
important to avoid confusing quantity with quality. A highly productive warehouse
operation that has high error rates, poor housekeeping, and poor service could
deteriorate to a point where quantity is no longer important.
Warehousing has been argued to be time consuming activity that does not add value
(Heragu, 2008). Maintaining warehouse need additional energy to store and record
every materials that go into the warehouse. Because of that, Toyota Production
System philosophy suggests that quantity of produced products directly correspond
to the demands, therefore reducing the amount of material and decreasing works
needed to maintain the warehouse. However, warehouse still have important
function in connecting supplier with the company production line. The general
function of warehouse will be shown in next section.
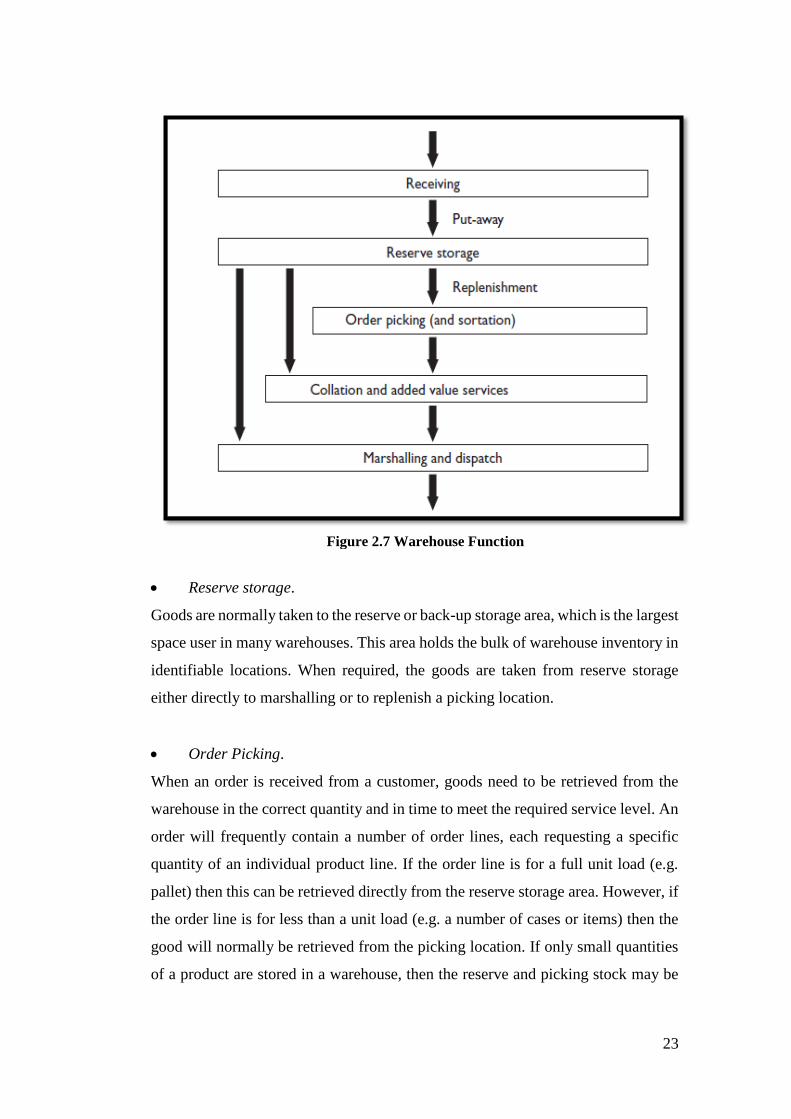
2.8.1 Warehouse Function
Every warehouse should be designed to meet specific requirements of the supply
chain of which it is a part. Nevertheless, there are certain operations that are
common to most warehouses. These tend to apply whether the warehouse is manual
in nature with fairly basics equipment or whether it is highly automated with
sophisticated storage and handling systems. These functions are as follows:
Receiving.
This typically involves the physical unloading of incoming transport, checking
against purchase orders and recording the incoming goods in the computer system.
It can also include such activities as unpacking and repacking in a format suitable
for the subsequent warehouse operations. Quality control checks may be undertakes
as part of this activity. From here, the goods are then put away in the warehouse.
23
Reserve storage.
Goods are normally taken to the reserve or back-up storage area, which is the largest
space user in many warehouses. This area holds the bulk of warehouse inventory in
identifiable locations. When required, the goods are taken from reserve storage
either directly to marshalling or to replenish a picking location.
Order Picking.
When an order is received from a customer, goods need to be retrieved from the
warehouse in the correct quantity and in time to meet the required service level. An
order will frequently contain a number of order lines, each requesting a specific
quantity of an individual product line. If the order line is for a full unit load (e.g.
pallet) then this can be retrieved directly from the reserve storage area. However, if
the order line is for less than a unit load (e.g. a number of cases or items) then the
good will normally be retrieved from the picking location. If only small quantities
of a product are stored in a warehouse, then the reserve and picking stock may be
Figure 2.7 Warehouse Function
24
combined, and goods picked from this consolidated area. Order picking is a key
warehouse operation, both in terms of cost and service, as a significant proportion
of the warehouse staff is normally required for this function and it is critical to
achieving high levels of order accuracy.
Sortation.
For small sizes of order, it is sometimes appropriate to batch a number of order
together and treat them as ‘one’ order for picking purpose. In this case, the picked
batch will have to be sorted down to individual orders before dispatch.
Collation and added value services.
Goods need to be collated into complete customer orders ready for dispatch. Unless
the goods are picked directly into the dispatch containers (e.g. directly into roll
cages or into cartons), they will be assembled or packed together after picking. For
example, the goods may be passed to a packing station where they are packed into
a carton. These may in turn be stretch-or shrink-wrapped onto a wooden pallet ready
for transit. This process may also involve final production postponement activities
and value added services, such as kitting and labelling.
Marshalling and dispatch.
Goods are marshalled together to form vehicle loads in the dispatch area and are
the loaded on to outbound vehicles for onward dispatch to the next ‘node’ in the
supply chain.
25
CHAPTER III
RESEARCH METHODOLOGY
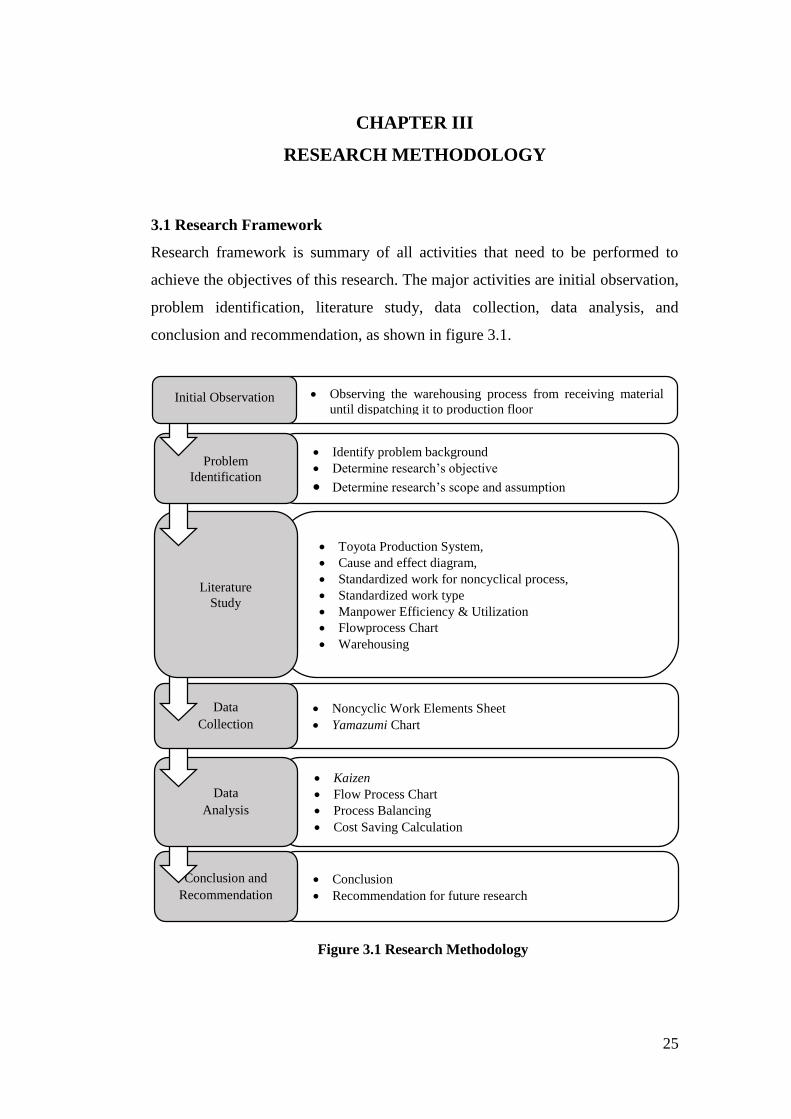
3.1 Research Framework
Research framework is summary of all activities that need to be performed to
achieve the objectives of this research. The major activities are initial observation,
problem identification, literature study, data collection, data analysis, and
conclusion and recommendation, as shown in figure 3.1.
Observing the warehousing process from receiving material
until dispatching it to production floor
Identify problem background
Determine research’s objective
Determine research’s scope and assumption
Toyota Production System,
Cause and effect diagram,
Standardized work for noncyclical process,
Standardized work type
Manpower Efficiency & Utilization
Flowprocess Chart
Warehousing
Noncyclic Work Elements Sheet
Yamazumi Chart
Kaizen
Flow Process Chart
Process Balancing
Cost Saving Calculation
Conclusion
Recommendation for future research
Conclusion and
Recommendation
Data
Analysis
Data
Collection
Literature
Study
Problem
Identification
Initial Observation
Figure 3.1 Research Methodology
26
3.1.1 Initial Observation
The initial observation is analyzing the current process condition and situation
inside warehouse 2,5. It observes total number of worker and the details of their
activities on warehouse. Beside of that, it observe the warehouse layout to
understand the flow of process and location of the workers. From the initial
observation the research has initial view on warehouse condition and some
important information that can be used to identify the problem of the warehouse.
3.1.2 Problem Identification
Observing the current process of warehousing lead the research to problems. There
is a problem regarding to manpower efficiency. The problem background will give
further explanation about manpower efficiency problem in warehouse 2,5. The
problem statement is a set of questions used for generating the objectives of the
research which is increasing manpower efficiency. The research objectives is a set
of goals used for guidance to conducting the research. The objective of the research
is to answering the problem statement that already stated which are the defining
current manpower efficiency and utilization of the process by using noncyclic work
summary sheet and yamazumi chart, difference of manpower efficiency and
utilization before and after kaizen implementation, and the economic benefits of
increasing manpower efficiency for IJK Company. Identifying problem is
important for deciding what tools and methods that will be used in conducting the
research
3.1.3 Literature Study
Literature study give further explanation about method, tools, and knowledge
related to the research. This studies based on books, journals, and past research
related to objective of this research. There will be theoretical review about Toyota
Production System. Since, IJK company system is based on Toyota Production
System. There are will be explanation about cause and effect diagram that used for
finding root causes for increasing manpower efficiency. There will be theoretical
knowledge about conducting standardized works for noncyclical process.
Warehouse 2,5 is included on type III standardized works. Because of that, to give
27
more details there will theoretical knowledge about three type of standardized
works. There are will theoretical explanation about process balancing. There are
will be explanation about manpower efficiency and utilization, also the formula to
calculate efficiency and utilization. Flow process chart is used to give detailed
display of certain task, therefore there will be theoretical knowledge about flow
process chat to give cleat explanation. Besides of that, there will be theoretical
knowledge about warehouse, to give explanation about the duties of warehouse in
manufacturing process. Lastly, literature study give theoretical explanation about
tools and methods, so the research can collected and analyzed data correctly.
3.1.4 Data Collection
All the data are taken directly from IJK Company warehouse 2,5. The research is
gathering data by individual observation and historical data recorded by the
company. The data is collected using various tools and method mentioned in
literature study. Cause and effect diagram will show possible root causes for
improving manpower efficiency. Working area layout show the location of the
worker for each process inside the warehouse. Noncyclical work element sheet
show all working elements of the worker divided to non-value added necessary and
non-value added activities, give information about duration of each work element
in the process. Yamazumi chart is used to visualize the data and help the research
for decision making and strategy to find solution. The data that had been collected
will be used as foundation for analyzing the current condition of the warehouse and
finding kaizen idea for improving the manpower efficiency.
3.1.5 Data Analysis
After the data has been collected, the next step is to analyze the problem. The
collected data will be analyzed using kaizen method. Flow process chart also will
be used to help for showing the details of the task that will be improved by the
kaizen idea. Then, kaizen ideas based on information that had been gathered in data
collecting activities. Generally kaizen has six step. The first step is to discover the
potential improvement in the area. The first steps is had been done in data collection
activities. The next five steps is include in data analyzing process. The other five
28
steps are analyze the current methods, generate original ideas, develop
implementation plan, implement the plan, and evaluate the plan. Next step, after
process non-value added activities had been reduce by kaizen the process need to
be balanced. Process balancing is used to equalize amount of cycle time or
efficiency for each process. After, process balancing the research calculate cost that
had been saved by this improvement.
3.1.6 Conclusion and Recommendation
Conclusion is the summary of the research. The result is show how the research
achieving the research using tools and method which are available. Showing before
and after condition of manpower efficiency on warehouse 2,5. And
recommendation is giving a suggestion for future research.
29
CHAPTER IV
DATA COLLECTION AND ANALYSIS
IJK Company was founded in 1982. IJK Company is one of the biggest automotive
manufacturer in Indonesia. The main products of IJK Company is rear axle and
propeller shaft for medium and light duty vehicle. The customer of IJK Company
consist of car manufacturing company from domestic international company. IJK
Company can produce hundreds of products in one day. IJK Company currently
employees 671 work force. Therefore, IJK Company always tries to develop their
competencies, to compete with other companies in South-East Asia (SEA) region.
In order to increase their competencies IJK company is conducting improvement
activities in all of their department. One of the problem IJK Company currently
facing is low manpower efficiency in their warehouse department. IJK Company
has several warehouse, each warehouse served different roles and accommodate
material for different production plants. This research is taken place in warehouse
designated to serve production plants 2 and 3. This warehouse also called
warehouse 2,5, because it is located between production plants 2 and 3. Because,
warehouse 2,5 served two production plan at once the warehousing process
efficiency need to improve to create standardized works and optimizing the
resources. Since, the salaries of the worker have likelihood to increase every year it
is important to keep the efficiency and utilization of the manpower in good shape.
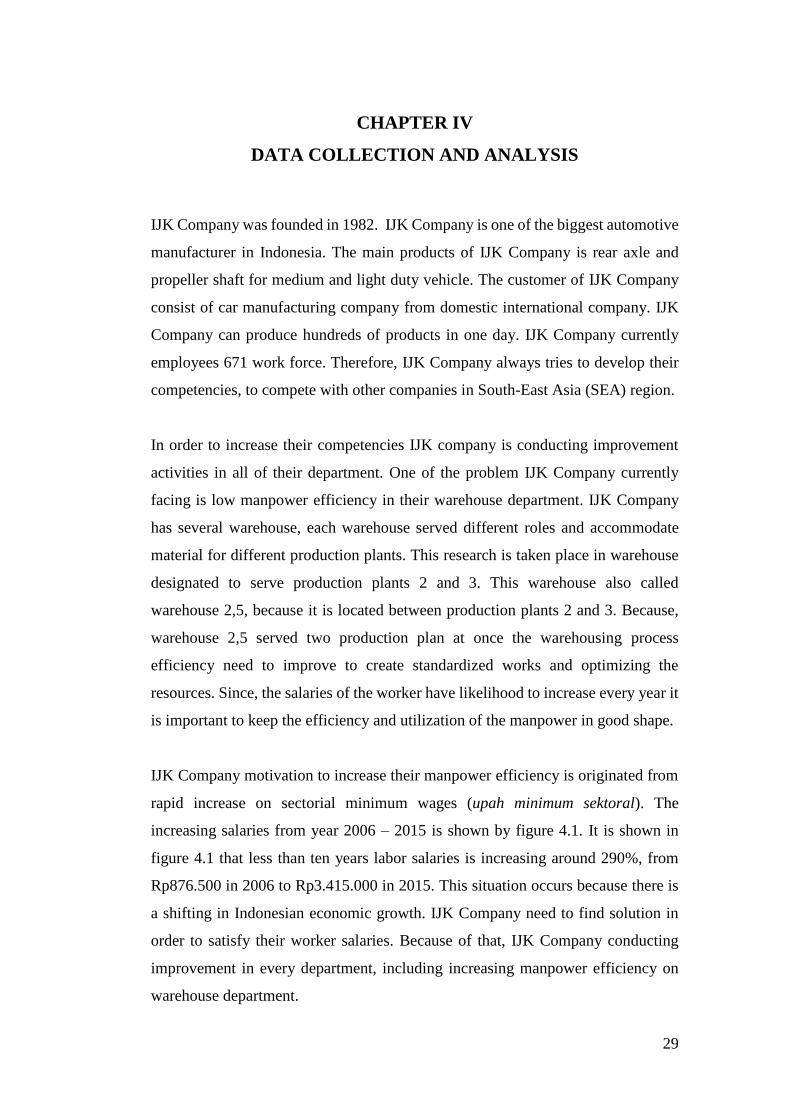
IJK Company motivation to increase their manpower efficiency is originated from
rapid increase on sectorial minimum wages (upah minimum sektoral). The
increasing salaries from year 2006 – 2015 is shown by figure 4.1. It is shown in
figure 4.1 that less than ten years labor salaries is increasing around 290%, from
Rp876.500 in 2006 to Rp3.415.000 in 2015. This situation occurs because there is
a shifting in Indonesian economic growth. IJK Company need to find solution in
order to satisfy their worker salaries. Because of that, IJK Company conducting
improvement in every department, including increasing manpower efficiency on
warehouse department.
30
Figure 4.1 Labor Salaries 2006 - 2015
The research team was created in order to find solution and idea for improving
manpower efficiency of the warehouse. Cause and effect diagram is used for
brainstorming tools to find solution for increasing manpower efficiency of
warehouse 2,5. The explanation of the cause and effect diagram details will be
showed in next sub-chapter 4.1.
4.1 Cause and Effect Diagram
The company have one year policy for every department to improve their process.
The policy is used as key performance indicator (KPI) for every head of department.
The policy stated that to increase profitability every department should manage
their manpower efficiency. Warehouse as one of the department in IJK Company
need to create improvement to fulfill the company policy. Because of that, cause
and effect diagram is created to find the problems that might causing low manpower
efficiency inside the warehouse. This diagram will help the research in choosing
tools and methods, creating improvement ideas, or creating new equipment that
31
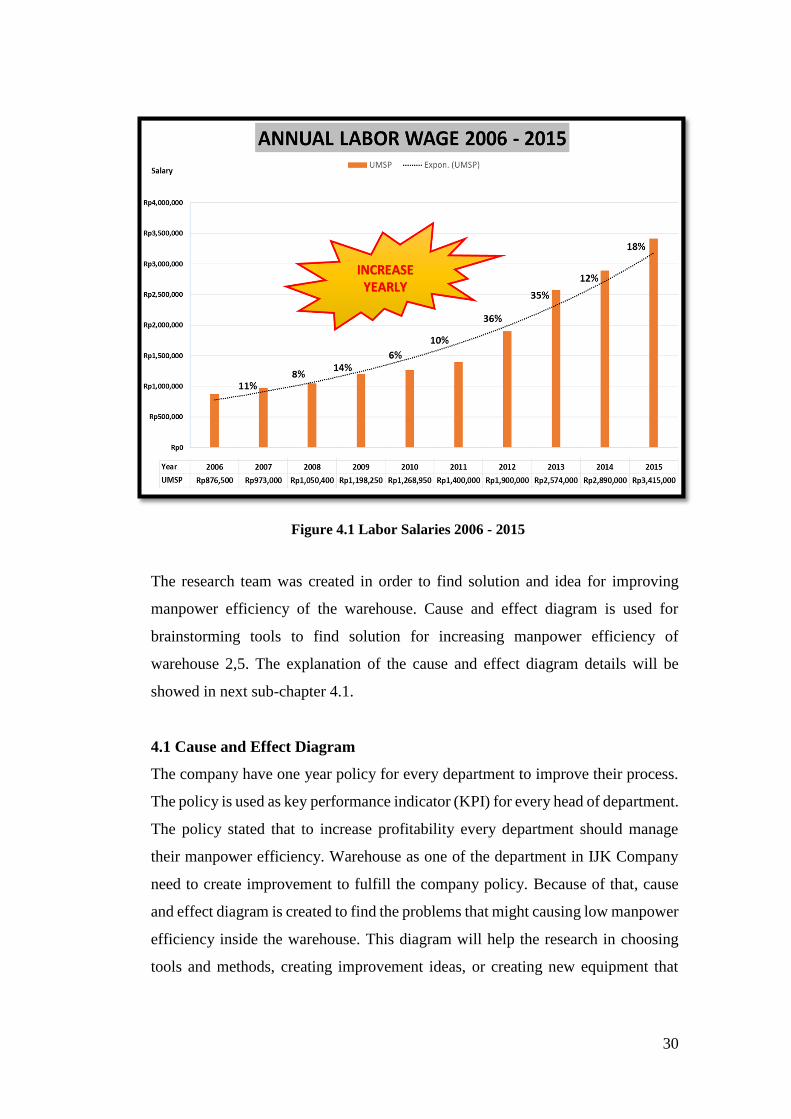
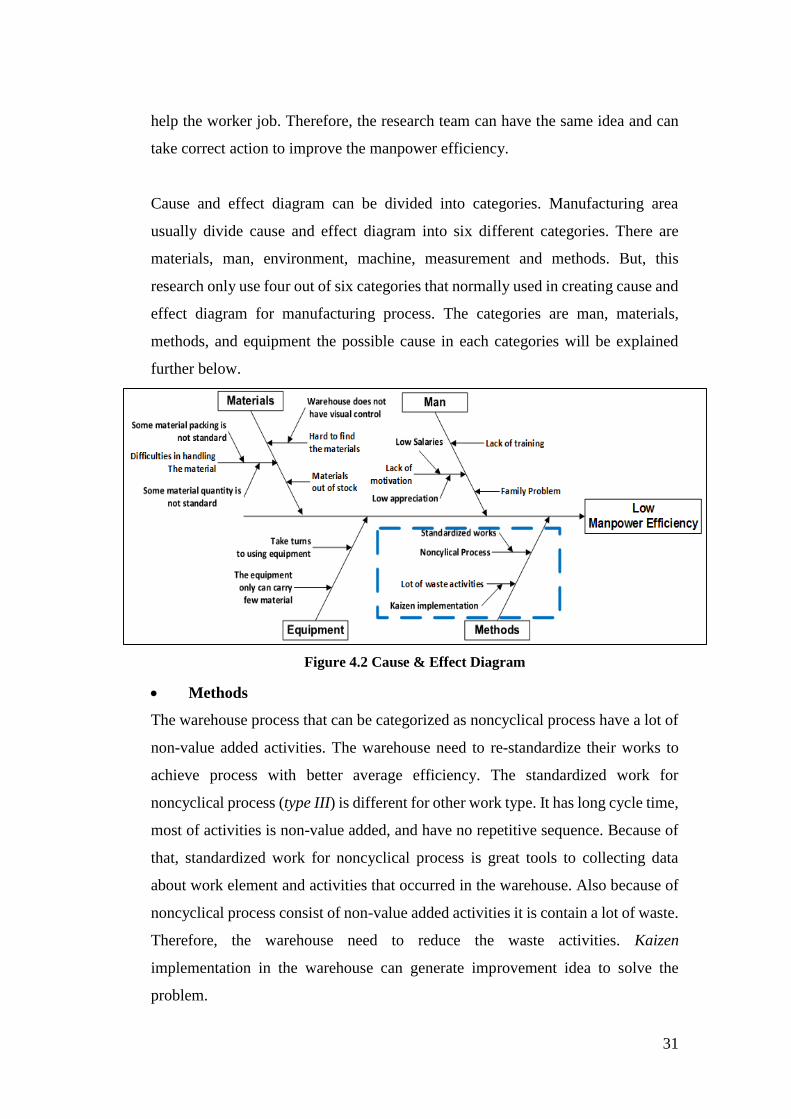
Figure 4.2 Cause & Effect Diagram
help the worker job. Therefore, the research team can have the same idea and can
take correct action to improve the manpower efficiency.
Cause and effect diagram can be divided into categories. Manufacturing area
usually divide cause and effect diagram into six different categories. There are
materials, man, environment, machine, measurement and methods. But, this
research only use four out of six categories that normally used in creating cause and
effect diagram for manufacturing process. The categories are man, materials,
methods, and equipment the possible cause in each categories will be explained
further below.
Methods
The warehouse process that can be categorized as noncyclical process have a lot of
non-value added activities. The warehouse need to re-standardize their works to
achieve process with better average efficiency. The standardized work for
noncyclical process (type III) is different for other work type. It has long cycle time,
most of activities is non-value added, and have no repetitive sequence. Because of
that, standardized work for noncyclical process is great tools to collecting data
about work element and activities that occurred in the warehouse. Also because of
noncyclical process consist of non-value added activities it is contain a lot of waste.
Therefore, the warehouse need to reduce the waste activities. Kaizen
implementation in the warehouse can generate improvement idea to solve the
problem.
32
Man
The worker as the actor in performing the process have responsibilities to
performing the process in required efficiency. But, external factor can cause their
performance to be declined. The cause and effect diagram stated three possible
cause which are lack of training, lack of motivation and family problem. Creating
good structured training curriculum that follow the standardized works of the
process will help the worker to adapt faster to the process. Therefore, increasing
their confidence in performing their works. Well trained worker will performed
poorly if does not have motivation. Because of that, company need to increase their
worker motivation. Low motivation can be caused by low salaries and low
appreciation. The worker will not give their best performance if the company do
not appreciate their hard works. The worker also does not have good performance
if they have family problem or social life problem in their house. This condition
will affect their efficiency in performing their works in the warehouse.
Materials
Warehouse main duty is to accommodate materials that supplier deliver to the
company. Warehouse have to deal with a lot of different materials. Because of that,
the worker sometimes have difficulties in searching the material inside the
warehouse. Lack of visual control inside the warehouse give difficulties for the
worker in finding the location of certain material. Beside of that, the worker also
have difficulties in handling material because of non-standard material packing and
quantity. The result from this situation is over processing in handling the material
in warehouse causing low manpower efficiency. The worst situation is when the
material out of stock, forcing the worker to idling.
Equipment
Warehouse is using a lot of tools and equipment to handle materials in their working
area. Inadequate equipment will affect performance of the worker. The cause and
effect diagram stated that are two possible causes. The possible cause are the worker
need to take turns for using the equipment and the equipment only can carry few
material. Therefore, the worker will have difficulties in handling the materials in
33
order to finish certain activities. This condition will further reducing manpower
efficiency in the warehouse.
The possible cause that had been given in cause and effect diagram is the reason of
low manpower efficiency in the warehouse. From all of the possible cause, method
offer solution that have low cost but affect the process greatly. Therefore, the
research will focused in using this methods for solving the manpower efficiency
problem. But, before collecting and analyzing the process in the warehouse first the
research have to know layout design of the warehouse. Layout design in sub-chapter
4.2 will give information about amount of process, main location for the process,
and the process description.
4.2 Layout Design
Layout design is used for mapping location of each process inside the warehouse.
Information from layout design is useful when gathering data about work elements
for each process. The location that displayed in layout design is the main location
of the process. Therefore, the worker spend most of their time around that area.
Figure 4.3 is displaying the initial layout of the warehouse.
As shown by figure 4.3 the warehouse is medium sized area with a shape of
rectangle with total area around 2772 m2. It is located between two production
plants which are production plant 2 and plant 3. Production plant 2 is manufacturing
housing and machining axle shaft, both item will be used as one of component for
production process in plant 3. Production plant 3 have assembling line for rear axle
and propeller shaft and machining line for yoke, companion flange, pinion shaft.
Both production plant is served by warehouse 2,5 therefore there are a lot of
different type of material for different type of product models. The warehousing
process make sure the material that accommodated in the warehouse can be
delivered to correct production line and for correct models.
There are nine process of works in the warehouse. Each process have their own
identification, for example receiving is called MP1, and also MP is the abbreviation
34
for manpower. These nine process is important works to make sure the material
from supplier to be received, checked, stored, and delivered correctly. These nine
process is divided into three zone which are receiving zone, material picking and
sorting zone, and storing zone. In figure 4.3 each zone is represented by dashing
line with different color. The purpose of dividing into three different zone is to help
facilitate standardized the works. Therefore improvement can be focused into each
zone separately, for example work elements of a process in receiving zone cannot
be moved into one of process in material picking and sorting zone. Because, the
main location of both process are far apart from each other and both served different
function. Explanation about each working zone and the process inside of it will be
explained below.
Receiving Zone
This zone is represented by dashing line with blue colors in figure 4.3. This area
main function is for serving the supplier that delivered their material to the
warehouse. There are two process that included in this zone they are:
i. Receiving (Id: MP1)
This process main duties is to check quantity of material that supplier delivered to
warehouse and record it to supplier arrival report book. For checking quantity the
worker have to comparing actual quantity on truck with quantity written in delivery
order. This activities is important to make sure the company get right amount
material that they had been ordered.
ii. Forklift Receiving (Id: MP2)
The forklift driver is used for loading and unloading activities in receiving area.
The main duties for this worker is to unloading material from supplier truck to
receiving area. Beside of that, this process also served other purpose such as
delivering material to several place, loading empty pallet to supplier truck, and
dumping garbage of warehouse.
35
Material Picking and Sorting Zone
In figure 4.3 this zone is represented by dashing line with orange colors. This zone
have the most process, there are six process included in this zone. The process
consist of work to picking up material according to production order, sorting up
material for different product models, and replenishing shutter of material. The six
process in this zone are:
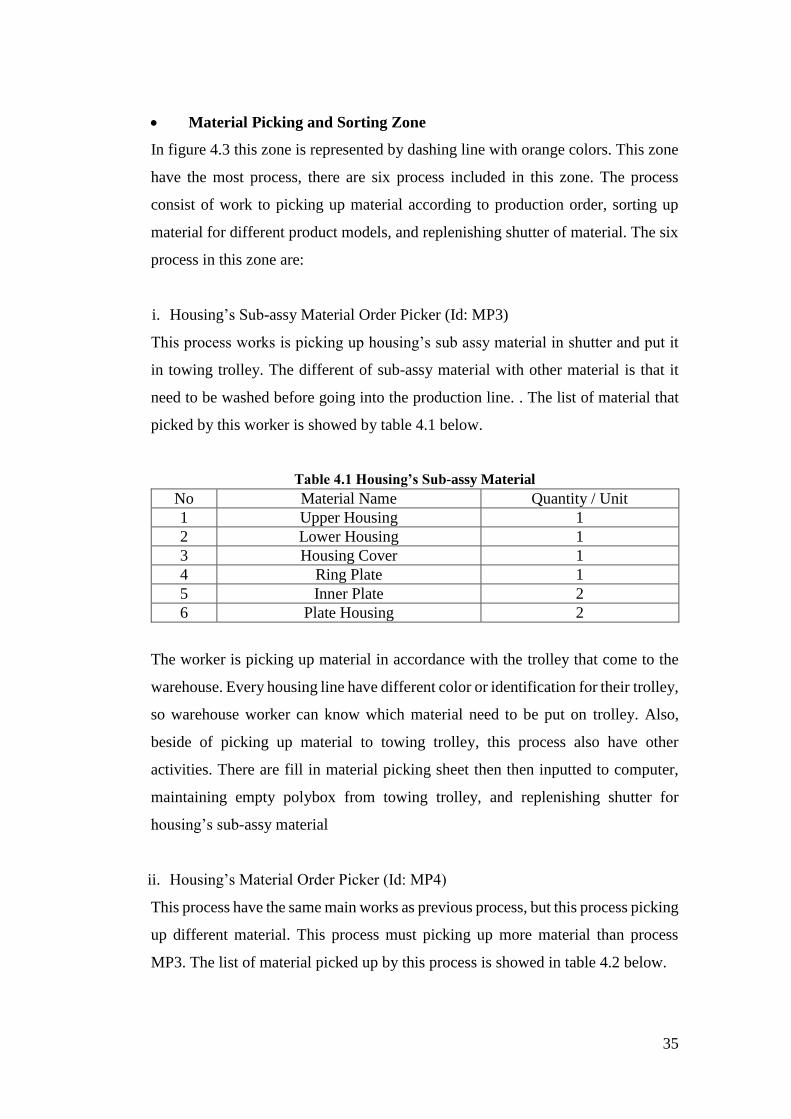
i. Housing’s Sub-assy Material Order Picker (Id: MP3)
This process works is picking up housing’s sub assy material in shutter and put it
in towing trolley. The different of sub-assy material with other material is that it
need to be washed before going into the production line. . The list of material that
picked by this worker is showed by table 4.1 below.
Table 4.1 Housing’s Sub-assy Material
The worker is picking up material in accordance with the trolley that come to the
warehouse. Every housing line have different color or identification for their trolley,
so warehouse worker can know which material need to be put on trolley. Also,
beside of picking up material to towing trolley, this process also have other
activities. There are fill in material picking sheet then then inputted to computer,
maintaining empty polybox from towing trolley, and replenishing shutter for
housing’s sub-assy material
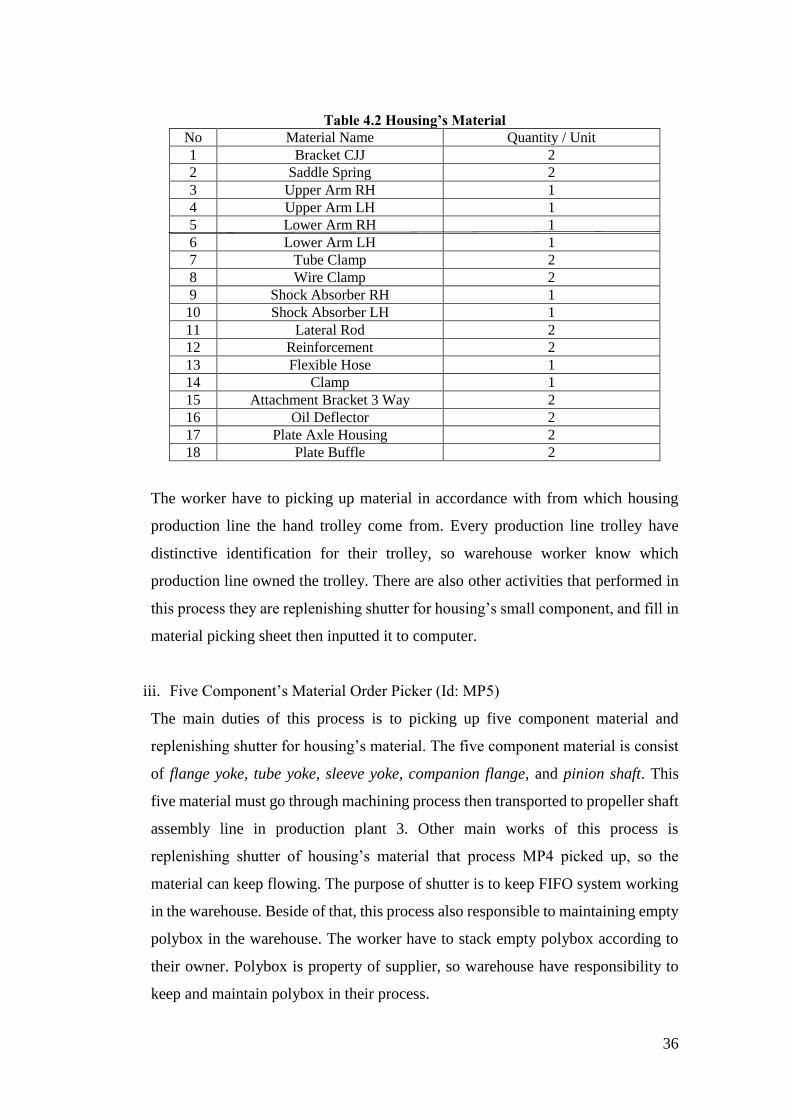
ii. Housing’s Material Order Picker (Id: MP4)
This process have the same main works as previous process, but this process picking
up different material. This process must picking up more material than process
MP3. The list of material picked up by this process is showed in table 4.2 below.
No Material Name Quantity / Unit
1 Upper Housing 1
2 Lower Housing 1
3 Housing Cover 1
4 Ring Plate 1
5 Inner Plate 2
6 Plate Housing 2
36
Table 4.2 Housing’s Material
No Material Name Quantity / Unit
1 Bracket CJJ 2
2 Saddle Spring 2
3 Upper Arm RH 1
4 Upper Arm LH 1
5 Lower Arm RH 1
6 Lower Arm LH 1
7 Tube Clamp 2
8 Wire Clamp 2
9 Shock Absorber RH 1
10 Shock Absorber LH 1
11 Lateral Rod 2
12 Reinforcement 2
13 Flexible Hose 1
14 Clamp 1
15 Attachment Bracket 3 Way 2
16 Oil Deflector 2
17 Plate Axle Housing 2
18 Plate Buffle 2
The worker have to picking up material in accordance with from which housing
production line the hand trolley come from. Every production line trolley have
distinctive identification for their trolley, so warehouse worker know which
production line owned the trolley. There are also other activities that performed in
this process they are replenishing shutter for housing’s small component, and fill in
material picking sheet then inputted it to computer.
iii. Five Component’s Material Order Picker (Id: MP5)
The main duties of this process is to picking up five component material and
replenishing shutter for housing’s material. The five component material is consist
of flange yoke, tube yoke, sleeve yoke, companion flange, and pinion shaft. This
five material must go through machining process then transported to propeller shaft
assembly line in production plant 3. Other main works of this process is
replenishing shutter of housing’s material that process MP4 picked up, so the
material can keep flowing. The purpose of shutter is to keep FIFO system working
in the warehouse. Beside of that, this process also responsible to maintaining empty
polybox in the warehouse. The worker have to stack empty polybox according to
their owner. Polybox is property of supplier, so warehouse have responsibility to
keep and maintain polybox in their process.
37
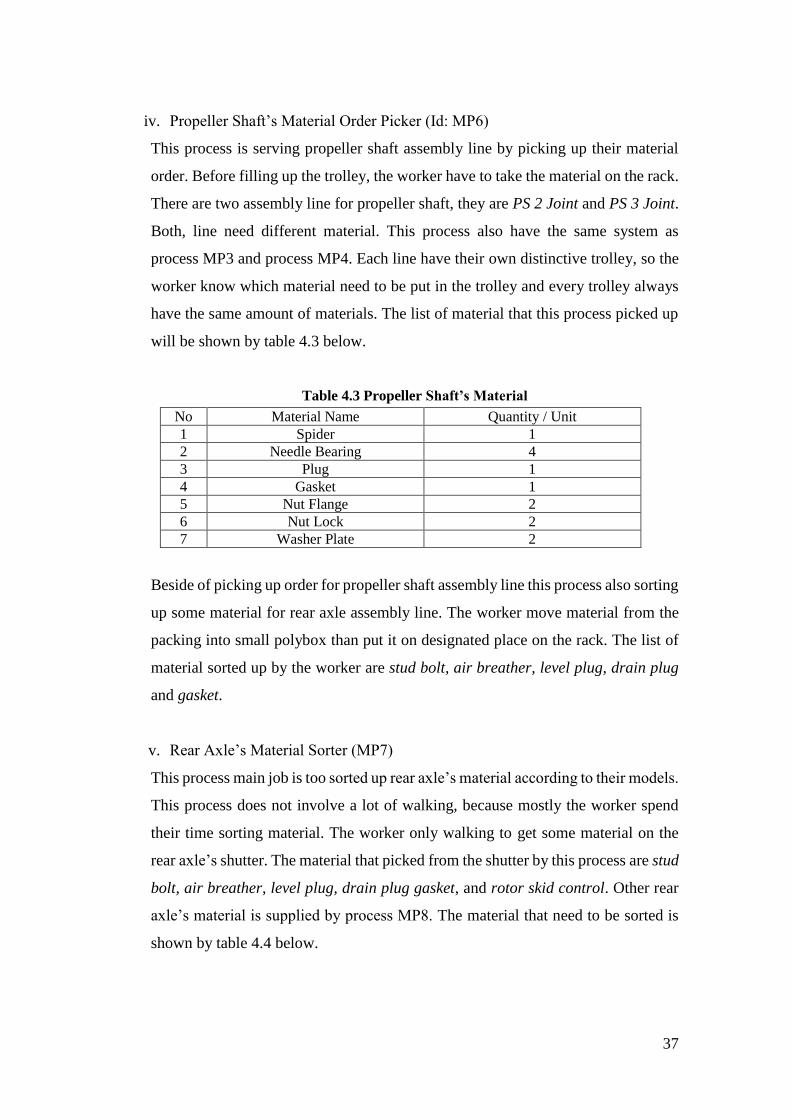
iv. Propeller Shaft’s Material Order Picker (Id: MP6)
This process is serving propeller shaft assembly line by picking up their material
order. Before filling up the trolley, the worker have to take the material on the rack.
There are two assembly line for propeller shaft, they are PS 2 Joint and PS 3 Joint.
Both, line need different material. This process also have the same system as
process MP3 and process MP4. Each line have their own distinctive trolley, so the
worker know which material need to be put in the trolley and every trolley always
have the same amount of materials. The list of material that this process picked up
will be shown by table 4.3 below.
Table 4.3 Propeller Shaft’s Material
Beside of picking up order for propeller shaft assembly line this process also sorting
up some material for rear axle assembly line. The worker move material from the
packing into small polybox than put it on designated place on the rack. The list of
material sorted up by the worker are stud bolt, air breather, level plug, drain plug
and gasket.
v. Rear Axle’s Material Sorter (MP7)
This process main job is too sorted up rear axle’s material according to their models.
This process does not involve a lot of walking, because mostly the worker spend
their time sorting material. The worker only walking to get some material on the
rear axle’s shutter. The material that picked from the shutter by this process are stud
bolt, air breather, level plug, drain plug gasket, and rotor skid control. Other rear
axle’s material is supplied by process MP8. The material that need to be sorted is
shown by table 4.4 below.
No Material Name Quantity / Unit
1 Spider 1
2 Needle Bearing 4
3 Plug 1
4 Gasket 1
5 Nut Flange 2
6 Nut Lock 2
7 Washer Plate 2
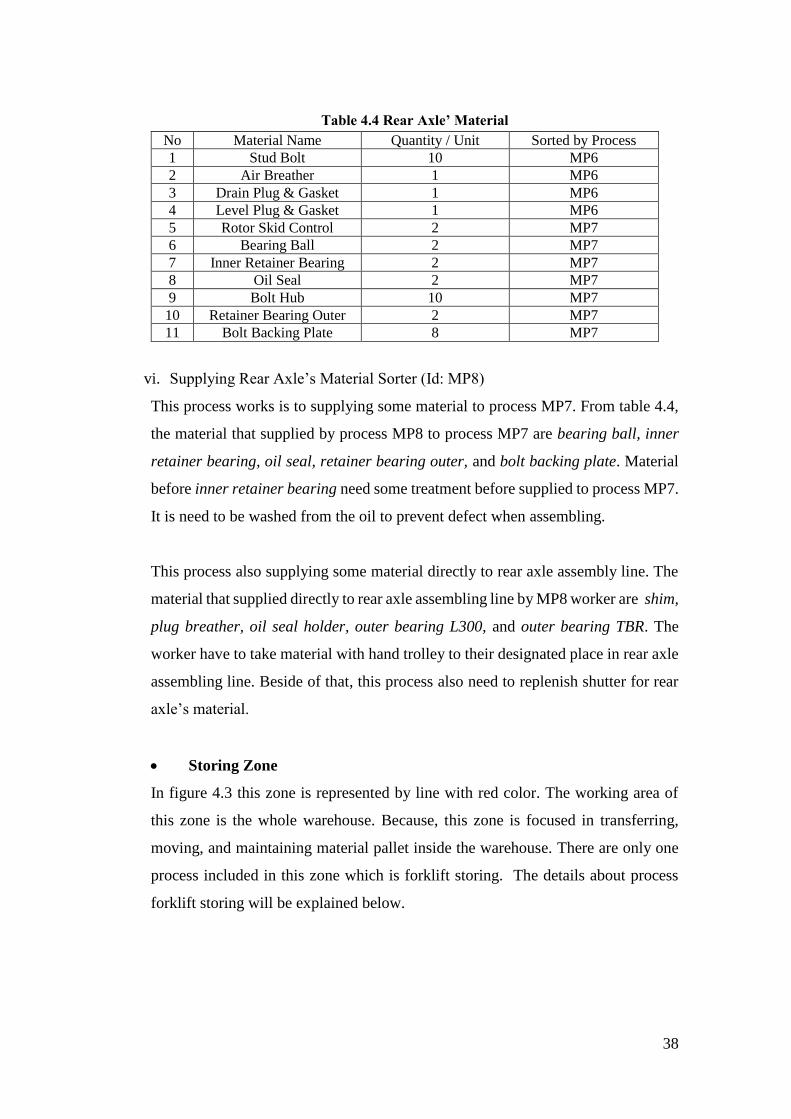
38
Table 4.4 Rear Axle’ Material
vi. Supplying Rear Axle’s Material Sorter (Id: MP8)
This process works is to supplying some material to process MP7. From table 4.4,
the material that supplied by process MP8 to process MP7 are bearing ball, inner
retainer bearing, oil seal, retainer bearing outer, and bolt backing plate. Material
before inner retainer bearing need some treatment before supplied to process MP7.
It is need to be washed from the oil to prevent defect when assembling.
This process also supplying some material directly to rear axle assembly line. The
material that supplied directly to rear axle assembling line by MP8 worker are shim,
plug breather, oil seal holder, outer bearing L300, and outer bearing TBR. The
worker have to take material with hand trolley to their designated place in rear axle
assembling line. Beside of that, this process also need to replenish shutter for rear
axle’s material.
Storing Zone
In figure 4.3 this zone is represented by line with red color. The working area of
this zone is the whole warehouse. Because, this zone is focused in transferring,
moving, and maintaining material pallet inside the warehouse. There are only one
process included in this zone which is forklift storing. The details about process
forklift storing will be explained below.
No Material Name Quantity / Unit Sorted by Process
1 Stud Bolt 10 MP6
2 Air Breather 1 MP6
3 Drain Plug & Gasket 1 MP6
4 Level Plug & Gasket 1 MP6
5 Rotor Skid Control 2 MP7
6 Bearing Ball 2 MP7
7 Inner Retainer Bearing 2 MP7
8 Oil Seal 2 MP7
9 Bolt Hub 10 MP7
10 Retainer Bearing Outer 2 MP7
11 Bolt Backing Plate 8 MP7
39
i. Forklift storing (Id: MP9)
This process work is to picking up and moving up material pallet or other equipment
from one place to other place. This process is important to move the material that
just received on receiving area to the rack. The forklift also serving worker in
picking and sorting zone to taking material on the rack when the material needed
by the process.
Figure 4.3 show the flow process of warehouse itself. The first gate the material
need to go through is receiving process. The material quantity is unloaded from the
truck then the worker in receiving process will check the quantity of material in the
packing. Then, forklift storing will handling material from receiving area into the
rack, later will be picked by the warehouse worker for supplying the production
line. The worker in picking and sorting zone will helping the production by giving
the right material. Therefore, warehouse is essential in connecting supplier with
production process in the company.
Understanding every process in the warehouse is important for increasing their
manpower efficiency. Knowing what the process generally does can give overview
of the process work element. The layout design already give a glance to warehouse
flow process. Therefore, giving important information for conducting next step in
the research. The next step is to collecting data of this nine process to help find
information as foundation for decision making and strategy process in planning
kaizen.
4.3 Standardized Works for Noncyclical Process
The data for conducting standardized works for noncyclical process is obtained
through direct observation to the warehouse. The research observe the work
elements of each process on the warehouse. The data is collected using noncyclic
work summary sheet and yamazumi chart. All the data that gathered will be used
for conducting kaizen.
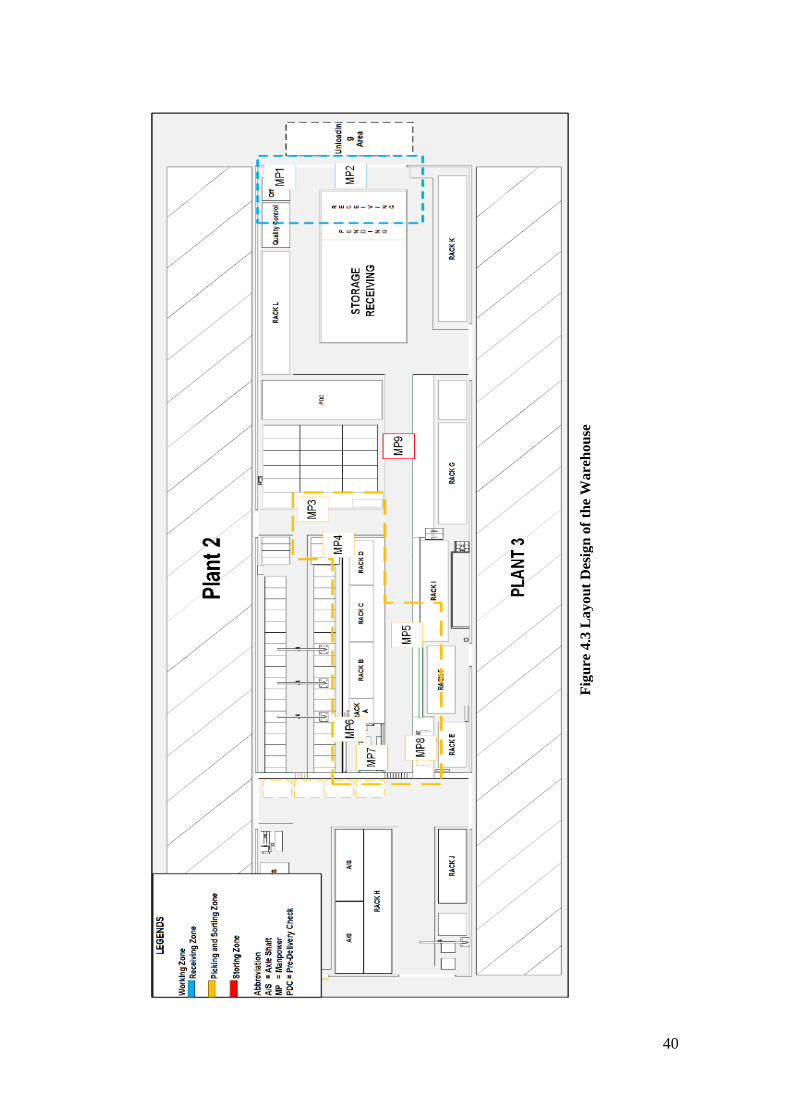
40
Fig
ure
4.3
Layou
t D
esig
n o
f th
e W
are
hou
se
41
4.3.1 Noncyclic Work Summary Sheet
The nine process that showed in figure 4.3 is observed. The result is work element
that will be summarized in noncyclic work summary sheet. The duration of work
element in every process is recorded using stopwatch. The research also record the
occurrence frequency of the work element in one shift to calculate total time of
work element. The net available time for one shift is 435 minutes, it is come from
total available time minus break time. The calculation is shown below.
Net available time = Total Available Time – Break Time
= 525 minutes – 90 minutes
= 435 minutes
Then, this research divided again non-value added necessary and non-value added
activities into five different work element categories. There are Work NVA
Necessary, Work NVA, Waiting NVA, Walking NVA, and Idle. Work NVA
Necessary is non-value added activities but have important roles in keeping the
production process running. Work NVA is non-value added activities that occur
because lack of resources such as technologies, method, and equipment. Walking
NVA is non-value added activities that require the worker to walk to finishing a
task. Waiting NVA is non-value added activities that force the worker to wait for
other process to finishing their task. Idle is any activities that have no relation with
production process. This five categories help the research to identify current
manpower efficiency and utilization of the warehouse process from MP1 – MP9.
The data of noncyclical work summary sheet had been gathered. To see the
implementation of the noncyclical work summary sheet in collecting information
about every work element on each process the result will be shown below.
Process MP1
Figure 4.4 show process MP1 (Manpower 1) work summary sheet. This process
also called receiving. Process MP1 have 242 minutes for Work NVA Necessary.
The work that included in this categories is checking material quantity from
supplier and record it on supplier arrival books. Work NVA of this process have 51
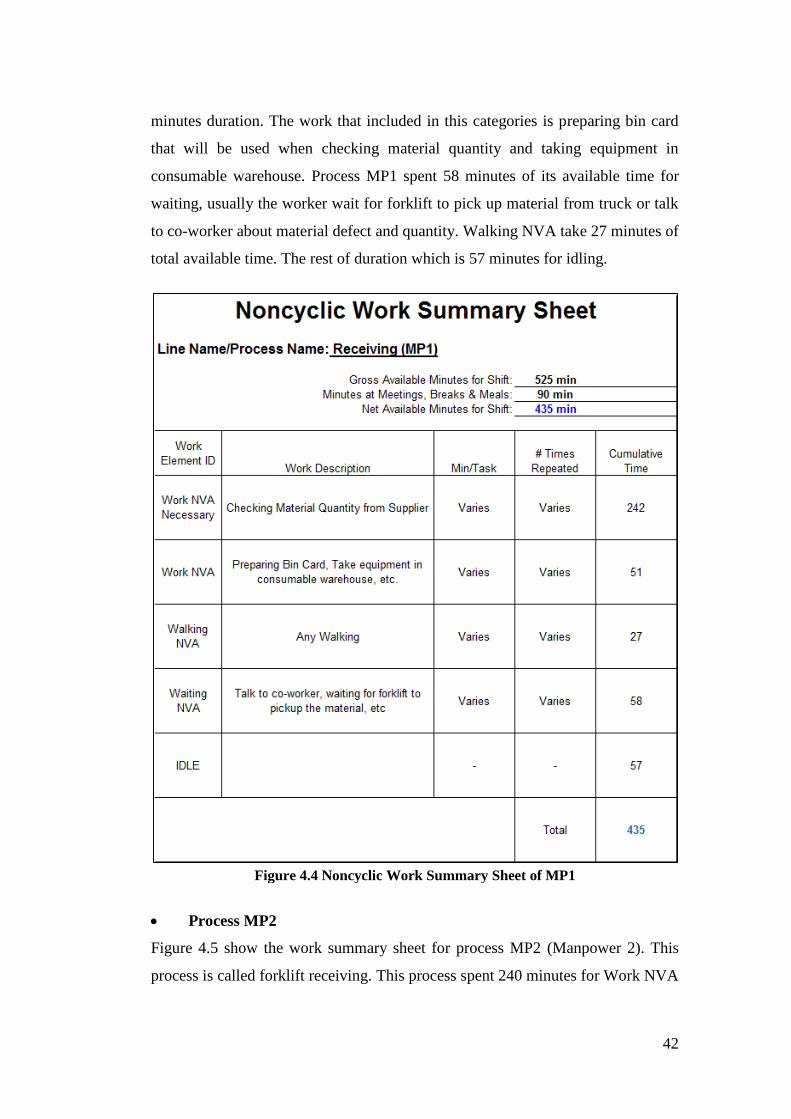
42
Figure 4.4 Noncyclic Work Summary Sheet of MP1
minutes duration. The work that included in this categories is preparing bin card
that will be used when checking material quantity and taking equipment in
consumable warehouse. Process MP1 spent 58 minutes of its available time for
waiting, usually the worker wait for forklift to pick up material from truck or talk
to co-worker about material defect and quantity. Walking NVA take 27 minutes of
total available time. The rest of duration which is 57 minutes for idling.
Process MP2
Figure 4.5 show the work summary sheet for process MP2 (Manpower 2). This
process is called forklift receiving. This process spent 240 minutes for Work NVA
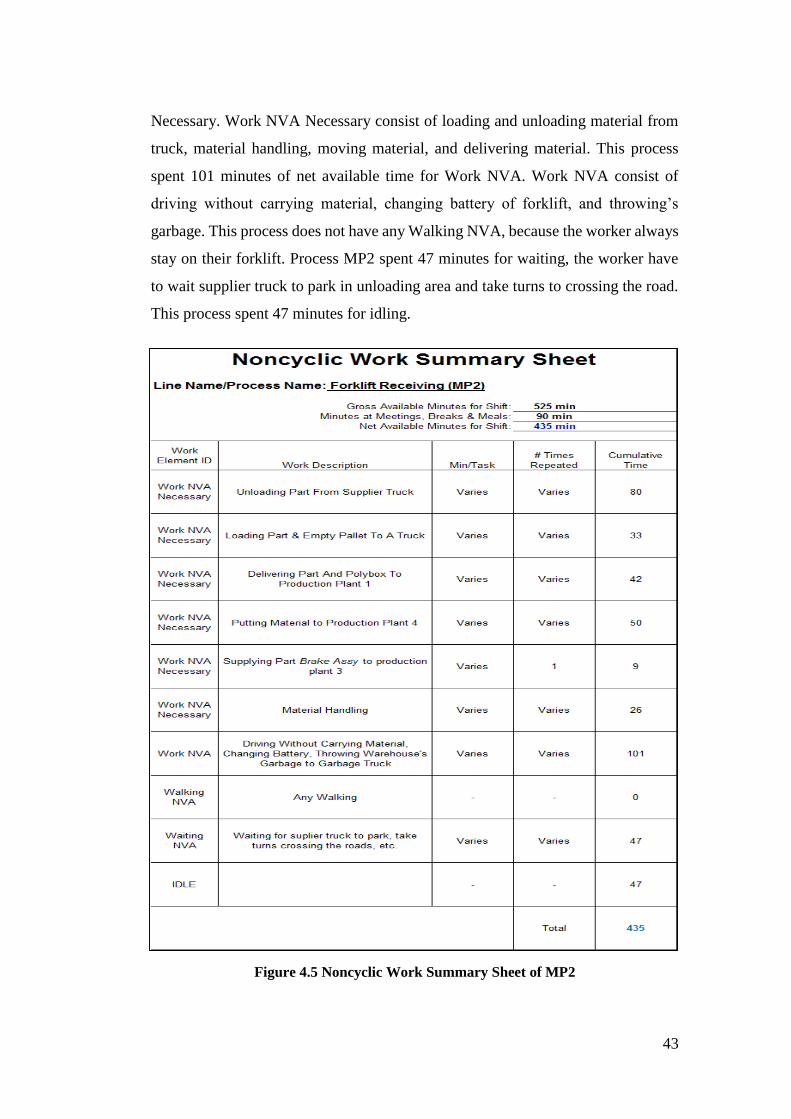
43
Figure 4.5 Noncyclic Work Summary Sheet of MP2
Necessary. Work NVA Necessary consist of loading and unloading material from
truck, material handling, moving material, and delivering material. This process
spent 101 minutes of net available time for Work NVA. Work NVA consist of
driving without carrying material, changing battery of forklift, and throwing’s
garbage. This process does not have any Walking NVA, because the worker always
stay on their forklift. Process MP2 spent 47 minutes for waiting, the worker have
to wait supplier truck to park in unloading area and take turns to crossing the road.
This process spent 47 minutes for idling.
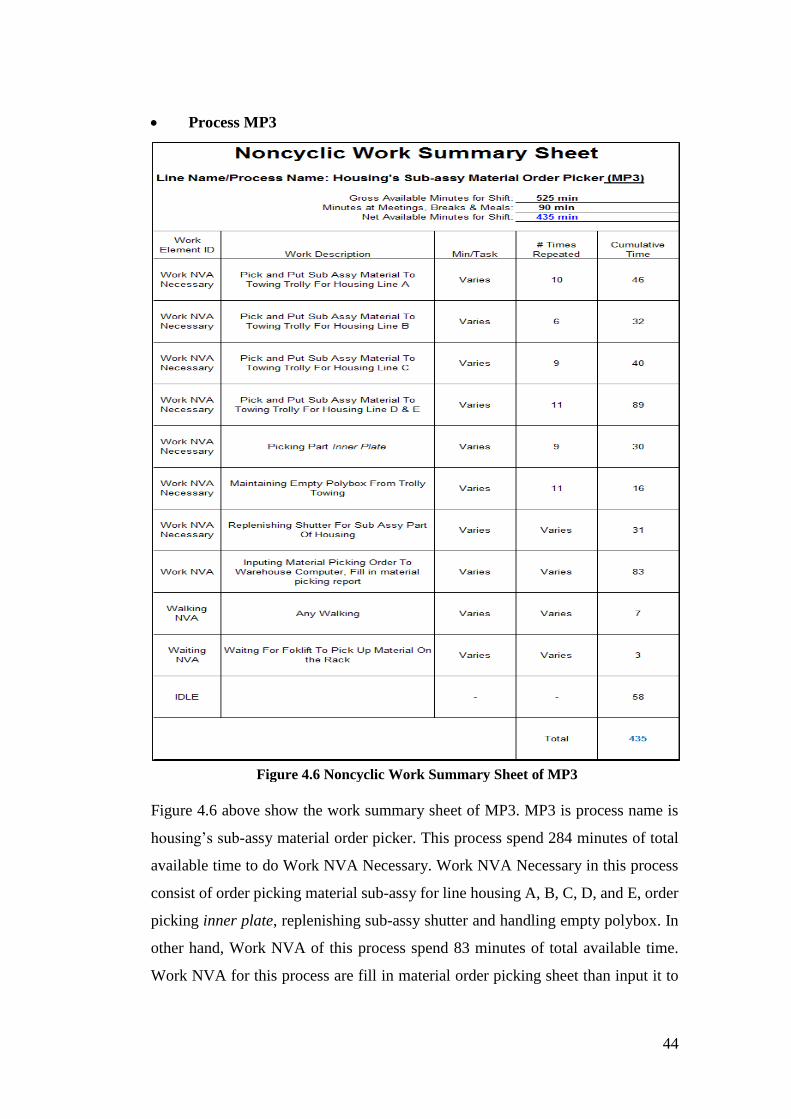
44
Figure 4.6 Noncyclic Work Summary Sheet of MP3
Process MP3
Figure 4.6 above show the work summary sheet of MP3. MP3 is process name is
housing’s sub-assy material order picker. This process spend 284 minutes of total
available time to do Work NVA Necessary. Work NVA Necessary in this process
consist of order picking material sub-assy for line housing A, B, C, D, and E, order
picking inner plate, replenishing sub-assy shutter and handling empty polybox. In
other hand, Work NVA of this process spend 83 minutes of total available time.
Work NVA for this process are fill in material order picking sheet than input it to
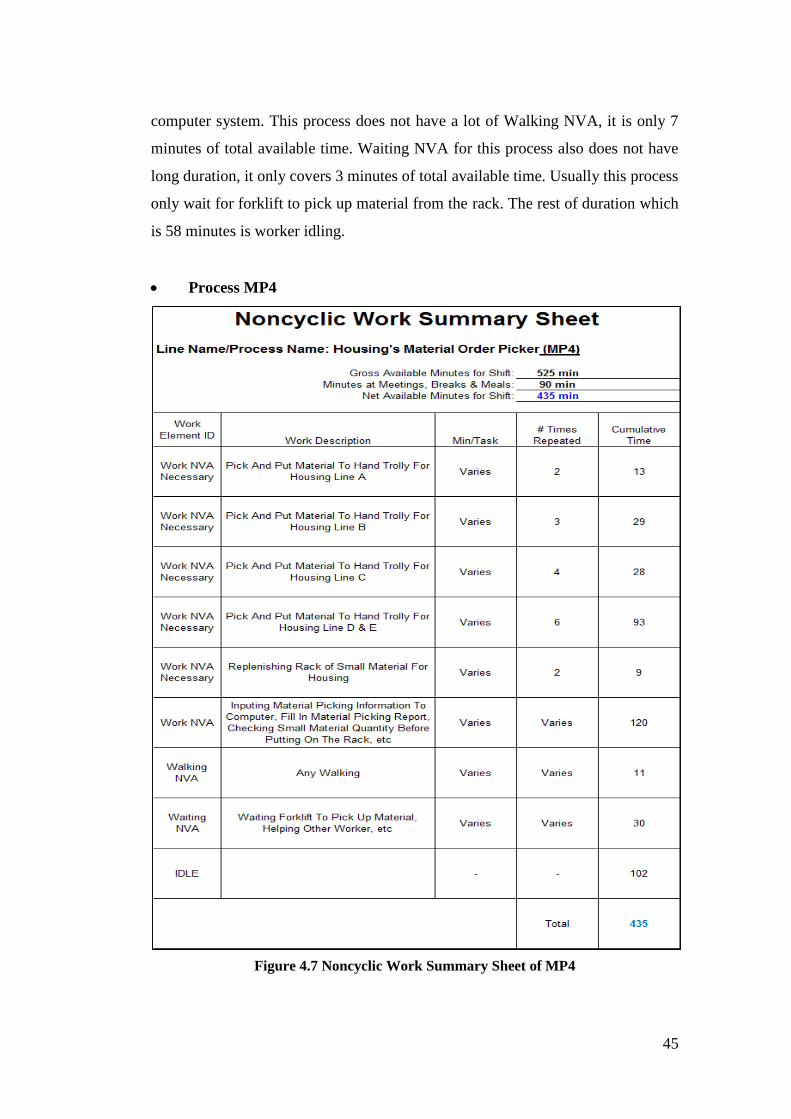
45
Figure 4.7 Noncyclic Work Summary Sheet of MP4
computer system. This process does not have a lot of Walking NVA, it is only 7
minutes of total available time. Waiting NVA for this process also does not have
long duration, it only covers 3 minutes of total available time. Usually this process
only wait for forklift to pick up material from the rack. The rest of duration which
is 58 minutes is worker idling.
Process MP4
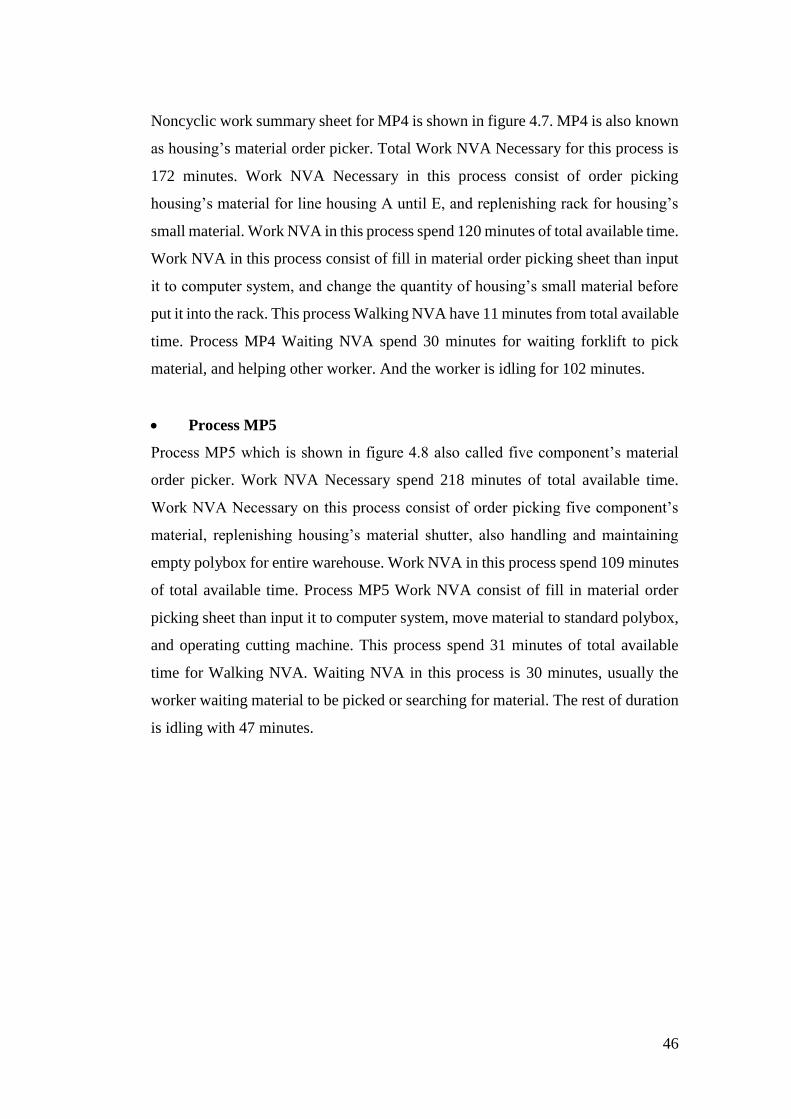
46
Noncyclic work summary sheet for MP4 is shown in figure 4.7. MP4 is also known
as housing’s material order picker. Total Work NVA Necessary for this process is
172 minutes. Work NVA Necessary in this process consist of order picking
housing’s material for line housing A until E, and replenishing rack for housing’s
small material. Work NVA in this process spend 120 minutes of total available time.
Work NVA in this process consist of fill in material order picking sheet than input
it to computer system, and change the quantity of housing’s small material before
put it into the rack. This process Walking NVA have 11 minutes from total available
time. Process MP4 Waiting NVA spend 30 minutes for waiting forklift to pick
material, and helping other worker. And the worker is idling for 102 minutes.
Process MP5
Process MP5 which is shown in figure 4.8 also called five component’s material
order picker. Work NVA Necessary spend 218 minutes of total available time.
Work NVA Necessary on this process consist of order picking five component’s
material, replenishing housing’s material shutter, also handling and maintaining
empty polybox for entire warehouse. Work NVA in this process spend 109 minutes
of total available time. Process MP5 Work NVA consist of fill in material order
picking sheet than input it to computer system, move material to standard polybox,
and operating cutting machine. This process spend 31 minutes of total available
time for Walking NVA. Waiting NVA in this process is 30 minutes, usually the
worker waiting material to be picked or searching for material. The rest of duration
is idling with 47 minutes.
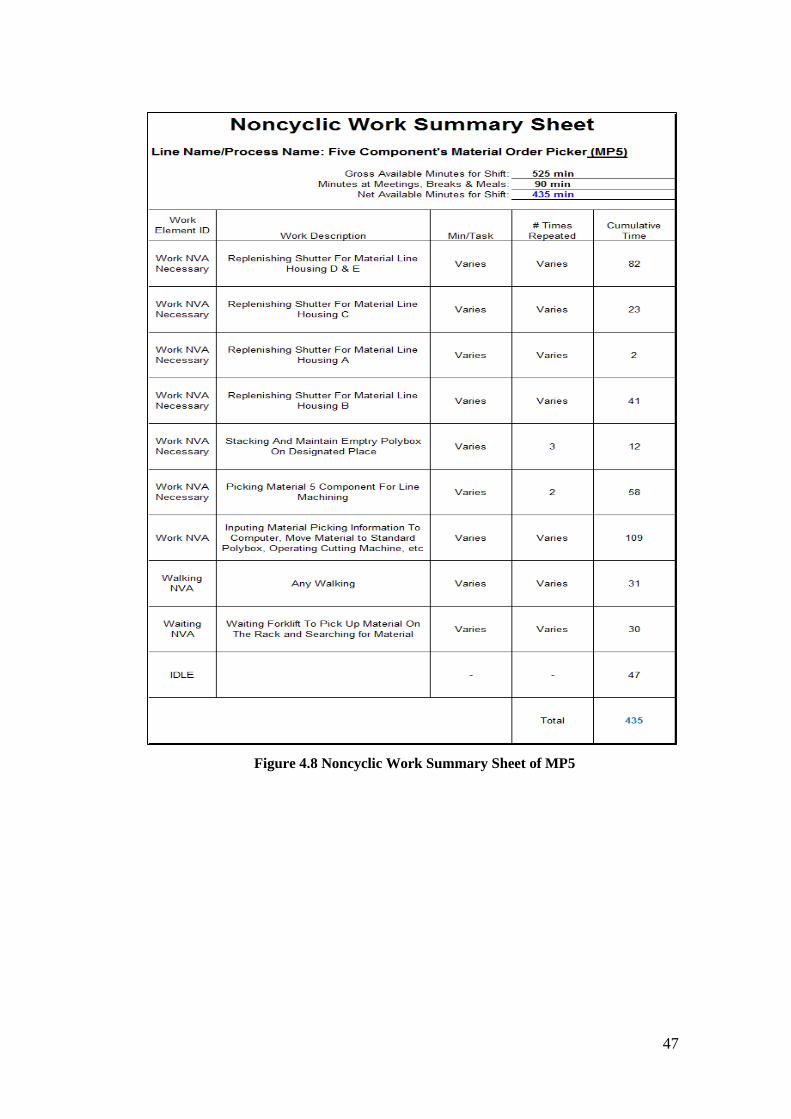
47
Figure 4.8 Noncyclic Work Summary Sheet of MP5
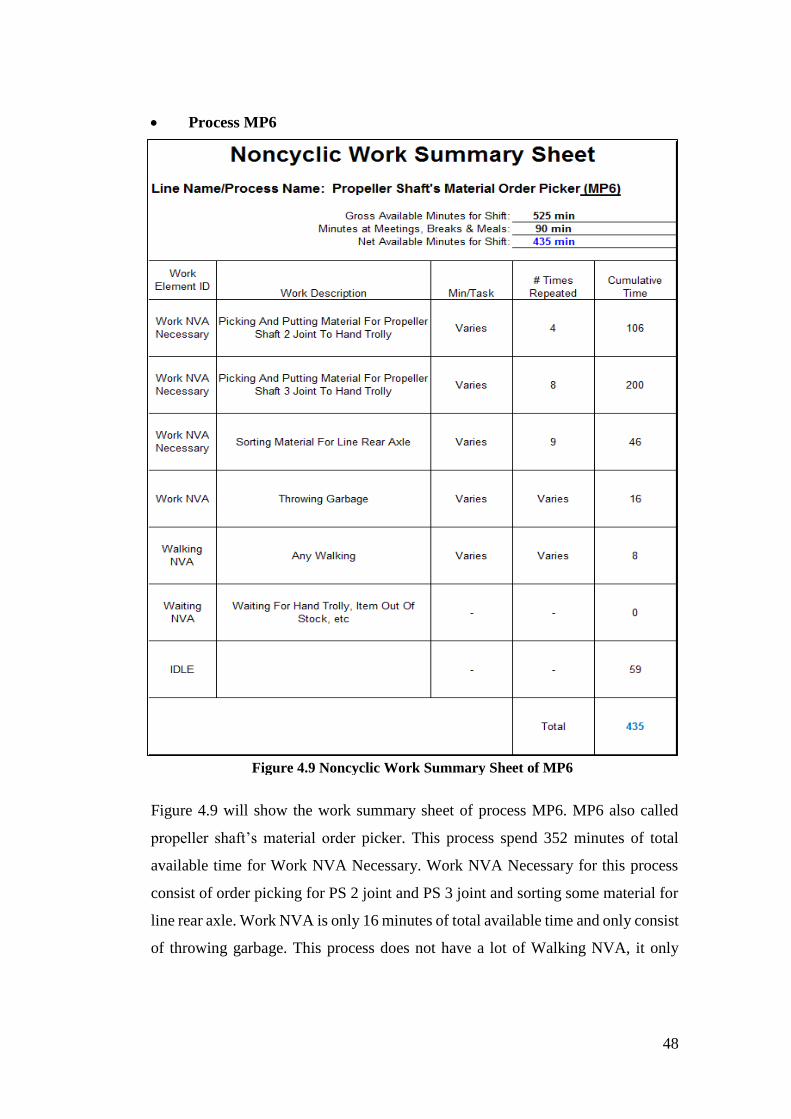
48
Figure 4.9 Noncyclic Work Summary Sheet of MP6
Process MP6
Figure 4.9 will show the work summary sheet of process MP6. MP6 also called
propeller shaft’s material order picker. This process spend 352 minutes of total
available time for Work NVA Necessary. Work NVA Necessary for this process
consist of order picking for PS 2 joint and PS 3 joint and sorting some material for
line rear axle. Work NVA is only 16 minutes of total available time and only consist
of throwing garbage. This process does not have a lot of Walking NVA, it only
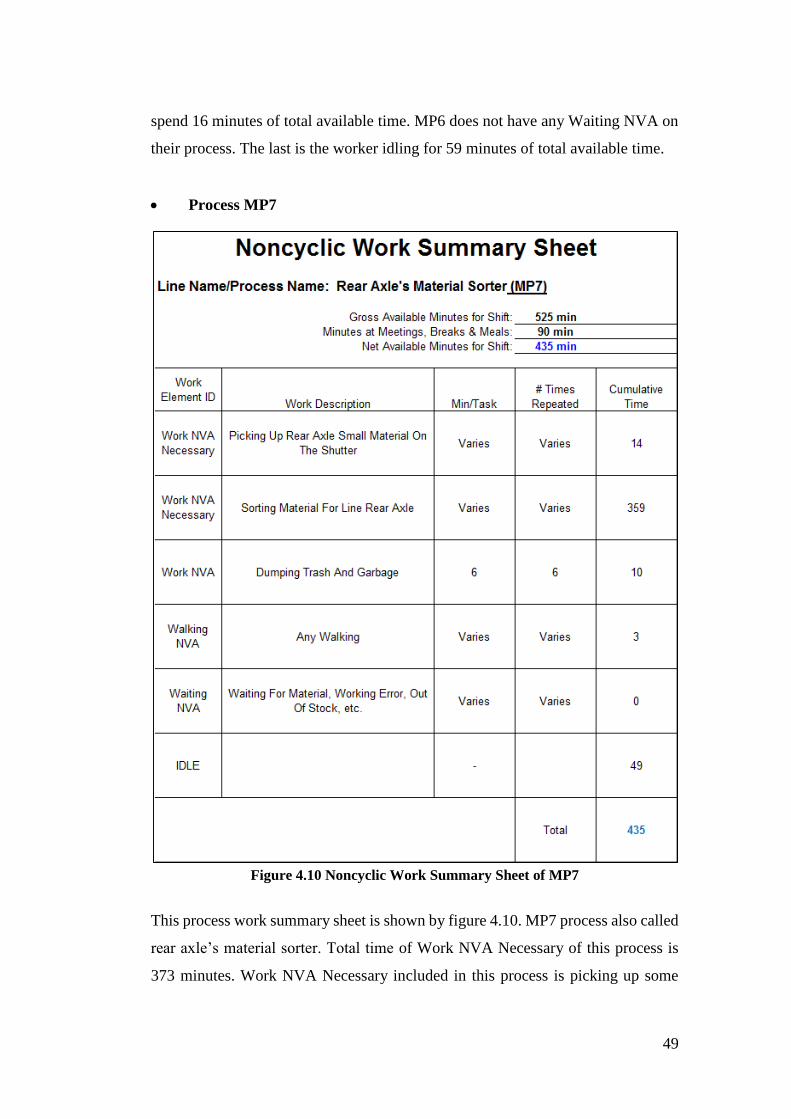
49
Figure 4.10 Noncyclic Work Summary Sheet of MP7
spend 16 minutes of total available time. MP6 does not have any Waiting NVA on
their process. The last is the worker idling for 59 minutes of total available time.
Process MP7
This process work summary sheet is shown by figure 4.10. MP7 process also called
rear axle’s material sorter. Total time of Work NVA Necessary of this process is
373 minutes. Work NVA Necessary included in this process is picking up some
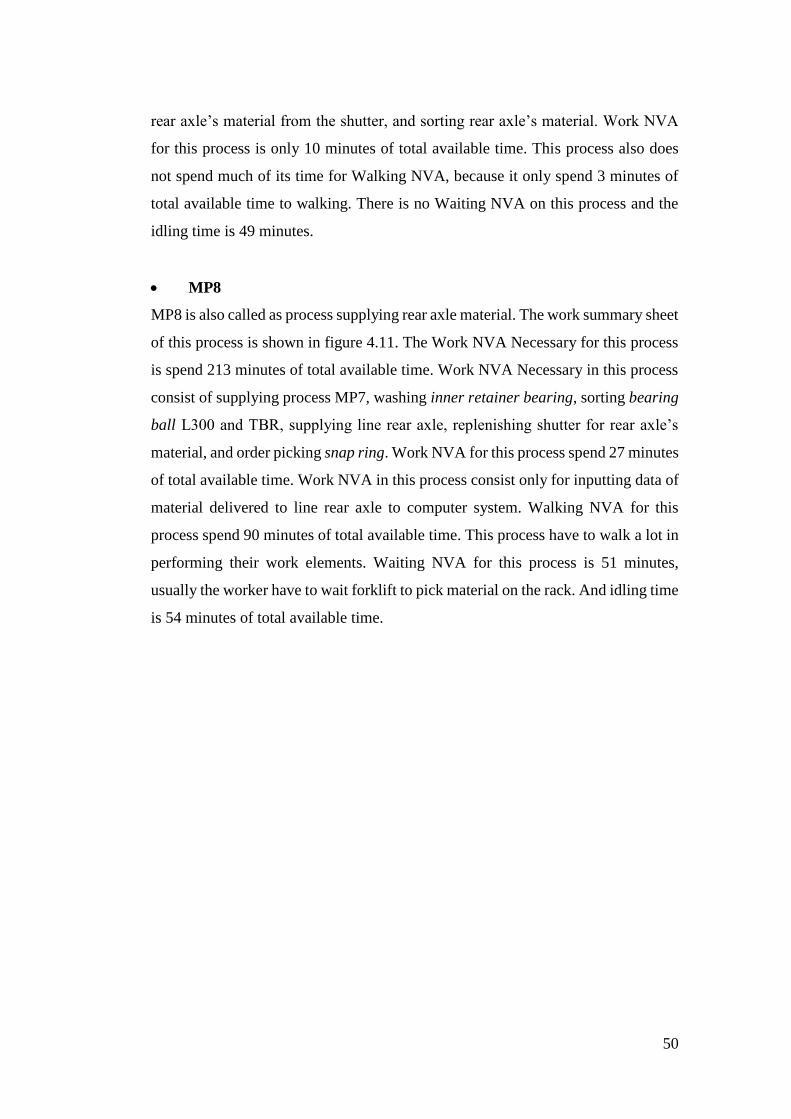
50
rear axle’s material from the shutter, and sorting rear axle’s material. Work NVA
for this process is only 10 minutes of total available time. This process also does
not spend much of its time for Walking NVA, because it only spend 3 minutes of
total available time to walking. There is no Waiting NVA on this process and the
idling time is 49 minutes.
MP8
MP8 is also called as process supplying rear axle material. The work summary sheet
of this process is shown in figure 4.11. The Work NVA Necessary for this process
is spend 213 minutes of total available time. Work NVA Necessary in this process
consist of supplying process MP7, washing inner retainer bearing, sorting bearing
ball L300 and TBR, supplying line rear axle, replenishing shutter for rear axle’s
material, and order picking snap ring. Work NVA for this process spend 27 minutes
of total available time. Work NVA in this process consist only for inputting data of
material delivered to line rear axle to computer system. Walking NVA for this
process spend 90 minutes of total available time. This process have to walk a lot in
performing their work elements. Waiting NVA for this process is 51 minutes,
usually the worker have to wait forklift to pick material on the rack. And idling time
is 54 minutes of total available time.
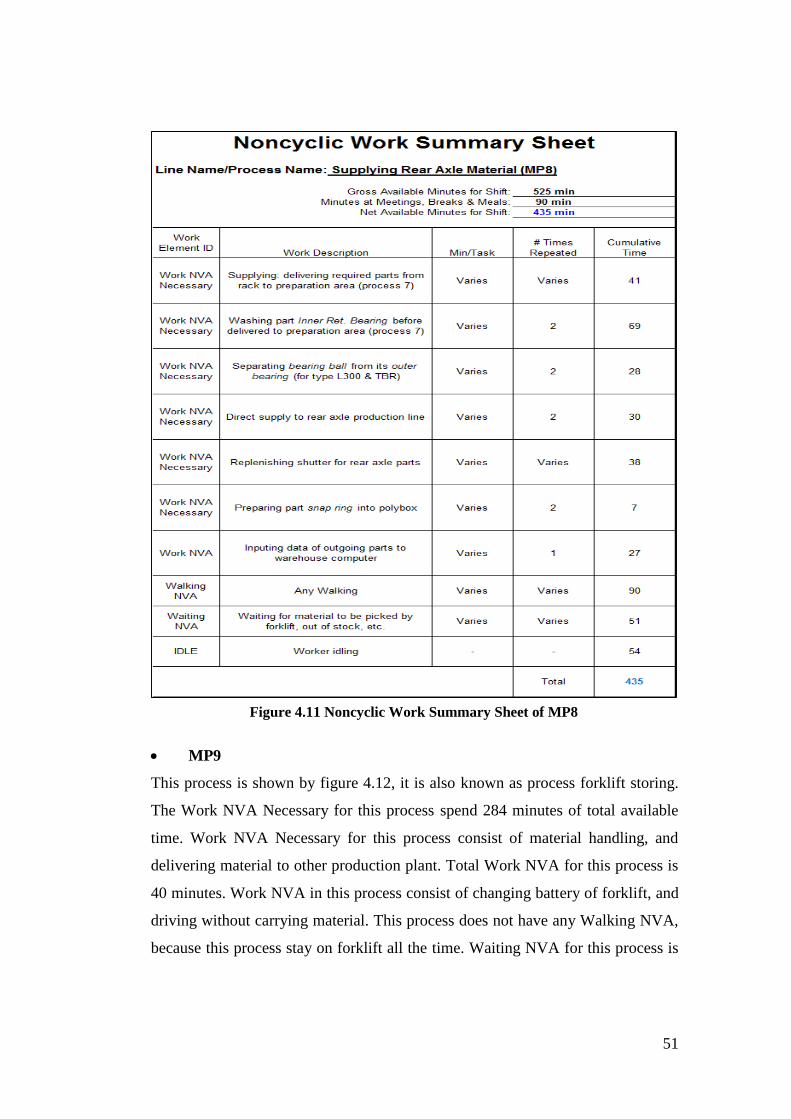
51
Figure 4.11 Noncyclic Work Summary Sheet of MP8
MP9
This process is shown by figure 4.12, it is also known as process forklift storing.
The Work NVA Necessary for this process spend 284 minutes of total available
time. Work NVA Necessary for this process consist of material handling, and
delivering material to other production plant. Total Work NVA for this process is
40 minutes. Work NVA in this process consist of changing battery of forklift, and
driving without carrying material. This process does not have any Walking NVA,
because this process stay on forklift all the time. Waiting NVA for this process is
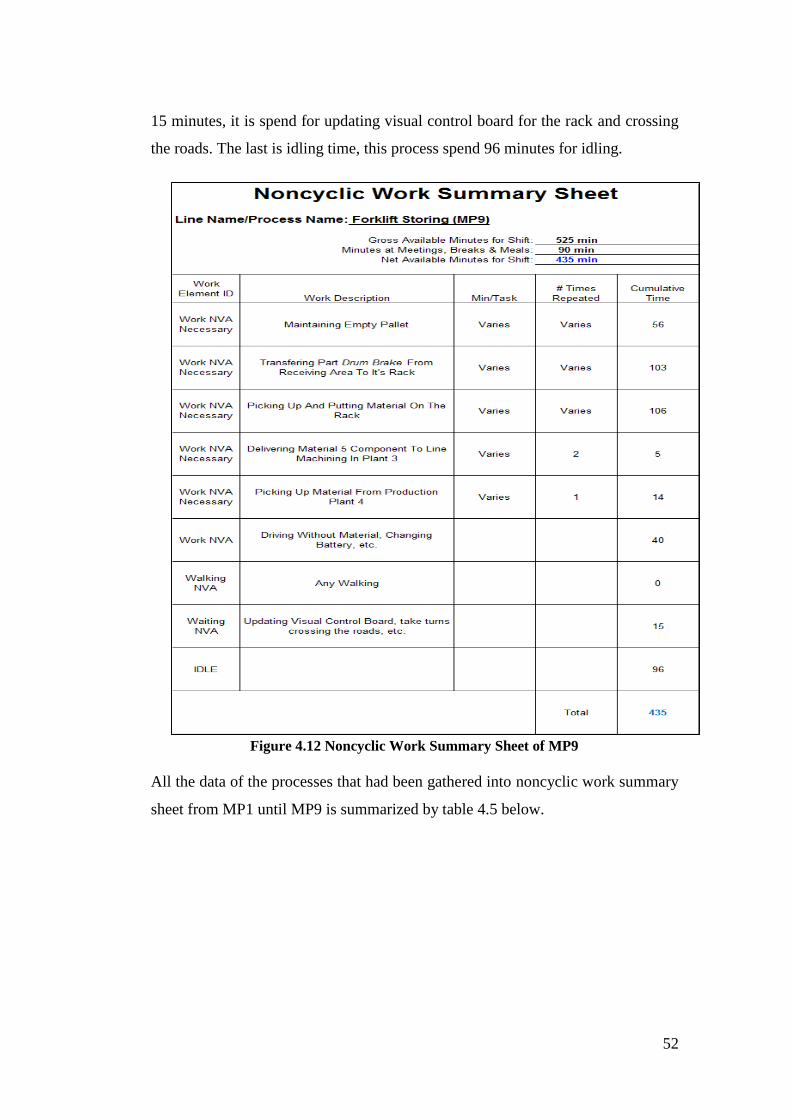
52
Figure 4.12 Noncyclic Work Summary Sheet of MP9
15 minutes, it is spend for updating visual control board for the rack and crossing
the roads. The last is idling time, this process spend 96 minutes for idling.
All the data of the processes that had been gathered into noncyclic work summary
sheet from MP1 until MP9 is summarized by table 4.5 below.
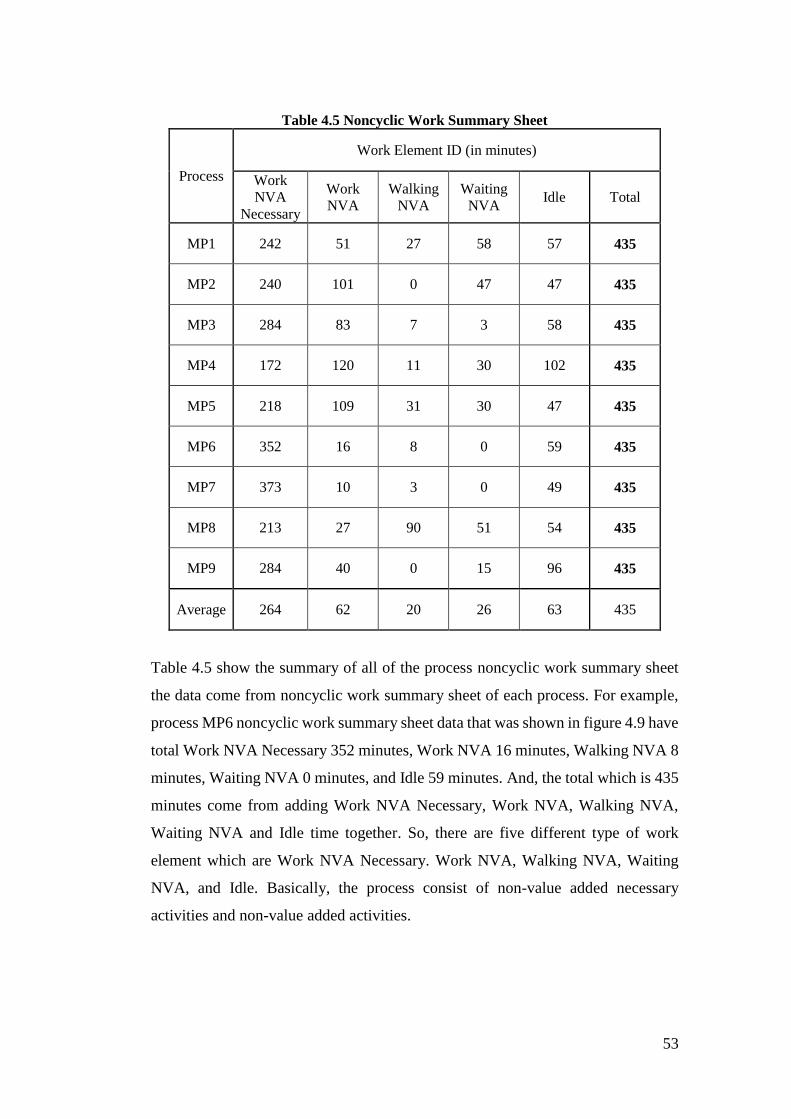
53
Table 4.5 Noncyclic Work Summary Sheet
Process
Work Element ID (in minutes)
Work
NVA
Necessary
Work
NVA
Walking
NVA
Waiting
NVA Idle Total
MP1 242 51 27 58 57 435
MP2 240 101 0 47 47 435
MP3 284 83 7 3 58 435
MP4 172 120 11 30 102 435
MP5 218 109 31 30 47 435
MP6 352 16 8 0 59 435
MP7 373 10 3 0 49 435
MP8 213 27 90 51 54 435
MP9 284 40 0 15 96 435
Average 264 62 20 26 63 435
Table 4.5 show the summary of all of the process noncyclic work summary sheet
the data come from noncyclic work summary sheet of each process. For example,
process MP6 noncyclic work summary sheet data that was shown in figure 4.9 have
total Work NVA Necessary 352 minutes, Work NVA 16 minutes, Walking NVA 8
minutes, Waiting NVA 0 minutes, and Idle 59 minutes. And, the total which is 435
minutes come from adding Work NVA Necessary, Work NVA, Walking NVA,
Waiting NVA and Idle time together. So, there are five different type of work
element which are Work NVA Necessary. Work NVA, Walking NVA, Waiting
NVA, and Idle. Basically, the process consist of non-value added necessary
activities and non-value added activities.
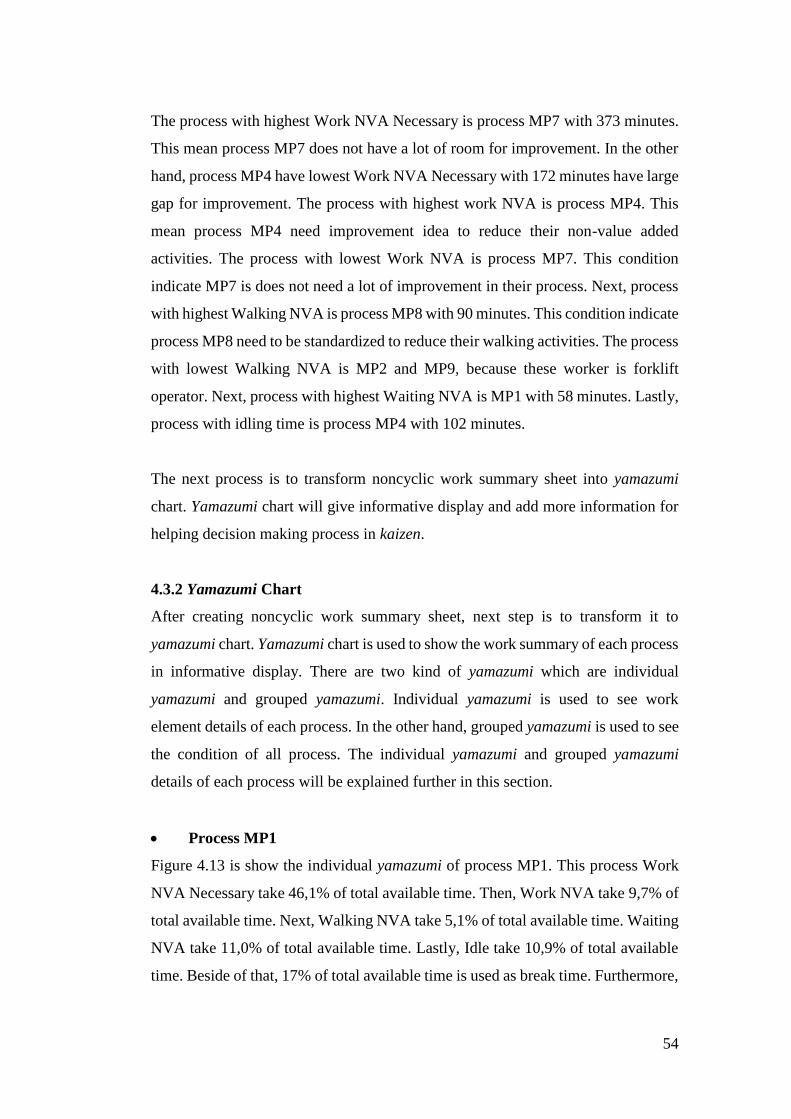
54
The process with highest Work NVA Necessary is process MP7 with 373 minutes.
This mean process MP7 does not have a lot of room for improvement. In the other
hand, process MP4 have lowest Work NVA Necessary with 172 minutes have large
gap for improvement. The process with highest work NVA is process MP4. This
mean process MP4 need improvement idea to reduce their non-value added
activities. The process with lowest Work NVA is process MP7. This condition
indicate MP7 is does not need a lot of improvement in their process. Next, process
with highest Walking NVA is process MP8 with 90 minutes. This condition indicate
process MP8 need to be standardized to reduce their walking activities. The process
with lowest Walking NVA is MP2 and MP9, because these worker is forklift
operator. Next, process with highest Waiting NVA is MP1 with 58 minutes. Lastly,
process with idling time is process MP4 with 102 minutes.
The next process is to transform noncyclic work summary sheet into yamazumi
chart. Yamazumi chart will give informative display and add more information for
helping decision making process in kaizen.
4.3.2 Yamazumi Chart
After creating noncyclic work summary sheet, next step is to transform it to
yamazumi chart. Yamazumi chart is used to show the work summary of each process
in informative display. There are two kind of yamazumi which are individual
yamazumi and grouped yamazumi. Individual yamazumi is used to see work
element details of each process. In the other hand, grouped yamazumi is used to see
the condition of all process. The individual yamazumi and grouped yamazumi
details of each process will be explained further in this section.
Process MP1
Figure 4.13 is show the individual yamazumi of process MP1. This process Work
NVA Necessary take 46,1% of total available time. Then, Work NVA take 9,7% of
total available time. Next, Walking NVA take 5,1% of total available time. Waiting
NVA take 11,0% of total available time. Lastly, Idle take 10,9% of total available
time. Beside of that, 17% of total available time is used as break time. Furthermore,
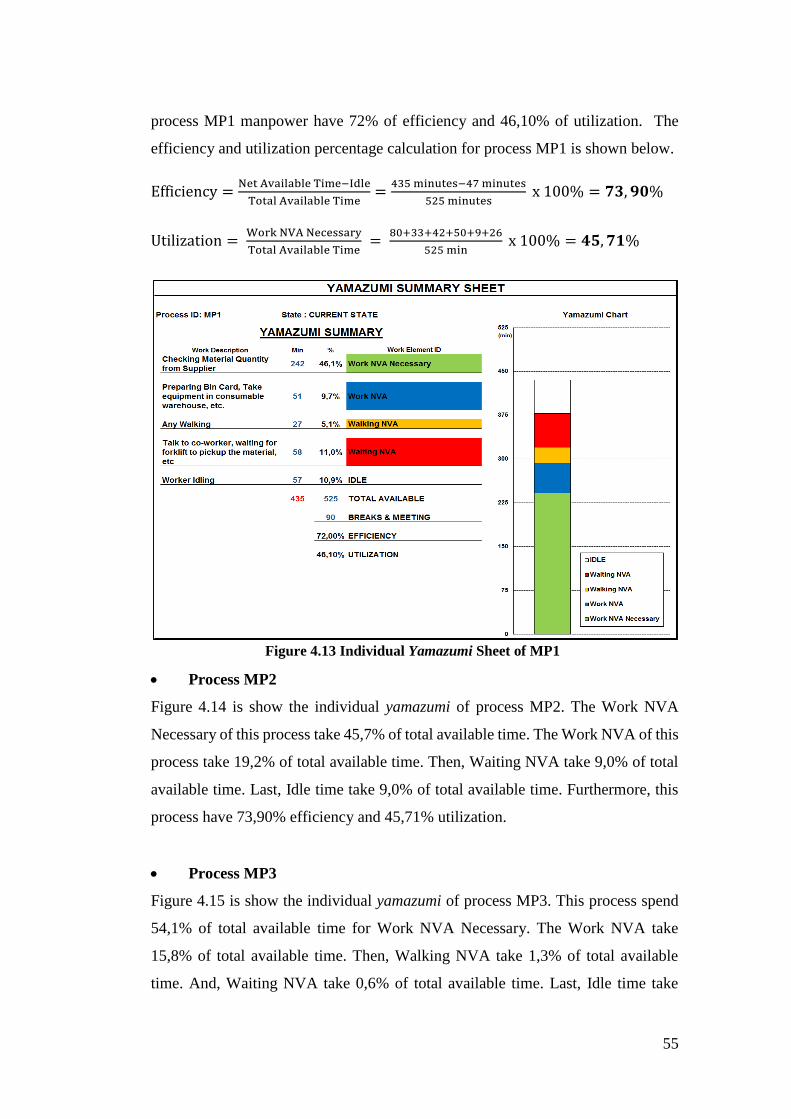
55
Figure 4.13 Individual Yamazumi Sheet of MP1
process MP1 manpower have 72% of efficiency and 46,10% of utilization. The
efficiency and utilization percentage calculation for process MP1 is shown below.
Efficiency =Net Available Time−Idle
Total Available Time=
435 minutes−47 minutes
525 minutes x 100% = 𝟕𝟑, 𝟗𝟎%
Utilization = Work NVA Necessary
Total Available Time =
80+33+42+50+9+26
525 min x 100% = 𝟒𝟓, 𝟕𝟏%
Process MP2
Figure 4.14 is show the individual yamazumi of process MP2. The Work NVA
Necessary of this process take 45,7% of total available time. The Work NVA of this
process take 19,2% of total available time. Then, Waiting NVA take 9,0% of total
available time. Last, Idle time take 9,0% of total available time. Furthermore, this
process have 73,90% efficiency and 45,71% utilization.
Process MP3
Figure 4.15 is show the individual yamazumi of process MP3. This process spend
54,1% of total available time for Work NVA Necessary. The Work NVA take
15,8% of total available time. Then, Walking NVA take 1,3% of total available
time. And, Waiting NVA take 0,6% of total available time. Last, Idle time take
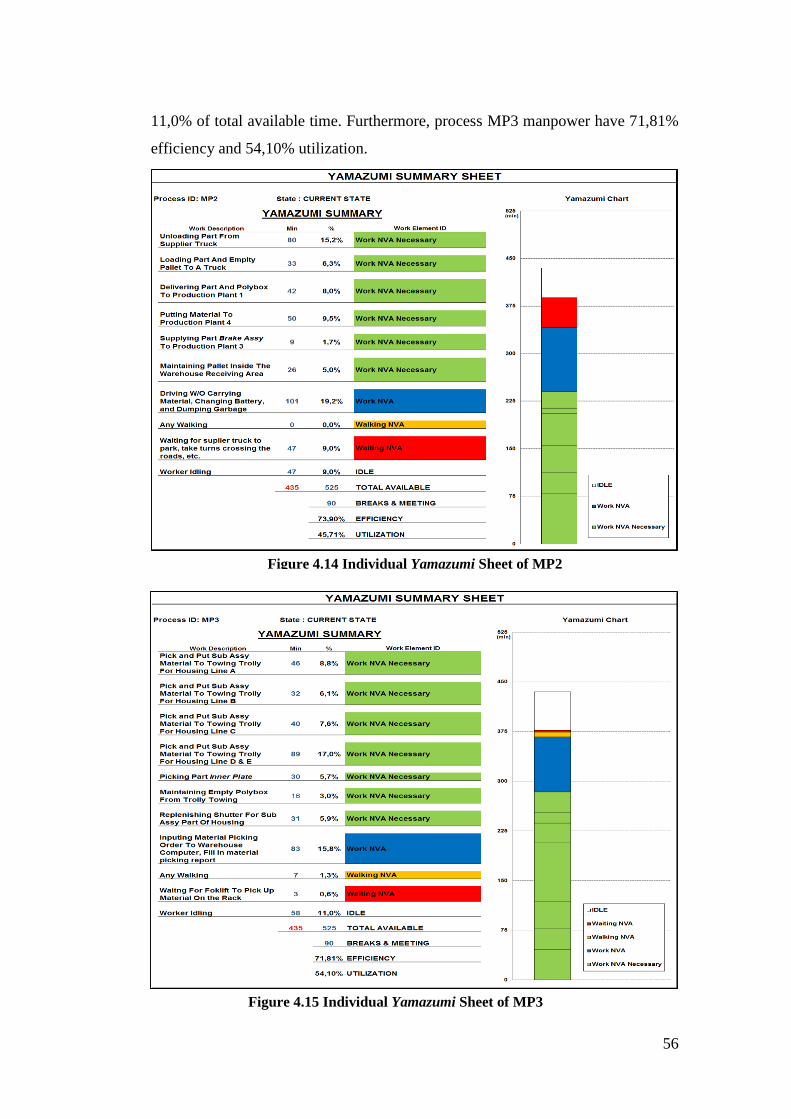
56
Figure 4.14 Individual Yamazumi Sheet of MP2
Figure 4.15 Individual Yamazumi Sheet of MP3
11,0% of total available time. Furthermore, process MP3 manpower have 71,81%
efficiency and 54,10% utilization.
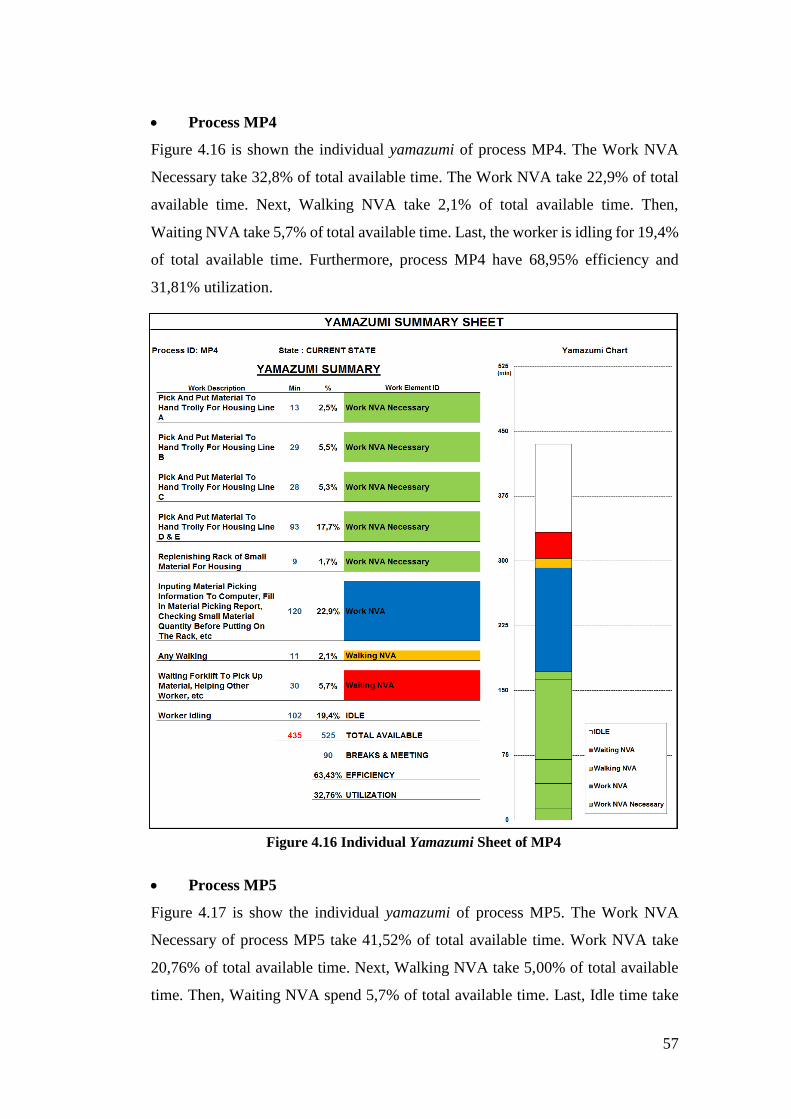
57
Figure 4.16 Individual Yamazumi Sheet of MP4
Process MP4
Figure 4.16 is shown the individual yamazumi of process MP4. The Work NVA
Necessary take 32,8% of total available time. The Work NVA take 22,9% of total
available time. Next, Walking NVA take 2,1% of total available time. Then,
Waiting NVA take 5,7% of total available time. Last, the worker is idling for 19,4%
of total available time. Furthermore, process MP4 have 68,95% efficiency and
31,81% utilization.
Process MP5
Figure 4.17 is show the individual yamazumi of process MP5. The Work NVA
Necessary of process MP5 take 41,52% of total available time. Work NVA take
20,76% of total available time. Next, Walking NVA take 5,00% of total available
time. Then, Waiting NVA spend 5,7% of total available time. Last, Idle time take
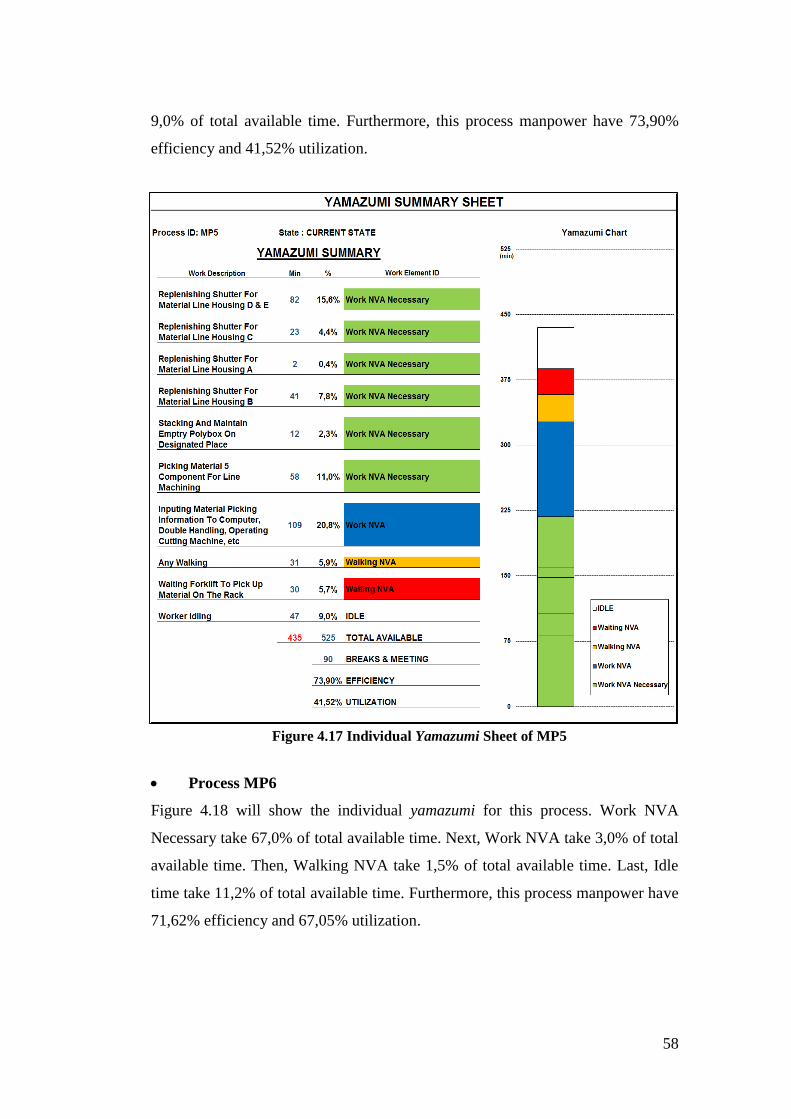
58
Figure 4.17 Individual Yamazumi Sheet of MP5
9,0% of total available time. Furthermore, this process manpower have 73,90%
efficiency and 41,52% utilization.
Process MP6
Figure 4.18 will show the individual yamazumi for this process. Work NVA
Necessary take 67,0% of total available time. Next, Work NVA take 3,0% of total
available time. Then, Walking NVA take 1,5% of total available time. Last, Idle
time take 11,2% of total available time. Furthermore, this process manpower have
71,62% efficiency and 67,05% utilization.
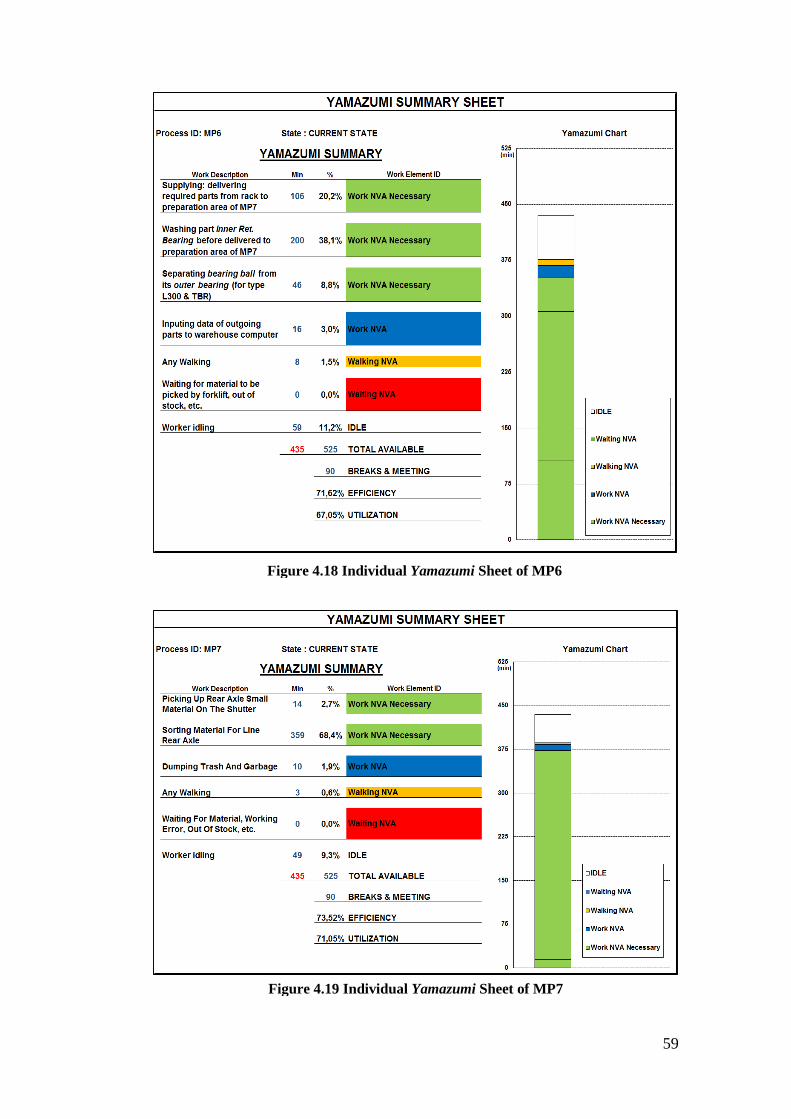
59
Figure 4.18 Individual Yamazumi Sheet of MP6
Figure 4.19 Individual Yamazumi Sheet of MP7
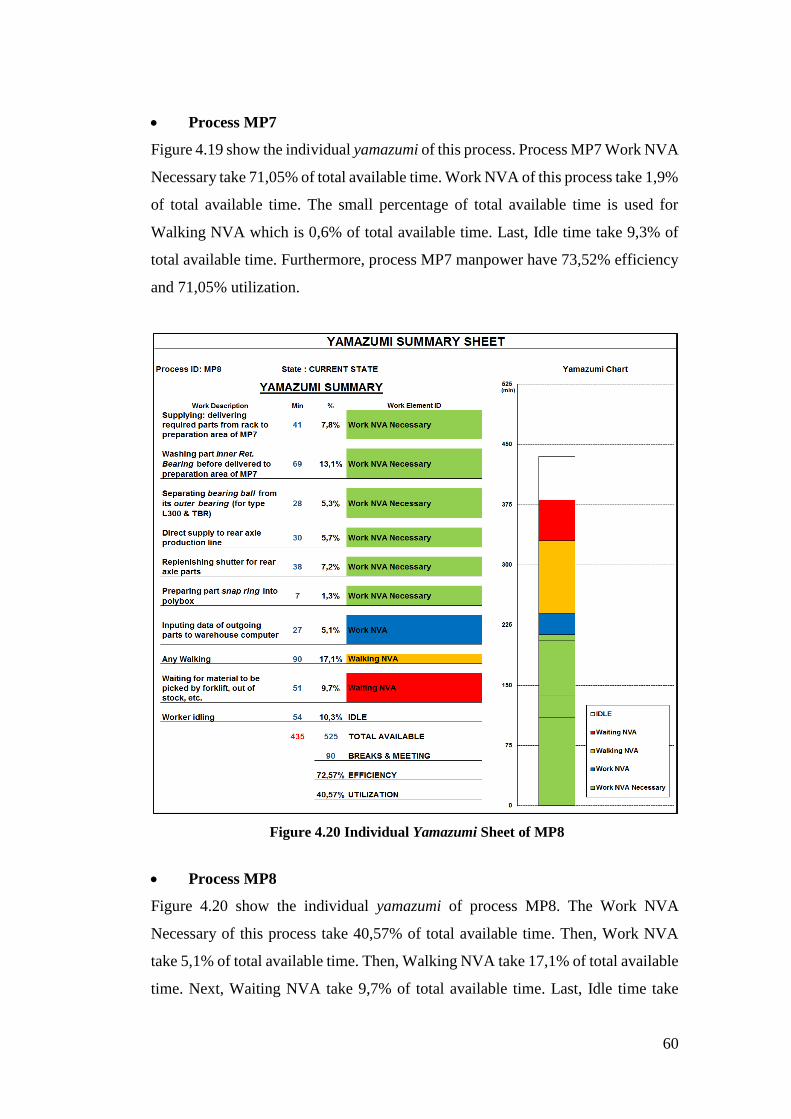
60
Figure 4.20 Individual Yamazumi Sheet of MP8
Process MP7
Figure 4.19 show the individual yamazumi of this process. Process MP7 Work NVA
Necessary take 71,05% of total available time. Work NVA of this process take 1,9%
of total available time. The small percentage of total available time is used for
Walking NVA which is 0,6% of total available time. Last, Idle time take 9,3% of
total available time. Furthermore, process MP7 manpower have 73,52% efficiency
and 71,05% utilization.
Process MP8
Figure 4.20 show the individual yamazumi of process MP8. The Work NVA
Necessary of this process take 40,57% of total available time. Then, Work NVA
take 5,1% of total available time. Then, Walking NVA take 17,1% of total available
time. Next, Waiting NVA take 9,7% of total available time. Last, Idle time take
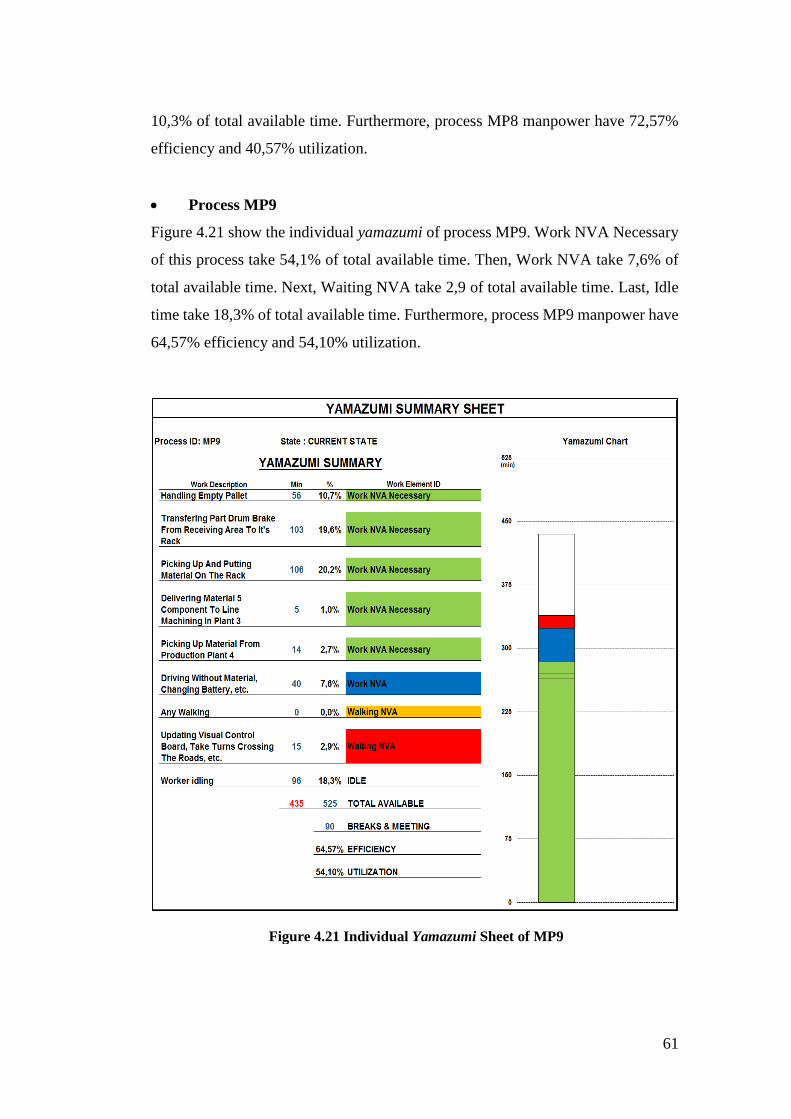
61
Figure 4.21 Individual Yamazumi Sheet of MP9
10,3% of total available time. Furthermore, process MP8 manpower have 72,57%
efficiency and 40,57% utilization.
Process MP9
Figure 4.21 show the individual yamazumi of process MP9. Work NVA Necessary
of this process take 54,1% of total available time. Then, Work NVA take 7,6% of
total available time. Next, Waiting NVA take 2,9 of total available time. Last, Idle
time take 18,3% of total available time. Furthermore, process MP9 manpower have
64,57% efficiency and 54,10% utilization.
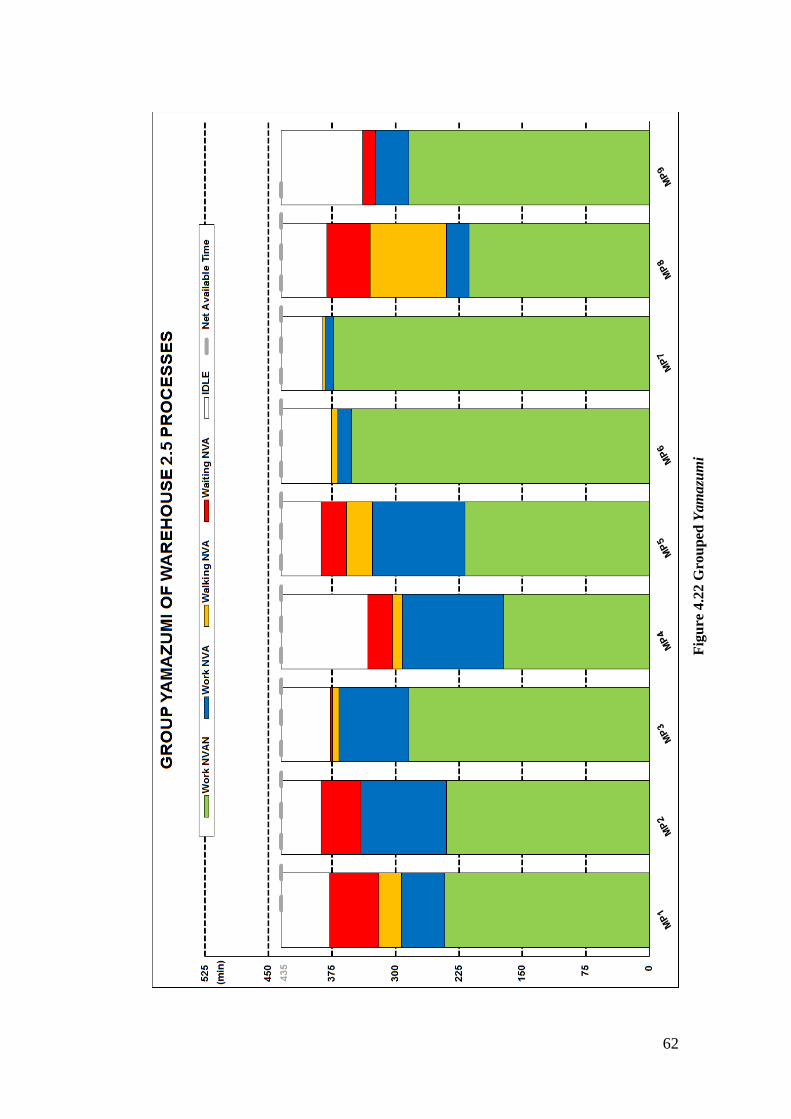
62
Fig
ure
4.2
2 G
rou
ped
Yam
azu
mi
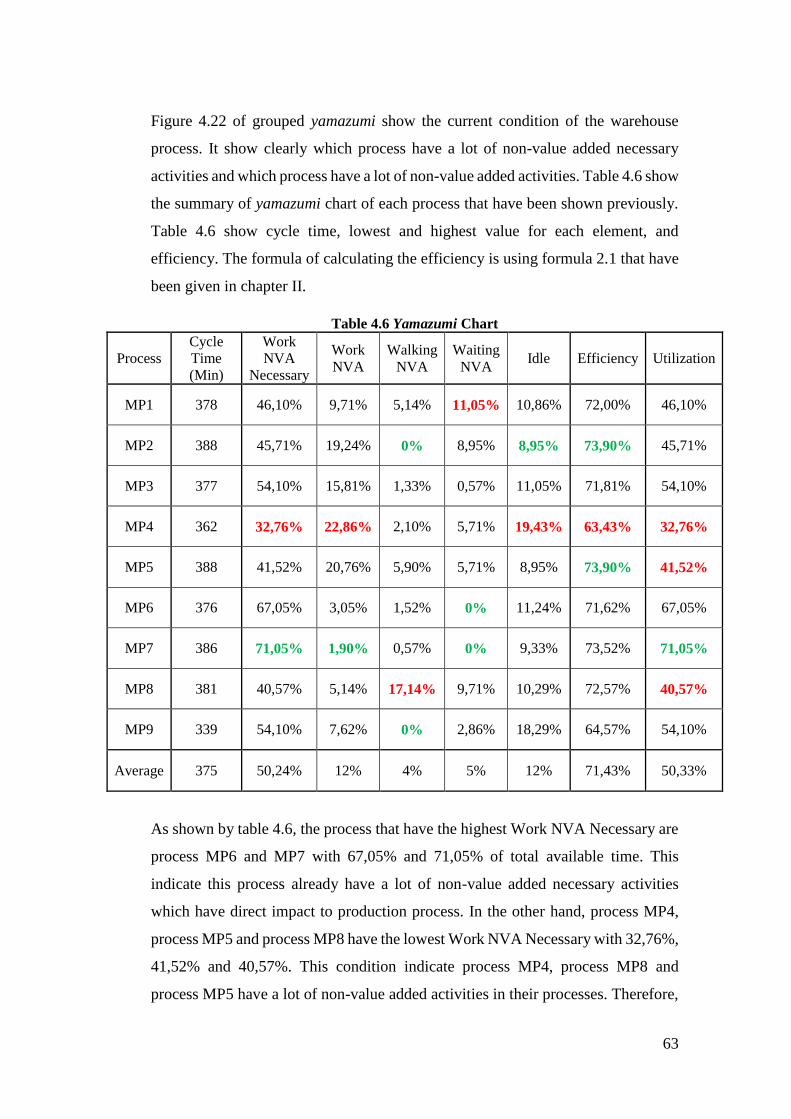
63
Figure 4.22 of grouped yamazumi show the current condition of the warehouse
process. It show clearly which process have a lot of non-value added necessary
activities and which process have a lot of non-value added activities. Table 4.6 show
the summary of yamazumi chart of each process that have been shown previously.
Table 4.6 show cycle time, lowest and highest value for each element, and
efficiency. The formula of calculating the efficiency is using formula 2.1 that have
been given in chapter II.
Table 4.6 Yamazumi Chart
Process
Cycle
Time
(Min)
Work
NVA
Necessary
Work
NVA
Walking
NVA
Waiting
NVA Idle Efficiency Utilization
MP1 378 46,10% 9,71% 5,14% 11,05% 10,86% 72,00% 46,10%
MP2 388 45,71% 19,24% 0% 8,95% 8,95% 73,90% 45,71%
MP3 377 54,10% 15,81% 1,33% 0,57% 11,05% 71,81% 54,10%
MP4 362 32,76% 22,86% 2,10% 5,71% 19,43% 63,43% 32,76%
MP5 388 41,52% 20,76% 5,90% 5,71% 8,95% 73,90% 41,52%
MP6 376 67,05% 3,05% 1,52% 0% 11,24% 71,62% 67,05%
MP7 386 71,05% 1,90% 0,57% 0% 9,33% 73,52% 71,05%
MP8 381 40,57% 5,14% 17,14% 9,71% 10,29% 72,57% 40,57%
MP9 339 54,10% 7,62% 0% 2,86% 18,29% 64,57% 54,10%
Average 375 50,24% 12% 4% 5% 12% 71,43% 50,33%
As shown by table 4.6, the process that have the highest Work NVA Necessary are
process MP6 and MP7 with 67,05% and 71,05% of total available time. This
indicate this process already have a lot of non-value added necessary activities
which have direct impact to production process. In the other hand, process MP4,
process MP5 and process MP8 have the lowest Work NVA Necessary with 32,76%,
41,52% and 40,57%. This condition indicate process MP4, process MP8 and
process MP5 have a lot of non-value added activities in their processes. Therefore,
64
non-value added activities for process MP4 and MP5 need to be reduced. Non-value
added work elements is included Work NVA, Walking NVA, and Waiting NVA.
Process with highest Work NVA is process MP4 and MP5. This process spend
22,86% and 20,76% of total available time to perform non-value added activities.
Therefore, both of this process will be analyzed to see the cause behind this high
amount of non-value added activities.
The next non-value added work elements is Walking NVA. The process that have
highest Walking NVA percentage is process MP8. Process MP8 use 17,14% of its
time for walking. Therefore, wasting valuable time to do necessary activities.
Because of excessive amount of walking the research will focused on this process
to see what cause this problem.
Another non-value added work elements is Waiting NVA. The process that have
highest amount of waiting NVA is process MP1 and MP8 with 11,05% and 9,71%
of total available time. However, the worker of process MP1 and MP8 does not
have any other choice but wait. Since, the worker need to wait material to be picked
by the forklift. The research did not focused on reducing Waiting NVA because
with current process technology and system it is hard to reduce Waiting NVA.
Example of Waiting NVA activities is waiting material to be picked by forklift, talk
to co-worker, and waiting for supplier truck to be parked. There is not much the
research can do to reduce this kind of non-value added activities.
Since process MP4, MP5, and MP8 have the lowest utilization, indicating three
process have a lot of non-value added activities, mainly in their Work NVA and
Walking NVA. The plans and ideas for reducing non-value added activities will be
discussed in kaizen activities.
4.4 Kaizen
After collecting enough about work element in each process of the warehouse, next
step is to conducting kaizen in the process. Generally, kaizen has six steps which
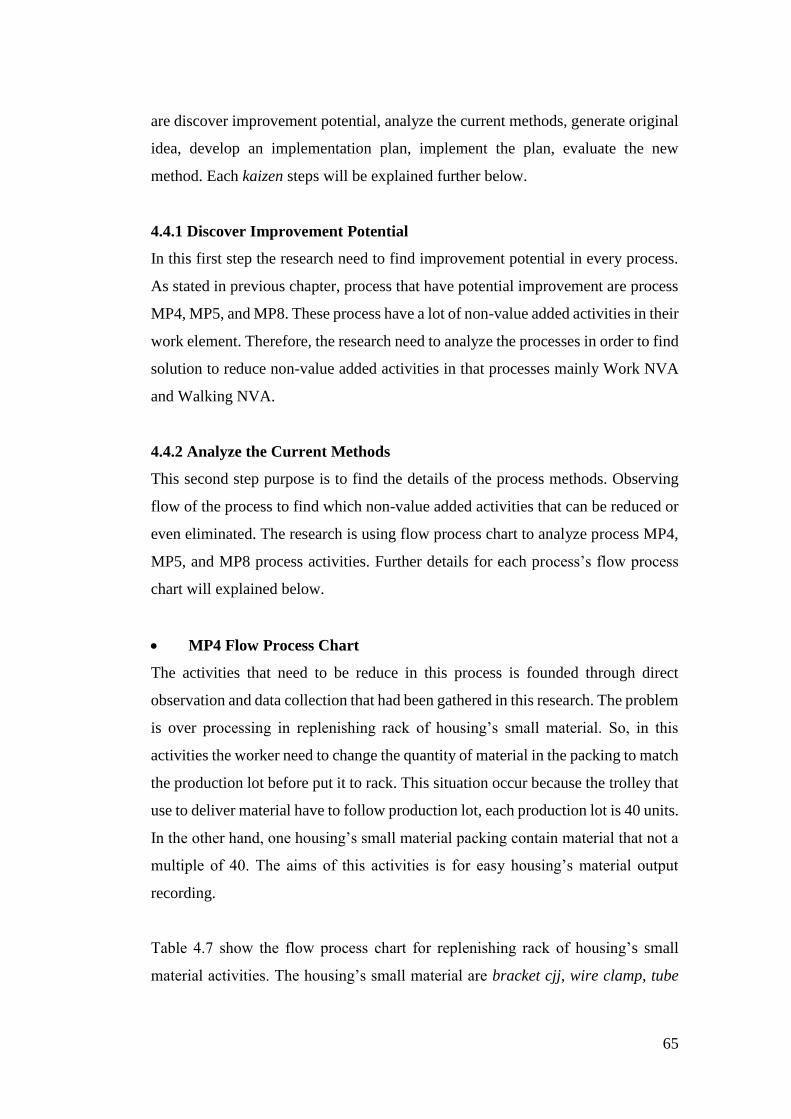
65
are discover improvement potential, analyze the current methods, generate original
idea, develop an implementation plan, implement the plan, evaluate the new
method. Each kaizen steps will be explained further below.
4.4.1 Discover Improvement Potential
In this first step the research need to find improvement potential in every process.
As stated in previous chapter, process that have potential improvement are process
MP4, MP5, and MP8. These process have a lot of non-value added activities in their
work element. Therefore, the research need to analyze the processes in order to find
solution to reduce non-value added activities in that processes mainly Work NVA
and Walking NVA.
4.4.2 Analyze the Current Methods
This second step purpose is to find the details of the process methods. Observing
flow of the process to find which non-value added activities that can be reduced or
even eliminated. The research is using flow process chart to analyze process MP4,
MP5, and MP8 process activities. Further details for each process’s flow process
chart will explained below.
MP4 Flow Process Chart
The activities that need to be reduce in this process is founded through direct
observation and data collection that had been gathered in this research. The problem
is over processing in replenishing rack of housing’s small material. So, in this
activities the worker need to change the quantity of material in the packing to match
the production lot before put it to rack. This situation occur because the trolley that
use to deliver material have to follow production lot, each production lot is 40 units.
In the other hand, one housing’s small material packing contain material that not a
multiple of 40. The aims of this activities is for easy housing’s material output
recording.
Table 4.7 show the flow process chart for replenishing rack of housing’s small
material activities. The housing’s small material are bracket cjj, wire clamp, tube
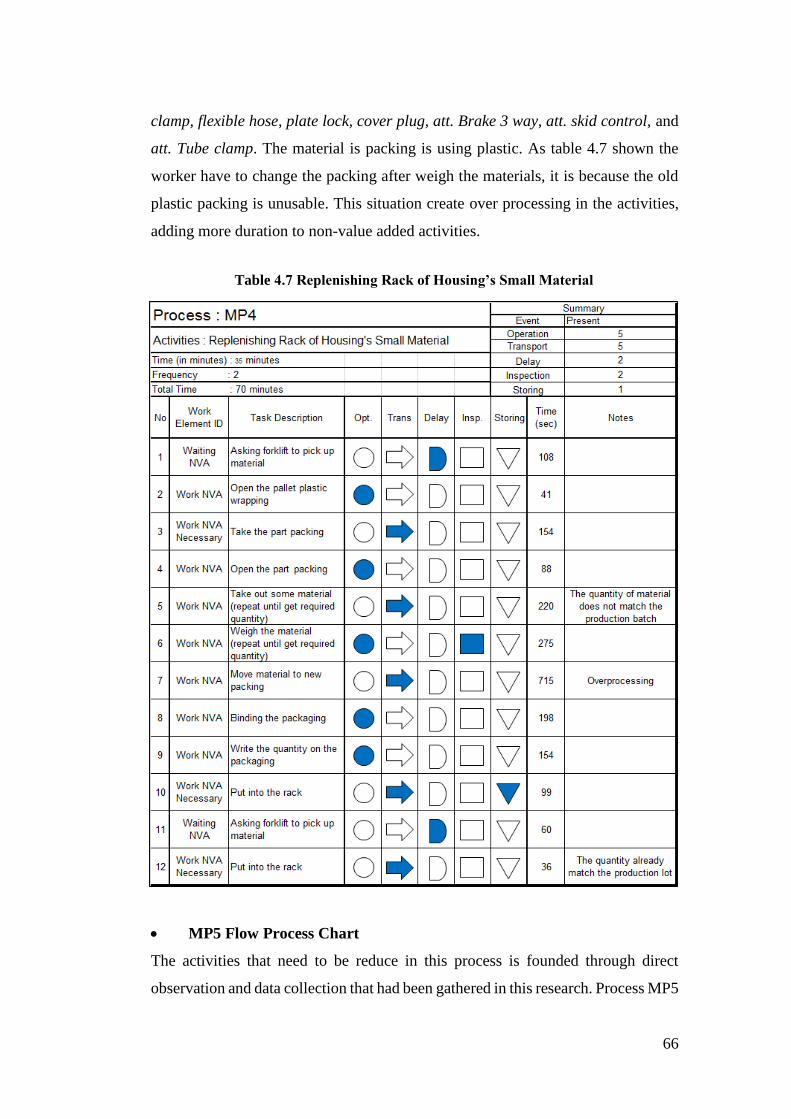
66
clamp, flexible hose, plate lock, cover plug, att. Brake 3 way, att. skid control, and
att. Tube clamp. The material is packing is using plastic. As table 4.7 shown the
worker have to change the packing after weigh the materials, it is because the old
plastic packing is unusable. This situation create over processing in the activities,
adding more duration to non-value added activities.
MP5 Flow Process Chart
The activities that need to be reduce in this process is founded through direct
observation and data collection that had been gathered in this research. Process MP5
Table 4.7 Replenishing Rack of Housing’s Small Material
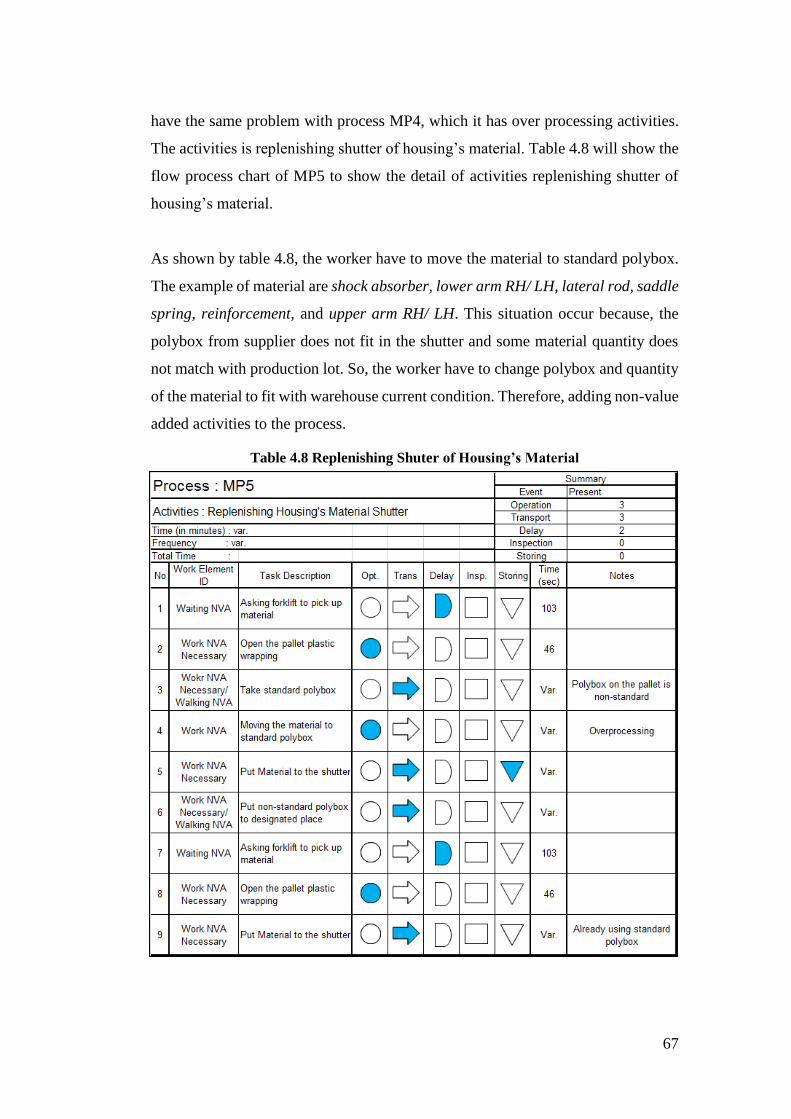
67
Table 4.8 Replenishing Shuter of Housing’s Material
have the same problem with process MP4, which it has over processing activities.
The activities is replenishing shutter of housing’s material. Table 4.8 will show the
flow process chart of MP5 to show the detail of activities replenishing shutter of
housing’s material.
As shown by table 4.8, the worker have to move the material to standard polybox.
The example of material are shock absorber, lower arm RH/ LH, lateral rod, saddle
spring, reinforcement, and upper arm RH/ LH. This situation occur because, the
polybox from supplier does not fit in the shutter and some material quantity does
not match with production lot. So, the worker have to change polybox and quantity
of the material to fit with warehouse current condition. Therefore, adding non-value
added activities to the process.
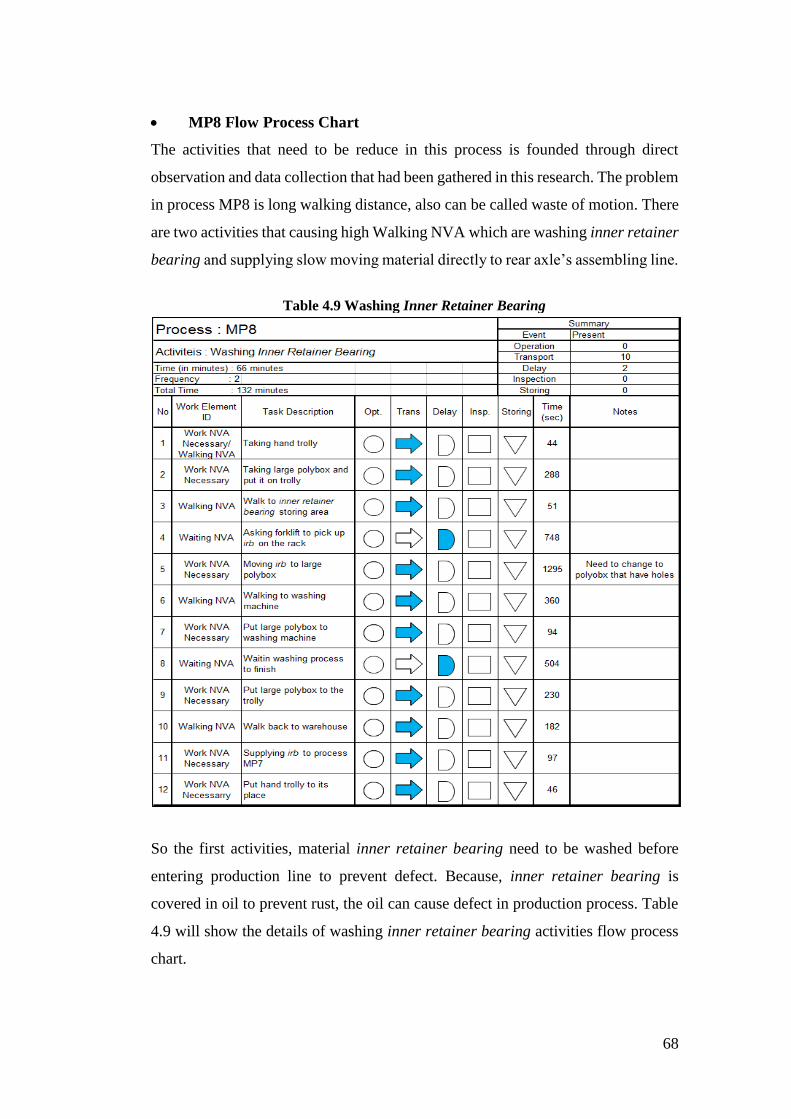
68
Table 4.9 Washing Inner Retainer Bearing
MP8 Flow Process Chart
The activities that need to be reduce in this process is founded through direct
observation and data collection that had been gathered in this research. The problem
in process MP8 is long walking distance, also can be called waste of motion. There
are two activities that causing high Walking NVA which are washing inner retainer
bearing and supplying slow moving material directly to rear axle’s assembling line.
So the first activities, material inner retainer bearing need to be washed before
entering production line to prevent defect. Because, inner retainer bearing is
covered in oil to prevent rust, the oil can cause defect in production process. Table
4.9 will show the details of washing inner retainer bearing activities flow process
chart.
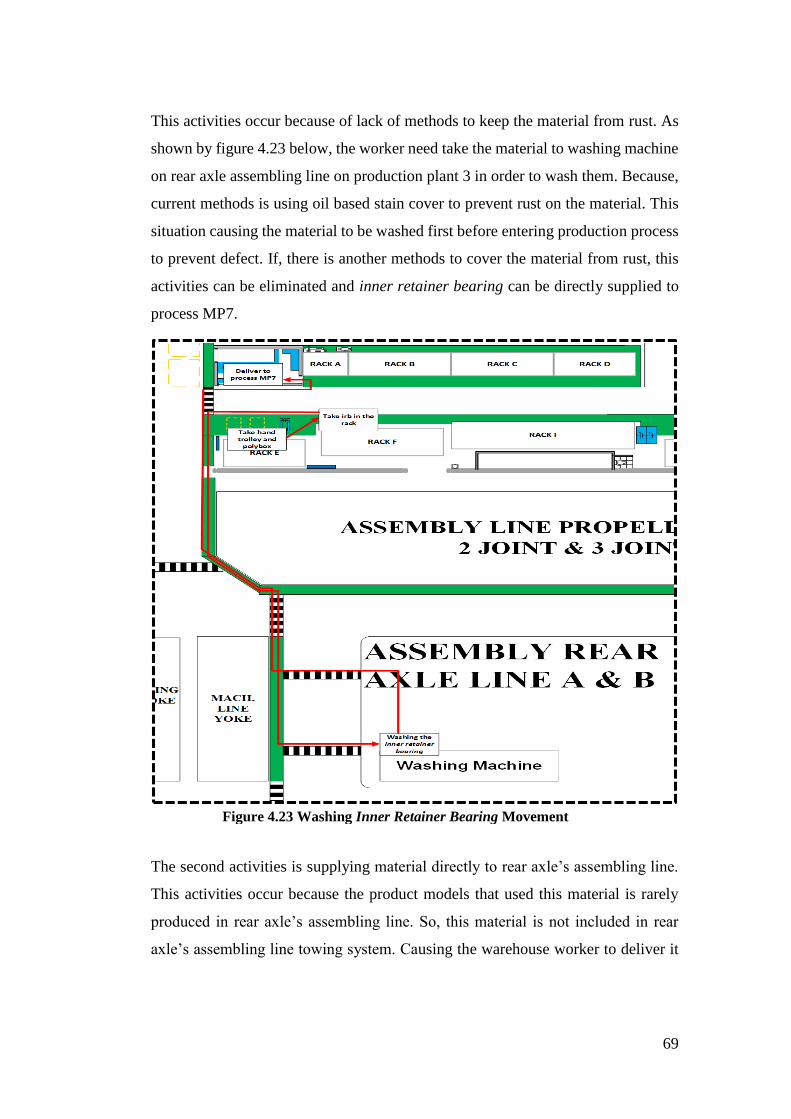
69
Figure 4.23 Washing Inner Retainer Bearing Movement
This activities occur because of lack of methods to keep the material from rust. As
shown by figure 4.23 below, the worker need take the material to washing machine
on rear axle assembling line on production plant 3 in order to wash them. Because,
current methods is using oil based stain cover to prevent rust on the material. This
situation causing the material to be washed first before entering production process
to prevent defect. If, there is another methods to cover the material from rust, this
activities can be eliminated and inner retainer bearing can be directly supplied to
process MP7.
The second activities is supplying material directly to rear axle’s assembling line.
This activities occur because the product models that used this material is rarely
produced in rear axle’s assembling line. So, this material is not included in rear
axle’s assembling line towing system. Causing the warehouse worker to deliver it
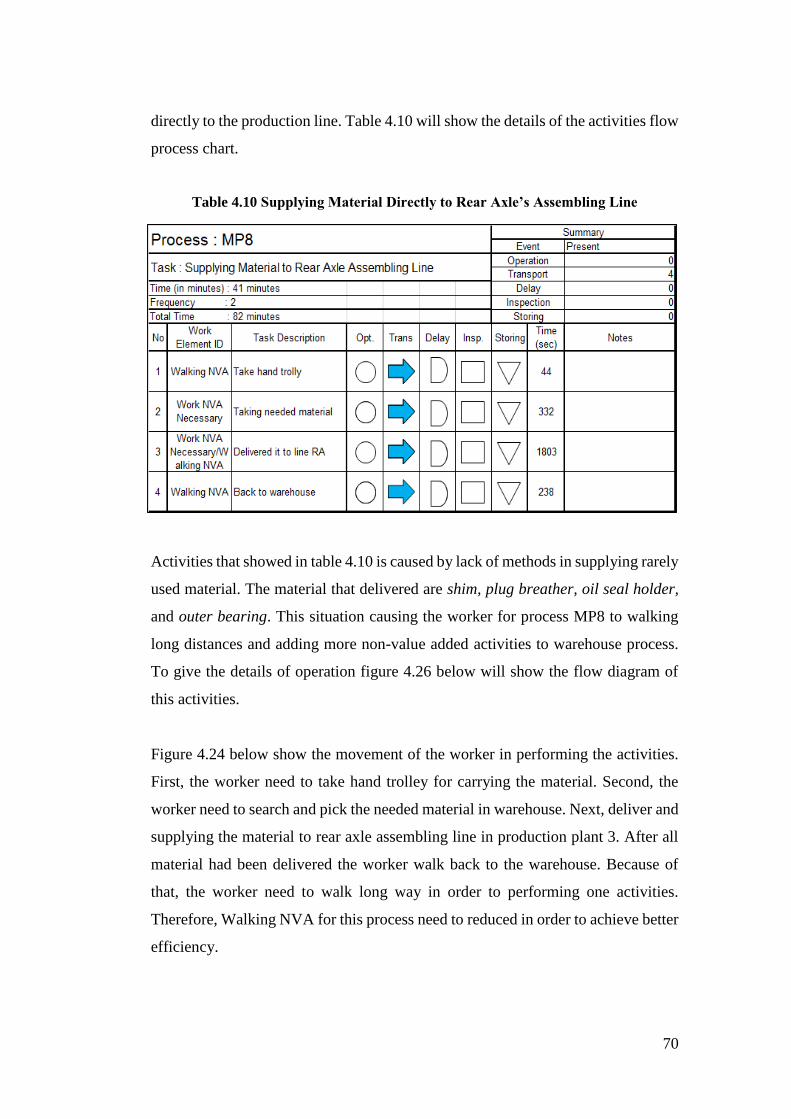
70
Table 4.10 Supplying Material Directly to Rear Axle’s Assembling Line
directly to the production line. Table 4.10 will show the details of the activities flow
process chart.
Activities that showed in table 4.10 is caused by lack of methods in supplying rarely
used material. The material that delivered are shim, plug breather, oil seal holder,
and outer bearing. This situation causing the worker for process MP8 to walking
long distances and adding more non-value added activities to warehouse process.
To give the details of operation figure 4.26 below will show the flow diagram of
this activities.
Figure 4.24 below show the movement of the worker in performing the activities.
First, the worker need to take hand trolley for carrying the material. Second, the
worker need to search and pick the needed material in warehouse. Next, deliver and
supplying the material to rear axle assembling line in production plant 3. After all
material had been delivered the worker walk back to the warehouse. Because of
that, the worker need to walk long way in order to performing one activities.
Therefore, Walking NVA for this process need to reduced in order to achieve better
efficiency.
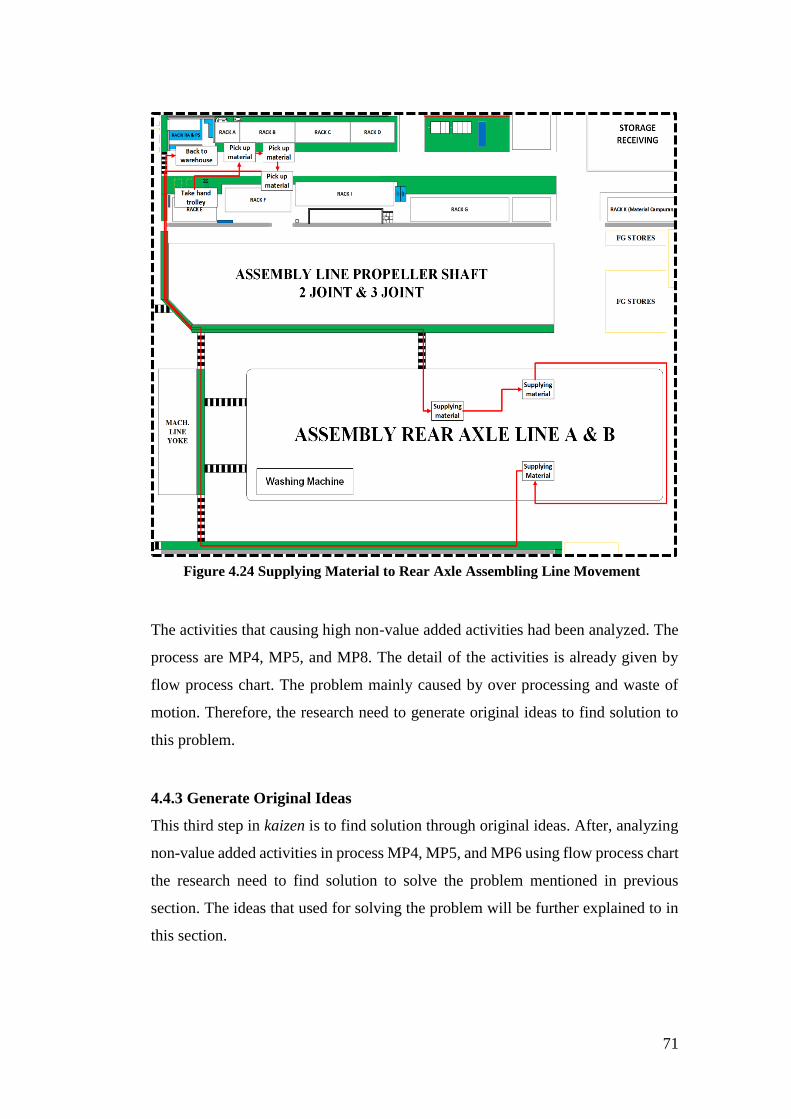
71
Figure 4.24 Supplying Material to Rear Axle Assembling Line Movement
The activities that causing high non-value added activities had been analyzed. The
process are MP4, MP5, and MP8. The detail of the activities is already given by
flow process chart. The problem mainly caused by over processing and waste of
motion. Therefore, the research need to generate original ideas to find solution to
this problem.
4.4.3 Generate Original Ideas
This third step in kaizen is to find solution through original ideas. After, analyzing
non-value added activities in process MP4, MP5, and MP6 using flow process chart
the research need to find solution to solve the problem mentioned in previous
section. The ideas that used for solving the problem will be further explained to in
this section.
72
Ideas For Process MP4
As mentioned in previous section, the problem in process MP4 is over processing
in replenishing rack of housing’s small material. The root cause of this problem is
different between material quantities with production lot. The research proposed
ideas is to standardized material quantity from supplier. The company proposed
standard quantity per packing to supplier in order to match the quantity with
production lot. Therefore, the worker does not need to change the quantity before
put the material into rack, so the material can directly put into the rack.
Ideas For Process MP5
As mentioned in previous section, the problem in process MP5 is over processing
in replenishing shutter of housing’s material. This condition is caused by non-
standard material packing and quantity. Causing the worker to move the material to
standard polybox before put it on the shutter. The research proposed to the company
to standardize their supplier material packing and quantity to match the production
lot and warehouse current condition. Therefore, with standard polybox and quantity
the worker only need to put the material directly to the shutter.
Ideas For Process MP8
As mentioned in previous section, the problem in process MP8 is waste of motion.
For the first activities which is washing inner retainer bearing, the research
proposed to Supplier Company to change from oil-based rust preventive to water-
based rust preventive. This idea will make inner retainer bearing does not need to
be washed before entering production process. Therefore, washing inner retainer
bearing activities can be eliminated.
For the second activities which is supplying material directly to rear axle’s
assembling line. The research proposed solution for this problem is to create system
for material ordering using bill or note. The worker in the warehouse only need to
odder picking the material and put it into special rack, then if the material needed
in the production process the group leader of rear axle’s assembling line will order
the material into the warehouse and take the needed material then distribute it to the
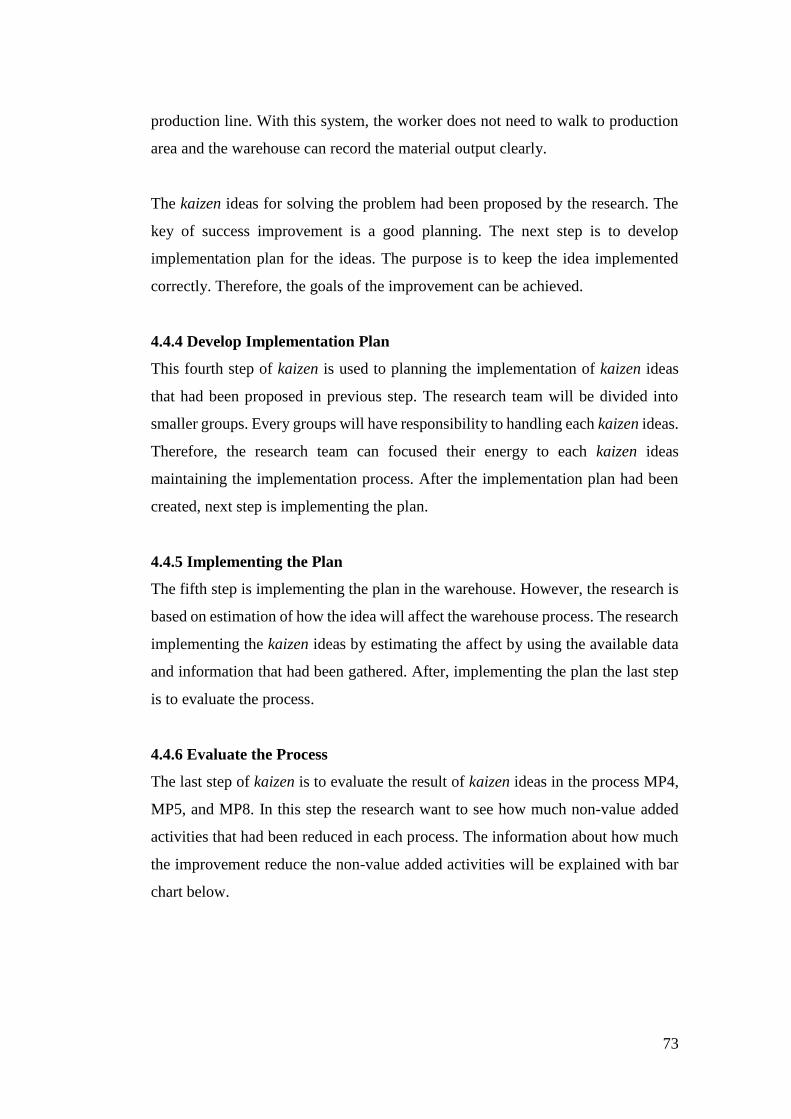
73
production line. With this system, the worker does not need to walk to production
area and the warehouse can record the material output clearly.
The kaizen ideas for solving the problem had been proposed by the research. The
key of success improvement is a good planning. The next step is to develop
implementation plan for the ideas. The purpose is to keep the idea implemented
correctly. Therefore, the goals of the improvement can be achieved.
4.4.4 Develop Implementation Plan
This fourth step of kaizen is used to planning the implementation of kaizen ideas
that had been proposed in previous step. The research team will be divided into
smaller groups. Every groups will have responsibility to handling each kaizen ideas.
Therefore, the research team can focused their energy to each kaizen ideas
maintaining the implementation process. After the implementation plan had been
created, next step is implementing the plan.
4.4.5 Implementing the Plan
The fifth step is implementing the plan in the warehouse. However, the research is
based on estimation of how the idea will affect the warehouse process. The research
implementing the kaizen ideas by estimating the affect by using the available data
and information that had been gathered. After, implementing the plan the last step
is to evaluate the process.
4.4.6 Evaluate the Process
The last step of kaizen is to evaluate the result of kaizen ideas in the process MP4,
MP5, and MP8. In this step the research want to see how much non-value added
activities that had been reduced in each process. The information about how much
the improvement reduce the non-value added activities will be explained with bar
chart below.
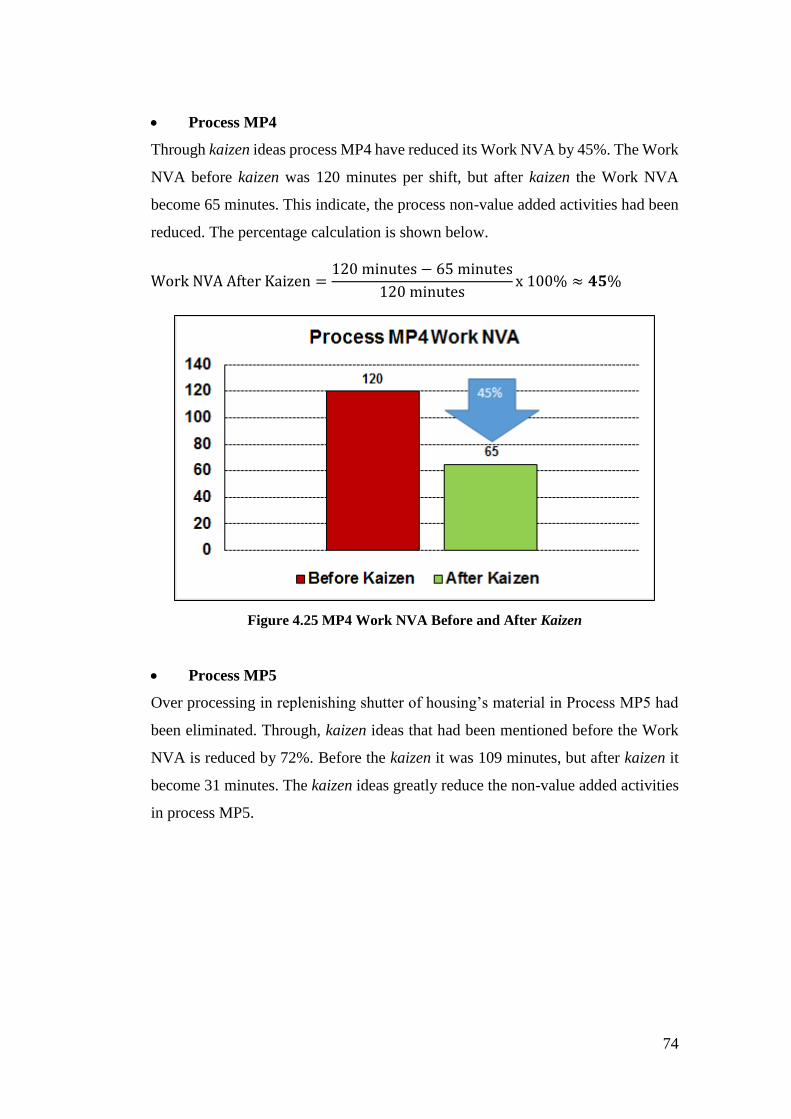
74
Figure 4.25 MP4 Work NVA Before and After Kaizen
Process MP4
Through kaizen ideas process MP4 have reduced its Work NVA by 45%. The Work
NVA before kaizen was 120 minutes per shift, but after kaizen the Work NVA
become 65 minutes. This indicate, the process non-value added activities had been
reduced. The percentage calculation is shown below.
Work NVA After Kaizen =120 minutes − 65 minutes
120 minutesx 100% ≈ 𝟒𝟓%
Process MP5
Over processing in replenishing shutter of housing’s material in Process MP5 had
been eliminated. Through, kaizen ideas that had been mentioned before the Work
NVA is reduced by 72%. Before the kaizen it was 109 minutes, but after kaizen it
become 31 minutes. The kaizen ideas greatly reduce the non-value added activities
in process MP5.
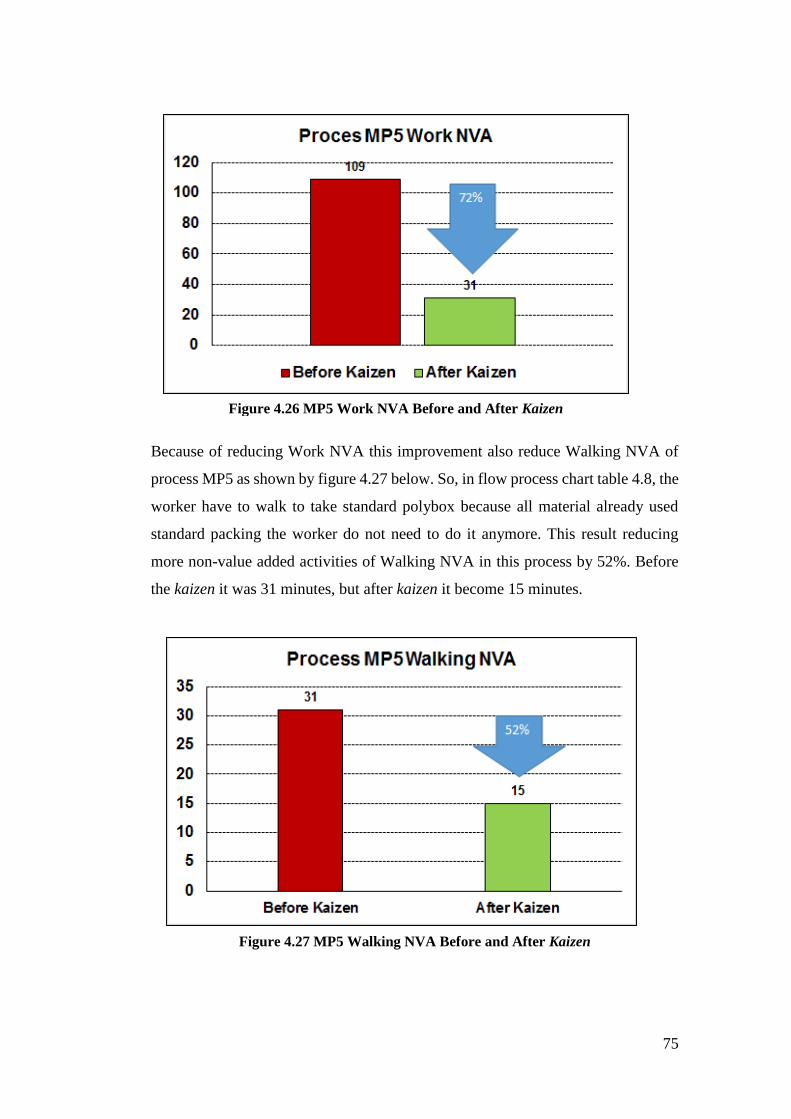
75
Figure 4.26 MP5 Work NVA Before and After Kaizen
Because of reducing Work NVA this improvement also reduce Walking NVA of
process MP5 as shown by figure 4.27 below. So, in flow process chart table 4.8, the
worker have to walk to take standard polybox because all material already used
standard packing the worker do not need to do it anymore. This result reducing
more non-value added activities of Walking NVA in this process by 52%. Before
the kaizen it was 31 minutes, but after kaizen it become 15 minutes.
Figure 4.27 MP5 Walking NVA Before and After Kaizen
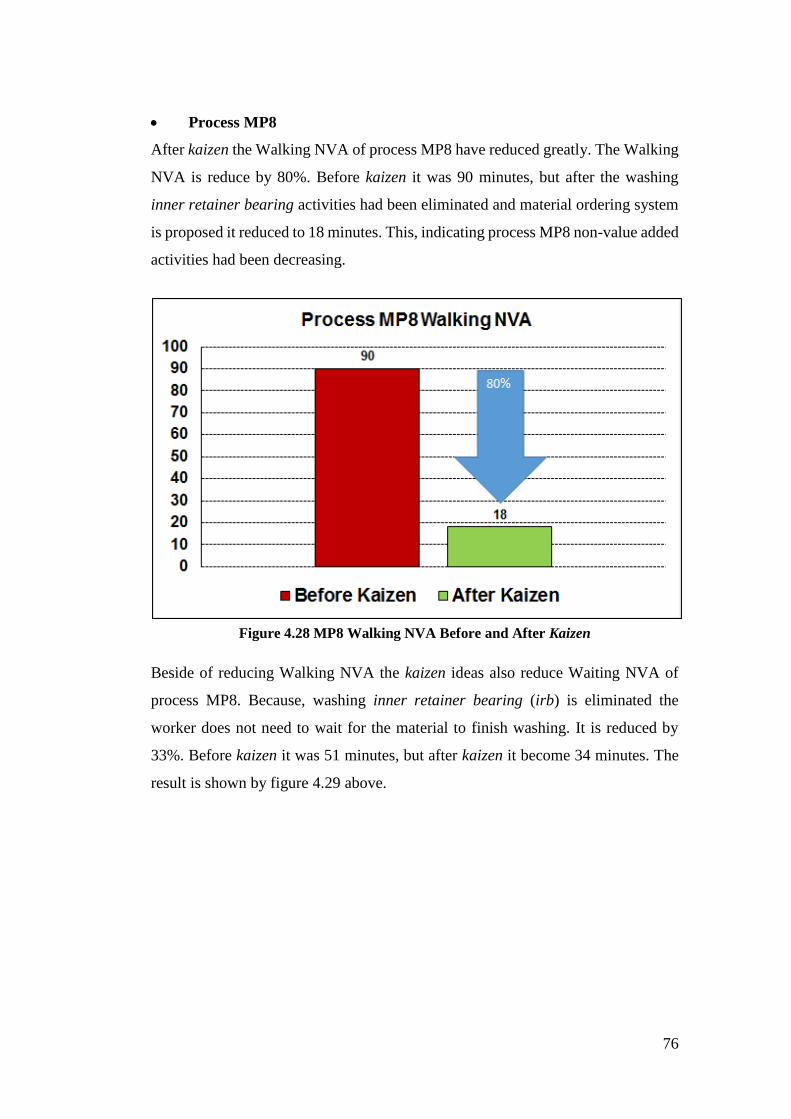
76
Figure 4.28 MP8 Walking NVA Before and After Kaizen
Process MP8
After kaizen the Walking NVA of process MP8 have reduced greatly. The Walking
NVA is reduce by 80%. Before kaizen it was 90 minutes, but after the washing
inner retainer bearing activities had been eliminated and material ordering system
is proposed it reduced to 18 minutes. This, indicating process MP8 non-value added
activities had been decreasing.
Beside of reducing Walking NVA the kaizen ideas also reduce Waiting NVA of
process MP8. Because, washing inner retainer bearing (irb) is eliminated the
worker does not need to wait for the material to finish washing. It is reduced by
33%. Before kaizen it was 51 minutes, but after kaizen it become 34 minutes. The
result is shown by figure 4.29 above.
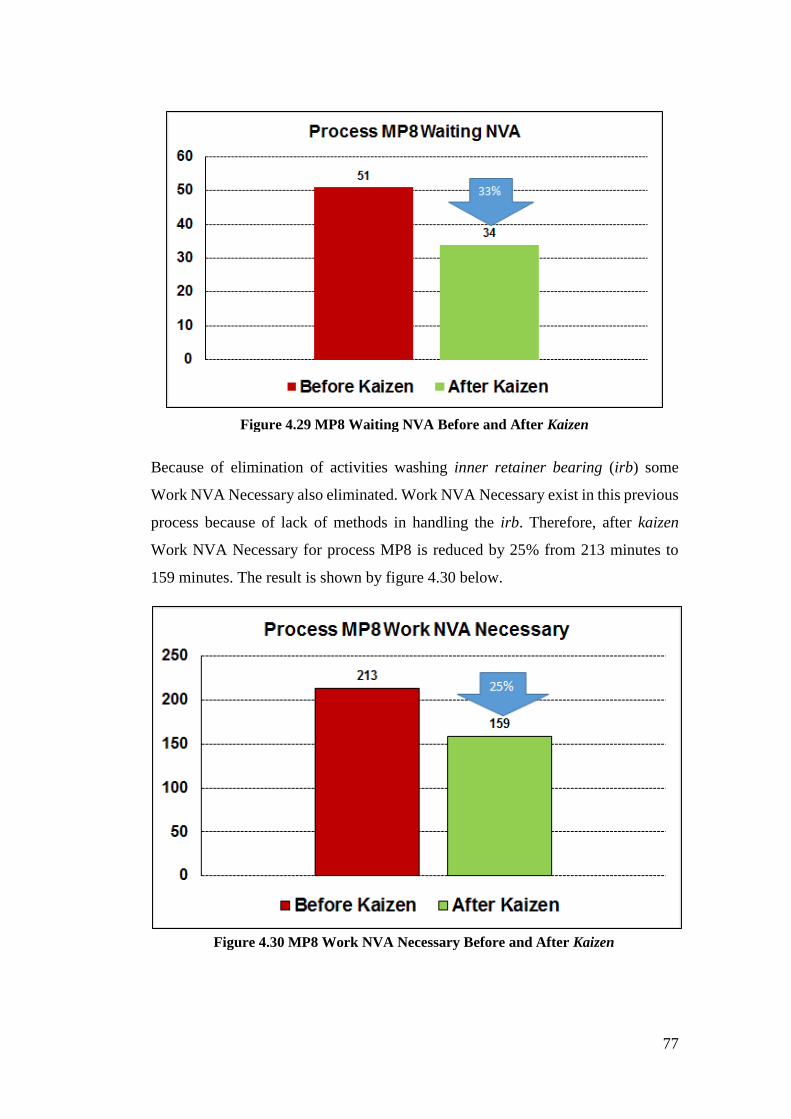
77
Figure 4.29 MP8 Waiting NVA Before and After Kaizen
Figure 4.30 MP8 Work NVA Necessary Before and After Kaizen
Because of elimination of activities washing inner retainer bearing (irb) some
Work NVA Necessary also eliminated. Work NVA Necessary exist in this previous
process because of lack of methods in handling the irb. Therefore, after kaizen
Work NVA Necessary for process MP8 is reduced by 25% from 213 minutes to
159 minutes. The result is shown by figure 4.30 below.
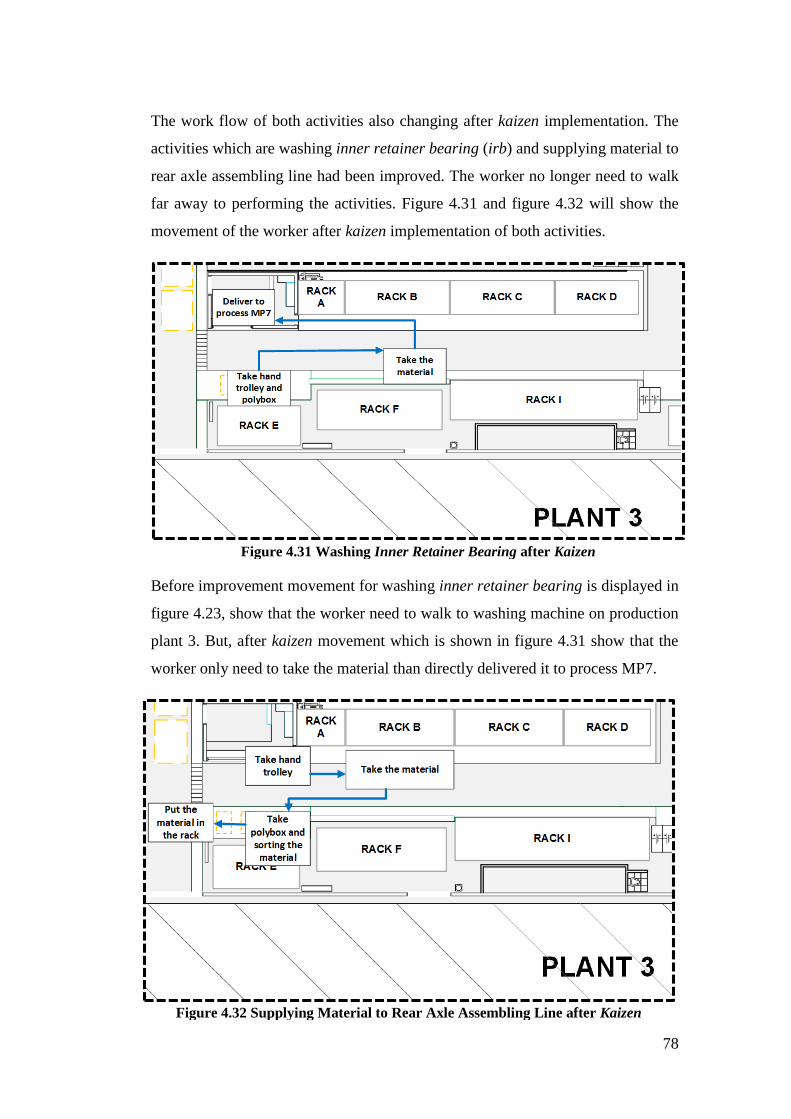
78
Figure 4.31 Washing Inner Retainer Bearing after Kaizen
Figure 4.32 Supplying Material to Rear Axle Assembling Line after Kaizen
The work flow of both activities also changing after kaizen implementation. The
activities which are washing inner retainer bearing (irb) and supplying material to
rear axle assembling line had been improved. The worker no longer need to walk
far away to performing the activities. Figure 4.31 and figure 4.32 will show the
movement of the worker after kaizen implementation of both activities.
Before improvement movement for washing inner retainer bearing is displayed in
figure 4.23, show that the worker need to walk to washing machine on production
plant 3. But, after kaizen movement which is shown in figure 4.31 show that the
worker only need to take the material than directly delivered it to process MP7.
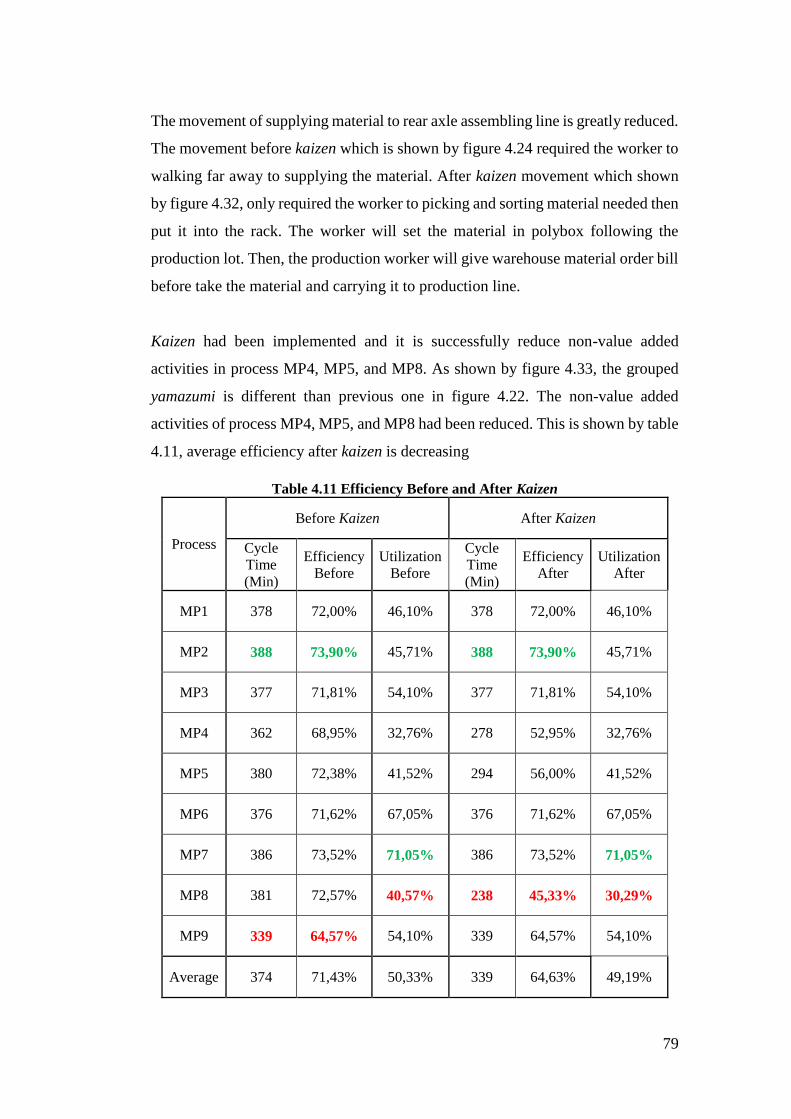
79
The movement of supplying material to rear axle assembling line is greatly reduced.
The movement before kaizen which is shown by figure 4.24 required the worker to
walking far away to supplying the material. After kaizen movement which shown
by figure 4.32, only required the worker to picking and sorting material needed then
put it into the rack. The worker will set the material in polybox following the
production lot. Then, the production worker will give warehouse material order bill
before take the material and carrying it to production line.
Kaizen had been implemented and it is successfully reduce non-value added
activities in process MP4, MP5, and MP8. As shown by figure 4.33, the grouped
yamazumi is different than previous one in figure 4.22. The non-value added
activities of process MP4, MP5, and MP8 had been reduced. This is shown by table
4.11, average efficiency after kaizen is decreasing
Table 4.11 Efficiency Before and After Kaizen
Process
Before Kaizen After Kaizen
Cycle
Time
(Min)
Efficiency
Before
Utilization
Before
Cycle
Time
(Min)
Efficiency
After
Utilization
After
MP1 378 72,00% 46,10% 378 72,00% 46,10%
MP2 388 73,90% 45,71% 388 73,90% 45,71%
MP3 377 71,81% 54,10% 377 71,81% 54,10%
MP4 362 68,95% 32,76% 278 52,95% 32,76%
MP5 380 72,38% 41,52% 294 56,00% 41,52%
MP6 376 71,62% 67,05% 376 71,62% 67,05%
MP7 386 73,52% 71,05% 386 73,52% 71,05%
MP8 381 72,57% 40,57% 238 45,33% 30,29%
MP9 339 64,57% 54,10% 339 64,57% 54,10%
Average 374 71,43% 50,33% 339 64,63% 49,19%
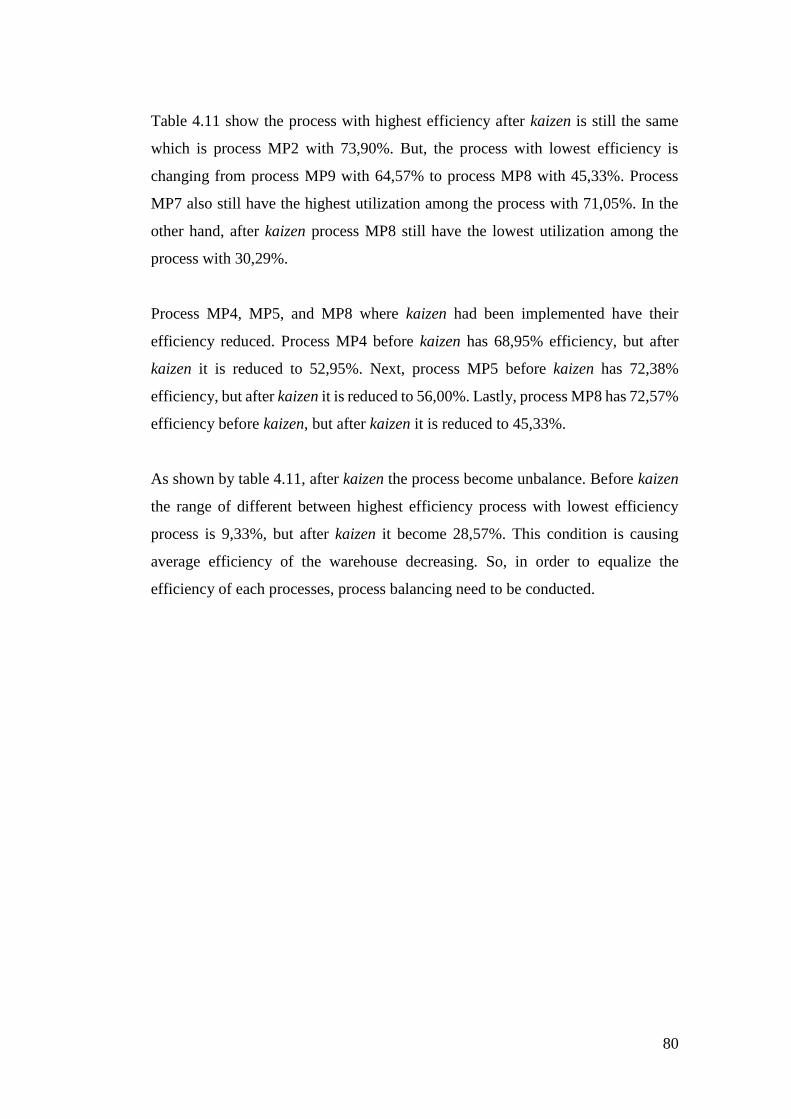
80
Table 4.11 show the process with highest efficiency after kaizen is still the same
which is process MP2 with 73,90%. But, the process with lowest efficiency is
changing from process MP9 with 64,57% to process MP8 with 45,33%. Process
MP7 also still have the highest utilization among the process with 71,05%. In the
other hand, after kaizen process MP8 still have the lowest utilization among the
process with 30,29%.
Process MP4, MP5, and MP8 where kaizen had been implemented have their
efficiency reduced. Process MP4 before kaizen has 68,95% efficiency, but after
kaizen it is reduced to 52,95%. Next, process MP5 before kaizen has 72,38%
efficiency, but after kaizen it is reduced to 56,00%. Lastly, process MP8 has 72,57%
efficiency before kaizen, but after kaizen it is reduced to 45,33%.
As shown by table 4.11, after kaizen the process become unbalance. Before kaizen
the range of different between highest efficiency process with lowest efficiency
process is 9,33%, but after kaizen it become 28,57%. This condition is causing
average efficiency of the warehouse decreasing. So, in order to equalize the
efficiency of each processes, process balancing need to be conducted.
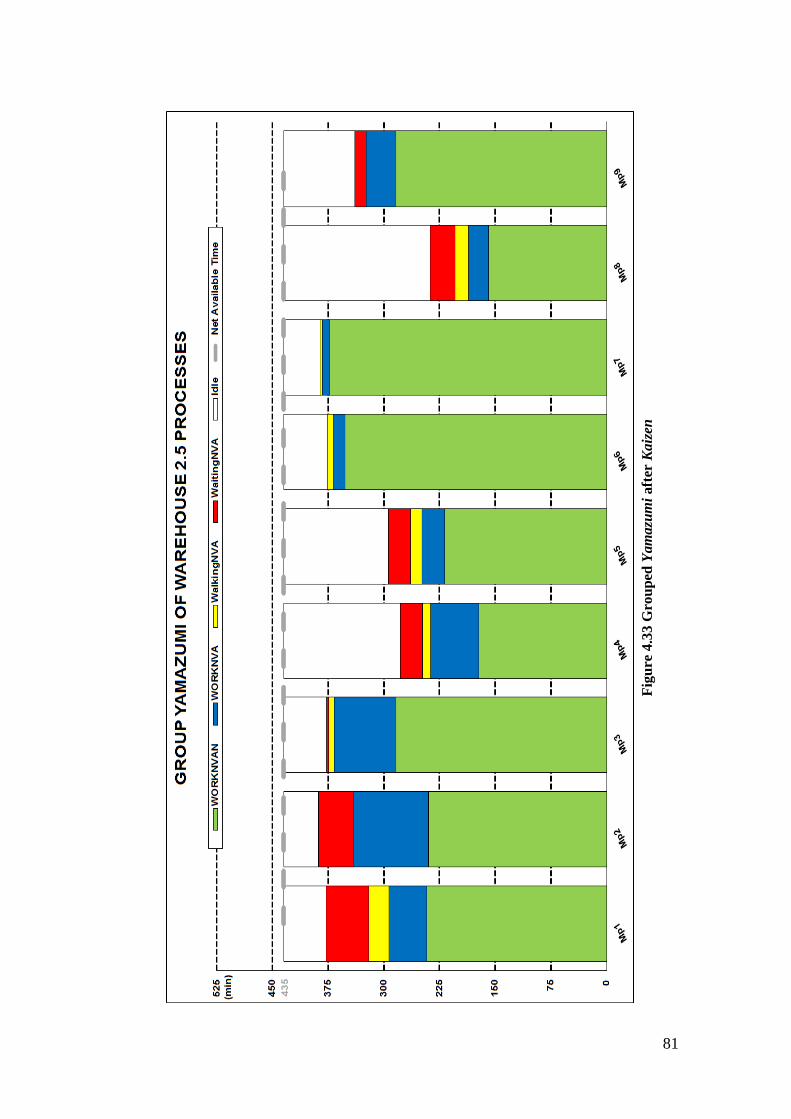
81
Fig
ure
4.3
3 G
rou
ped
Yam
azu
mi
aft
er K
aiz
en
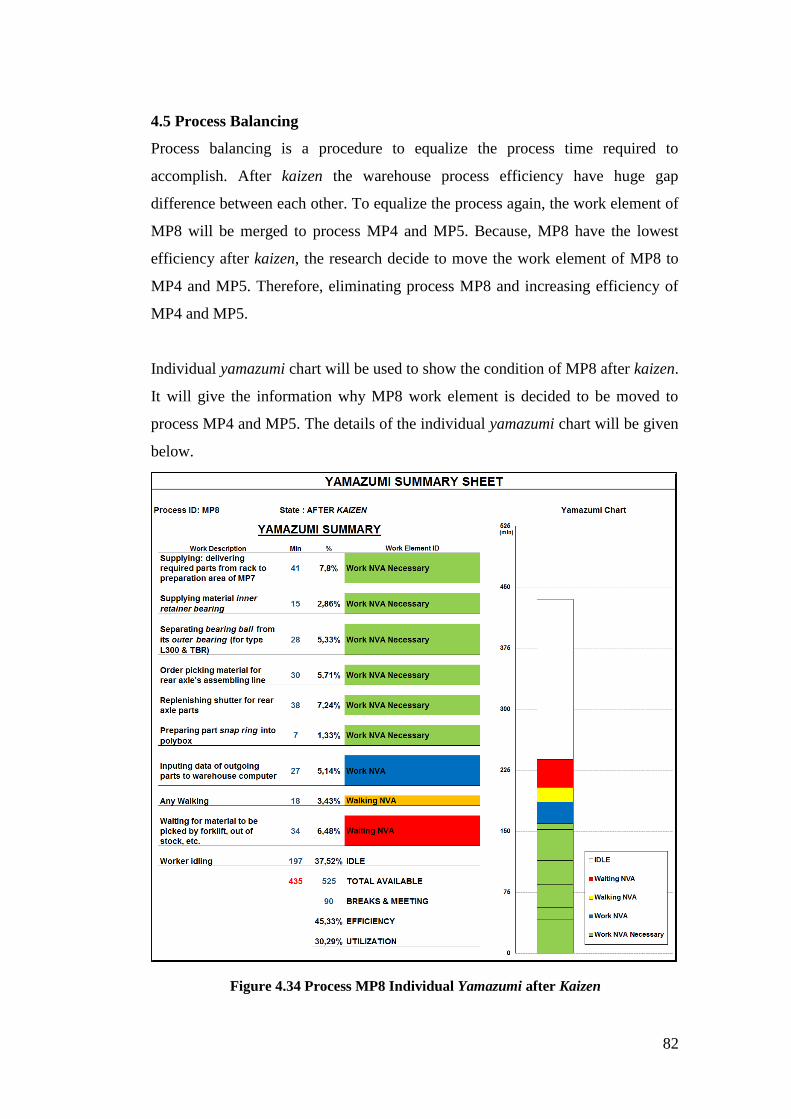
82
Figure 4.34 Process MP8 Individual Yamazumi after Kaizen
4.5 Process Balancing
Process balancing is a procedure to equalize the process time required to
accomplish. After kaizen the warehouse process efficiency have huge gap
difference between each other. To equalize the process again, the work element of
MP8 will be merged to process MP4 and MP5. Because, MP8 have the lowest
efficiency after kaizen, the research decide to move the work element of MP8 to
MP4 and MP5. Therefore, eliminating process MP8 and increasing efficiency of
MP4 and MP5.
Individual yamazumi chart will be used to show the condition of MP8 after kaizen.
It will give the information why MP8 work element is decided to be moved to
process MP4 and MP5. The details of the individual yamazumi chart will be given
below.
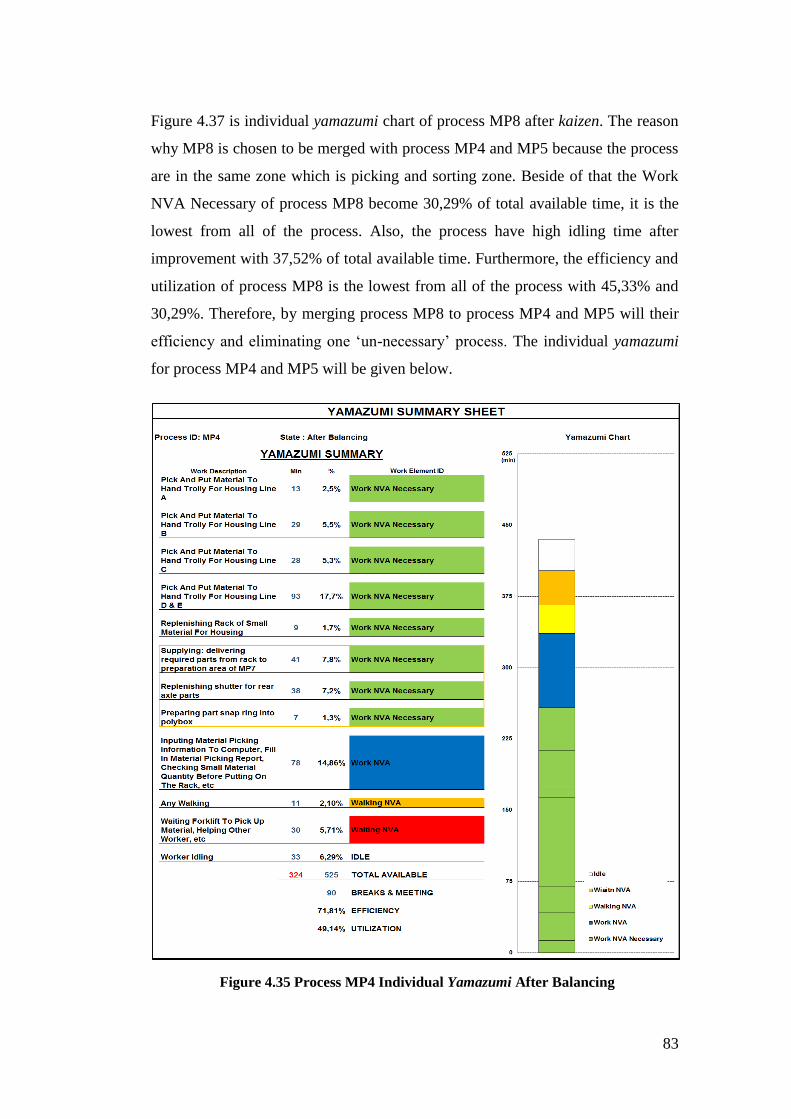
83
Figure 4.35 Process MP4 Individual Yamazumi After Balancing
Figure 4.37 is individual yamazumi chart of process MP8 after kaizen. The reason
why MP8 is chosen to be merged with process MP4 and MP5 because the process
are in the same zone which is picking and sorting zone. Beside of that the Work
NVA Necessary of process MP8 become 30,29% of total available time, it is the
lowest from all of the process. Also, the process have high idling time after
improvement with 37,52% of total available time. Furthermore, the efficiency and
utilization of process MP8 is the lowest from all of the process with 45,33% and
30,29%. Therefore, by merging process MP8 to process MP4 and MP5 will their
efficiency and eliminating one ‘un-necessary’ process. The individual yamazumi
for process MP4 and MP5 will be given below.
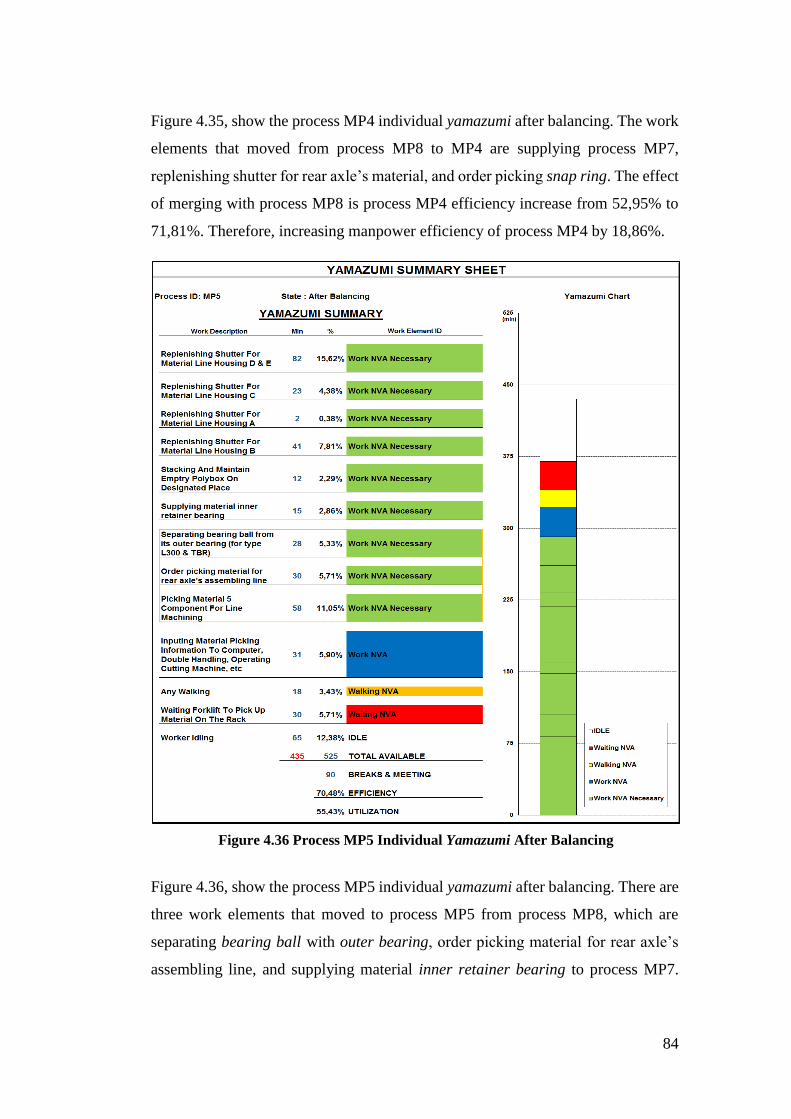
84
Figure 4.35, show the process MP4 individual yamazumi after balancing. The work
elements that moved from process MP8 to MP4 are supplying process MP7,
replenishing shutter for rear axle’s material, and order picking snap ring. The effect
of merging with process MP8 is process MP4 efficiency increase from 52,95% to
71,81%. Therefore, increasing manpower efficiency of process MP4 by 18,86%.
Figure 4.36, show the process MP5 individual yamazumi after balancing. There are
three work elements that moved to process MP5 from process MP8, which are
separating bearing ball with outer bearing, order picking material for rear axle’s
assembling line, and supplying material inner retainer bearing to process MP7.
Figure 4.36 Process MP5 Individual Yamazumi After Balancing
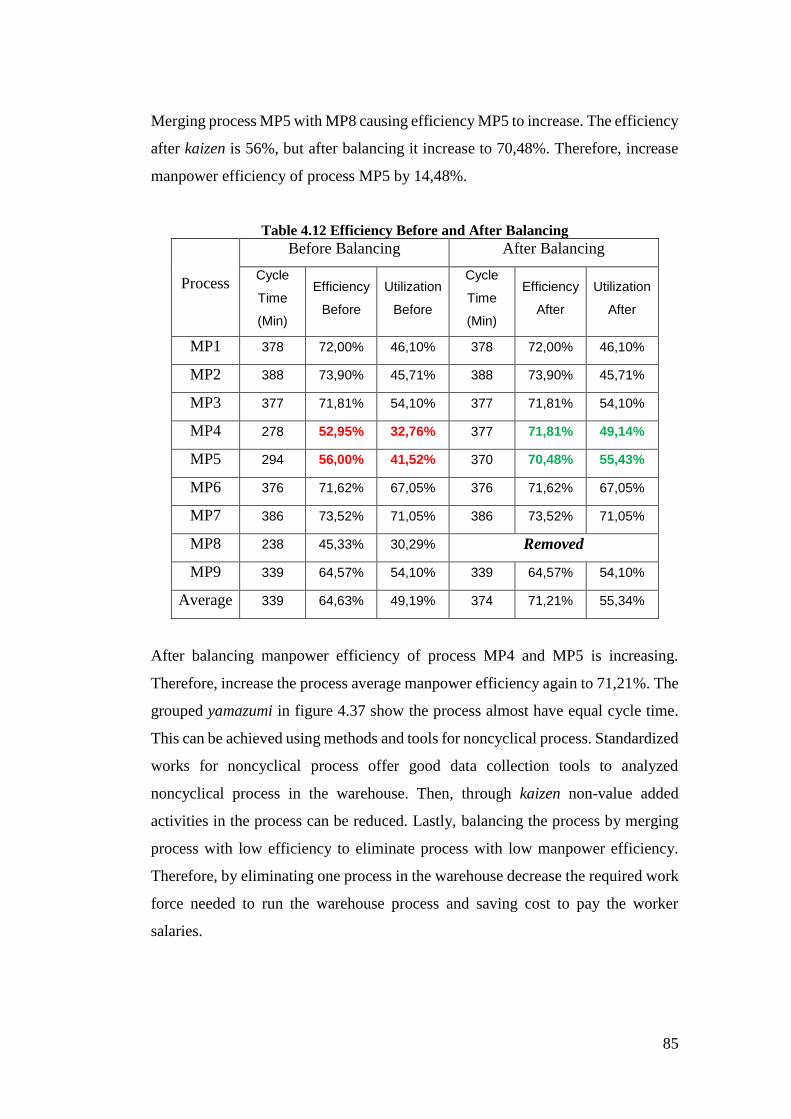
85
Merging process MP5 with MP8 causing efficiency MP5 to increase. The efficiency
after kaizen is 56%, but after balancing it increase to 70,48%. Therefore, increase
manpower efficiency of process MP5 by 14,48%.
Table 4.12 Efficiency Before and After Balancing
Process
Before Balancing After Balancing
Cycle
Time
(Min)
Efficiency
Before
Utilization
Before
Cycle
Time
(Min)
Efficiency
After
Utilization
After
MP1 378 72,00% 46,10% 378 72,00% 46,10%
MP2 388 73,90% 45,71% 388 73,90% 45,71%
MP3 377 71,81% 54,10% 377 71,81% 54,10%
MP4 278 52,95% 32,76% 377 71,81% 49,14%
MP5 294 56,00% 41,52% 370 70,48% 55,43%
MP6 376 71,62% 67,05% 376 71,62% 67,05%
MP7 386 73,52% 71,05% 386 73,52% 71,05%
MP8 238 45,33% 30,29% Removed
MP9 339 64,57% 54,10% 339 64,57% 54,10%
Average 339 64,63% 49,19% 374 71,21% 55,34%
After balancing manpower efficiency of process MP4 and MP5 is increasing.
Therefore, increase the process average manpower efficiency again to 71,21%. The
grouped yamazumi in figure 4.37 show the process almost have equal cycle time.
This can be achieved using methods and tools for noncyclical process. Standardized
works for noncyclical process offer good data collection tools to analyzed
noncyclical process in the warehouse. Then, through kaizen non-value added
activities in the process can be reduced. Lastly, balancing the process by merging
process with low efficiency to eliminate process with low manpower efficiency.
Therefore, by eliminating one process in the warehouse decrease the required work
force needed to run the warehouse process and saving cost to pay the worker
salaries.
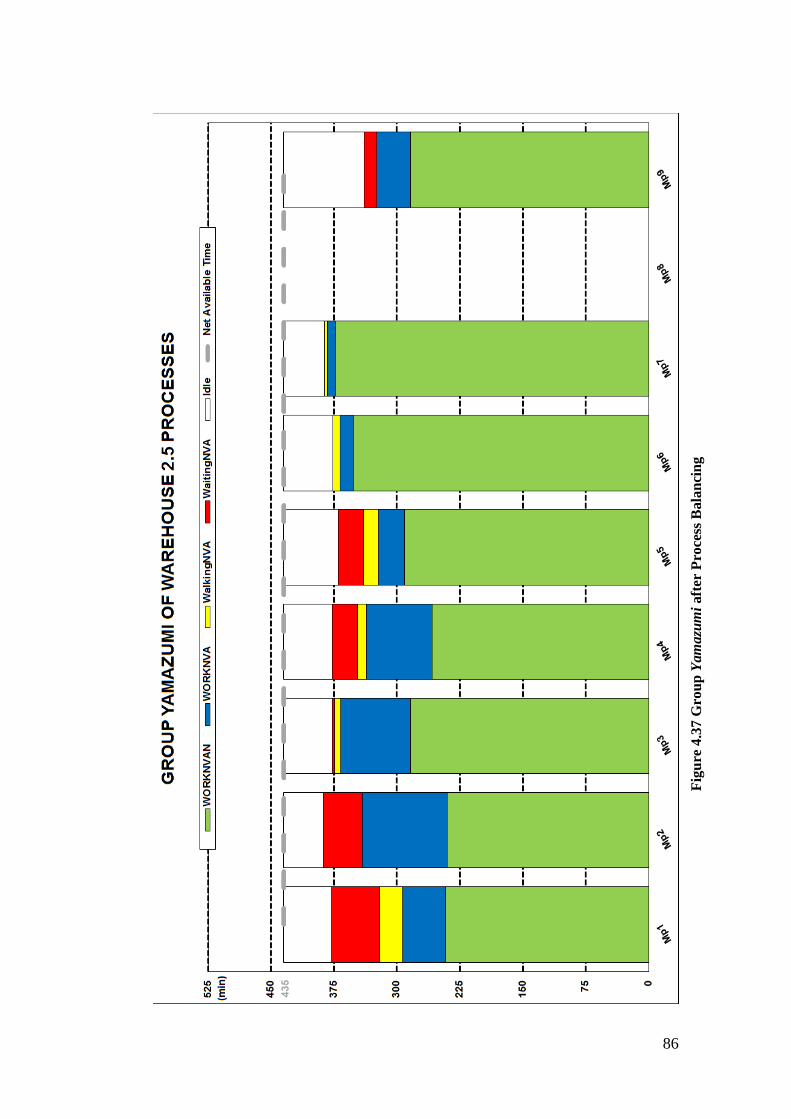
86
Fig
ure
4.3
7 G
rou
p Y
am
azu
mi
aft
er P
roce
ss B
ala
nci
ng
87
4.6 Cost Saving Calculation
Process MP8 has been merged to process MP4 and MP5, so the warehouse does not
need work force to performing process MP8. Therefore, reducing number of worker
in the warehouse. This condition can saving some production cost for the company.
The cost saving calculation is shown below.
Total cost saved/ year = Minimum salaries x 1 worker x 3 shifts x 12 months
= Rp.3.100.000 x 1 x 3 x 12 = Rp.111.600.000
IJK Company is located in Jakarta region, the minimum salaries in that region is
Rp.3.100.000. Then, process MP8 is performed by one worker per shift. There are
three shift in one day, so total three worker performing this process in one day. So,
total cost saved in one year is Rp.111.600.000 this calculation does not include
medical insurance, life insurance, worker family support, transportation cost, etc.
Actually the research is save more cost than stated above, because the research does
not have enough data to calculate the job costing for each worker.
88
CHAPTER V
CONCLUSION AND RECOMMENDATION
5.1 Conclusion
Based on the result of this research, there three conclusions that can be answer the
objective of this research:
By using standardized works for noncyclical process data collecting tools
which are noncyclic work summary sheet and yamazumi chart every process
manpower efficiency and utilization of current process can be known. The
efficiency and utilization data is presented in table 4.6. The overall efficiency
of nine warehouse current process is 71,43% and overall utilization of
warehouse current process is 49,19%.
Kaizen does not increase the manpower efficiency and utilization of
warehouse process. But, it help reducing non-value added activities in the
warehouse. The process that is focused in reducing their non-value added
activities in this research are process MP4, MP5 and MP8. This process was
chosen, because they have the highest amount of non-value added activities
than other process. The manpower efficiency and utilization after kaizen can
be seen in table 4.11. The average manpower efficiency had been reduced,
because kaizen reduce the warehouse process non-value added activities. It is
reduced from 71,43% to 64,63%. In the other hand, utilization still have the
average percentage in 49,19%. It is because kaizen did not directly reduce
Work NVA Necessary in the process.
After process balancing, process MP8 is merged with process MP4 and MP5,
causing process MP8 to be removed. The purpose is to equalized the process
cycle time and efficiency. Furthermore, average efficiency of warehouse
process is back to 71,21%. Also, process MP4 and MP5 manpower efficiency
is increase to 71,81% and 70,48% respectively. This condition also save
production cost for the company, because its reduce number of worker needed
89
to run the process from nine to eight workers. The company benefit is
Rp.111.600.000, this cost is only calculate salaries and does not include
insurance and other economic support. Actually, the company saved more
costs than showed above because of lack of data the research cannot fully
calculated the real cost that had been saved by this improvement.
5.2 Recommendation
The recommendation for future research as follows:
Reduce non-value added activities in process MP2, MP3, and MP4.
Another recommendation is to using standardized works for noncyclical
process for other warehouse in IJK Company to maintain their warehousing
process.
90
REFERENCES
Beach, Dale S. (1980). Personnel: The Management of People at Work. Collier
Macmillan Ltd.
Brunet, A.P., and New, S. (2003) Kaizen in Japan: An Empirical Study.
International Journal of Operations and Production Management, Vol.
23(12), pp. 14-26.
Heragu, S. (2008). Facilities Design: Third Edition. Florida. Taylor and Francis
Group.
Hines, Peter, & Rich, Nick. (1997). The Seven Value Stream Mapping Tools.
International Journal of Operations & Production Management, Vol. 17 Iss:
1 pp. 46 - 64
Imai, Masaaki. (1986). Kaizen: The Key To Japan's Competitive Success. New
York, itd: McGraw-Hill.
Kato, Isao & Smalley, A. (2011). Toyota Kaizen Methods Six Steps to Improvement.
New york. Taylor & Francis Group.
Niederstadt, Joseph (2010). Standardized Works For Nocyclical Process. Florida.
Taylor & Francis Group, LLC.
Womack, J. P., Jones, D. T., & Roos, D. (1990). The Machine that Changed the
World. Harper Perennial: New York.
Wilson, L. (2010). How To Implement Lean Manufacturing. New York: McGraw-
Hill.
https://gembaacademy.com/2010/11/22/three_types_of_standardized_work/
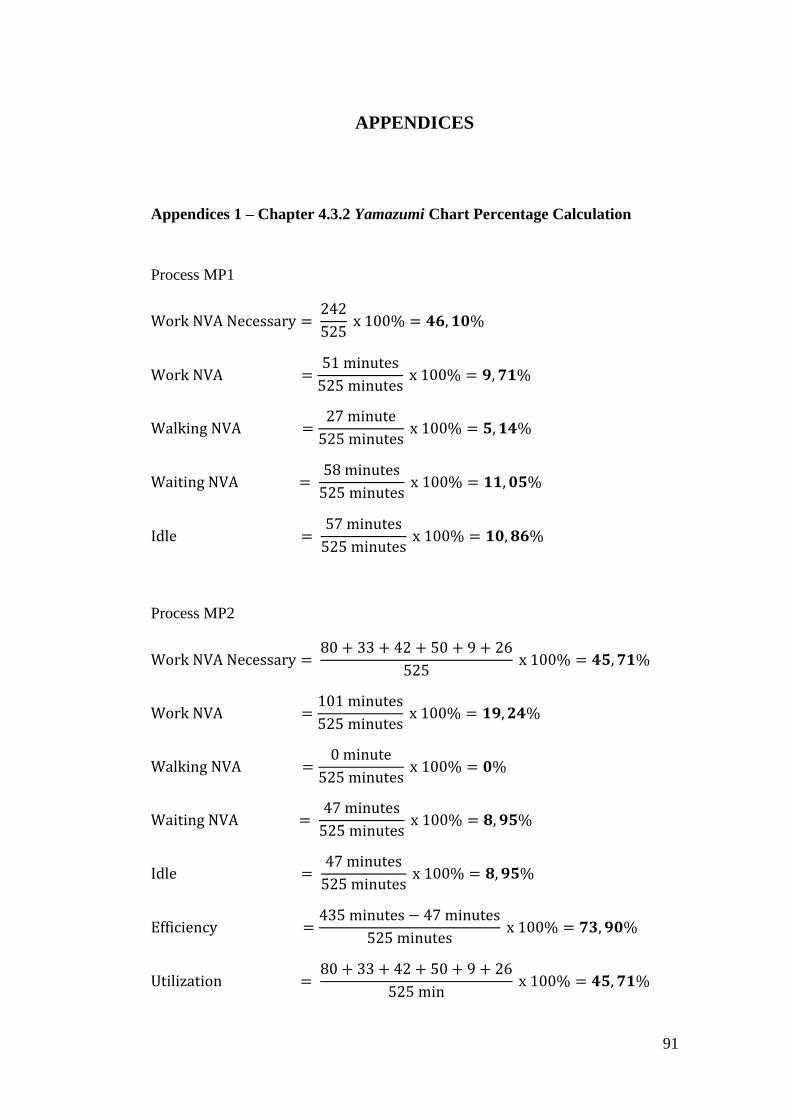
91
APPENDICES
Appendices 1 – Chapter 4.3.2 Yamazumi Chart Percentage Calculation
Process MP1
Work NVA Necessary = 242
525 x 100% = 𝟒𝟔, 𝟏𝟎%
Work NVA =51 minutes
525 minutes x 100% = 𝟗, 𝟕𝟏%
Walking NVA =27 minute
525 minutes x 100% = 𝟓, 𝟏𝟒%
Waiting NVA = 58 minutes
525 minutes x 100% = 𝟏𝟏, 𝟎𝟓%
Idle = 57 minutes
525 minutes x 100% = 𝟏𝟎, 𝟖𝟔%
Process MP2
Work NVA Necessary = 80 + 33 + 42 + 50 + 9 + 26
525 x 100% = 𝟒𝟓, 𝟕𝟏%
Work NVA =101 minutes
525 minutes x 100% = 𝟏𝟗, 𝟐𝟒%
Walking NVA =0 minute
525 minutes x 100% = 𝟎%
Waiting NVA = 47 minutes
525 minutes x 100% = 𝟖, 𝟗𝟓%
Idle = 47 minutes
525 minutes x 100% = 𝟖, 𝟗𝟓%
Efficiency =435 minutes − 47 minutes
525 minutes x 100% = 𝟕𝟑, 𝟗𝟎%
Utilization = 80 + 33 + 42 + 50 + 9 + 26
525 min x 100% = 𝟒𝟓, 𝟕𝟏%
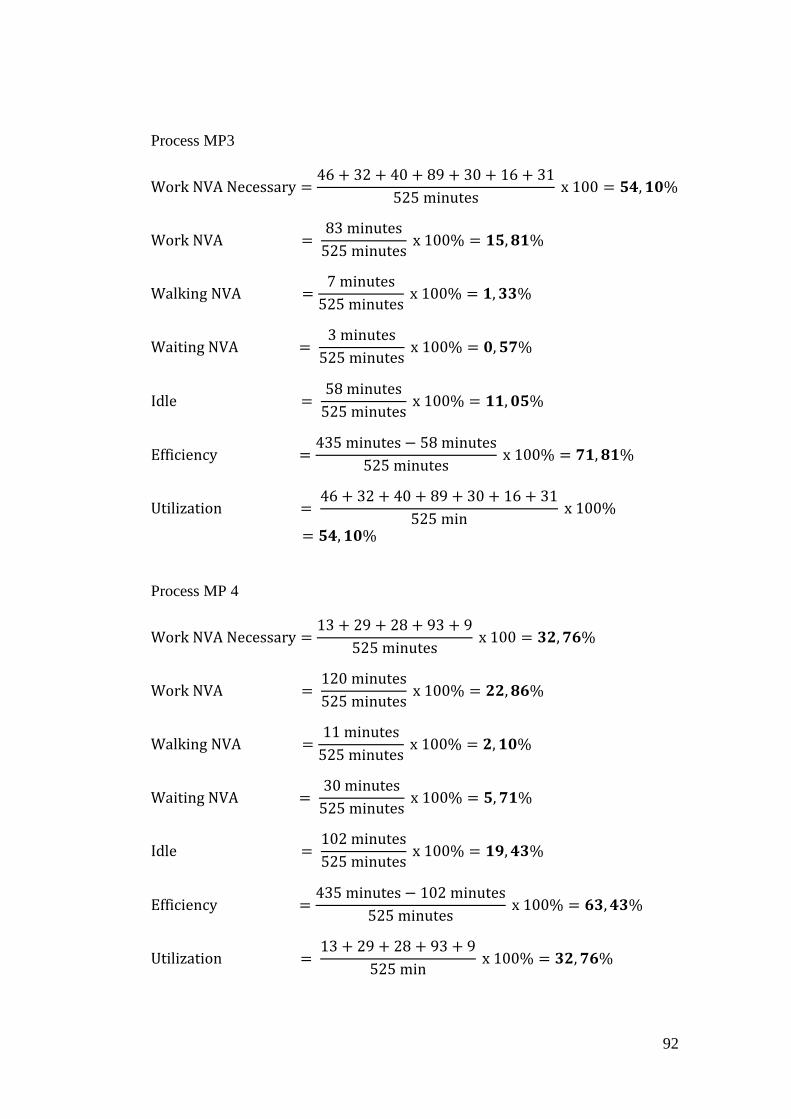
92
Process MP3
Work NVA Necessary =46 + 32 + 40 + 89 + 30 + 16 + 31
525 minutes x 100 = 𝟓𝟒, 𝟏𝟎%
Work NVA = 83 minutes
525 minutes x 100% = 𝟏𝟓, 𝟖𝟏%
Walking NVA =7 minutes
525 minutes x 100% = 𝟏, 𝟑𝟑%
Waiting NVA = 3 minutes
525 minutes x 100% = 𝟎, 𝟓𝟕%
Idle = 58 minutes
525 minutes x 100% = 𝟏𝟏, 𝟎𝟓%
Efficiency =435 minutes − 58 minutes
525 minutes x 100% = 𝟕𝟏, 𝟖𝟏%
Utilization = 46 + 32 + 40 + 89 + 30 + 16 + 31
525 min x 100%
= 𝟓𝟒, 𝟏𝟎%
Process MP 4
Work NVA Necessary =13 + 29 + 28 + 93 + 9
525 minutes x 100 = 𝟑𝟐, 𝟕𝟔%
Work NVA = 120 minutes
525 minutes x 100% = 𝟐𝟐, 𝟖𝟔%
Walking NVA =11 minutes
525 minutes x 100% = 𝟐, 𝟏𝟎%
Waiting NVA = 30 minutes
525 minutes x 100% = 𝟓, 𝟕𝟏%
Idle = 102 minutes
525 minutes x 100% = 𝟏𝟗, 𝟒𝟑%
Efficiency =435 minutes − 102 minutes
525 minutes x 100% = 𝟔𝟑, 𝟒𝟑%
Utilization = 13 + 29 + 28 + 93 + 9
525 min x 100% = 𝟑𝟐, 𝟕𝟔%
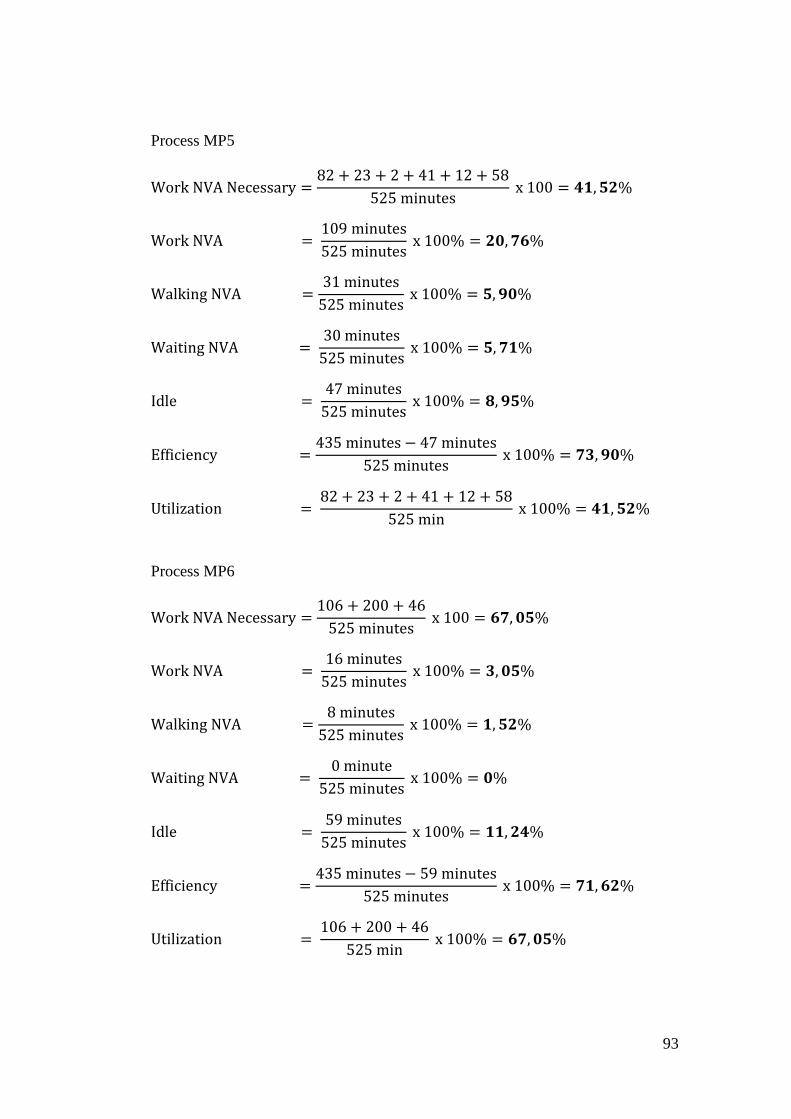
93
Process MP5
Work NVA Necessary =82 + 23 + 2 + 41 + 12 + 58
525 minutes x 100 = 𝟒𝟏, 𝟓𝟐%
Work NVA = 109 minutes
525 minutes x 100% = 𝟐𝟎, 𝟕𝟔%
Walking NVA =31 minutes
525 minutes x 100% = 𝟓, 𝟗𝟎%
Waiting NVA = 30 minutes
525 minutes x 100% = 𝟓, 𝟕𝟏%
Idle = 47 minutes
525 minutes x 100% = 𝟖, 𝟗𝟓%
Efficiency =435 minutes − 47 minutes
525 minutes x 100% = 𝟕𝟑, 𝟗𝟎%
Utilization = 82 + 23 + 2 + 41 + 12 + 58
525 min x 100% = 𝟒𝟏, 𝟓𝟐%
Process MP6
Work NVA Necessary =106 + 200 + 46
525 minutes x 100 = 𝟔𝟕, 𝟎𝟓%
Work NVA = 16 minutes
525 minutes x 100% = 𝟑, 𝟎𝟓%
Walking NVA =8 minutes
525 minutes x 100% = 𝟏, 𝟓𝟐%
Waiting NVA = 0 minute
525 minutes x 100% = 𝟎%
Idle = 59 minutes
525 minutes x 100% = 𝟏𝟏, 𝟐𝟒%
Efficiency =435 minutes − 59 minutes
525 minutes x 100% = 𝟕𝟏, 𝟔𝟐%
Utilization = 106 + 200 + 46
525 min x 100% = 𝟔𝟕, 𝟎𝟓%
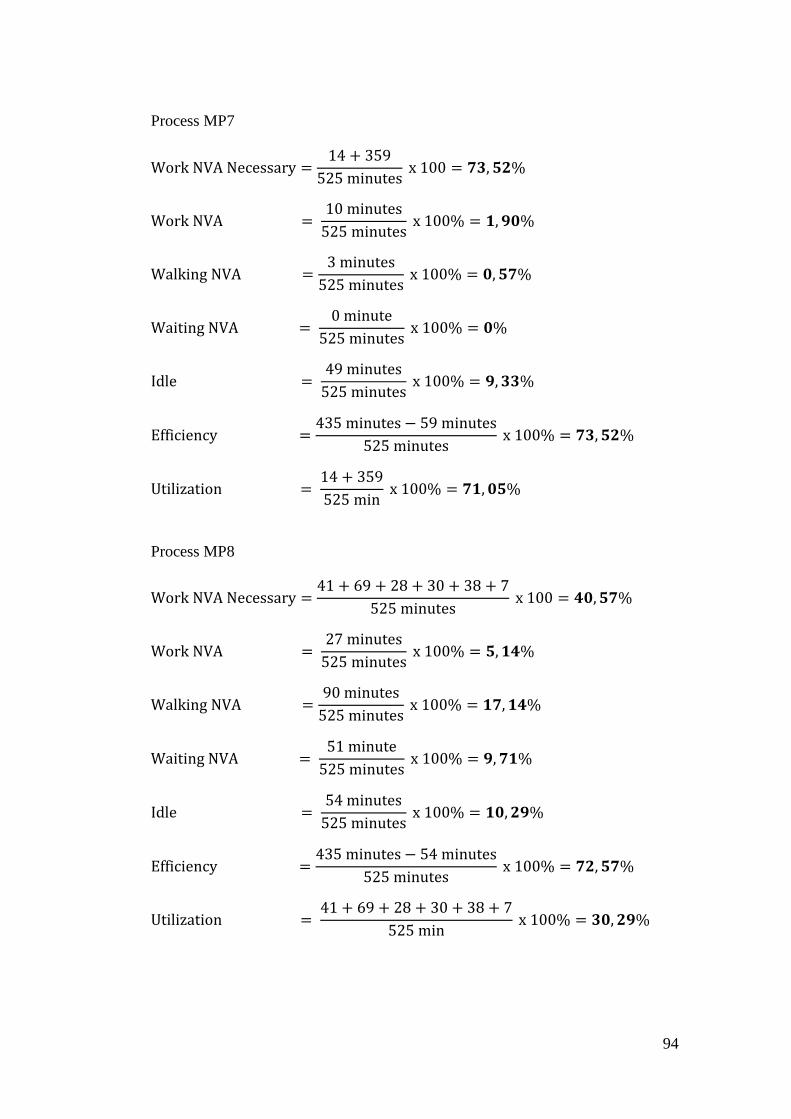
94
Process MP7
Work NVA Necessary =14 + 359
525 minutes x 100 = 𝟕𝟑, 𝟓𝟐%
Work NVA = 10 minutes
525 minutes x 100% = 𝟏, 𝟗𝟎%
Walking NVA =3 minutes
525 minutes x 100% = 𝟎, 𝟓𝟕%
Waiting NVA = 0 minute
525 minutes x 100% = 𝟎%
Idle = 49 minutes
525 minutes x 100% = 𝟗, 𝟑𝟑%
Efficiency =435 minutes − 59 minutes
525 minutes x 100% = 𝟕𝟑, 𝟓𝟐%
Utilization = 14 + 359
525 min x 100% = 𝟕𝟏, 𝟎𝟓%
Process MP8
Work NVA Necessary =41 + 69 + 28 + 30 + 38 + 7
525 minutes x 100 = 𝟒𝟎, 𝟓𝟕%
Work NVA = 27 minutes
525 minutes x 100% = 𝟓, 𝟏𝟒%
Walking NVA =90 minutes
525 minutes x 100% = 𝟏𝟕, 𝟏𝟒%
Waiting NVA = 51 minute
525 minutes x 100% = 𝟗, 𝟕𝟏%
Idle = 54 minutes
525 minutes x 100% = 𝟏𝟎, 𝟐𝟗%
Efficiency =435 minutes − 54 minutes
525 minutes x 100% = 𝟕𝟐, 𝟓𝟕%
Utilization = 41 + 69 + 28 + 30 + 38 + 7
525 min x 100% = 𝟑𝟎, 𝟐𝟗%
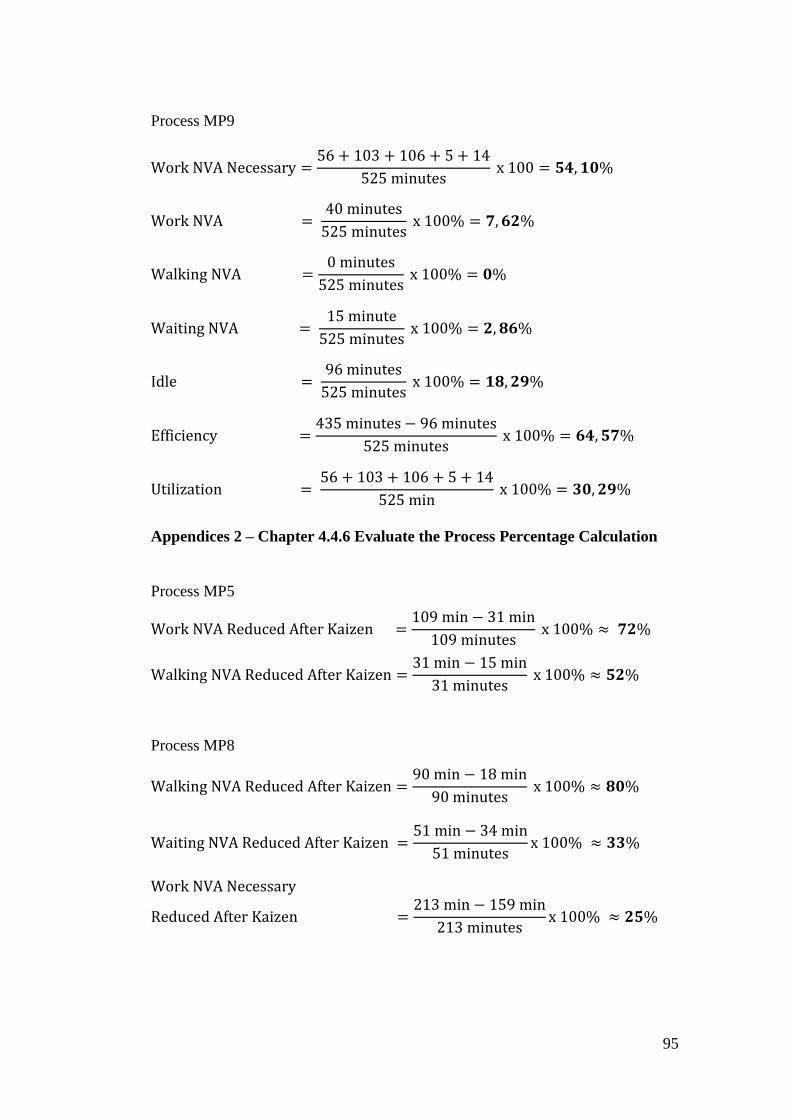
95
Process MP9
Work NVA Necessary =56 + 103 + 106 + 5 + 14
525 minutes x 100 = 𝟓𝟒, 𝟏𝟎%
Work NVA = 40 minutes
525 minutes x 100% = 𝟕, 𝟔𝟐%
Walking NVA =0 minutes
525 minutes x 100% = 𝟎%
Waiting NVA = 15 minute
525 minutes x 100% = 𝟐, 𝟖𝟔%
Idle = 96 minutes
525 minutes x 100% = 𝟏𝟖, 𝟐𝟗%
Efficiency =435 minutes − 96 minutes
525 minutes x 100% = 𝟔𝟒, 𝟓𝟕%
Utilization = 56 + 103 + 106 + 5 + 14
525 min x 100% = 𝟑𝟎, 𝟐𝟗%
Appendices 2 – Chapter 4.4.6 Evaluate the Process Percentage Calculation
Process MP5
Work NVA Reduced After Kaizen =109 min − 31 min
109 minutes x 100% ≈ 𝟕𝟐%
Walking NVA Reduced After Kaizen =31 min − 15 min
31 minutes x 100% ≈ 𝟓𝟐%
Process MP8
Walking NVA Reduced After Kaizen =90 min − 18 min
90 minutes x 100% ≈ 𝟖𝟎%
Waiting NVA Reduced After Kaizen =51 min − 34 min
51 minutesx 100% ≈ 𝟑𝟑%
Work NVA Necessary
Reduced After Kaizen =213 min − 159 min
213 minutesx 100% ≈ 𝟐𝟓%