Analyzing Physical Activity With the iPod Accelerometer · Analyzing Physical Activity With the...
10
Analyzing Physical Activity With the iPod Accelerometer Leeann Mangoba Prof. Sri Kurniawan Graduate Student: Sonia Arteaga
Transcript of Analyzing Physical Activity With the iPod Accelerometer · Analyzing Physical Activity With the...

Analyzing Physical Activity With the iPod
Accelerometer Leeann Mangoba
Prof. Sri Kurniawan
Graduate Student: Sonia Arteaga

ABSTRACT
Accelerometer-based mobile applications are on the rise and can be used as
a way to motivate youth to be more physically active. This project analyzed the
characteristics of the iPod Touch’s built-in accelerometer as a practical
measurement of physical activity. Four students were recruited to wear the iPod
inside their pants pocket while walking and running. The acceleration data was
collected on an application at specified sample rates. The data was loaded onto
excel and ran through a Matlab code which sorted, filtered, and took the average
magnitude of each session of ambulation. Though walking acceleration
measurements seemed to be accurate, the limitations of the iPod’s accelerometer are
apparent in the data from the running sessions. Future work will consist of collecting
and analyzing other physical activities and using these methods for physical activity
recognition on mobile applications.
INTRODUCTION
Accelerometers have been used as a way to measure acceleration in a variety
of applications such as automobile crash detection and airbag deployment, digital
camera image stabilization, and monitoring volcano activity. The iPod/iPhone’s
embedded accelerometer has been used for an assortment of different mobile
applications that require hand movement and tilting. These applications have shown
great popularity and demonstrate the accelerometer’s capability as a practical and
favorable motion sensor. The iPod/iPhone uses STMicroelectronic's LIS331 DL tri-
axial accelerometer that measures acceleration along the x, y, and z axis independent
of gravity. The accelerometer can measure up to ~±2.3 g (g = 9.8 m/s²) with a
resolution of 0.018g/digit [1].
Figure 1 – Accelerometer Configuration
The motivation of this project is to analyze the characteristics of the built-in
accelerometer as a measurement of physical activity in order to create a better
physical activity recognition program. This can be incorporated into mobile
applications targeted to teenagers that encourage physical activity. The
accelerometer was used to collect walking and running data at different sampling
rates. No other devices were connected to the iPod to record data as this may be
unfavorable to the user.
EXPERIMENT
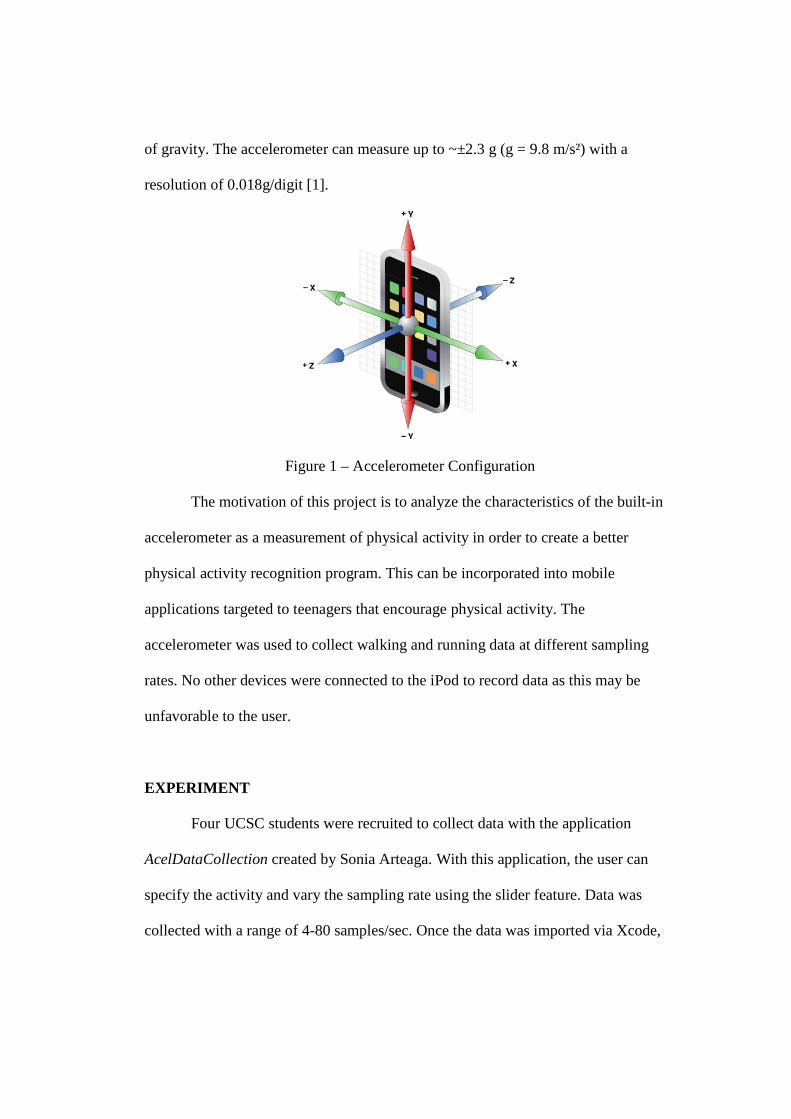
Four UCSC students were recruited to collect data with the application
AcelDataCollection created by Sonia Arteaga. With this application, the user can
specify the activity and vary the sampling rate using the slider feature. Data was
collected with a range of 4-80 samples/sec. Once the data was imported via Xcode,
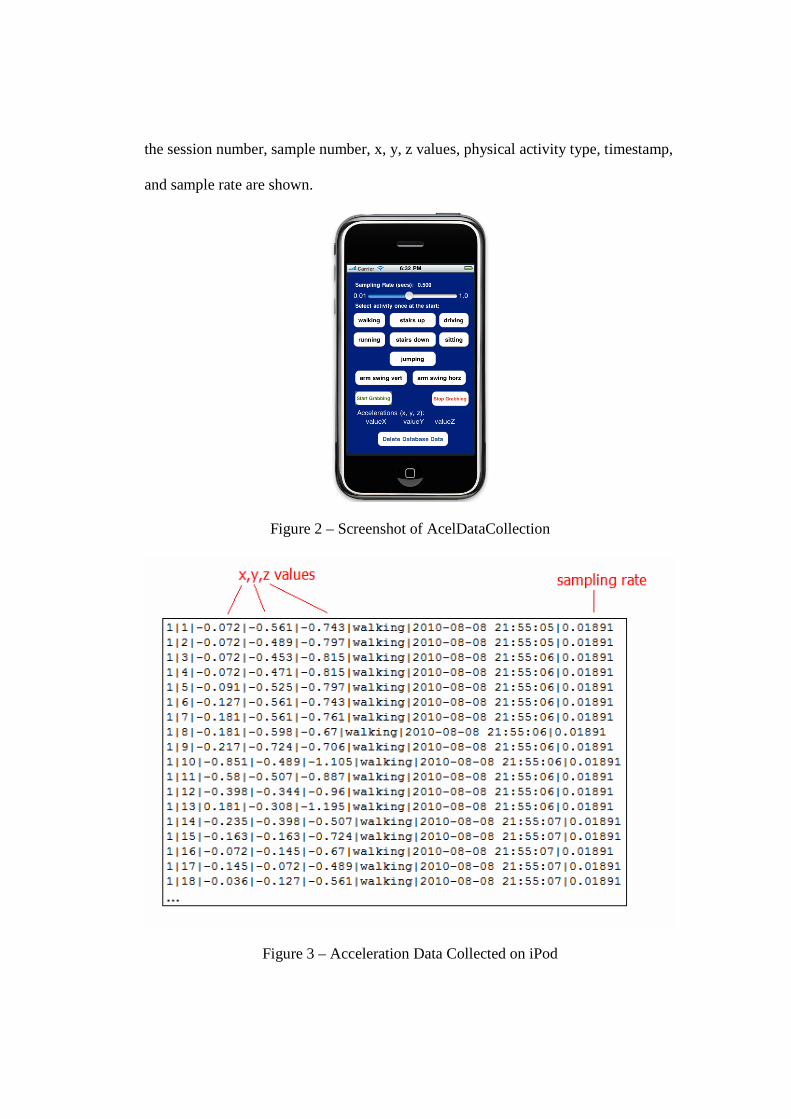
the session number, sample number, x, y, z values, physical activity type, timestamp,
and sample rate are shown.
Figure 2 – Screenshot of AcelDataCollection
Figure 3 – Acceleration Data Collected on iPod

The iPod Touch was placed in the subject’s pants pocket when collecting data. The
pocket was the preferred area of placement since it is close to the subject’s center of
mass [2] and more likely to enable recognition [3].
The data was then downloaded via Xcode, put into a text file, and imported into an
Excel spreadsheet for easy manipulation and reading using Matlab.
Figure 4 – Raw Walking Data
VARIOUS FILTER DESIGNS
Since the iPod accelerometer does not depend on gravity, a high pass filter
was applied to the raw data to remove any gravity offset. In order to find the best
filter to use, we compared the Chebychev and Butterworth filters with different
cutoff frequencies. To exclude gravity alone, the ideal cutoff frequency would range

from 0.1 to 0.5 Hz [2]. Frequencies around 0.25 Hz have shown to do this accurately
without losing too much signal.
The filter that ended up being using is a 4th order high pass Butterworth filter
with cutoff frequency around 0.25 Hz. This was the preferred type of filter because
of the absence of a ripple to get rid of the gravity offset. As shown in Figure 4, the
filtered data is now centered on the horizontal axis as desired.
Figure 5 – Filtered and Unfiltered Walking Data
RUNNING DATA & ACCELEROMETER LIMITATION
Running data was collected using the same methods as with walking. As
mentioned earlier, the accelerometer can measure up to ~±2.3 g. As seen from our
data, this limitation is demonstrated as the raw data seems to be truncated once it
reaches -2.3g.

Figure 6 – Filtered and Unfiltered Walking Data
CONCLUSION
From my project, it seems that the iPod’s accelerometer can provide good
measurements for walking. The filtered data can be used to create a physical activity
program in the future. This is desired since the mobile activities will be more
attractive if only the iPod was being used and not any other attachable sensor device.
Future work will consist of collecting and analyzing other types of physical activity
(i.e. jumping, bicycling) and studying the built-in gyroscope as well. With this
program, I gained a thorough understanding of the accelerometer and became
familiar with Xcode programming and Matlab. I also learned about signals and
filtering and how to perform an experiment with subjects.
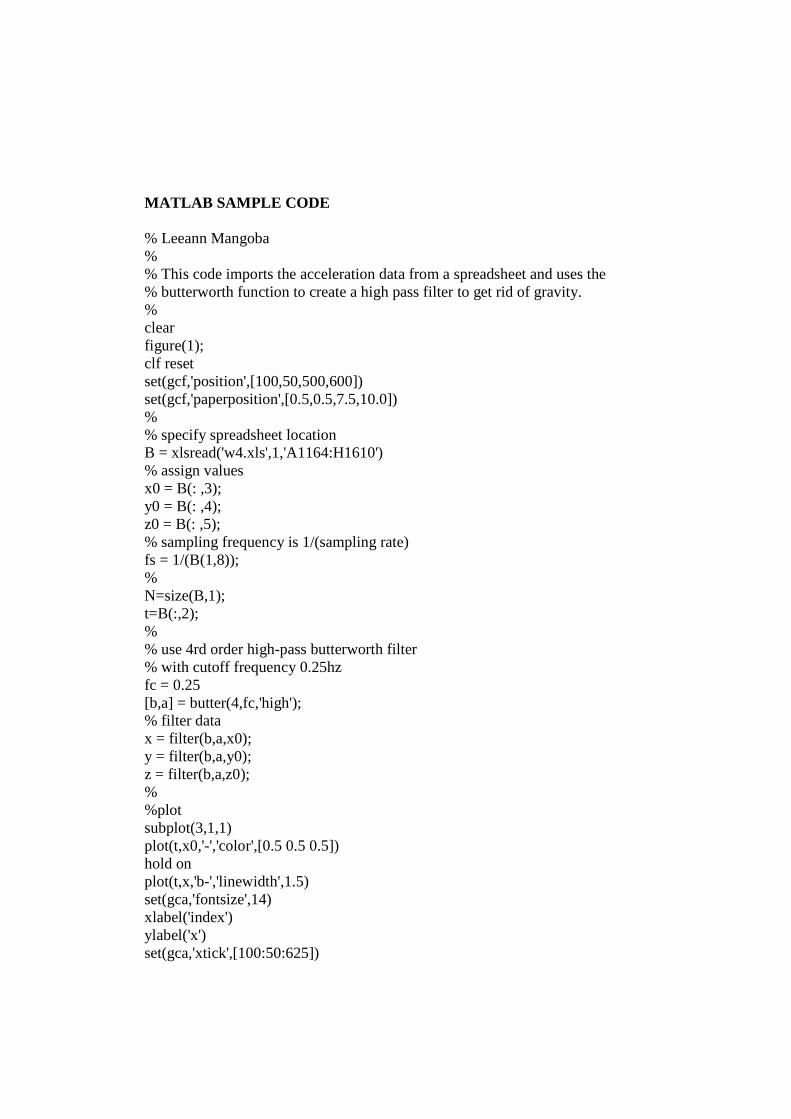
MATLAB SAMPLE CODE % Leeann Mangoba % % This code imports the acceleration data from a spreadsheet and uses the % butterworth function to create a high pass filter to get rid of gravity. % clear figure(1); clf reset set(gcf,'position',[100,50,500,600]) set(gcf,'paperposition',[0.5,0.5,7.5,10.0]) % % specify spreadsheet location B = xlsread('w4.xls',1,'A1164:H1610') % assign values x0 = B(: ,3); y0 = B(: ,4); z0 = B(: ,5); % sampling frequency is 1/(sampling rate) fs = 1/(B(1,8)); % N=size(B,1); t=B(:,2); % % use 4rd order high-pass butterworth filter % with cutoff frequency 0.25hz fc = 0.25 [b,a] = butter(4,fc,'high'); % filter data x = filter(b,a,x0); y = filter(b,a,y0); z = filter(b,a,z0); % %plot subplot(3,1,1) plot(t,x0,'-','color',[0.5 0.5 0.5]) hold on plot(t,x,'b-','linewidth',1.5) set(gca,'fontsize',14) xlabel('index') ylabel('x') set(gca,'xtick',[100:50:625])
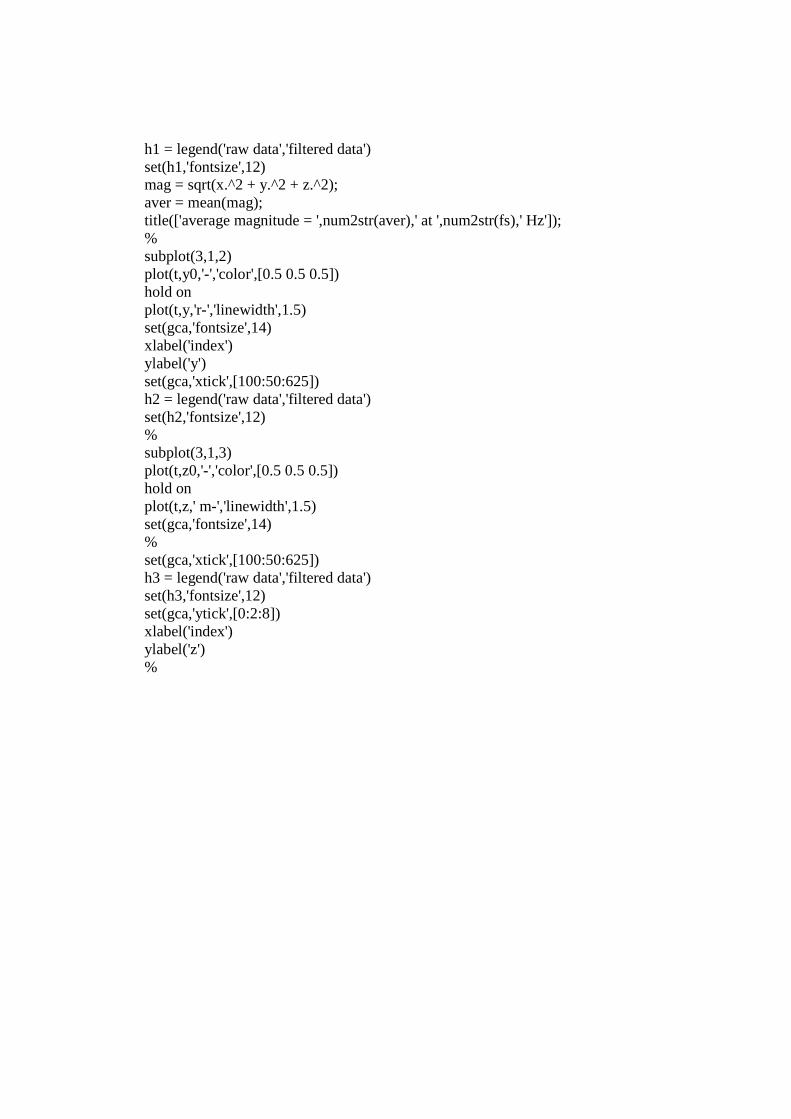
h1 = legend('raw data','filtered data') set(h1,'fontsize',12) mag = sqrt(x.^2 + y.^2 + z.^2); aver = mean(mag); title(['average magnitude = ',num2str(aver),' at ',num2str(fs),' Hz']); % subplot(3,1,2) plot(t,y0,'-','color',[0.5 0.5 0.5]) hold on plot(t,y,'r-','linewidth',1.5) set(gca,'fontsize',14) xlabel('index') ylabel('y') set(gca,'xtick',[100:50:625]) h2 = legend('raw data','filtered data') set(h2,'fontsize',12) % subplot(3,1,3) plot(t,z0,'-','color',[0.5 0.5 0.5]) hold on plot(t,z,' m-','linewidth',1.5) set(gca,'fontsize',14) % set(gca,'xtick',[100:50:625]) h3 = legend('raw data','filtered data') set(h3,'fontsize',12) set(gca,'ytick',[0:2:8]) xlabel('index') ylabel('z') %
REFERENCES [1] STMicrolectronics www.st.com/stonline/books/pdf/docs/14699.pdf [2] Yuichi Fujiki, iPhone As A Physical Activity Measurement Platform, CHI 2010: Student Research Competition, April 12-14, 2010, Atlanta, Georgia, USA [3] Bao, L., & Intille, S. (2004, April). Activity recognition from user-annotated acceleration data. In Proc. pervasive (p. 1-17). Vienna, Austria: Springer-Verlag Heidelberg: Lecture Notes in Computer Science.