Analyzing Participation of Students in Online Courses...
10
Analyzing Participation of Students in Online Courses Using Social Network Analysis Techniques Reihaneh Rabbany k., Mansoureh Takaffoli and Osmar R. Za¨ ıane, Department of Computing Science, University of Alberta, Canada rabbanyk,takaffol,zaiane @ualberta.ca There is a growing number of courses delivered using e-learning environments and their online discussions play an important role in collaborative learning of students. Even in courses with a few number of students, there could be thousands of messages generated in a few months within these forums. Manually evaluating the participation of students in such case is a significant challenge, considering the fact that current e-learning environments do not provide much information regarding the structure of interactions between students.There is a recent line of research on applying social network analysis (SNA) techniques to study these interactions. And it is interesting to investigate the practicability of SNA in evaluating participation of students. Here we propose to exploit SNA techniques, including community mining, in order to discover relevant structures in social networks we generate from student communications but also information networks we produce from the content of the exchanged messages. With visualization of these discovered relevant structures and the automated identification of central and peripheral participants, an instructor is provided with better means to assess participation in the online discussions. We implemented these new ideas in a toolbox, named Meerkat-ED. Which prepares and visualizes overall snapshots of the participants in the discussion forums, their interactions, and the leader/peripheral students. Moreover, it creates a hierarchical summarization of the discussed topics, which gives the instructor a quick view of what is under discussion. We believe exploiting the mining abilities of this toolbox would facilitate fair evaluation of students’ participation in online courses. 1. INTRODUCTION There is a growing number of courses delivered using e-learning environments, especially in postsecondary education, using computer-supported collaborative learning (CSCL) tools, such as Moodle ,WebCT and Blackboard . Online asynchronous discussions in these environments play an important role in collaborative learning of students. It makes them actively engaged in sharing information and perspectives by interacting with other students [Erlin et al. 2009]. There is a theoretical emphasis in CSCL on the role of threaded discussion forums for online learning activities. Even basic CSCL tools enable the development of these threads where the learners could access text, revise it or reinterpret it; which allow them to connect, build, and refine ideas, along with stimulating deeper reflection [Calvani et al. 2009]. There could be thousands of messages generated in a few months within these forums, containing long discussion threads bearing many interactions between students. Therefore the CSCL tools should provide a means to help instructors for evaluating participation of students and analyzing the structure of these interactions; which otherwise could be very time consuming, if not impossible, for the instructors to be done manually. Up to now, current CSCL tools do not provide much information regarding the participation of students and structure of interactions between them in discussion threads. In many cases, only some statistical infor- mation is provided such as frequency of postings, which is not a useful measure for interaction activity [Erlin et al. 2009]. This means that the instructors who are using these tools, do not have access to convenient in- dicators that would allow them to evaluate the participation and interaction in their classes [Willging 2005]. Instructors usually have to monitor the discussion threads manually which is hard, time consuming, and prone to human error. On the other hand, there exists a large body of research on studying the participa- tion of students in such discussion threads using traditional research methods: content analysis, interviews,
Transcript of Analyzing Participation of Students in Online Courses...

Analyzing Participation of Students in Online Courses Using SocialNetwork Analysis Techniques
Reihaneh Rabbany k., Mansoureh Takaffoli and Osmar R. Zaıane,Department of Computing Science, University of Alberta, Canadarabbanyk,takaffol,[email protected]
There is a growing number of courses delivered using e-learning environments and their online discussions play an important
role in collaborative learning of students. Even in courses with a few number of students, there could be thousands of messagesgenerated in a few months within these forums. Manually evaluating the participation of students in such case is a significant
challenge, considering the fact that current e-learning environments do not provide much information regarding the structure of
interactions between students.There is a recent line of research on applying social network analysis (SNA) techniques to studythese interactions. And it is interesting to investigate the practicability of SNA in evaluating participation of students. Here we
propose to exploit SNA techniques, including community mining, in order to discover relevant structures in social networks we
generate from student communications but also information networks we produce from the content of the exchanged messages.With visualization of these discovered relevant structures and the automated identification of central and peripheral participants,
an instructor is provided with better means to assess participation in the online discussions. We implemented these new ideasin a toolbox, named Meerkat-ED. Which prepares and visualizes overall snapshots of the participants in the discussion forums,
their interactions, and the leader/peripheral students. Moreover, it creates a hierarchical summarization of the discussed topics,
which gives the instructor a quick view of what is under discussion. We believe exploiting the mining abilities of this toolboxwould facilitate fair evaluation of students’ participation in online courses.
1. INTRODUCTION
There is a growing number of courses delivered using e-learning environments, especially in postsecondaryeducation, using computer-supported collaborative learning (CSCL) tools, such as Moodle ,WebCT andBlackboard . Online asynchronous discussions in these environments play an important role in collaborativelearning of students. It makes them actively engaged in sharing information and perspectives by interactingwith other students [Erlin et al. 2009]. There is a theoretical emphasis in CSCL on the role of threadeddiscussion forums for online learning activities. Even basic CSCL tools enable the development of thesethreads where the learners could access text, revise it or reinterpret it; which allow them to connect, build,and refine ideas, along with stimulating deeper reflection [Calvani et al. 2009]. There could be thousands ofmessages generated in a few months within these forums, containing long discussion threads bearing manyinteractions between students. Therefore the CSCL tools should provide a means to help instructors forevaluating participation of students and analyzing the structure of these interactions; which otherwise couldbe very time consuming, if not impossible, for the instructors to be done manually.
Up to now, current CSCL tools do not provide much information regarding the participation of studentsand structure of interactions between them in discussion threads. In many cases, only some statistical infor-mation is provided such as frequency of postings, which is not a useful measure for interaction activity [Erlinet al. 2009]. This means that the instructors who are using these tools, do not have access to convenient in-dicators that would allow them to evaluate the participation and interaction in their classes [Willging 2005].Instructors usually have to monitor the discussion threads manually which is hard, time consuming, andprone to human error. On the other hand, there exists a large body of research on studying the participa-tion of students in such discussion threads using traditional research methods: content analysis, interviews,

survey observations and questionnaires [de Laat et al. 2007]. These methods try to detect the activitiesthat students are involved in while ignoring the relations between students. For example, content analysismethods, as the most common traditional methods, provide deep information about specific participants.However, they neglect the relationships between the participants while their focus is on the content, not onthe structure [Willging 2005]. In order to fully understanding the participation of students, we need to under-stand their patterns of interactions and answer questions like who is involved in each discussion, who is theactive/peripheral participant in a discussion thread [de Laat et al. 2007]. Nurmela et al. 1999 demonstratedthe practicality of social network analysis methods in CSCL, as a method for obtaining information aboutrelations and fundamental structural patterns. Moreover, there is a recent line of work on applying socialnetwork analysis techniques for evaluating the participation of students in online courses like works done bySundararajan 2010, Calvani et al. 2009, de Laat et al. 2007, Willging 2005, Laghos and Zaphiris 2006, andErlin et al. 2009. The major challenges these works tried to tackle are: extracting social networks from asyn-chronous discussion forums (might require content analysis), finding appropriate indicators for evaluatingparticipation (from education’s point of view) and measuring these indicators using social network analysis.As clarified in the related works, Section 2, none of these works provides a complete or specific toolbox foranalyzing discussion threads. However, they attempted to address one of these challenges to some extent.
Here, we elaborate on the importance of social network analysis for mining structural data in the field ofcomputer science and its applicability to the domain of education. for monitoring and evaluating participationof students in online courses. We propose Meerkat-ED, a specific and practical toolbox for analyzing interac-tions of students in asynchronous discussion forums of online courses. Meerkat-ED analyzes the structure ofthese interactions using social network analysis techniques including community mining. It prepares and visu-alizes overall snapshots of participants in the discussion forums, their interactions, and the leader/peripheralstudents in these discussions. Moreover, it analyzes the content of the exchanged messages in this discussionsby building an information network of terms and using community mining techniques to identify the topicsdiscussed. Meerkat-ED creates a hierarchical summarization of these discussed topics in the forums, whichgives the instructor a quick view of what is under discussion in these forums. It further illustrates how mucheach student has participated in these topics, by showing his/her centrality in the discussions on that topic,the number of posts, replies, and the portion of terms used by that student in the discussions. In the follow-ing, we first introduce some basic backgrounds of social network analysis and elaborate on its applicationsin the context of on-line Education. We then present Meerkat-ED – our solution for social network analysisof online courses in Section 3 and illustrate its practicability on our own case study data in Section 4.
2. BACKGROUND AND RELATED WORKS
Social networks are formally defined as a set of actors or network members whom are tied by one or more typeof relations [Marin and Wellman 2010]. The actors are most commonly persons or organizations, however,they could be any entities such as web pages, countries, proteins, documents, etc. There could also be manydifferent types of relationships, to name a few, collaborations, friendships, web links, citations, informationflow, etc. [Marin and Wellman 2010]. These relations represented by the edges in the network connectingthe actors and may have a direction (shows the flow from one actor to the other) and a strength (shows howmuch, how often, how important).
Unlike proponents of attribute based social sciences, social network analysts argue that causation is notlocated in the individuals, but in the social structure [Marin and Wellman 2010]. Social network analysisis the study of this structure. Rooted in sociology, nowadays, social network analysis has became an in-terdisciplinary area of study, including researchers from anthropology, communications, computer science,education, economics, criminology, management science, medicine, political science, and other disciplines[Marin and Wellman 2010]. Social network analysis examines the structure and composition of ties in thenetwork to provides insights into: 1) understanding the central actors in the network (prestige); 2) detecting

the individuals with the most outgoing connections (influence), the most incoming connections (prominence),and the least connections (outlier); 3) identifying the proportion of possible ties that actually exist (density);4) tracking the actors that are involved in passing information through the network (path length); 5) find-ing the actors that are communicating more often with each other (community), etc. The availability andgrowth of large datasets of information networks makes community mining a very challenging research topicin social networks analysis. There has been a considerable amount of work done to detect communities insocial networks [Palla et al. 2005], [Newman and Girvan 2004], [Chen et al. 2009], etc.
2.1 Social Network Analysis of Asynchronous Discussions in Online Courses
In order to apply social network analysis techniques to assess participation of students in an e-learningenvironment, we need to first extract the social network from the e-learning course. Then we consider whichmeasures show an effective participation, and finally report these measures in an appropriate way. Here, wegive an overview of the previous works related to each of these phases.
Fig. 1: This nanogram illustrates a comparisonof participation of one group (blue lines) withthe average participation of other groups (redlines) using the nine indicators defined by Cal-vani et al. 2009. Figure reproduced from [Cal-vani et al. 2009].
Extraction of Social Network. CSCL tools record log filesthat contain the detailed actions that occurring within them.Hence, log files include information about the activity of theparticipants in the discussion forums [Nurmela et al. 1999].de Laat et al. 2007, Willging 2005, Erlin et al. 2009 and Laghosand Zaphiris 2006 used these log files to extract the social net-work underneath of discussion threads. Laghos et al. statedthat they considered each message as directed to all partici-pants in that discussion thread while others considered it asonly directed to the previous message. Gruzd and Haythornth-waite 2008 and 2009, proposed an alternative and more com-plicated way of extracting social networks, called named net-work. They argue that using this common method (connectinga poster to the previous poster in the thread) would result inlosing much of the connections. Their approach briefly is: firstusing named entity recognition to find the nodes of the net-work, then counting the number of times that each name ismentioned in posts by others to obtain the ties, and finallyweighting these ties by the amount of information exchangedin the posts. However, their final reported results are not thatpromising and even obtaining those results requires many man-ual corrections during the process. Regarding what we should consider as the participation in extracting thesocial network, Hrastinski 2008 suggested that apart from writing, there are other indicators of participationlike accessing the e-learning environment, reading posts or the quantity and quality of the writing. However,all of these methods extracted networks just based on posts by student (writing level).
Measuring the Effectiveness of Participation. Daradoumis et al. 2006 defined high level weighted (showingthe importance) indicators to represent collaboration learning process; task performance, group function-ing, social support, and help services. They further divided these indicators to skills and sub-skills, andassigned every sub-skill to an action. For example, group functioning is divided into: active participationbehavior, task processing, communication processing, etc. On the other hand, communication processing isitself divided into more sub-skills: clarification, evaluation, illustration, etc. and clarification is then mappedto the action of changing description of a document or url. In the education context, Calvani et al. 2009defined 9 indicators for measuring the effectiveness of participation to compare different groups within a
class; extent of participation (number of messages ), proposing attitude (number of messages with proposallabel), equal participation (variance of messages for users), extent of role (portion of roles used), rhythm(variance of daily messages per day), reciprocal reading (portion of messages that have been read), depth(average response depth), reactivity to proposal (number of direct answers to messages with proposal label)and conclusiveness (number of messages with conclusion label); all summarized in a nonagon graph whichshows the group interactions relatively to the mean behavior of all groups (Figure 1). However, for measuringthe effectiveness of participation, most of the previous works simply used general social network measures(different centrality measures, betweenness, etc.), available in one of the common general social networkanalysis toolboxes. Sundararajan 2010, de Laat et al. 2007, Willging 2005, Erlin et al. 2009 used UCINET[UCINET] and Laghos and Zaphiris 2006 used NetMiner [NetMiner].
3. SOCIAL NETWORK ANALYSIS FOR EDUCATION: MEERKAT-ED
In this section, we illustrate the practicability of social network analysis in evaluating participation of studentsin online discussion threads. We present our specific social network analysis toolbox, named Meerkat-ED, toanalyze online courses. Meerkat-ED is designed for assessing the participation of students in asynchronousdiscussion forums of online courses. It analyzes the structure of interactions between students in thesediscussions using social network analysis techniques. It exploit community mining techniques in order todiscover relevant structures in social networks generated from student communications and also informationnetworks produced from the content of the exchanged messages. With visualization of these discoveredrelevant structures and the automated identification of central and peripheral participants, an instructor isprovided with better means to assess participation in the online discussions.
Meerkat-ED prepares and visualizes overall snapshots of participants in the discussion forums, their inter-actions, and the leader/peripheral students. It creates a hierarchical summarization of the topics discussedin the forums using community mining, which gives the instructor a quick view of what is under discussionin these forums. It further illustrates how much each student has participated on these topics, by showinghis/her centrality in the discussions on that topic, the number of posts, replies, and the portion of termsused by that student in discussions on the topic. Meerkat-ED builds and analyzes two kinds of networks outof the discussion forums: social network of the students where links represent correspondence, and networkof the phrases used in the discussions where links represent co-occurrence of phrases in the same sentence.Interpreting the first network shows the interaction structure of the students participated in the discussions.Furthermore, centrality of students in this network corresponds to their leadership in the discussions. In-terpreting terms network depicts the terms used in the discussion and the relations between these terms.Finding the hierarchical communities in this network demonstrates the topics addressed in the discussions.Choosing each of these topics outlines the students who participated in that topic and the extent of theirparticipation.
3.1 Interpreting Students Interaction Network
Interpreting the network of interaction between students helps instructors monitor the interaction structureof students, and examine which students are the leaders in given discussions and who are the peripheralstudents. Here, we first describe how the network is extracted based on the information from the discussionthreads. Then, we continue by bringing an analysis of leadership of the students based on their centrality inthis network. The student network shows the interaction between students in the discussion forums, wherethe nodes represent students of the course and edges are the interaction between these students (i.e. messagesexchanged). The edges are weighted by the number of messages passed between the two incident students.This network could be built both directed or undirected (chosen by the instructor); in the directed model,each message is considered connecting the author of the message to the author of its parent message. Theleadership and influence of students in the discussions could be compared by examining the centrality of

nodes corresponding to them in the network; as the nodes’ centrality measures their relative importancewithin a network. Moreover, students could be ranked more explicitly in a concentric centrality graph inwhich the more central/powerful the node is, the closer it is to the center (Figure 4).
3.2 Interpreting Term Network
Interpreting the term network, depicts the terms used in the discussions and the relation between theseterms. Moreover, finding the hierarchical communities in this network, demonstrates the topics exchanged inthe discussions. Furthermore, choosing each of these topics would outline the students who participated inthat topic and the extent of their participation. In the term network, nodes represent noun phrases occurringin the discussions; and edges show the co-occurrence of these terms in the same sentence. Each co-occurrenceedge contains the messages in which its incident terms occurred together; and is weighted by the numberof sentences in which these terms co-occurred. For building this network, we need to first extract the nounphrases from the discussions, then build the network by setting the extracted phrases as nodes and checkingtheir co-occurrence in all the sentences of every message for creating the edges.
We have used the OpenNlp toolbox [OpenNlp] for extracting noun phrases out of discussions. OpenNlpis a set of natural language processing tools for performing sentence detection, tokenization, pos-tagging,chunking, parsing, and etc. Using sentence detector in OpenNlp, we first segmented the content of messagesto their consisting sentences. The tokenizer was used to break down those sentences to words. Having thetokenized words, we used the Part-Of-Speech tagger to determine their grammatical tags – whether they arenoun, verbs, adjective, etc. Then using the chunker, we grouped these words to the phrases, and we pickedthe detected noun phrases, which are sequences of words surrounding at least one noun and functioning asa single unit in the syntax. For obtaining better sets of terms to represent the content of the discussions,pruning on the extracted noun phrases was necessary. We removed all the stopwords, and split the phrasesthat have stop word(s) within into two different phrases. For example the phrase ”privacy and confidentiality”is split into two terms: “privacy”, and “confidentiality”. To avoid having duplicates, the first characters wereconverted to lower case (if the other characters of the phrase are in lowercase) and plurals to singular forms(if the singular form appeared in the content). For instance “Patients” would be “patients” then “patient”.As final modification, we removed all the noun phrases that just occurred once; which would prune most ofunwanted phrases.
The term Network could be further analyzed to group the terms co-occurring mostly together. These groupsrepresent the different topics discussed in the messages and could be obtained by detecting the communitiesin the term network. This idea is similar to work done in Chen et al. 2008. For creating the hierarchy ofthe topics, we applied a community mining algorithm repeatedly to divide one of the current connectedcomponents of the network, until the size of all components is smaller than a threshold, or the division ofany of the components would result in a loose partitioning. We used FastModularity [Clauset et al. 2004] asthe community detection algorithm, however it could be any other community mining approach. Based onthe detected term communities, the participation of students and how wide their participation are could bevalidated. In other words, students who participated in different topics could be considered more active thanstudents that just talked about a smaller number of topics. This evaluation could be examined by selectingeach student and checking how many topics he/she participated in.
4. CASE STUDY
In this section, we validate the feasibility of Meerkat-ED and illustrate its practical application on ourown case study data. Here, Meerkat-ED is used for visualizing, monitoring and evaluating participation ofstudents in the discussion forums. The data set we have used is obtained from a postsecondary course. Thecourse titled Electronic Health Record and Data Analysis, and was offered in Winter 2010 at University ofAlberta. The permission to use the anonymized course data for research purposes was obtained from all the

students registered in the course, at the end of the semester so as not to bias the communications takingplace. This data is further anonymized by assigning fake names to students and replacing any occurrence offirst, last or user name of the students in the data (including content of the messages in discussion forums)with the assigned fake name. We also removed all email addresses from the data.
In the chosen course, as is also usual in other courses, the instructor initiated different discussion threads.For each thread he posted a question or provided some information and asked students to discuss the issue.Consequently students posted subsequent messages in the thread, responding to the original question orto the response of other students. This course was offered using Moodle which is a widely-used coursemanagement system. Moodle like other CSCL tools, enables interaction and collaborative construction ofcontent, mostly using its Forum tool which is a place for students to share their ideas [Moodle]. Only usingMoodle, to evaluate student participation the instructor is limited to shallow means such as the numberof posts per thread and eventually the apparent size of messages. The instructor would have to manuallymonitor the content of each interaction to measure the extent of individual participation, which is hard, timeconsuming and even unrealistic in large classes or forums with large volume, where different participants canbe assigned to moderate different discussions and threads.
To assess participation, we build and analyze two kinds of networks from these information: the socialnetwork of students and the network of the terms used by them. The instructor of the course denoted theusefulness of the results of these analysis in evaluating the participation of students in the course. Like in[Sundararajan 2010] where the authors noted that using SNA it was easy to identify the workers and thelurkers in the class, in this case study, the instructor reported that using Meerkat-ED it was easy to have anoverview of the whole participation and it was possible to identify influential students in each thread as wellas identify quiet students or unvoiced opinions, something that would have been impossible with the simplestatistics provided by Moodle. More importantly, focusing on the relationships in the graph one can identifythe real conduit for information rather than simply basing assessment of patrticipation on message size orfrequency of submissions. Learners who place centarly in the network as conduit for the information controland can cause more knowledge exchange which is desirable in an online class. Regardless of the frequency ofmessages, their size or content, if they do not have influence, their authors remain marginal and sit on theperiphery of the network (See Figure 4). This role of conduit of information versus mariginal students canchange during the course of the semester or from one discussed thread to the other. The systematic analysisof centrality of participants per topic discussed provided by Meerkat-ED allowed a better assessment of theparticipation of learners at each discussion topic level.
4.1 Interpreting Students Interaction Network
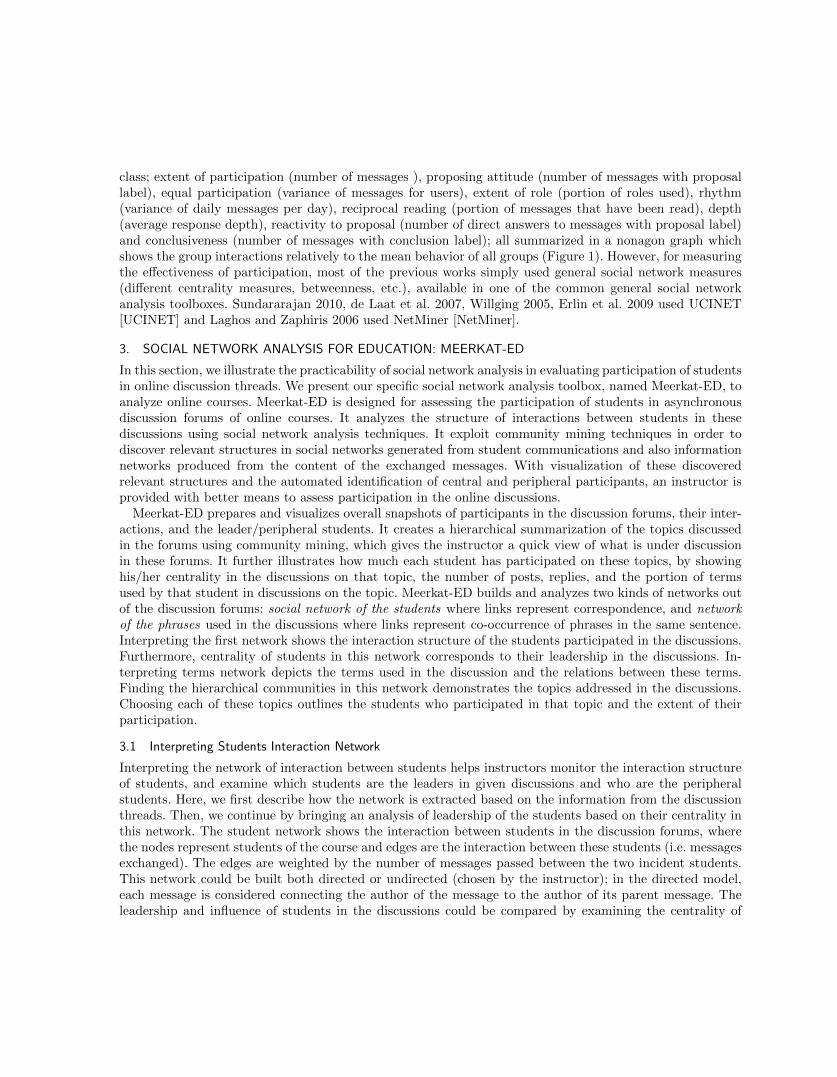
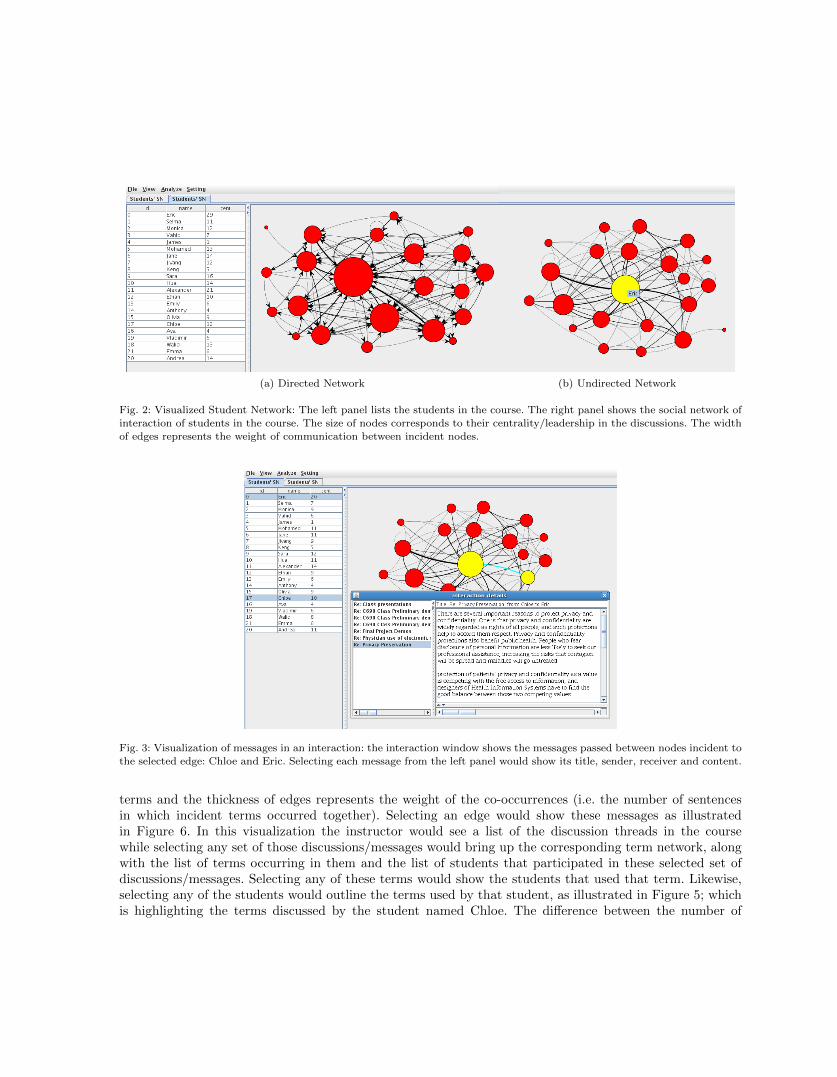
As explained before, first of all we have to extract the students network from the discussion thread. Figure 2shows the visualized network of students in the course. The size of the nodes corresponds to their degreecentrality in the network – the number of incident edges. This means that the bigger a node is, the moremessages the student represented by that node sent and received. The thickness of the edges in the net-work represents the weight of interactions which is based on the number of messages in the interaction ofcommunicating students. Choosing an edge would bring up a pop up window that shows these messages asillustrated in Figure 3. The next step is to analysis the leadership of the students based on their centrality inthis network. The nodes’ centrality is depicted by the size of the nodes in the visualized network as illustratedin Figure 2. Moreover, students could be ranked more explicitly in a concentric centrality graph in whichthe more central/powerful the node is, the closer it is to the center, as presented in Figure 4.
4.2 Interpreting Term Network
For this specific course, we extract the term network from the discussion forum. Figure 5 presents thevisualization of this term network, where the size of the nodes represents the frequency of their corresponding
(a) Directed Network (b) Undirected Network
Fig. 2: Visualized Student Network: The left panel lists the students in the course. The right panel shows the social network ofinteraction of students in the course. The size of nodes corresponds to their centrality/leadership in the discussions. The width
of edges represents the weight of communication between incident nodes.
Fig. 3: Visualization of messages in an interaction: the interaction window shows the messages passed between nodes incident to
the selected edge: Chloe and Eric. Selecting each message from the left panel would show its title, sender, receiver and content.
terms and the thickness of edges represents the weight of the co-occurrences (i.e. the number of sentencesin which incident terms occurred together). Selecting an edge would show these messages as illustratedin Figure 6. In this visualization the instructor would see a list of the discussion threads in the coursewhile selecting any set of those discussions/messages would bring up the corresponding term network, alongwith the list of terms occurring in them and the list of students that participated in these selected set ofdiscussions/messages. Selecting any of these terms would show the students that used that term. Likewise,selecting any of the students would outline the terms used by that student, as illustrated in Figure 5; whichis highlighting the terms discussed by the student named Chloe. The difference between the number of

Fig. 4: Comparing centrality of students: the students closer to the center are more central in the student network, i.e., have
participated more in the discussions of the course. Likewise, the further from the center, the less the student was active; hereJames is the least active student in the discussions and is placed on the outer circle.
Fig. 5: Visualized Term Network: The left panel lists the discussion threads in the course. The middle panel shows the networkof terms in the selected set of discussions. The upper right panel shows list of students participated in the selected discussions,
along with some statistics about their participation such as number of posts, replies, etc. The bottom right panel shows theterms used in these discussions. Selecting each student, would outline the terms used by that student.
terms discussed by the students could help the instructor to compare the participations of the students:students who discuss more terms participate more as well. In order to further analyzed the term Network,as explained before, we group the terms co-occurring mostly together. Figure 7a shows the detected topics(term communities) in the network given in Figure 5. The green nodes show the representative nodes ofcommunities. Each representative node, contains 10 most central terms of the terms in the community itrepresents. The size of the representative nodes corresponds to the number of terms in their communities;while the size of the leaf nodes, terms, is related to their frequency, same as the term network. Similar tothe term network, here also one could select a set of terms, usually within a topic, to see who participatedin a discussion with that topic and to what extent, as illustrated in Figure 7b.

Fig. 6: Co-occurrence of terms: selecting a co-occurrence edge would bring up a pop op window that shows the messages theseincident terms co-occurred together in, highlighting the corresponding terms in the content.
(a) Term communities (Topics) (b) Term communities (Topics), zoomed
Fig. 7: Term communities (Topics): The gray circles outline the communities boundaries and the green nodes represent the
community representatives. Each community representative is accompanied with its top 10 phrases in its community. Thesecould be seen in the tooltip in the figure. Selecting each topic, would outline the students who participated in a discussion
with the topic, and the terms in that topic. Here, the topic is roughly about ”patient, disclosure, confidentiality and society”.
Moreover, students who participated in this topic and their contribution could be seen in the upper right panel.
5. CONCLUSIONS
In this paper we elaborated the importance of social network analysis for mining structural data and itsapplicability in the domain of education. we introduced social network analysis and community mining forstudying the structure in relational data. We illustrated the place and need for social network analysis instudy of the interaction of users in e-learning environments; then summarized some recent studies in thisarea. We also proposed Meerkat-ED, a specific and practical toolbox for analyzing students interactions inasynchronous discussion forums. Our toolbox prepares and visualizes overall snapshots of participants in thediscussion forums, their interactions, and the leaders/peripheral students. Moreover, it creates a hierarchicalsummarization of the discussed topics, which gives the instructor a quick view of what is under discussion.

It further illustrates individual student participation in these topics, measured by their centrality in thediscussions on that topic, their number of posts, replies, and the portion of terms used by them. We believeexploiting the mining abilities of this toolbox would facilitate fair evaluation of students’ participation inonline courses.
REFERENCES
Blackboard. http://en.wikipedia.org/wiki/Blackboard Learning System.
Calvani, A., Fini, A., Molino, M., and Ranieri, M. 2009. Visualizing and monitoring effective interactions in online collab-orative groups. British Journal of Educational Technology.
Chen, J., Zaıane, O. R., and Goebel, R. 2008. An unsupervised approach to cluster web search results based on word sense
communities. In Proceedings of the 2008 IEEE/WIC/ACM International Conference on Web Intelligence and IntelligentAgent Technology - Volume 01. IEEE Computer Society, Washington, DC, USA, 725–729.
Chen, J., Zaıane, O. R., and Goebel, R. 2009. Detecting communities in large networks by iterative local expansion. In
CASoN. 105–112.
Clauset, A., Newman, M. E. J., and Moore, C. 2004. Finding community structure in very large networks. Phys. Rev. E 70,
066111.
Daradoumis, T., Martınez-Mones, A., and Xhafa, F. 2006. A layered framework for evaluating on-line collaborative learning
interactions. Int. J. Hum.-Comput. Stud. 64, 7, 622–635.
Davis, R. H. 1981. Social network analysis - an aid in conspiracy investigations. FBI Law Enforcement Bulletin 50, 12, 11–19.
The use of social network analysis in the conduct of investigations of conspiracies is described.
de Laat, M., Lally, V., Lipponen, L., and Simons, R.-J. 2007. Investigating patterns of interaction in networked learning and
computer-supported collaborative learning: A role for social network analysis. International Journal of Computer-Supported
Collaborative Learning 2, 1, 87–103.
Erlin, Yusof, N., and Rahman, A. A. 2009. Students’ interactions in online asynchronous discussion forum: A social networkanalysis. In International Conference on Education Technology and Computer. IEEE Computer Society, Los Alamitos, CA,
USA, 25–29.
Gruzd, A. and Haythornthwaite, C. A. 2008. The analysis of online communities using interactive content-based social
networks. extended abstract. In Proceedings of the American Society for Information Science and Technology (ASIS&T)Conference. Columbus, OH, USA, 523–527.
Gruzd, A. A. 2009. Automated discovery of social networks in online learning communities. Ph.D. thesis, University of Illinois
at Urbana-Champaign.
Hrastinski, S. 2008. What is online learner participation? a literature review. Computers & Education 51, 4, 1755–1765.
Keeling, M. J. and Eames, K. T. 2005. Networks and epidemic models. Journal of the Royal Society, Interface / the RoyalSociety 2, 4, 295–307.
Laghos and Zaphiris. 2006. Sociology of student-centred e-learning communities: A network analysis. In IADIS international
conference. e-Society, Dublin, Ireland.
Marin, A. and Wellman, B. forthcoming, 2010. Handbook of Social Network Analysis. Sage, Chapter Social Network Analysis:An Introduction.
Moodle. http://en.wikipedia.org/wiki/Moodle.
NetMiner. http://www.netminer.com/NetMiner/.
Newman, M. E. J. 2004. Detecting community structure in networks. Eur. Phys. J.B 38, 321–330.
Newman, M. E. J. and Girvan, M. 2004. Finding and evaluating community structure in networks. Physical Review E 69.
Nurmela, K., Lehtinen, E., and Palonen, T. 1999. Evaluating cscl log files by social network analysis. Computer Supportfor Collaborative Learning.
OpenNlp. http://opennlp.sourceforge.net/README.html.
Palla, G., Derenyi, I., Farkas, I., and Vicsek, T. 2005. Uncovering the overlapping community structure of complex networks
in nature and society. Nature 435, 814–818.
Sundararajan, B. 2010. Emergence of the most knowledgeable other (mko): Social network analysis of chat and bulletin boardconversations in a cscl system. Electronic Journal of e-Learning 8, 191–208.
UCINET. http://www.analytictech.com/ucinet/.
WebCT. http://en.wikipedia.org/wiki/WebCT.
Willging, P. A. 2005. Using social network analysis techniques to examine online interactions. US-China Education Re-
view 2, 9, 46–56.


![arXiv:1810.11118v1 [cs.CL] 25 Oct 2018sairohit/assets/pdfs/convos_arxiv2018.pdfAnalyzing Assumptions in Conversation Disentanglement Research Through the Lens of a New Dataset and](https://static.fdocuments.us/doc/165x107/5e748170b88f512c6012e932/arxiv181011118v1-cscl-25-oct-2018-sairohitassetspdfsconvosarxiv2018pdf.jpg)


![Basic and depression specific emotion identification in ...webdocs.cs.ualberta.ca/~zaiane/postscript/CICLING19-1.pdf · label emotion mining from text [2,11,17]. With the increasing](https://static.fdocuments.us/doc/165x107/5f4a6fb08857b1069945e82f/basic-and-depression-speciic-emotion-identiication-in-zaianepostscriptcicling19-1pdf.jpg)