Analyzing Governor LePage’s Tax Reform Plan. Current-Law Tax System Sources of General Fund...
18
Analyzing Governor LePage’s Tax Reform Plan
-
Upload
margaret-jacobs -
Category
Documents
-
view
220 -
download
0
Transcript of Analyzing Governor LePage’s Tax Reform Plan. Current-Law Tax System Sources of General Fund...
Analyzing Governor LePage’s Tax Reform
Plan

$0.0
$300,000,000.0
$600,000,000.0
$900,000,000.0
$1,200,000,000.0
$1,500,000,000.0
$1,800,000,000.0
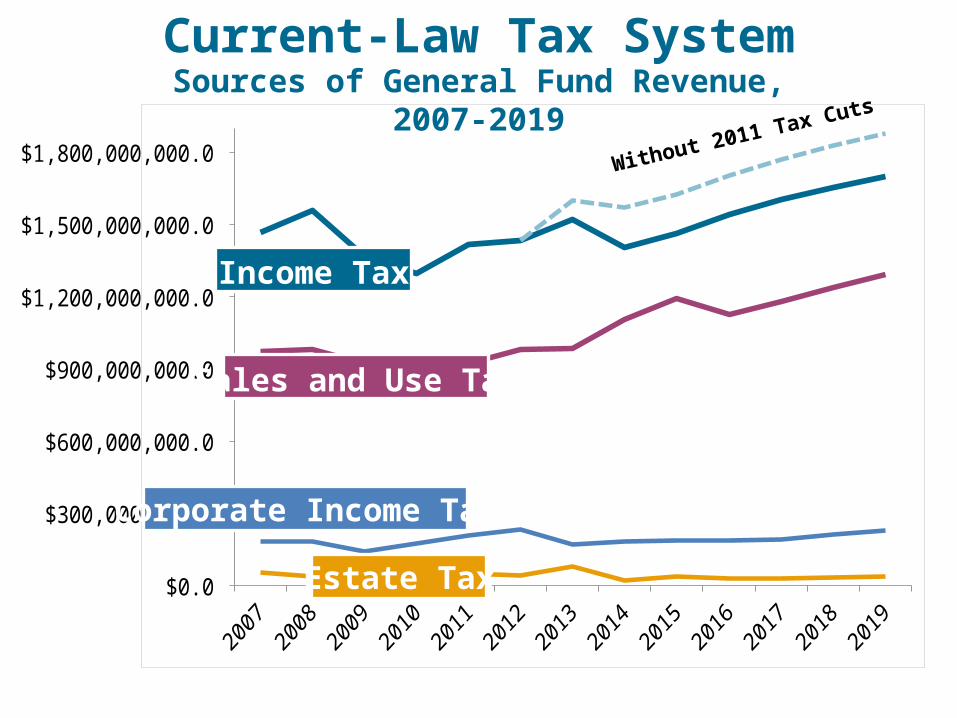
Current-Law Tax System Sources of General Fund Revenue,
2007-2019
Estate Tax
Income Tax
Corporate Income Tax
Sales and Use Tax
$0.0
$300,000,000.0
$600,000,000.0
$900,000,000.0
$1,200,000,000.0
$1,500,000,000.0
$1,800,000,000.0
Current-Law Tax System Sources of General Fund Revenue,
2007-2019
Estate Tax
Income Tax
Corporate Income Tax
Sales and Use Tax
Without 2011 Tax Cuts
$0.0
$300,000,000.0
$600,000,000.0
$900,000,000.0
$1,200,000,000.0
$1,500,000,000.0
$1,800,000,000.0
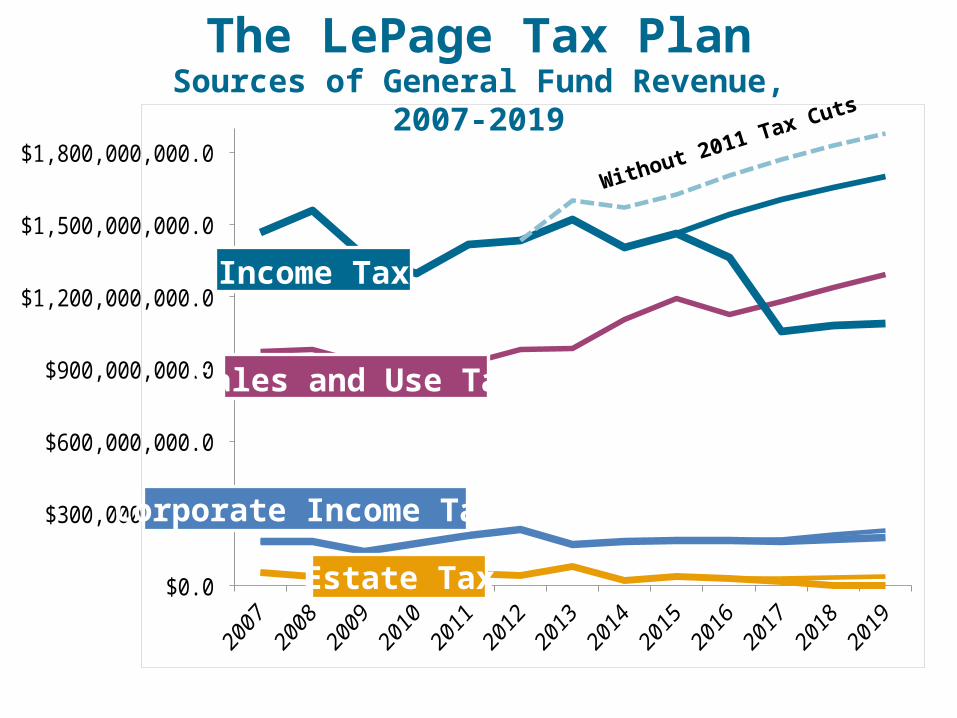
The LePage Tax Plan Sources of General Fund Revenue,
2007-2019
Estate Tax
Income Tax
Corporate Income Tax
Sales and Use Tax
Without 2011 Tax Cuts

$0.0
$300,000,000.0
$600,000,000.0
$900,000,000.0
$1,200,000,000.0
$1,500,000,000.0
$1,800,000,000.0
The LePage Tax Plan Sources of General Fund Revenue,
2007-2019
Estate Tax
Income Tax
Corporate Income Tax
Sales and Use Tax
Without 2011 Tax Cuts

Income Taxes -$610 Million
Estate Taxes -$37 Million
Corporate Taxes -$30 Million
Other -$13 Million
Summary of Tax Cuts in FY’19
-$690 Million
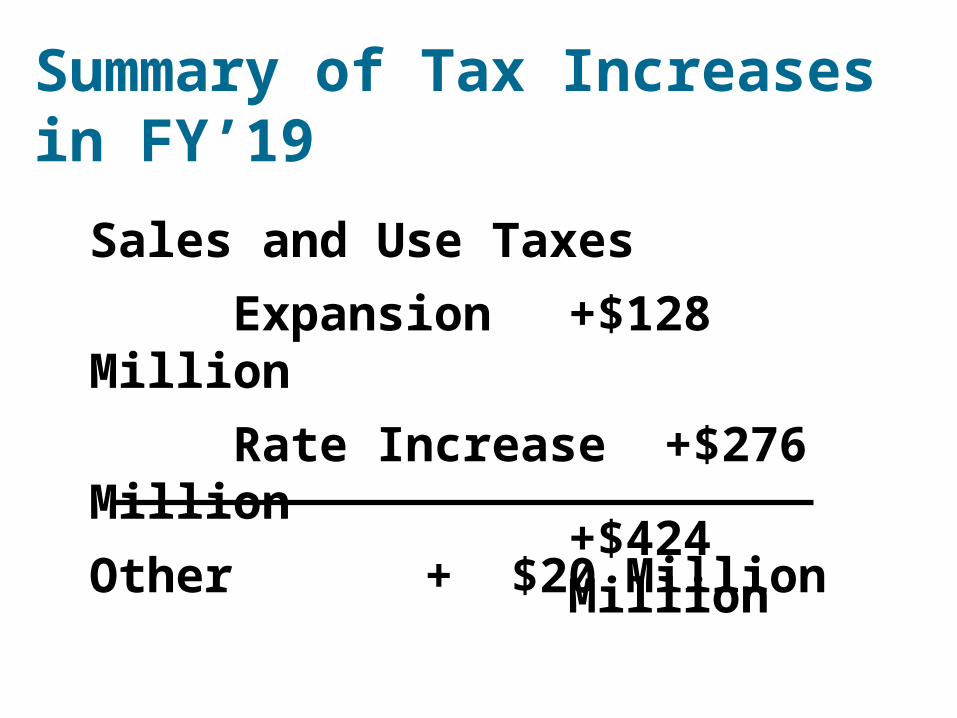
Summary of Tax Increases in FY’19
+$424 Million
Sales and Use Taxes
Expansion +$128 Million
Rate Increase +$276 Million
Other + $20 Million
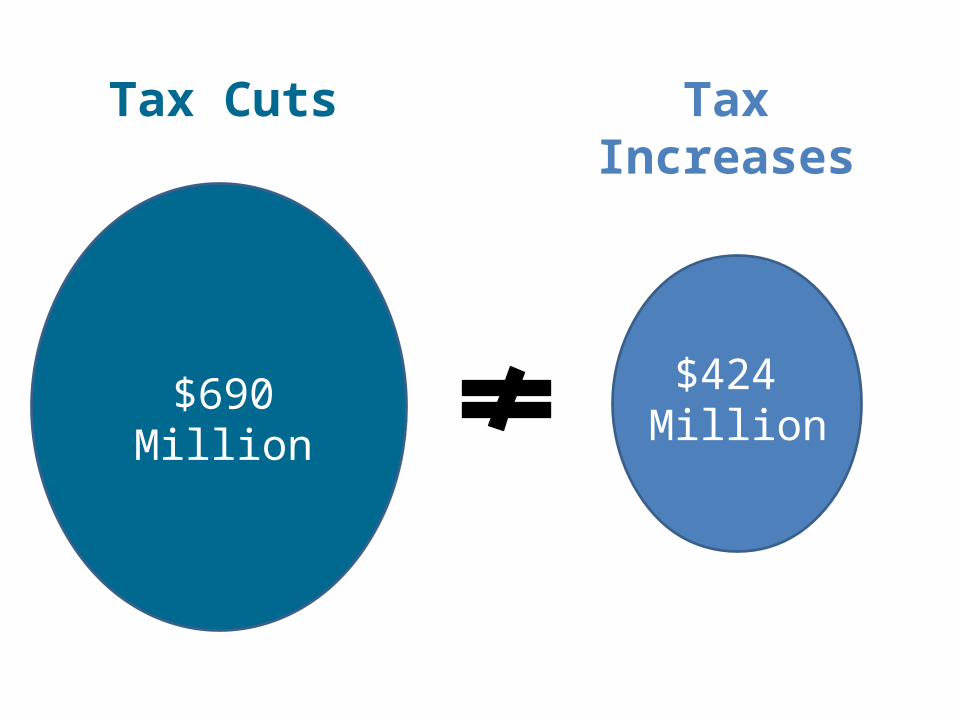
$690 Million
Tax Cuts Tax Increases
$424 Million

$690M
Income and Estate Tax
Cuts
Sales Tax Increases + Spending Cuts
$424M
$266M

1986
1987
1988
1989
1990
1991
1992
1993
1994
1995
1996
1997
1998
1999
2000
2001
2002
2003
2004
2005
2006
2007
2008
2009
2010
2011
2012
2013
2014
2015
2016
2017
2018
2019
0.0%
1.0%
2.0%
3.0%
4.0%
5.0%
6.0%
7.0%
8.0%
State Funding as a Share of the Economy is Historically
Low
General Fund + Revenue Sharing as a share of the economy

19861987
19881989
19901991
19921993
19941995
19961997
19981999
20002001
20022003
20042005
20062007
20082009
20102011
20122013
20142015
20162017
20182019
0.0%
1.0%
2.0%
3.0%
4.0%
5.0%
6.0%
7.0%
8.0%
Headed for Historically Low State Funding as a Share of
the EconomyGeneral Fund + Revenue Sharing as a share of the economy
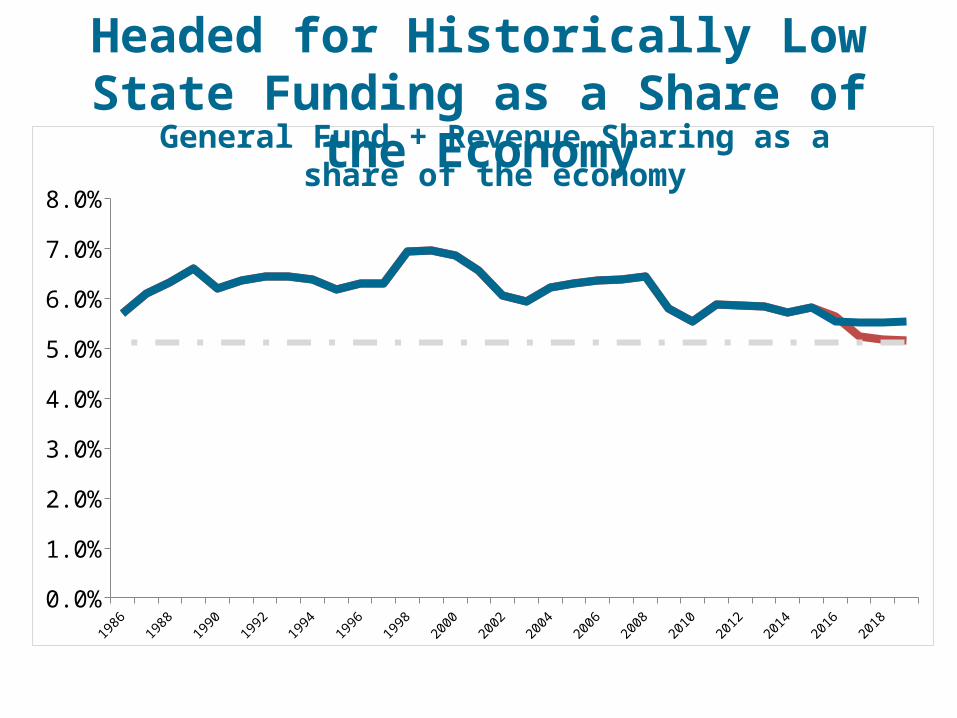
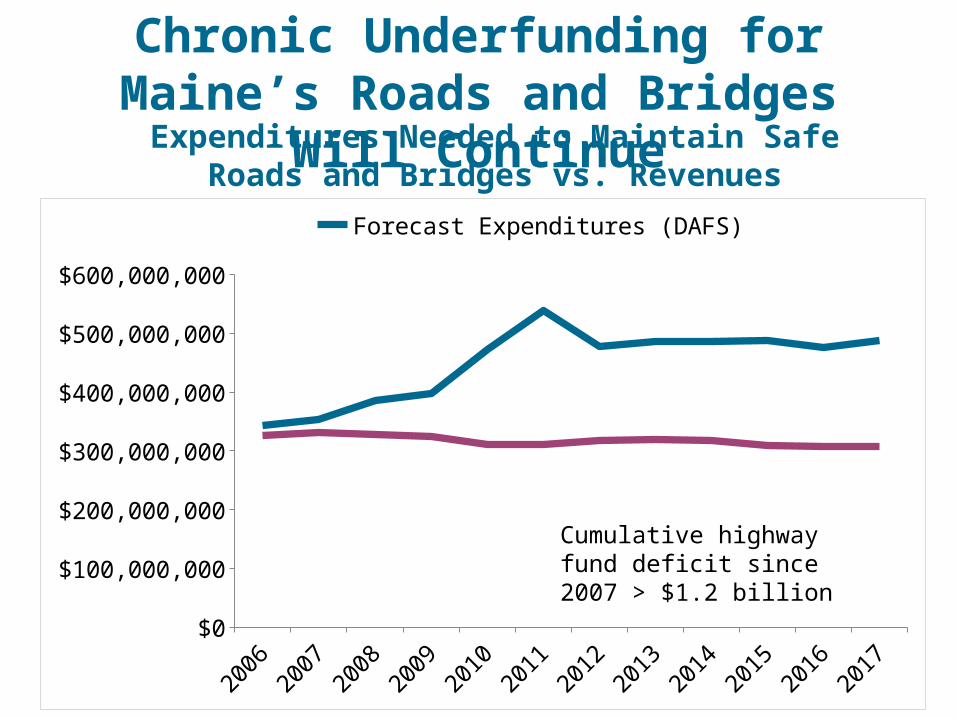
Chronic Underfunding for Maine’s Roads and Bridges
Will Continue
Expenditures Needed to Maintain Safe Roads and Bridges vs. Revenues
2006
2007
2008
2009
2010
2011
2012
2013
2014
2015
2016
2017
$0
$100,000,000
$200,000,000
$300,000,000
$400,000,000
$500,000,000
$600,000,000
Forecast Expenditures (DAFS)
Cumulative highway fund deficit since 2007 > $1.2 billion

Elimination of Revenue Sharing With Towns and Cities =
Local Tax Increases
+ Local Spending
Cuts
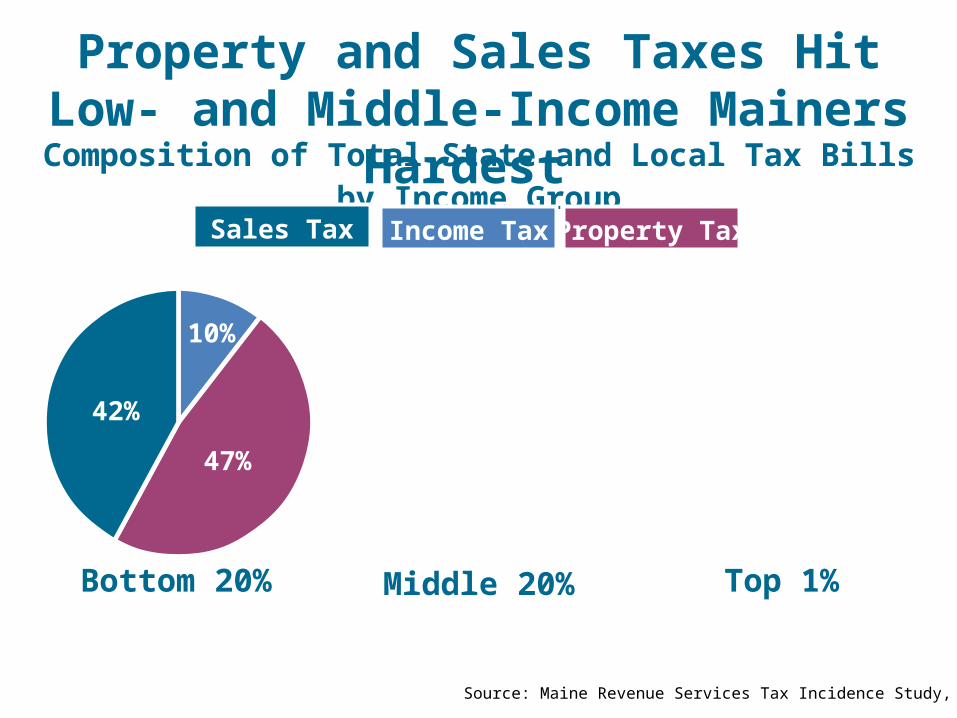
Composition of Total State and Local Tax Bills by Income Group
Property TaxSales Tax Income Tax
Property and Sales Taxes Hit Low- and Middle-Income Mainers
Hardest
Middle 20%Bottom 20% Top 1%
42%
47%
10%
32%
45%
23%
20%
17%
63%
Source: Maine Revenue Services Tax Incidence Study, 2009

I WIN!!!
I may come out ahead
too?!
Hmmm…
Hmmm…
Hmmm…
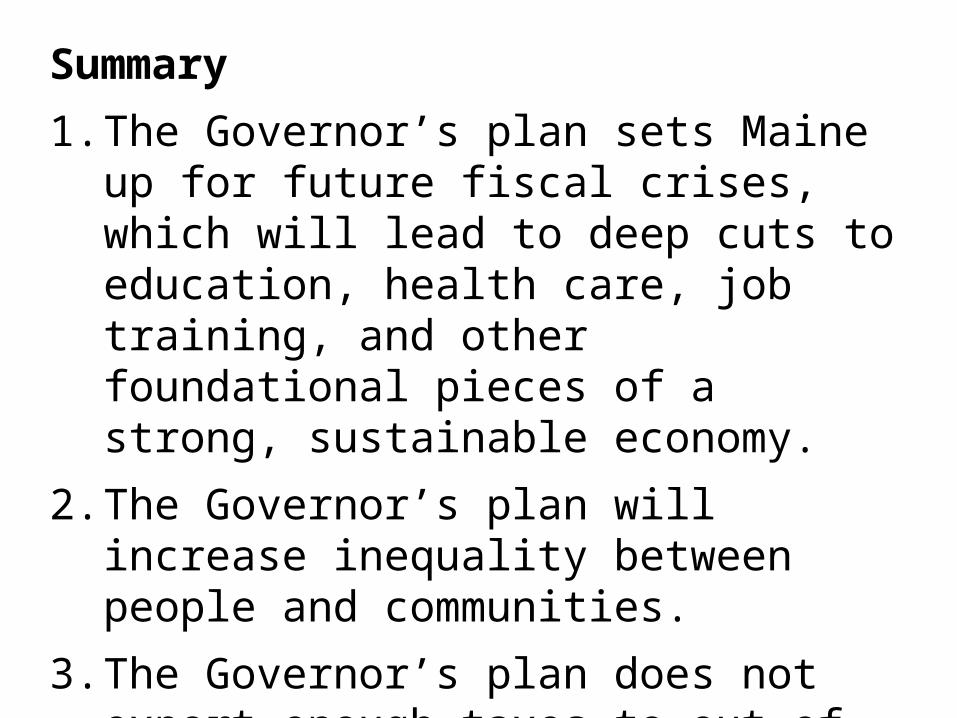
Summary
1. The Governor’s plan sets Maine up for future fiscal crises, which will lead to deep cuts to education, health care, job training, and other foundational pieces of a strong, sustainable economy.
2. The Governor’s plan will increase inequality between people and communities.
3. The Governor’s plan does not export enough taxes to out-of-state residents, seasonal residents, and tourists.
Joel [email protected]