ANALYZING CUSTOMER VALUE USING CONJOINT ANALYSIS · PDF file · 2008-06-06Analyzing...
31
ANALYZING CUSTOMER VALUE USING CONJOINT ANALYSIS: THE EXAMPLE OF A PACKAGING COMPANY Andrus Kotri ∗ Abstract The fulfillment of customers’ wishes in a profitable way re- quires that companies understand which aspects of their product and service are most valued by the customer. Conjoint analysis is considered to be one of the best methods for achieving this purpose. Conjoint analysis consists of generating and con- ducting specific experiments among customers with the purpose of modeling their purchasing decision. This article will give an overview of the method and apply it to an Estonian packaging company. As a result of the empirical study the author is able to estimate the value creation models of 34 respondents (custo- mers) both on a group and individual basis. Keywords: customer value, conjoint analysis, market research methods ∗ University of Tartu, Faculty of Economics and Business Admi- nistration, Institute of Management and Marketing, doctoral student, [email protected], +372 526 6624. This study has been prepared with the support of the Estonian Science Foundation grant project No. 6853 and Estonian Ministry of Education grant project TMJRI0107.
Transcript of ANALYZING CUSTOMER VALUE USING CONJOINT ANALYSIS · PDF file · 2008-06-06Analyzing...

ANALYZING CUSTOMERVALUE USING CONJOINT ANALYSIS:THE EXAMPLE OF A PACKAGINGCOMPANY
Andrus Kotri∗
Abstract
The fulfillment of customers’ wishes in a profitable way re-quires that companies understand which aspects of their productand service are most valued by the customer. Conjoint analysisis considered to be one of the best methods for achieving thispurpose. Conjoint analysis consists of generating and con-ducting specific experiments among customers with the purposeof modeling their purchasing decision. This article will give anoverview of the method and apply it to an Estonian packagingcompany. As a result of the empirical study the author is able toestimate the value creation models of 34 respondents (custo-mers) both on a group and individual basis.
Keywords: customer value, conjoint analysis, market researchmethods
∗ University of Tartu, Faculty of Economics and Business Admi-nistration, Institute of Management and Marketing, doctoral student,[email protected], +372 526 6624.
This study has been prepared with the support of the EstonianScience Foundation grant project No. 6853 and Estonian Ministry ofEducation grant project TMJRI0107.

INTRODUCTION
Satisfying customers’ wishes is a challenge for many companies in thetoday’s rapidly changing and keenly competitive environment. Athorough knowledge of customer needs is even considered to be thefoundation on which a company is built (Mohr-Jackson, 1996). Inpursuit of continuously offering better products and at the same timemaking profit, companies have to implement well thought-out stra-tegies. Given price and cost constraints, a company can’t completelysatisfy all its customers’ wishes. Consequently an important task of acompany’s marketing department is to create a profit maximizingbundle of product or service attributes or in another words a profitmaximizing value proposal. The main question which has to beanswered is — how to use the limited resources of the company inproduct and service design and development to maximize its profit.
Marketing specialists refer to conjoint analysis as one of the bestmethods for investigating and analyzing customer needs. Conjointanalysis means constructing and conducting particular experimentsamong consumers in order to model their decision making process.As the name suggests, potential customers are asked to makejudgments about the attributes that affect their purchase decisionsconjointly, rather than evaluate each attribute individually. Ana-lysis allows finding out which product attributes create most valueto a customer and how customers are likely to react to differentproduct configurations. This information can lead to the creation ofoptimal value propositions.
Despite the extensive use of the method in American, Western-European and Scandinavian companies, conjoint analysis is relati-vely unknown to Estonian marketing practitioners and theorists.Using the method requires thorough knowledge of statistical dataanalysis which may be the reason why it is not yet in common use.The marketing research companies Emor AS and Turu-UuringuteAS are the only users of conjoint analysis in Estonia, though theirknow-how originates from foreign partners.
The aim of present article is to analyze the applicability of conjointanalysis for researching and prioritizing the needs of an Estonianpackaging company’s customers. Considering the novelty of the
Andrus Kotri6
method in Estonian marketing practice and also the complexity ofthe method the first objective is here to explain the concepts,calculations and logic behind the method. Major advantages anddisadvantages of the method are also discussed. After this theo-retical discussion, the article presents the application of conjointanalysis for collecting data about and analyzing the needs ofEstiko-Plastar’s customers. The final part discusses the implica-tions and value of the results to the company.
THE CONCEPT OF CREATING VALUETO THE CUSTOMER
For understanding customer needs and studying them systema-tically it is necessary to be familiar with the concept of creatingvalue to the customer. Walters and Lancaster (1999) have statedthat value is created by any product or service attribute, whichmotivates the customer to buy the product and takes him closer toachieving his goals. Attributes of a product or service that createvalue to customers can be divided into (Woodall, 2003):1) factors that enhance customer’s benefits or help to satisfy his
needs,2) factors that decrease customer’s costs.
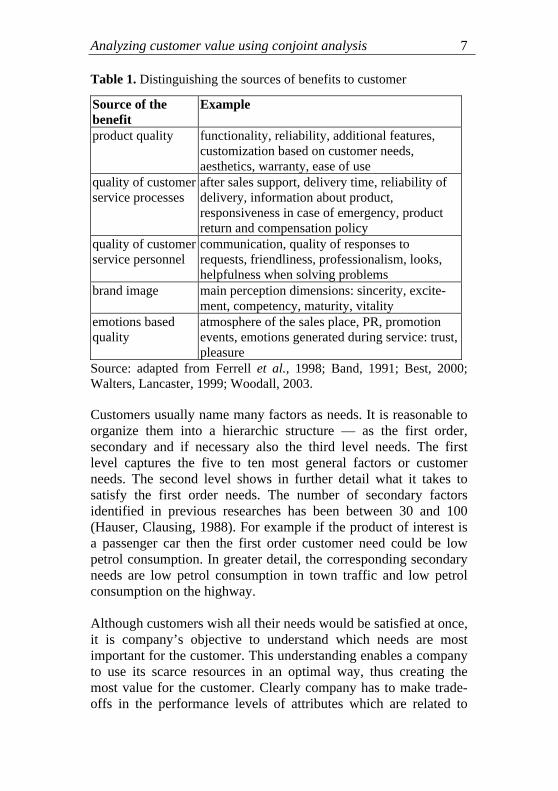
Cost can be defined in the broadest sense as everything the custo-mer has to give up in order to acquire the benefits offered by thesupplier. Costs can be monetary as well as non-monetary (timespent, aggravation, risk). Benefits can be affected by a variety offactors. Ferrell (1998) brings out the following main factors asbenefits: product quality, customer service quality and experiencebased quality (table 1). Band’s approach (1991) is essentially thesame, but he also includes customer service personnel complianceto customer expectations because it is often found that customerscan easily perceive the difference between the adequacy of com-pany’s processes and the behavior of service personnel (e.g. Rosen,Supernant, 1998). Additionally it is also often pointed out thatbrand can create value to customers (Best, 2002). And of coursethere usually are industry specific factors that customers perceiveas valuable.
Analyzing customer value using conjoint analysis 7
Table 1. Distinguishing the sources of benefits to customer
Source of thebenefit
Example
product quality functionality, reliability, additional features,customization based on customer needs,aesthetics, warranty, ease of use
quality of customerservice processes
after sales support, delivery time, reliability ofdelivery, information about product,responsiveness in case of emergency, productreturn and compensation policy
quality of customerservice personnel
communication, quality of responses torequests, friendliness, professionalism, looks,helpfulness when solving problems
brand image main perception dimensions: sincerity, excite-ment, competency, maturity, vitality
emotions basedquality
atmosphere of the sales place, PR, promotionevents, emotions generated during service: trust,pleasure
Source: adapted from Ferrell et al., 1998; Band, 1991; Best, 2000;Walters, Lancaster, 1999; Woodall, 2003.
Customers usually name many factors as needs. It is reasonable toorganize them into a hierarchic structure — as the first order,secondary and if necessary also the third level needs. The firstlevel captures the five to ten most general factors or customerneeds. The second level shows in further detail what it takes tosatisfy the first order needs. The number of secondary factorsidentified in previous researches has been between 30 and 100(Hauser, Clausing, 1988). For example if the product of interest isa passenger car then the first order customer need could be lowpetrol consumption. In greater detail, the corresponding secondaryneeds are low petrol consumption in town traffic and low petrolconsumption on the highway.
Although customers wish all their needs would be satisfied at once,it is company’s objective to understand which needs are mostimportant for the customer. This understanding enables a companyto use its scarce resources in an optimal way, thus creating themost value for the customer. Clearly company has to make trade-offs in the performance levels of attributes which are related to

Andrus Kotri8
each other. Returning to the example of a car — it is obvious thatcustomers wish a car which consumes very little petrol and wouldhave at the same time rapid acceleration (powerful engine). How-ever, the engineering reality is that both goals can’t be completelyachieved simultaneously. So it is necessary to know quite exactlywhich attribute creates more value for customers. The importanceof low fuel consumption or rapid acceleration to customer maydepend on customer-specific conditions like driving style, drivingenvironment, income etc.
To estimate the importance of customers’ needs most frequentlysimple 5- or 7-point rating scales are used. Often, the result is thatcustomers consider most of factors identically “extremely impor-tant” (Gale, Wood, 1994). Returning to the car example, if onewould ask a customer to estimate the importance of “petrol con-sumption” and “rapid acceleration,” customers might state that bothfactors are extremely important to them. (And they are not lying, it isjust the fallacy of the research method). As a result the car companywould not be able to make a reasonable trade-off along these factorsin designing its value proposal. That is why more innovative com-panies are beginning to use more sophisticated methods, likeconjoint analysis for studying customer needs.
Conjoint analysis allows defining customer needs more accuratelythan it is possible with using simple questionnaires. Rather thanask about the importance of attributes individually, the researchsetting is made quite close to actual decision making in a realmarket: where the customer’s task is to rank the different productalternatives which are offered to him and pick out the one thatcreates most value for him. Whereas ranking is based on personalpreference to different attributes of every product alternative.
Many studies confirm, that compared to other wide-spread custo-mer needs research methods (like: evaluation of single productattributes importance by rating scale or percentage; rank orderingof product attributes; multidimensional measurement etc.) theresults obtained with conjoint method are more detailed, reliableand easier to understand (Pullman, Moore, 1999; SPSS…, 1997).Based on the analysis of more than 300 applications in the litera-ture which aimed to learn customers’ needs, Anderson (1993)

Analyzing customer value using conjoint analysis 9
concludes that conjoint analysis was the most successful in compa-rison to other methods (table 2).
Table 2. The success rate of different methods for learning customerneeds.
Method % of successfulapplications
The estimates of company’s employees 55%Open-ended questions in the questionnaire 66%Benchmark (learning from competitors) 67%Focus group estimates 70%Observing the customer when using product 72%Using rating scale or constant sum directevaluations
75%
Conjoint analysis 85%Source: Anderson et al., 1993.
USING CONJOINT METHODFOR ANALYZING VALUE CREATEDTO CUSTOMER
Conjoint analysis uses customer’s preference-estimations towardsa set of experimental product concepts as an input. Hypotheticalproduct concepts are presented as the descriptions of the productsin the form of a bundle of particular product attributes. Conceptsare shown on “concept cards” (Dahan, Hauser, 2002). Based ondata gathered with conjoint analysis it is possible to find the utilityof the examined product attributes to a particular customer andthereby calculate the relative importance of different productattributes (Green, Krieger, 1991).
Because of the complexity of the conjoint method there are variousapproaches to data gathering as well as to data analysis available toa researcher. In order to construct the appropriate framework andsubstantiate the chosen approach for investigating Estiko-Plastar’scustomers’ needs the different conjoint techniques and phases are
Andrus Kotri10
next analyzed. A more detailed discussion about the conjointmethod is presented by Green and Srinivasan (1978; 1990).
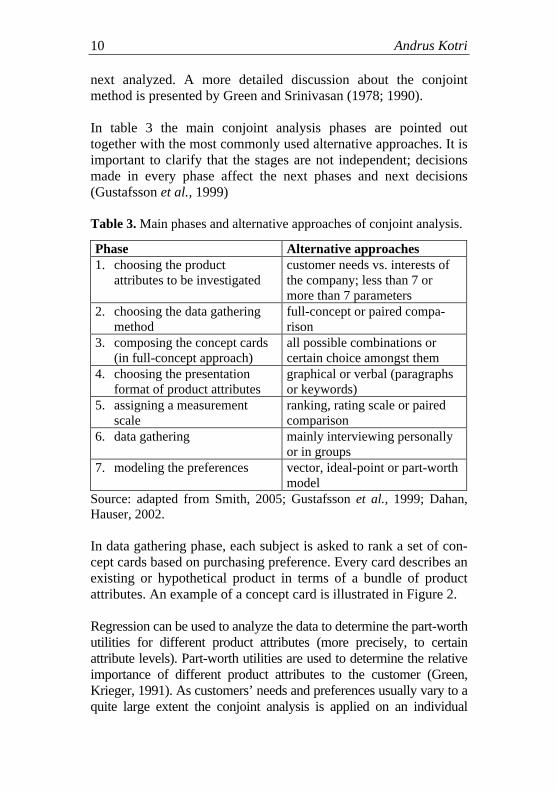
In table 3 the main conjoint analysis phases are pointed outtogether with the most commonly used alternative approaches. It isimportant to clarify that the stages are not independent; decisionsmade in every phase affect the next phases and next decisions(Gustafsson et al., 1999)
Table 3. Main phases and alternative approaches of conjoint analysis.
Phase Alternative approaches1. choosing the product
attributes to be investigatedcustomer needs vs. interests ofthe company; less than 7 ormore than 7 parameters
2. choosing the data gatheringmethod
full-concept or paired compa-rison
3. composing the concept cards (in full-concept approach)
all possible combinations orcertain choice amongst them
4. choosing the presentationformat of product attributes
graphical or verbal (paragraphsor keywords)
5. assigning a measurementscale
ranking, rating scale or pairedcomparison
6. data gathering mainly interviewing personallyor in groups
7. modeling the preferences vector, ideal-point or part-worthmodel
Source: adapted from Smith, 2005; Gustafsson et al., 1999; Dahan,Hauser, 2002.
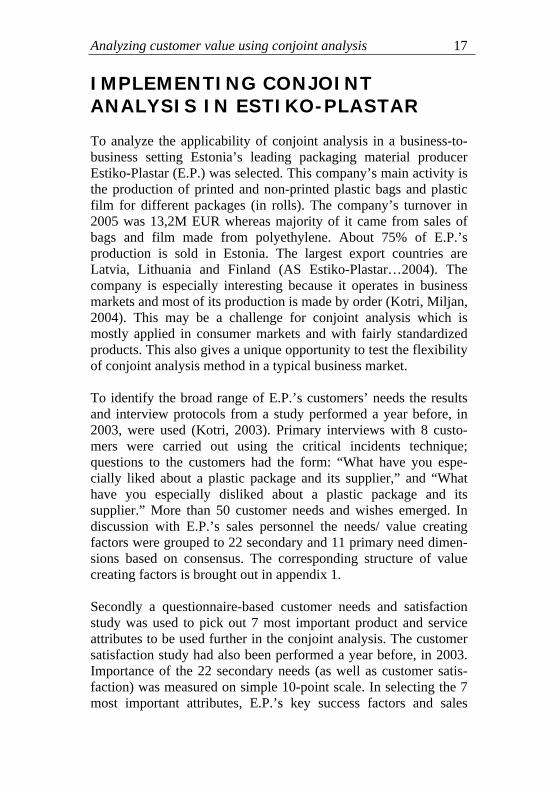
In data gathering phase, each subject is asked to rank a set of con-cept cards based on purchasing preference. Every card describes anexisting or hypothetical product in terms of a bundle of productattributes. An example of a concept card is illustrated in Figure 2.
Regression can be used to analyze the data to determine the part-worthutilities for different product attributes (more precisely, to certainattribute levels). Part-worth utilities are used to determine the relativeimportance of different product attributes to the customer (Green,Krieger, 1991). As customers’ needs and preferences usually vary to aquite large extent the conjoint analysis is applied on an individual

Analyzing customer value using conjoint analysis 11
customer level. Every subject’s needs are modeled by an individualutility function — the functional form of the model is the same for allsubjects, but the parameters of the function (betas) will differ. Anaggregate model (using one model for all subjects) is also possible.However an aggregate model is likely to mask differences in prefe-rences for different market segments. Individual models or models forseparate market segments are likely to have greater predictive validitythan aggregate models (using one model for all subjects) (Green,Srinivasan, 1990).
Choosing the product attributesto be investigated
To create concept cards it is necessary at first to choose the five toten most relevant product attributes, preferably corresponding tothe customer’s most important needs; though company’s intentionfor altering certain product attributes may also be decision criteria.The number of product attributes examined is limited in conjointmethod. Greater numbers of product attributes necessitates agreater number of concept cards (in order to get reliable estimatesof utility function parameters). At the same time the number ofconcept cards that a respondent can effectively rank is quite small.In different studies it is found that the tolerance level of a respon-dent is between 12–30 concept cards and 6–8 product attributes,depending on the motivation and product awareness of the respon-dent (Oppewal, Vriens, 2000). That is why the correct choice ofproduct attributes is often considered the most demanding phase ofconjoint analysis (Walley et al., 1999).
For initial identification of customer wishes different techniquesare used. The easiest perhaps is to use information gained frompast customer interactions. Mail questionnaires, focus groups andin-depth interviews can also be used (Chan, Wu, 2002). It has beenstated that for finding out 90–95% of all customer needs con-cerning a product, an experienced interviewer needs to make about20–30 in-depth interviews with customers (Griffin, Hauser, 1993).However, the majority of studies have been limited to 5–17 inter-

Andrus Kotri12
views (Pullman et al., 2002). Aaker (1997) has tackled in moredetail the issue of the number of respondents.
In addition to picking out the most relevant product attributes, theexaminable performance levels for every attribute have to bedetermined. A majority of studies have used 2–4 performancelevels for every attribute (Oppeval, Vriens, 2000). Two criteria areusually kept in mind when choosing the product attributes and theirperformance levels (Gustafsson et al., 1999):1. The attribute levels should describe as closely as possible the
real-life situation facing customers; attributes should be closelyrelated to those products that are available to customers.
2. It is worthwhile to include factors which are considered to becompany’s key competencies in gaining a competitive edge.
Choosing the data gathering method
As an alternative to the rank-ordering of concept cards (describedpreviously), it is also possible to gather data for conjoint analysisusing a paired comparison exercise. Using this approach, a custo-mer is asked to choose between two attributes which are presentedwith specific attribute levels (Green, Srinivasan, 1978). Using thecar example: which is more preferred: “petrol consumption” of6 liters/100km or “acceleration” of 7 sec. from zero to 100 km/h.Although the paired comparison exercise is less troublesome forrespondents (Walley et al., 1999) and it can also be used in theform of mail questionnaire, the paired comparison approach hasalso several disadvantages. The main deficiency is the higherdivergence of the research situation from real life decisionmaking — consumers are not in real life comparing only twoproduct attributes, but entire products (the whole bundle of productattributes). Another shortcoming is the large number of questions(paired comparisons) that are needed for analysis. Therefore pairedcomparison approach is justified mostly when the number ofproduct attributes is large and it is not possible to apply the full-concept method.
Analyzing customer value using conjoint analysis 13
Composing the concept cards
In the full-concept approach, it is practical to use only small part ofall possible concept card alternatives. In an experiment with, forexample, six product attributes where each attribute has threeperformance levels the number of alternative concept cards is36=729. Most researchers have used only the minimum amount ofconcept cards that is needed to estimate efficiently the main effectof different attributes on the dependent variable (consumer’s statedpurchasing preference). Normally, possible interaction effects areomitted from analysis, assuming they are not strong (Gustafsson etal., 1999). It has been found (Dahan, Hauser, 2002) that in conjointanalysis the gain from including interaction variables in the modeland raising thereby the descriptive power of the model will notcompensate the loss in predictive power of the model. The pro-cedure of orthogonal design∗ (also called partial factorial planning)allows to reduce the number of concept cards in the case presentedabove from 729 to 18, which is enough to estimate efficiently (withsufficient reliability) the main effects. A more sophisticatedmanual design of concept cards is needed when some productattributes are technically closely related. In the car example aconcept of “rapid acceleration” and “low petrol consumption”would sound really unbelievable. Which basically means that theresearcher has to pick an orthogonal plan, which does not includetechnically unfeasible product concepts. (There is always morethan one orthogonal plan possible.)
Choosing the presentation format ofproduct attributes
As the next step one has to choose which format is used to presentthe product concepts. It is possible to employ product descriptionsin text paragraphs which can give a complete and realistic pictureof the product, but these may make the comparison of informationin the descriptions difficult (Walley et al., 1999). Also the small
∗ Orthogonal means here, that the impact of each attribute/ variable ismeasured independently from changes in other attributes/ variables.
Andrus Kotri14
number of paragraphs that can be read and sorted through byrespondents makes the parameter estimates unreliable. It is morecommon to use a systemized format which presents productattributes as keywords in columns (as an example see figure 2).Keywords are easily comparable and do not include as muchrhetoric (Gustafsson et al., 1999). Pictorial presentations or actualproduct prototypes can also be used for presenting visual attributes,but are nevertheless seldom employed (Jaeger et al., 2001).
Data gathering
The procedure of sorting concept cards is usually perceived byrespondents as complicated and tedious. Consequently data arebest gathered through personal or group interviews. In the inter-view each respondent is asked to look through all the concept cardsas possible products on sale and rank them according to theirpersonal purchasing preferences. Interview helps to avoid distrust,give guidelines, control the ranking process and eventually getbetter data. The advantage of conjoint analysis compared to usualinterviews is that it does not ask the respondent directly “what isthe importance of different product attributes for you.” Rather theimportance is based on sequential choices made in ranking of thecards. This method can therefore minimize response error. Forexample, a respondent who is asked “how important is it that yourcar has low emissions” might, because of social pressures, say thatit was more important than it really was. However, in conjointanalysis, the importance would be inferred from the rankings andthe respondent is not directly asked the question.
Modeling the preferences
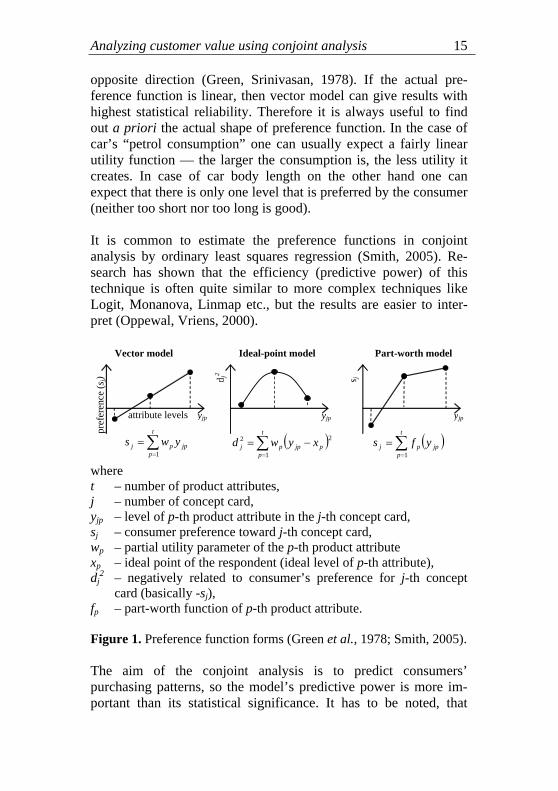
Consumers needs and preferences are usually modeled by usingone of the following three utility function forms: vector model,ideal-point model or part-worth model. As can be seen in figure 1the part-worth model is most flexible and vector model most rigidin terms of the shape of the preference function. But, at the sametime, the number of parameters to be estimated increases in the
Analyzing customer value using conjoint analysis 15
opposite direction (Green, Srinivasan, 1978). If the actual pre-ference function is linear, then vector model can give results withhighest statistical reliability. Therefore it is always useful to findout a priori the actual shape of preference function. In the case ofcar’s “petrol consumption” one can usually expect a fairly linearutility function — the larger the consumption is, the less utility itcreates. In case of car body length on the other hand one canexpect that there is only one level that is preferred by the consumer(neither too short nor too long is good).
It is common to estimate the preference functions in conjointanalysis by ordinary least squares regression (Smith, 2005). Re-search has shown that the efficiency (predictive power) of thistechnique is often quite similar to more complex techniques likeLogit, Monanova, Linmap etc., but the results are easier to inter-pret (Oppewal, Vriens, 2000).
yjp yjpyjp
d j2
s j
jp
t
ppj yws ∑
=
=1
( )jp
t
ppj yfs ∑
=
=1
( )21
2pjp
t
ppj xywd −=∑
=
Vector model Ideal-point model Part-worth model
attribute levels
pref
eren
ce (s
j)
wheret – number of product attributes,j – number of concept card,yjp – level of p-th product attribute in the j-th concept card,sj – consumer preference toward j-th concept card,wp – partial utility parameter of the p-th product attributexp – ideal point of the respondent (ideal level of p-th attribute),dj
2 – negatively related to consumer’s preference for j-th conceptcard (basically -sj),
fp – part-worth function of p-th product attribute.
Figure 1. Preference function forms (Green et al., 1978; Smith, 2005).
The aim of the conjoint analysis is to predict consumers’purchasing patterns, so the model’s predictive power is more im-portant than its statistical significance. It has to be noted, that
Andrus Kotri16
usually the micro-models’ statistical characteristics can be attackedby critics. But, on the other hand, this method produces signifi-cantly more accurate results than any alternative research method(Green, Krieger, 1991). To assess the model’s validity, the correla-tion between predicted rank order of cards and actual (consumergiven) rank order of cards is used (Green, Srinivasan, 1990;Hagerty, 1985). In different studies the average correlation hasbeen between 0,7–0,8 (Oppewal, Vriens, 2000), though Jaeger(2001) has also achieved correlations of 0,99.
Finding the relative importanceof product attributes
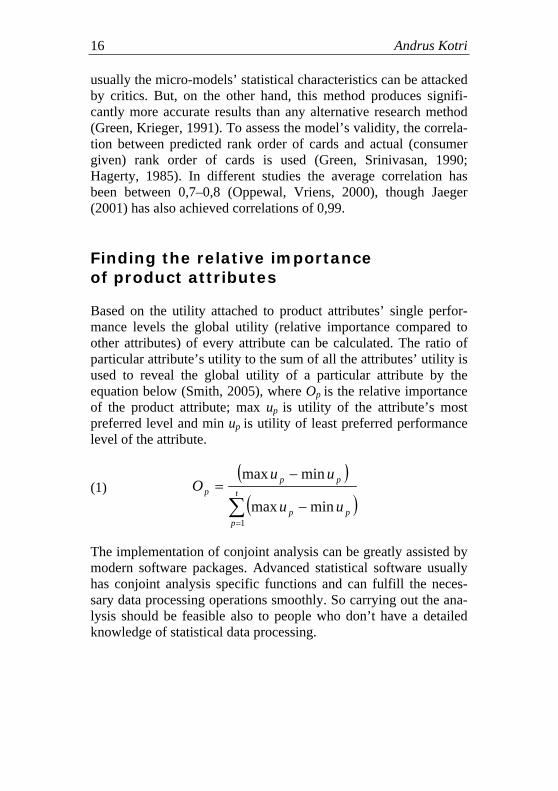
Based on the utility attached to product attributes’ single perfor-mance levels the global utility (relative importance compared toother attributes) of every attribute can be calculated. The ratio ofparticular attribute’s utility to the sum of all the attributes’ utility isused to reveal the global utility of a particular attribute by theequation below (Smith, 2005), where Op is the relative importanceof the product attribute; max up is utility of the attribute’s mostpreferred level and min up is utility of least preferred performancelevel of the attribute.
(1)
The implementation of conjoint analysis can be greatly assisted bymodern software packages. Advanced statistical software usuallyhas conjoint analysis specific functions and can fulfill the neces-sary data processing operations smoothly. So carrying out the ana-lysis should be feasible also to people who don’t have a detailedknowledge of statistical data processing.
( )( )∑
=
−
−= t
ppp
ppp
uu
uuO
1minmax
minmax
Analyzing customer value using conjoint analysis 17
IMPLEMENTING CONJOINTANALYSIS IN ESTIKO-PLASTAR
To analyze the applicability of conjoint analysis in a business-to-business setting Estonia’s leading packaging material producerEstiko-Plastar (E.P.) was selected. This company’s main activity isthe production of printed and non-printed plastic bags and plasticfilm for different packages (in rolls). The company’s turnover in2005 was 13,2M EUR whereas majority of it came from sales ofbags and film made from polyethylene. About 75% of E.P.’sproduction is sold in Estonia. The largest export countries areLatvia, Lithuania and Finland (AS Estiko-Plastar…2004). Thecompany is especially interesting because it operates in businessmarkets and most of its production is made by order (Kotri, Miljan,2004). This may be a challenge for conjoint analysis which ismostly applied in consumer markets and with fairly standardizedproducts. This also gives a unique opportunity to test the flexibilityof conjoint analysis method in a typical business market.
To identify the broad range of E.P.’s customers’ needs the resultsand interview protocols from a study performed a year before, in2003, were used (Kotri, 2003). Primary interviews with 8 custo-mers were carried out using the critical incidents technique;questions to the customers had the form: “What have you espe-cially liked about a plastic package and its supplier,” and “Whathave you especially disliked about a plastic package and itssupplier.” More than 50 customer needs and wishes emerged. Indiscussion with E.P.’s sales personnel the needs/ value creatingfactors were grouped to 22 secondary and 11 primary need dimen-sions based on consensus. The corresponding structure of valuecreating factors is brought out in appendix 1.
Secondly a questionnaire-based customer needs and satisfactionstudy was used to pick out 7 most important product and serviceattributes to be used further in the conjoint analysis. The customersatisfaction study had also been performed a year before, in 2003.Importance of the 22 secondary needs (as well as customer satis-faction) was measured on simple 10-point scale. In selecting the 7most important attributes, E.P.’s key success factors and sales
Andrus Kotri18
managers’ opinions were also taken into account — the factorscoincided to a large extent with attributes considered as most im-portant by customers. The major value creating attributes were:quality of plastic material, quality of welding, delivery time,quality of printing, price level, sales manager’s proficiency andproduction flexibility.
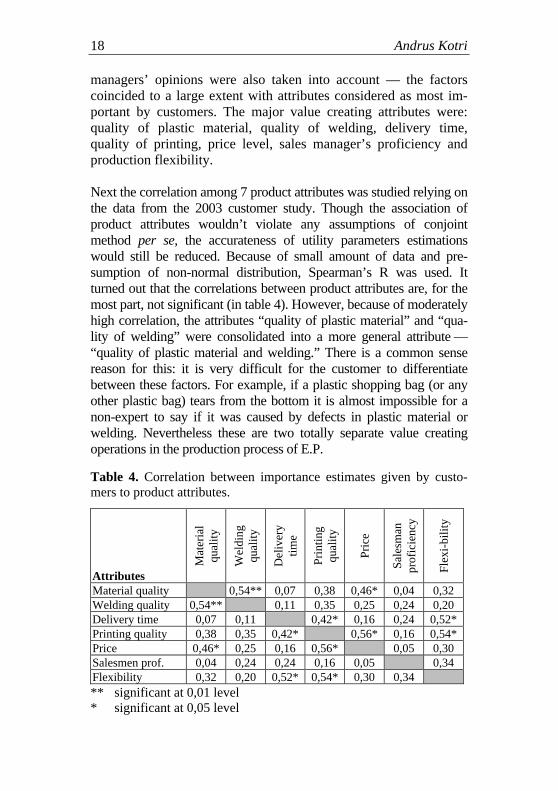
Next the correlation among 7 product attributes was studied relying onthe data from the 2003 customer study. Though the association ofproduct attributes wouldn’t violate any assumptions of conjointmethod per se, the accurateness of utility parameters estimationswould still be reduced. Because of small amount of data and pre-sumption of non-normal distribution, Spearman’s R was used. Itturned out that the correlations between product attributes are, for themost part, not significant (in table 4). However, because of moderatelyhigh correlation, the attributes “quality of plastic material” and “qua-lity of welding” were consolidated into a more general attribute —“quality of plastic material and welding.” There is a common sensereason for this: it is very difficult for the customer to differentiatebetween these factors. For example, if a plastic shopping bag (or anyother plastic bag) tears from the bottom it is almost impossible for anon-expert to say if it was caused by defects in plastic material orwelding. Nevertheless these are two totally separate value creatingoperations in the production process of E.P.
Table 4. Correlation between importance estimates given by custo-mers to product attributes.
Attributes
Mat
eria
lqu
ality
Wel
ding
qual
ity
Del
iver
ytim
e
Prin
ting
qual
ity
Pric
e
Sale
sman
prof
icie
ncy
Flex
i-bili
ty
Material quality 0,54** 0,07 0,38 0,46* 0,04 0,32Welding quality 0,54** 0,11 0,35 0,25 0,24 0,20Delivery time 0,07 0,11 0,42* 0,16 0,24 0,52*Printing quality 0,38 0,35 0,42* 0,56* 0,16 0,54*Price 0,46* 0,25 0,16 0,56* 0,05 0,30Salesmen prof. 0,04 0,24 0,24 0,16 0,05 0,34Flexibility 0,32 0,20 0,52* 0,54* 0,30 0,34** significant at 0,01 level* significant at 0,05 level
Analyzing customer value using conjoint analysis 19
As the number of most important value creating factors could benarrowed down to only 6 it was decided to employ in conjointanalysis a full-concept approach (procedure of ranking cards).Because most of E.P.’s production is made to order, there are nostandard product attribute levels, which would apply in relation toall customers. (E.g. print quality of 30 dpi is totally unacceptablefor some customers, while more than enough for others.) Con-sequently it is not possible to determine the specific attribute levelsto be included in the analysis. A somewhat more general “marketaverage” level was chosen as a reference base. The attribute per-formance levels were chosen to reflect the differences in theofferings in the real market, in an effort to help to assure a highvalidity of responses as proposed by Pullman (2002). Price diffe-rence of ±40% from market average is not real, it was reasonableto stay in the ±10% range. The same procedure was repeated foreach individual attribute to find valid performance levels. Finallythe product attributes and the attributes’ performance levels thatwere included into the analysis were following.1. Quality of plastic material and welding:− a bit lower than market average (at times low quality),− market average,− a bit higher than market average (practically always high
quality).2. Delivery time (order fulfillment time):− 14 days,− 21 days,− 30 days.3. Quality of printing:− a bit lower than market average,− market average,− a bit higher than market average.4. Price:− 10% lower than market average,− market average,− 10% higher than market average.5. Sales manager’s proficiency:− not very proficient and poor communication,− very proficient and good communication skills.

Andrus Kotri20
6. Production flexibility:− relatively rigid, can satisfy only 60% of our special requests,− quite flexible, can satisfy almost all (95%) of our special requests.
To reduce the number of concept cards before data gathering, theorthogonal planning procedure was executed. The number of con-cept cards was reduced from 324 to 18, which still makes it pos-sible to effectively estimate the main effects. The correspondingorthogonal plan is in appendix 2.
Concept cards with two data columns were used to study the valuecreating factors (figure 3). The left column stated the attributes andthe right column the corresponding performance levels accordingto orthogonal plan.
Plastic packaging supplier no.1
Plastic material and welding quality
a bit lower than market average (at times low quality)
Delivery time 14 days Printing quality market average Price 10% higher than market average Sales manager’s proficiency
not very proficient and poor communication
Production flexibility relatively rigid, can satisfy only 60% of special requests
Preference...
Figure 2. One of 18 concept cards presented to customer (hypo-thetical concept no. 1).
The task for respondents was to simply order the 18 cards bypurchasing preference. The preference to every card could havealso been estimated with points (eg. on 7-point scale), which wouldhave captured more information in every answer. But as stated byGustafsson (1999) this may also make responses less consistentand unreliable. For a consumer it is easier to decide which valueoffering is preferred rather than to say how much one offering isbetter than another.
Analyzing customer value using conjoint analysis 21
Because of the troublesome nature of the card ranking procedure,in-depth interviews were carried through with customers in theirworking places. Because of the time and effort required to conductthese interviews, the sample was limited to 36 of E.P.’s mostimportant customers∗, who represent more than 70% of E.P.’sturnover. These customers were active in different industries —from peat, textile and foodstuffs production to retailing. 30 custo-mers were located in Estonia and 6 in Latvia. 29 interviews weremade in Estonian language and 7 in Russian. For the Russianlanguage interviews, the concept cards were translated into Rus-sian. Respondents were people who made purchasing decisions forthe customer. They were interacting regularly with packagingmaterial supplier and had a clear picture of the customer com-pany’s needs and limitations. Interviewees were working aspurchasing managers or as higher managers.
Care was taken in present study to avoid pitfalls pointed out byother researchers (e.g. Jaeger et al., 2001). To prevent mistakeslike overvaluation of attributes presented in the upper part ofconcept cards, all the six attributes and their performance levelswere first introduced to interviewee. After that interviewee wasgiven 18 concept cards and asked to order them by the company’spreference by asking “Which of those hypothetical suppliers wouldyou like to see knocking on your door?” The initial sequence ofcards was random. For helping interviewees to divide the task intomore easily manageable stages, they were asked to sort first thecards into three piles (most attractive, intermediate and leastattractive product concepts) and only then rank-order every pile.Despite these techniques and support from the interviewer, twocustomers still couldn’t cope with the task; after about 20–30minutes of trying, they got really frustrated and gave up. Alsomany of the respondents who completed the task successfully saidthat it was quite difficult and without support they would haveprobably given up. Therefore 18–20 concept cards and 6–7 productattributes can be considered as a maximum load that can beutilized in similar research settings (business market, not preciselydefined attribute levels, respondents were managers, interviews atworkplace, no direct rewards to respondents). ∗ E.P.’s total customer base exceeds 1000
Andrus Kotri22
For modeling the preferences of responded customers the part-worth function model was used. Although the most and leastpreferred attribute levels were a priori known for all the attributes(it is obvious that higher quality is always preferred to average andaverage to lower) one can’t assume that the preference function islinear. Based on existing information the ideal-point model can bedismissed as well. Comparing also the predictive power ofdifferent models the part-worth function model proved to be moreprecise than vector or ideal-point model.
To estimate the part-worths and relative importance of productattributes the SPSS software package was used. The ordinary leastsquares method was chosen as estimation method. In equation 2,the dependent variable is the customer’s preference rank given to aconcept card and independent variables are product attributes’different levels.
S= B0 + B11(low material q.) + B12(average material q.) + B13(high material q.) + + B21(14 day delivery) + B22(21 day delivery) + B23(30 day delivery) + + B31(low print quality) + B32(average print quality) + B33(high print quality) +(2) + B41(10% lower price) + B42(average price) + B43(10% higher price)+ +B51(not proficient salesman) + B52(proficient salesman) + +B61(rigid production processes) + B62(flexible production processes)
The B parameters of independent variables show the part-worths(utility) of different product attributes for a particular customer(Orme, 2002). From the part-worths the relative importance ofdifferent attributes can be found. Results of the analysis arebrought out in the following section and in appendix 3.
To check the part-worth models’ predictive power the correlationbetween actual rank of concept cards and predicted rank was foundfor every respondent’s model. Correlation coefficients variedbetween 0,72 and 0,99; the average was 0,91 — which givesreason to believe the models are quite good. (Correlations in otherconjoint studies have been between 0,7 and 0,8.) Data wereanalyzed closely after every interview, on the same day. Thecustomer’s verbal responses about their most important factorswere found to be consistent with the results of the conjoint analysison the individual level, thus indicating fair validity of the method.

Analyzing customer value using conjoint analysis 23
RESULTS OF CONJOINT ANALYSISIN ESTIKO-PLASTAR
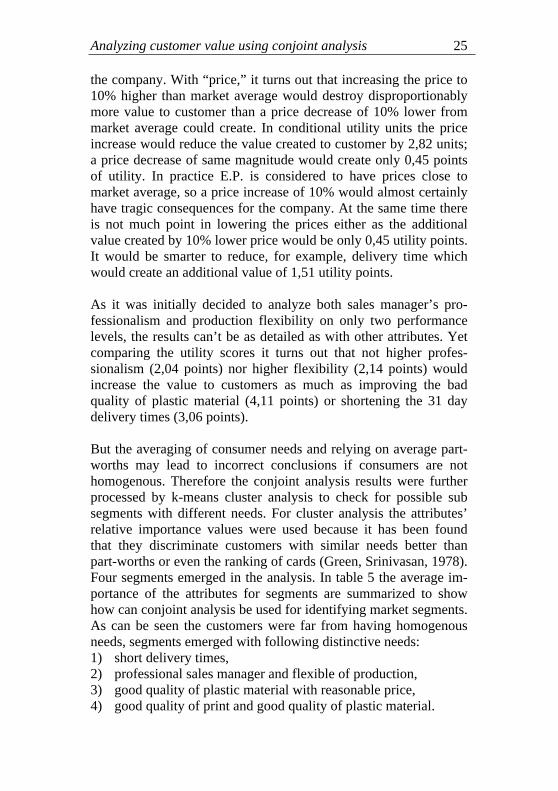
Based on the part-worth utilities and equation number 1, it wasfound that on average the most important attribute for E.P.’scustomers is the plastic material and welding quality. It can be seenfrom figure 3 that almost 24% of average customer’s purchasingdecision depends on the quality of plastic material and welding.This result is logical because the plastic package is the core pro-duct. Next in importance are the price and delivery time attributes,which form 21% and 19% of average customer’s purchasing deci-sion. The relative importance of the six attributes to all customersare on the individual level shown in appendix 3.
Figure 3. Average relative importance of product and serviceattributes of E.P.’s value proposal.
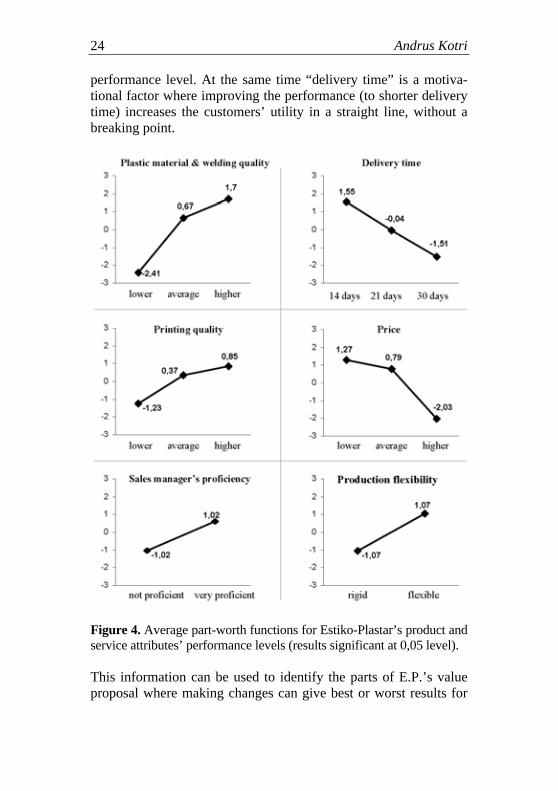
The average part-worth functions for six attributes can then beused to understand how a change in an attribute’s performanceinfluences the value created for customers. From figure 4 it can beseen that raising the quality of “material and welding” from lowlevel to average level creates more value to a customer than raisingthe material quality by same interval from average to higher. Ananalogous graph describes the “printing quality” value function forcustomers. Such differences in attribute levels utility elasticity canbe interpreted in context of Kano satisfaction theory that differen-tiates product attributes as hygiene factors and motivating factors(Kano et al., 1984). Improving the performance of hygiene factorswon’t increase considerably the utility further from certain
Andrus Kotri24
performance level. At the same time “delivery time” is a motiva-tional factor where improving the performance (to shorter deliverytime) increases the customers’ utility in a straight line, without abreaking point.
Figure 4. Average part-worth functions for Estiko-Plastar’s product andservice attributes’ performance levels (results significant at 0,05 level).
This information can be used to identify the parts of E.P.’s valueproposal where making changes can give best or worst results for
Analyzing customer value using conjoint analysis 25
the company. With “price,” it turns out that increasing the price to10% higher than market average would destroy disproportionablymore value to customer than a price decrease of 10% lower frommarket average could create. In conditional utility units the priceincrease would reduce the value created to customer by 2,82 units;a price decrease of same magnitude would create only 0,45 pointsof utility. In practice E.P. is considered to have prices close tomarket average, so a price increase of 10% would almost certainlyhave tragic consequences for the company. At the same time thereis not much point in lowering the prices either as the additionalvalue created by 10% lower price would be only 0,45 utility points.It would be smarter to reduce, for example, delivery time whichwould create an additional value of 1,51 utility points.
As it was initially decided to analyze both sales manager’s pro-fessionalism and production flexibility on only two performancelevels, the results can’t be as detailed as with other attributes. Yetcomparing the utility scores it turns out that not higher profes-sionalism (2,04 points) nor higher flexibility (2,14 points) wouldincrease the value to customers as much as improving the badquality of plastic material (4,11 points) or shortening the 31 daydelivery times (3,06 points).
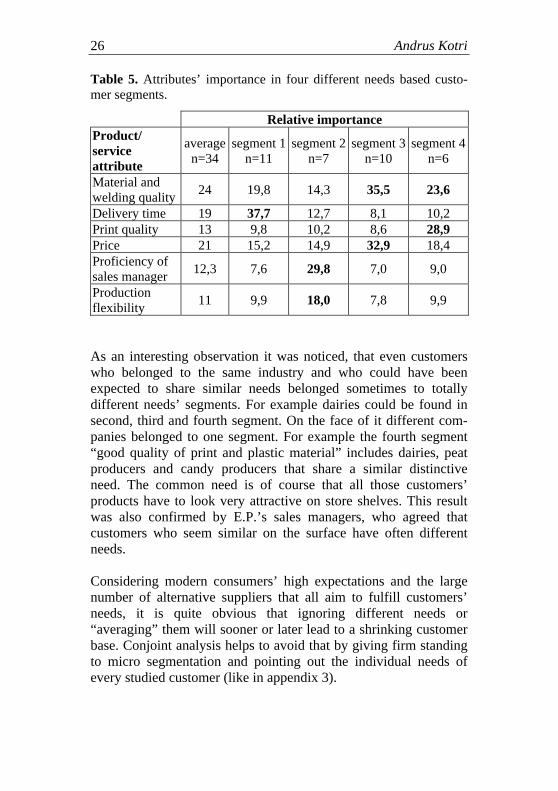
But the averaging of consumer needs and relying on average part-worths may lead to incorrect conclusions if consumers are nothomogenous. Therefore the conjoint analysis results were furtherprocessed by k-means cluster analysis to check for possible subsegments with different needs. For cluster analysis the attributes’relative importance values were used because it has been foundthat they discriminate customers with similar needs better thanpart-worths or even the ranking of cards (Green, Srinivasan, 1978).Four segments emerged in the analysis. In table 5 the average im-portance of the attributes for segments are summarized to showhow can conjoint analysis be used for identifying market segments.As can be seen the customers were far from having homogenousneeds, segments emerged with following distinctive needs:1) short delivery times,2) professional sales manager and flexible of production,3) good quality of plastic material with reasonable price,4) good quality of print and good quality of plastic material.
Andrus Kotri26
Table 5. Attributes’ importance in four different needs based custo-mer segments.
Relative importanceProduct/serviceattribute
averagen=34
segment 1n=11
segment 2n=7
segment 3n=10
segment 4n=6
Material andwelding quality 24 19,8 14,3 35,5 23,6
Delivery time 19 37,7 12,7 8,1 10,2Print quality 13 9,8 10,2 8,6 28,9Price 21 15,2 14,9 32,9 18,4Proficiency ofsales manager 12,3 7,6 29,8 7,0 9,0
Productionflexibility 11 9,9 18,0 7,8 9,9
As an interesting observation it was noticed, that even customerswho belonged to the same industry and who could have beenexpected to share similar needs belonged sometimes to totallydifferent needs’ segments. For example dairies could be found insecond, third and fourth segment. On the face of it different com-panies belonged to one segment. For example the fourth segment“good quality of print and plastic material” includes dairies, peatproducers and candy producers that share a similar distinctiveneed. The common need is of course that all those customers’products have to look very attractive on store shelves. This resultwas also confirmed by E.P.’s sales managers, who agreed thatcustomers who seem similar on the surface have often differentneeds.
Considering modern consumers’ high expectations and the largenumber of alternative suppliers that all aim to fulfill customers’needs, it is quite obvious that ignoring different needs or“averaging” them will sooner or later lead to a shrinking customerbase. Conjoint analysis helps to avoid that by giving firm standingto micro segmentation and pointing out the individual needs ofevery studied customer (like in appendix 3).
Analyzing customer value using conjoint analysis 27
ADVANTAGES OF THE CONJOINTMETHOD AND ITS LIMITATIONS
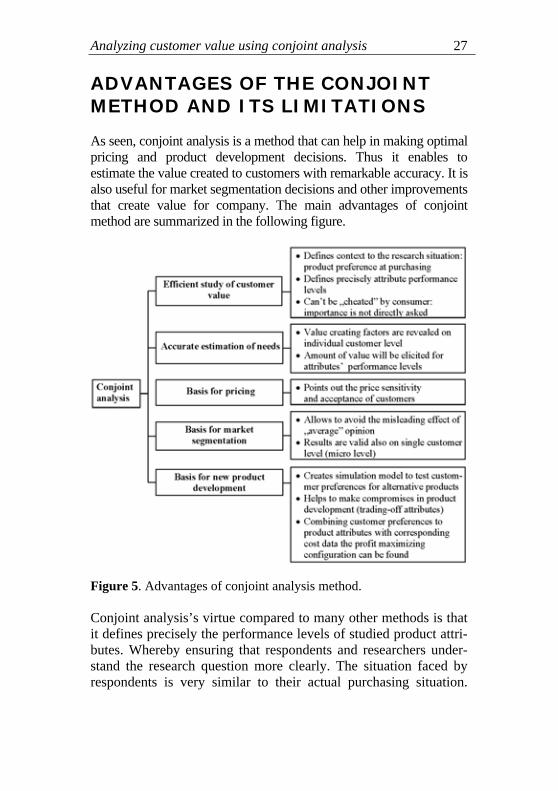
As seen, conjoint analysis is a method that can help in making optimalpricing and product development decisions. Thus it enables toestimate the value created to customers with remarkable accuracy. It isalso useful for market segmentation decisions and other improvementsthat create value for company. The main advantages of conjointmethod are summarized in the following figure.
Figure 5. Advantages of conjoint analysis method.
Conjoint analysis’s virtue compared to many other methods is thatit defines precisely the performance levels of studied product attri-butes. Whereby ensuring that respondents and researchers under-stand the research question more clearly. The situation faced byrespondents is very similar to their actual purchasing situation.

Andrus Kotri28
Comparing the concept cards is analogous to comparing theproducts in the real market.
Conjoint analysis allows measuring and analysis of consumer prefe-rences even for individual respondents. In addition, the segmentationand clustering of customers is possible also when the sample is verysmall. In practice it allows companies to analyze the needs of verysmall consumer segments and create attractive value offerings. Thiscan be especially appealing for mass-customizers and companiesembarking on 1-to-1 customer relationship strategies.
The results of conjoint analysis give a good picture about theimportance of different product attributes in creating value forcustomers. Using this information, it is possible to develop optimalproduct configurations or service packages. Models based on theresults of conjoint analysis allow predicting the response of themarket to changes in existing product configurations (or price)before the actual decision is made.
Conjoint analysis is based on the assumption that consumers’purchasing behavior follows the compensative value model. Thismeans that the utility from product’s benefits and costs can besimply summed together (as higher performance of one attributecompensates for low performance of another). This is also some-times considered as a limitation to conjoint method, because thepurchasing decision may also follow, for example, an exclusion ormagnified compensative model. However, Green and Srinivasan(1990) have concluded that conjoint analysis’ predictive validity isquite high even when the consumer actually follows differentdecision rules other than compensative.
As previously discussed, another shortcoming of conjoint method(especially the full concept approach) is the small number of productattributes that can be effectively analyzed. To overcome it, a bridgingtechnique can be used (Dahan, Hauser, 2002). To put it simply,bridging means creating several concept card sets, which analyzedifferent attributes, but share a common “anchor attribute” in every setthat makes the results and utility functions comparable. Oppewal andVriens (2000) talk about a successful example where even 28 productattributes were included to conjoint analysis in four card sets.

CONCLUSION
Knowing customer needs and designing accordingly appealingvalue proposals is a crucial success factor in today’s competitivemarkets. The aim of consumer research is to shape such a valueproposal that would maximize the market share or profit of theproduct, giving guidance to the company about how to best use itslimited resources. The present article has discussed the potential ofusing conjoint analysis, which is relatively unknown in Estonia, foranalyzing and measuring consumers’ needs. A theoretical frame-work was applied in prioritizing an Estonian packaging materialproducer’s customers needs and corresponding product attributes.
Conjoint analysis consists of planning and implementing experi-ments among consumers in order to model the consumerpurchasing decision and to understand which factors create valuefor the customer. Conjoint analysis embodies more than sevenmajor phases: it starts by selecting the product attributes or factorswhich fulfill customer needs and finishes with stating the relativeimportance of different attributes to customer. All the major phaseswere discussed in the paper, to point out the alternative approachesthat a researcher could take, with the aim of creating a suitableframework for implementing the research in the case of Estiko-Plastar.
For performing the conjoint analysis in the study of Estiko-Plastar’s customers needs, the full concept approach was chosen.As the result of preliminary analysis and structuring of customerneeds, the six most important product and service attributes wereselected for further analysis. Based on the chosen performancelevels of those six attributes 18 complete configurations (concepts)of different plastic packaging offerings were produced using theorthogonal design procedure. During personal in-depth interviewswith the 36 most important customers of Estiko-Plastar, thecustomers were asked to rank the different concepts (presented onseparate cards) based on their purchasing preference. Afteranalyzing the data by using regression, the relative importance(and utility) of different product and service attributes for eachcustomer was found.

Andrus Kotri30
It appeared that the most important attribute of Estiko-Plastar’svalue offering is the quality of plastic material and welding, thatdetermines 24% of average customer’s purchasing decision. Thenext most important attributes are price (21%) and delivery time(19%). Going more detail by examining attributes utility functionsit was found which changes in the current offering would have thelargest impact on customer value. Most value could be created byimproving material quality or shortening the delivery time. On theother hand, significant value would be destroyed by raising theprice above market average level or lowering the material qualitybelow market average. Because the utility functions were quitedifferent in comparing the aggregate model to the individualmodels, it was clear that “value” consisted of different attributesfor different customers. So conjoint analysis results were furtherprocessed by cluster analysis to identify sub-segments based ondifferent needs. Four quite distinctive segments emerged.
Possibly the most important limitation of the conjoint method isthat the implementation is quite complicated if more than 7–8customer needs/ product attributes are involved. Also it is easier touse simple, but less reliable point-scales. In using conjoint ana-lysis, the current study suggests that three rather than two levels foreach product attribute should be used. The results are much moreinformative for three attribute levels, allowing to differentiatehygiene factors and motivating factors among all value creatingfactors.
For further development of present study the information about thecosts associated with improvements in attribute levels should alsobe identified. It is often the case, that the most preferred productconfiguration discovered by conjoint analysis would maximizecompany’s market share (sales) but not profit. For combining theutility of product attribute levels and the costs of attaining eachlevel the quality function deployment (QFD) method could be used.It systemizes the relationships between product attributes and pro-duction processes, and thus costs. This facilitates finding profitmaximizing product attribute bundles.
In conclusion, it can be said that conjoint method helped to analyzeand prioritize the needs of Estiko-Plastar’s customers with con-

Analyzing customer value using conjoint analysis 31
siderable accuracy. This helped to understand what factors createdvalue for individual customers and to predict how customers wouldreact to changes in Estiko-Plastar’s existing value proposal. So asound basis was created for making reasoned decisions about thecompany’s value proposal and marketing strategy.
REFERENCES
Aaker, D. A.; Kumar, V.; Day G.S. ‘Marketing Research’ (NY:Wiley, 1997) 756 pgs.
Anderson, J.C.; Jain, D.C.; Chintagunta, P. ‘Customer Value Assess-ment in Business Markets’ Journal of Business-to-BusinessMarketing, 1, 1993, pp. 4–26.
AS Estiko-Plastar 2004 annual report. Tartu, 2004.Band, W. A. ‘Creating Value for Customers’ (NY: Wiley, 1991)
340 pgs.Best, R. J.; ‘Market-Based Management: Strategies for Growing Cus-
tomer Value and Profitability’ (Upper Saddle River: Prentice Hall,2000) 385 pgs.
Chan, L.-K.; Wu, M.-L. ‘Quality Function Deployment: A Com-prehensive Review of Its Concepts and Methods’ Quality En-gineering, 15, 2002, pp. 23–35.
Dahan, E.; Hauser, J. ‘The Virtual Customer’ The Journal of ProductInnovation Management, 19, 2002. pgs. 332–353.
Ferrell O. C.; Hartline M. D.; Lucas J. H.; Luck, D. ‘MarketingStrategy’ (Fort Worth: Dryden Press, 1998) 407 pgs.
Gale, B.T.; Wood, R.C. ‘Managing Customer Value’ (NY: Free Press,1994) 416 pgs.
Green, P.E.; Krieger, A.M. ‘Segmenting Markets with Conjoint Ana-lysis’ Journal of Marketing, 55, 1991, pp. 20–31.
Green, P.E.; Srinivasan, V. ‘Conjoint Analysis in Consumer Research:Issues and Outlook’ Journal of Consumer Research, 5, 1978, pp.103–123.
Green, P.E., Srinivasan, V. ‘Conjoint Analysis in Marketing: NewDevelopments with Implications for Research and Practice’Journal of Marketing, Oct. 1990, pp.3–19.
Griffin, A.; Hauser, J.R. ‘The Voice of the Customer’ MarketingScience, Vol. 12, No. 1, 1993, pp. 1–27.
Gustafsson, A.; Ekdahl, F.; Bergman, B. ‘Conjoint Analysis: a usefultool in the Design Process’ Total Quality Management, Vol. 10,No. 3, 1999, pp. 327–343.
Hagerty, M.R. ‘Improving the predictive Power of Conjoint Analysis:The Use of Factor Analysis and Cluster Analysis’ Journal ofMarketing Research, 22, 1985, pp. 168–184.
Hauser J.R.; Clausing, D. ‘The House of Quality’ Harvard BusinessReview, May-June 1988, pp. 63–73.

Analyzing customer value using conjoint analysis 33
Jaeger, S.R; Hedderley, D.; MacFie, H.J.H. ‘Methodological issues inconjoint analysis’ European Journal of Marketing, Vol. 35, No.11, 2001, pp.1217–1237.
Kano, N.; Seraku, K.; Takahashi, F.; Tsuji, S. ‘Attractive quality andmust-be quality’ Hinshitsu Quality, Vol. 14, No. 2, 1984, pp. 39–48.
Kotri, A. ‘Results of customer satisfaction study in Estiko Plastar’Tartu, 2003, 18 pgs.
Kotri, A.; Miljan, M. ‘Delivering Personalized Value Offerings with aMass-Customization System’ Proceedings of the 30th EIBAAnnual Conference, Ljubljana: EIBA, 2004, 24 pgs.
Mohr-Jackson, I. ‘Quality Function Deployment: A Valuable Mar-keting Tool’ Journal of Marketing Theory and Practice, 3, 1996,pp. 60–67.
Oppewal, H.; Vriens, M. ‘Measuring perceived service quality usingconjoint experi-ments’ International Journal of Bank Marketing,Vol. 18, No. 4, 2000, pp. 154–169.
Orme, B.K. ‘Analysis of Traditional Conjoint Using Microsoft Excel’Sequim: Sawtooth Software Research Paper Series, 2002, 6 pgs.
Pullman, M.E.; Moore, W.L. ‘Optimal service design: integratingmarketing and operations perspectives’ International Journal ofService Industry Management, Vol. 10, No. 2, 1999, pp. 239–260.
Pullman, M.E.; Moore, W.L.; Wardell, D.G. ‘A Comparison of qualityfunction deployment and conjoint analysis in new product design’The journal of Product Innovation Management, 19, 2002, pp.354–364.
Rosen, E.D.; Surpernant, C. ‘Evaluating Relationships: Are Satis-faction And Quality Enough?’ International Journal of ServiceIndustry Management, Vol. 9, No. 2, 1998, pp. 103–125.
Smith, S.M. ‘Conjoint Analysis Tutorial’[http://marketing.byu.edu/htmlpages/tutorials/conjoint.htm] 16.August. 2005.
SPSS Conjoint. Chicago: SPSS Inc., 1997, 84 pgs.Walley, K.; Parsons, S.; Bland, M. ‘Quality Assurance and the Con-
sumer: a Conjoint Study’ British Food Journal, Vol. 101, No. 2,1999, pp.148–161.
Walters, D.; Lancaster, G. ‘Value-based marketing and its usefulnessto customers’ Management Decision, Vol. 37, No. 9, 1999,pp. 679–708.
Woodall, T. ‘Conceptualizing Value for Customer — Attributional,Structural and Dispo-sitional Analysis’ Academy of MarketingScience Review, 12, 2003, pp. 1–42.