Analyze Assure Accelerate ITU-T G.1050/TIA-921 IP Network Model Overview April 2006 VQEG Jack...
14
Analyze Assure Accelerate ITU-T G.1050/TIA-921 IP Network Model Overview April 2006 VQEG Jack Douglass [email protected] Spirent Communications
-
Upload
hortense-nicholson -
Category
Documents
-
view
215 -
download
0
Transcript of Analyze Assure Accelerate ITU-T G.1050/TIA-921 IP Network Model Overview April 2006 VQEG Jack...
Analyze Assure Accelerate
ITU-T G.1050/TIA-921 IP Network Model Overview
April 2006
VQEG
Jack Douglass [email protected]
Spirent Communications

Analyze Assure Accelerate
G.1050/TIA-921 Overview
• Sources of network impairments
• Network models including expected values for– Latency
– Jitter
– Packet loss
– Out of sequence packets
– Delay

Analyze Assure Accelerate
Network Impairments and Parameters that Affect Video Quality
• Network Architecture
• Types of Access Links
• QoS controlled Edge Routing
• MTU Size
• Packet Loss (Frame Loss)
• Out of order packets
• One Way Delay (Latency)
• Variable Delays (Jitter)
• Background Traffic (Occupancy, Congestion, Network Load)
• Route Flapping
• Signaling protocol mismatches
• Network faults
• Link Failures
Analyze Assure Accelerate
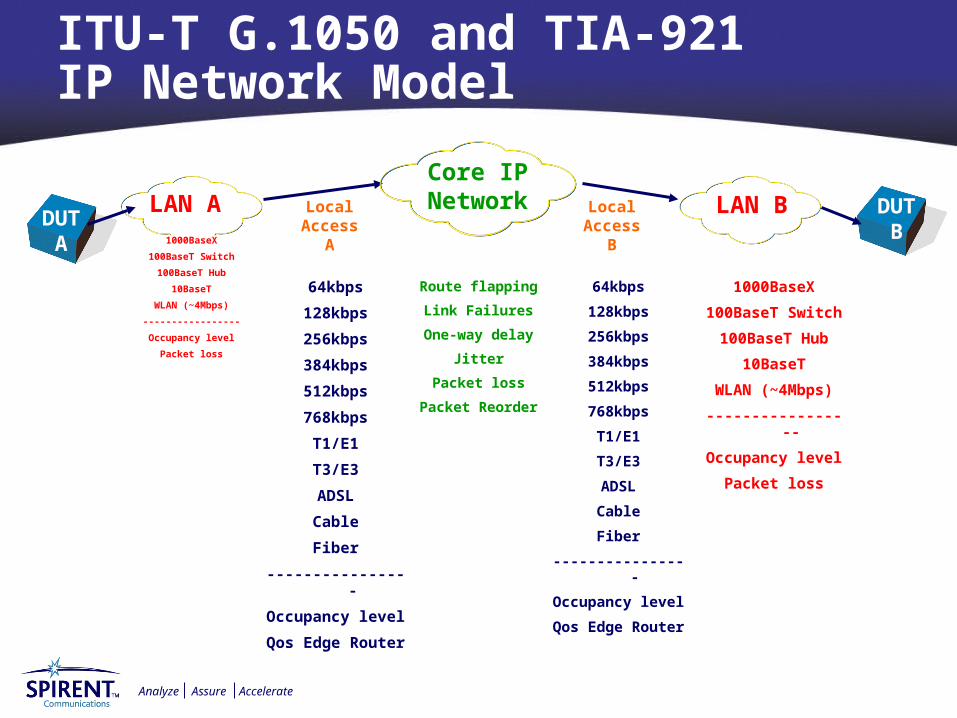
ITU-T G.1050 and TIA-921 IP Network Model
1000BaseX
100BaseT Switch
100BaseT Hub
10BaseT
WLAN (~4Mbps)
-----------------
Occupancy level
Packet loss
64kbps
128kbps
256kbps
384kbps
512kbps
768kbps
T1/E1
T3/E3
ADSL
Cable
Fiber
----------------
Occupancy level
Qos Edge Router
LAN ACore IPNetwork
DUTA
Route flapping
Link Failures
One-way delay
Jitter
Packet loss
Packet Reorder
LocalAccess
A
DUTB
LAN BLocalAccess
B
64kbps
128kbps
256kbps
384kbps
512kbps
768kbps
T1/E1
T3/E3
ADSL
Cable
Fiber
----------------
Occupancy level
Qos Edge Router
1000BaseX
100BaseT Switch
100BaseT Hub
10BaseT
WLAN (~4Mbps)
-----------------
Occupancy level
Packet loss

Analyze Assure Accelerate
ITU-T G.1050 and TIA-921 Test Profiles
ITU-T Recommendation Y.1541 uses a similar approach, but there is not a one-to-one mapping.
Service Test Profiles
Applications (Examples) Node Mechanisms Network Techniques
Well‑Managed IP Network(Profile A)
High quality video and VoIP, VTC (Real-time applications, loss sensitive, jitter sensitive, high interaction)
Strict QoS, guaranteed no over subscription on links
Constrained routing and distance
Partially-Managed IP Network(Profile B)
VoIP, VTC (Real-time applications, jitter sensitive, interactive)
Separate queue with preferential servicing, traffic grooming
Less constrained routing and distances
Unmanaged IP Network, Internet(Profile C)
Lower quality video and VoIP, signaling, transaction data (highly interactive)
Separate queue, drop priority
Constrained routing and distance
Transaction data, interactive
Less constrained routing and distances
Short transactions, bulk data (low loss)
Long queue, drop priority
Any route/path
Traditional Internet applications (default IP networks)
Separate queue (lowest priority)
Any route/path

Analyze Assure Accelerate
ITU-T G.1050 and TIA-921 Test Profiles based on ITU-T Y1541
Different test profiles for different Service Level Agreements (SLAs)
Impairment Type Units Range (min to max)
One Way Latency ms 20 to 100 (regional) 20 to 300 (intercontinental)
Jitter (peak to peak) ms 0 to 50
Sequential Packet Loss ms Random loss only (except when link failure occurs)
Rate of Sequential Loss sec-1 Random loss only (except when link failure occurs)
Random Packet Loss % 0 to 0.05
Reordered Packets % 0 to 0.001
Profile A – Well-Managed Network Impairment Ranges • Y.1541 QoS Level – suitable for high quality video and VoIP• Most Service Providers will be supporting this SLA for IPTV

Analyze Assure Accelerate
ITU-T G.1050 and TIA-921 Test Profiles based on ITU-T Y1541
Different test profiles for different Service Level Agreements (SLAs)
Impairment Type Units Range (min to max)
One Way Latency ms 50 to 200 (regional)50 to 400 (intercontinental)
Jitter (peak to peak) ms 0 to 150
Sequential Packet Loss ms 40 to 200
Rate of Sequential Loss sec-1 < 10-3
Random Packet Loss % 0 to 2
Reordered Packets % 0 to 0.01
Profile B – Partially-Managed Network Impairment Ranges •Y.1541 QoS Level – suitable for Lower quality video and VoIP

Analyze Assure Accelerate
ITU-T G.1050 and TIA-921 Test Profiles based on ITU-T Y1541
Different test profiles for different Service Level Agreements (SLAs)
Impairment Type Units Range (min to max)
One Way Latency ms 50 to 800
Jitter (peak to peak) ms 0 to 500
Sequential Packet Loss ms 40 to 10,000
Rate of Sequential Loss sec-1 < 10-1
Random Packet Loss % 0 to 20
Reordered Packets % 0 to 0.1
Profile C – Un-Managed Network Impairment Ranges •Y.1541 QoS Level – Internet little or no guarantees

Analyze Assure Accelerate
ITU-T G.1050 and TIA-921 8 Impairment Severity Combinations
Table 10: Impairment Severity Combinations
Table 10: Impairment Severity Combinations
Severity=> A B C D E F G H*
Impairment Units
Profie A LOO % 50 30 15 5 0 0 0 0
Profile B LOO % 5 25 30 25 10 5 0 0
Profile C LOO % 5 5 10 15 20 25 15 5
Source Location (A) Parameters
LAN A Occupancy % 1 2 3 5 8 12 16 20
Access A Occupancy % 0 1 2 4 8 15 30 50
MTU A bytes 512 512 1508 1508 1508 1508 1508 1508
Core Network Impairments
Route flap interval seconds 0 3600 1800 900 480 240 120 60
Route flap delay ms 0 2 4 8 16 32 64 128
Delay ms 4 8 16 32 64 128 256 512
Jitter (peak to peak) ms 5 10 24 40 70 100 150 500
Link fail interval seconds 0 3600 1800 900 480 240 120 60
Link fail duration ms 0 64 128 256 400 800 1600 3000
Packet loss % 0 0.01 0.02 0.04 0.1 0.2 0.5 1
Reordered packets % 0 0.00025 0.0005 0.001 0.005 0.01 0.05 0.1
Destination Location (B) Parameters
Access B Occupancy % 0 1 2 4 8 15 30 50
MTU B bytes 512 512 1508 1508 1508 1508 1508 1508
LAN B Occupancy % 1 2 3 5 8 12 16 20
Analyze Assure Accelerate
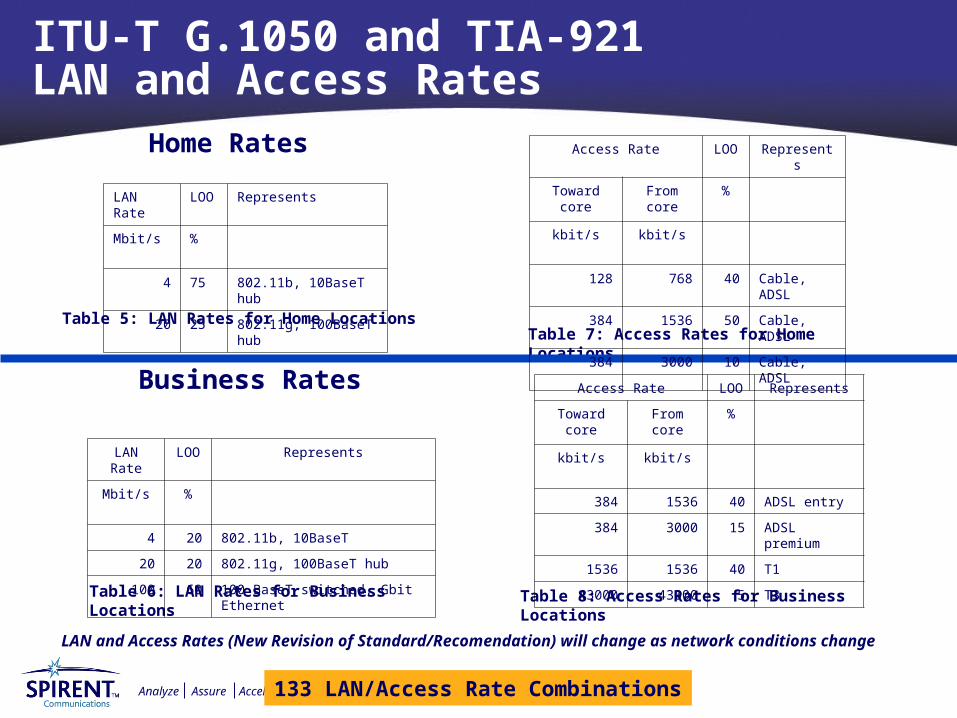
ITU-T G.1050 and TIA-921 LAN and Access Rates
Table 7: Access Rates for Home Locations
Table 8: Access Rates for Business LocationsTable 6: LAN Rates for Business Locations
Table 5: LAN Rates for Home Locations
133 LAN/Access Rate Combinations
Home Rates
Business Rates
LAN Rate LOO Represents
Mbit/s %
4 75 802.11b, 10BaseT hub
20 25 802.11g, 100BaseT hub
LAN Rate LOO Represents
Mbit/s %
4 20 802.11b, 10BaseT
20 20 802.11g, 100BaseT hub
100 60 100 BaseT switched, Gbit Ethernet
Access Rate LOO Represents
Toward core From core %
kbit/s kbit/s
128 768 40 Cable, ADSL
384 1536 50 Cable, ADSL
384 3000 10 Cable, ADSL
Access Rate LOO Represents
Toward core From core %
kbit/s kbit/s
384 1536 40 ADSL entry
384 3000 15 ADSL premium
1536 1536 40 T1
43000 43000 5 T3
LAN and Access Rates (New Revision of Standard/Recomendation) will change as network conditions change

Analyze Assure Accelerate
Impairment Characteristics
Good
Bad
Severe
1064 Impairment Combinatoins
Link Failure
Route Flap

Analyze Assure Accelerate
ITU-T G.1050 and TIA-921 Example of Network Model Coverage (NMC) Curve
ORVideo Quality may also be plotted

Analyze Assure Accelerate
ITU-T G.1050 and TIA-921 Example of Network Model Coverage (NMC) Curve
OR
Video Quality may also be plotted

Analyze Assure Accelerate
Analyze Assure Accelerate