
Healthy Weight in Women of Reproductive Age Action Learning Collaborative

SEDAR4-DW-17
Age, growth and reproductive biology of blueline tilefish
along the southeastern coast of the United States, 1982-99
Patrick J. Harris
David M. Wyanski
Paulette T. Powers
DRAFT
Marine Resources Research Institute
South Carolina Department of Natural Resources
P.O. Box 12559
Charleston, SC 29422
September 2003
Running title: Life history of blueline tilefish
Keywords: Caulolatilus, tilefish, Atlantic, fishery-independent, fishery-dependent, age, growth, reproduction,
maturity, spawning, fecundity
1

Abstract
DRAFT
The blueline tilefish, Caulolatilus microps, is a long-lived, slow-growing deepwater demersal species patchily
distributed along the outer continental shelf of North America from Cape Lookout, North Carolina, to Campeche
Bank, Mexico. Commercial landings of blueline tilefish for the southeastern United States peaked in 1983 at 530
MT, fell to 31 MT by 1985 and exceeded 100 MT only once between 1986 and 1999. Blueline tilefish were
collected during 1982-87 and 1996-99 with fishery-independent gear by the Marine Resources Monitoring,
Assessment and Prediction program, and whole tilefish were sampled from commercial catches off South Carolina
(approx. 320N to 330N) during 1996-98. Specimens were assigned an age from counts of increments on a transverse
section of the left sagitta. Sex and reproductive state of all individuals were determined from histological sections
of the gonad. The mean size of males was significantly larger than that of females (583 vs. 537 mm TL), and the
mean lengths of males and females showed significant declines between 1982-87 and 1996-99. The mean age of
males throughout the study period was 11.2 yr, compared to 15.2 yr for females. The mean ages of both males and
females showed significant decreases from 1982-87 to 1996-99 (15 to 8.6 yr for males; 17.7 to 11.2 yr for females).
Males were significantly larger than females for most ages sampled during 1982-87 (ages 6, 8-27, 31); however
during 1996-99 males were significantly larger than females for younger ages only (ages 5-14). The overall sex
ratio for blueline tilefish during 1982-87 was 1 male:2.12 females, significantly different from 1:1, whereas the
overall sex ratio during 1996-99 was 1 male: 0.85 female, not significantly different from 1:1. Extensive fishing
mortality, thereby cropping off the largest specimens (predominantly males), is a likely explanation for the
predominance of females in the 1980s. The shift to a predominance of males in the 1990s was the result of an
unknown factor(s), perhaps water temperature during an early life history stage, but not the result of decreased
fishing mortality because the mean size of fish decreased significantly between the 1980s and 1990s. Spawning
occurred during the evening from February through October in females and the gonadosomatic index reached a
peak in May. Spawning males were collected during January and March through October. Monthly estimates of
total fecundity and the lack of a size gap between stage-3 yolked oocytes and earlier stages of oocytes indicate that
annual fecundity is indeterminate. With an extended spawning season of approximately 240 days, a female could
spawn 144 times. Multiplying the number of spawning events by batch fecundity estimates for specimens 455-629
mm TL produced estimates of potential annual fecundity that ranged from 4,162,500 to 13,548,400 oocytes. The
loss of larger and older blueline tilefish from the population and the significant relationship between female size and
2

batch fecundity suggest that the fecundity of the population is currently much less now than it was during 1970s and
1980s.
DRAFT
3

The blueline tilefish, Caulolatilus microps, is a long-lived, slow-growing deepwater demersal species patchily
distributed along the outer continental shelf of North America from Cape Lookout, North Carolina, to Campeche
Bank, Mexico (Dooley 1978). Blueline tilefish appear to move little as adults and are found along the outer
continental shelf, shelf break, and upper slope on irregular bottom. Usual habitats are ledges or crevices and around
boulders or rubble piles at depths of 48-236 m, with temperatures ranging from 15 to 23oC (Struhsaker 1969; Ross
1978; Ross and Hunstman 1982; Parker and Mays 1998). Blueline tilefish have been observed hovering near or
entering burrows under rocks (Parker and Ross 1986), a characteristic associated with many malacanthids (Able et
al. 1982; Able et al. 1987; Baird and Baird 1992).
DRAFT
Commercial and recreational fisheries have harvested blueline tilefish, although only the commercial fishery
has reported significant catches since 1985 (Parker and Mays 1998). Blueline tilefish share their habitat with many
other deepwater species, including snowy grouper Epinephelus niveatus, red porgy Pagrus pagrus, vermilion
snapper Rhomboplites aurorubens, blackbelly rosefish Helicolenus dactylopterus, Warsaw grouper E. nigritus, and
yellowedge grouper E. flavolimbatus. Although recreational and commercial fisheries have extensively exploited
this deepwater community, these fisheries may have been targeting species other than blueline tilefish (Ross and
Huntsman 1982; Parker and Mays 1998). Commercial landings for blueline tilefish for North Carolina, South
Carolina, Georgia, and the east coast of Florida peaked in 1983 at 530 MT and fell to 31 MT by 1985 (Parker and
Mays 1998; NMFS Fish Statistics and Economic Division pers. comm.). Landings increased to 117 MT in 1992,
but were less than 50 MT by 1999 (NMFS Fish Statistics and Economic Division pers. comm.; Figure 1). Most
landings have been recorded in the Carolinas, averaging 87% per year since 1985.
Recent studies have attributed changes in life history patterns of deepwater reef fishes to increases in fishing
effort over the last three decades (Buxton 1993; Harris and McGovern 1997; Helser and Almeida 1997; Harris et al.
2001; Wyanski et al. 2000). The purpose of this study was to assess the age structure, growth, sex ratio, size and
age at maturity, spawning season, spawning frequency, and fecundity of the blueline tilefish population off South
Carolina during two periods (1982-87 and 1996-99) to determine if changes had occurred in the life history, and to
estimate annual fecundity. Updated life history data will assist the South Atlantic Fishery Management Council in
determining the status of blueline tilefish populations off the southeastern coast of the United States.
Methods
4

Sampling:
Blueline tilefish were collected during 1982-87 and 1996-99 with fishery-independent gear by the Marine
Resources Monitoring, Assessment and Prediction program (MARMAP) between 320N and 330N. In addition,
whole tilefish were sampled from commercial catches off South Carolina (approx. 320N to 330N) during 1996-98.
Samples were collected at the fish house and the entire catch of the vessel was sampled.
DRAFT
Blueline tilefish habitat was identified with electric snapper reels, bottom-longline gear (hereafter referred to as
longline gear) and bottom grab samples during research cruises conducted by MARMAP in 1980-81. During 1982-
87, MARMAP used electric snapper reels (1982-83), Kali poles (Russell et al., 1988) and longline gear to sample
blueline tilefish. Twenty Kali poles (5 hooks/pole; #6 and #7) were set over a bottom of rocky outcrops and soaked
for at least 90 minutes. Longlines of 100 tuna circle hooks (#5, #7 and #9) tied to gangions and placed at 3.7 m
intervals on 366 m of 6.4 mm solid braid dacron groundline were set over mud and sand bottom when bottom
temperatures exceeded 9°C. Each 100-hook set was buoyed to the surface with polypropylene line and retrieved
after 90 minutes.
During 1997-99, longlines of 100 tuna circle hooks (#5 and #7) tied to gangions placed at 12 m intervals on
1,219 m of galvanized cable groundline buoyed to the surface were used. Each 100-hook set was soaked for at least
90 minutes. A ‘short longline’, consisting of a 30 m groundline with 20 gangions (#5 and #7 tuna circle hooks)
spaced at 1.5 m intervals and 457 m of polypropylene buoyed to surface, was used to sample areas of rough bottom
and rocky outcrops at depths >80 m during 1996-99. Each short longline was also soaked for 90 minutes. Hooks of
Kali poles and all longlines were baited with squid. Some blueline tilefish were captured in Florida traps and
Chevron traps (see Harris and McGovern (1997) for methodology).
Total and fork lengths (TL and FL; mm) and total body weight (TBW; g) were measured for most specimens.
Sagittae were removed (only the left sagitta from commercial samples), fresh gonad weight (+1 g) was measured in
some specimens, and a posterior section of each gonad was preserved in 11% seawater formalin buffered with
marble chips for histological analysis. Only total lengths were recorded for blueline tilefish caught during 1982-83,
and otoliths were extracted and gonad samples taken from a random subsample of the catch. Samples of ovarian
tissue for fecundity analysis were collected during 1997-99. To reduce the amount of formalin used, ovaries were
not preserved whole. For each specimen, a longitudinal section of tissue from one ovarian lobe, representing the
anterior through posterior portions, was preserved in 10% seawater formalin.
5

Age and growth:
Sagittae were stored dry in coin envelopes; the left sagitta was used in age determination. Sagittae were
marked through the core along the dorsoventral axis and embedded in epoxy resin. A transverse section (0.7-1.0
mm thick) was made through the core with a Buehler Isomet low-speed saw. Sections were mounted on glass
slides with Accumount mounting medium and viewed under a dissecting microscope at 20-70X using transmitted
light. Increments (one translucent and one opaque zone) were counted independently by two readers without
knowledge of specimen length or date of capture. If counts differed, otoliths were reread by both readers
simultaneously and discarded from analyses if disagreements persisted.
DRAF Mean lengths, ages and observed lengths at age within each collection period (1982-87 and 1996-99) were
compared between sexes, gear type and data source using Student’s t-test and ANOVA. Based on the results of
these tests, data from all sources were then pooled for each period, and the same comparisons made between
periods. Von Bertalanffy growth curves were fit to weighted (1/n) mean observed lengths at age for male, female
and both sexes of blueline tilefish for each period and periods combined. T Reproduction:
Reproductive tissues were vacuum infiltrated and blocked in paraffin, and then sectioned (7 µm thickness) on a
rotary microtome. Three sections from each sample were placed on a glass slide, stained with double-strength Gill’s
hematoxylin and counter-stained with eosin Y. Sections were viewed under a compound microscope at 40-400X
and two readers independently assigned sex and reproductive state (Table 1) with criteria modified from Schmidt et
al. (1993) and Harris et al. (2001). Date of capture, specimen length, and specimen age were unknown to the
readers. If the assessments differed, the slide was viewed simultaneously by both readers and omitted from analyses
if disagreement persisted. Specimens with developing, ripe, spent, or resting gonads were considered sexually
mature. To ensure that females were correctly assigned to the immature and resting categories, the length-frequency
histogram of females that were definitely mature (i.e. those that were developing, ripe, or spent) was compared with
those of immature and resting females.
Spawning season for female tilefish was estimated based on the presence of hydrated oocytes and postovulatory
follicles (POFs). Because the rate of POF degradation is a function of water temperature, POFs were assigned
approximate ages according to the criteria developed by Hunter and Goldberg (1980) for northern anchovy
Engraulis mordax. Blueline tilefish spawn in slope waters with summer bottom temperatures that average 13.7 oC
6

(range = 8.5-20.8 oC; Mathews and Pashuk 1986), similar to the temperatures (13-19 oC) at which northern anchovy
spawn (Hunter and Macewicz 1985). A female gonadosomatic index (GSI) was calculated to quantify the
reproductive cycle (GSI = (ovary weight/TBW) *100) (Nikolsky 1963). Sex ratios (male:female) were examined
for each period and size and age class with a chi-square goodness of fit test to determine if the ratios differed from
the expected 1:1. A comparison was made only if the expected frequency was > 5.
Fecundity:
Definitions of total fecundity, batch fecundity, determinate fecundity, and indeterminate fecundity followed
Hunter et al. (1992). In the present study, potential annual fecundity represented the number of hydrated oocytes
matured per year, uncorrected for atretic losses.
Total fecundity: Standing stock of stage-3 yolked oocytes.
DRAFT Batch fecundity: Number of hydrated oocytes released in one spawning event.
Determinate fecundity: When potential annual fecundity is fixed prior to the spawning season.
Indeterminate fecundity: When potential annual fecundity is not fixed prior to the spawning season.
Three stages of yolked (vitellogenic) oocytes, migratory nucleus (MN) oocytes, hydrated oocytes, and atretic
oocytes (sensu Hunter et al. 1992) were identified in samples from formalin-preserved gonads. Oocyte size
distributions from eight specimens were used to elucidate temporal patterns in oocyte development. The average
radius of each oocyte in a subsample of 300-700 whole oocytes was measured with Global Lab Image® software
and then doubled to get diameter.
Densities of hydrated and MN oocytes combined from three locations (anterior, middle, and posterior) in the
left ovaries of nine fish without evidence of ovulation were compared to determine if oocytes were randomly
distributed. Two 75 mg samples of ovarian tissue, each consisting of 50-150 MN oocytes and hydrated oocytes,
were taken per specimen. The effects of location and individual fish on density were assessed with a two-factor
ANOVA.
We used the gravimetric method to estimate total fecundity and batch fecundity. To estimate total fecundity,
two 25 mg samples were taken from random locations in 39 ovaries, most (n = 34) of which were in a developing
stage (Table 1), and all stage-3 yolked oocytes were counted. In five specimens, vitellogenic oocytes and a partial
batch of hydrated oocytes, the result of ongoing ovulation, were present. Total fecundity (TF) was calculated as
(see Hunter et al. 1992):
7

TF = preserved ovary wt (g) * oocyte density (no. of stage 3 oocytes/sample wt (g)).
Because we did not preserve whole ovaries, fresh gonad weight was converted to preserved weight with regression
equations for developing and ripe reproductive states in scamp Mycteroperca phenax.
Preserved wt (g) = fresh wt (g)*0.966 –1.860 (Developing, fresh wt = 17-59 g, n = 10, adj. r2 = 0.992)
Preserved wt (g) = fresh wt (g)*0.897+1.148 (Ripe, fresh wt = 42-309 g, n = 19, adj. r2 = 0.994)
The relationship between total fecundity and TL was described for three time intervals (April, July-August, and
September-October) and the effect of time interval on total fecundity was examined using least squares linear
regression and analysis of covariance (ANCOVA).
DRAFT
Blueline tilefish exhibited evidence of indeterminate fecundity; therefore, batch fecundity and spawning
frequency were estimated to calculate potential annual fecundity. The hydrated oocyte method of Hunter et al.
(1985) was generally followed to estimate batch fecundity; modifications were use of a larger sample weight and
immersion of samples in a 1-5% formalin solution to enumerate and measure oocytes. Two 35-75 mg samples were
taken from random locations in the ovaries of 38 fishery-dependent specimens collected during 1997-98. MN
oocytes and hydrated oocytes were counted; both stages were present in 9 of 38 specimens.
We obtained three estimates of spawning frequency based on histological criteria (presence of MN or hydrated
oocytes, < 24 h old POFs, and 24 to < 48 h old POFs) that indicate imminent or recent spawning. Our methods of
estimating spawning frequency followed those of Hunter and Goldberg (1980). All females in fishery-dependent
samples from 1996-98 that were reproductively active (vitellogenic oocytes present, developing and ripe
reproductive states) were examined for evidence of spawning. Two or three of the spawning criteria were present in
the majority of specimens with histological evidence of spawning. Spawning frequency was based on the
proportion of specimens with each criterion among reproductively active females. The three estimates of spawning
frequency were averaged (see Fitzhugh et al. 1993) and the average was multiplied by the number of days in the
spawning season to determine the number of spawning events in that season (see Cuellar et al. 1996). To calculate
potential annual fecundity, batch fecundity was multiplied by the number of spawning events. All statistical tests
were conducted with SAS (SAS Institute, Inc. 1989), and the results were considered significant at P <0.05
Results
Sampling:
8

DRAFT
A total of 1,451 (820 in 1982-87; 631 in 1996-99) blueline tilefish were sampled; most (65%) specimens taken
during 1982-87 were from fishery-independent sampling, whereas during 1996-99 most (89%) were from fishery-
dependent sampling (Table 2). There were no significant differences in the mean age, mean length or length at age
of males or females sampled using different gear types, or from fishery-dependent and fishery-independent sources
when compared within a time period. Data were thereafter pooled by period for all analyses. Length frequencies of
male and female blueline tilefish were significantly different in the two periods (Kolmogorov-Smirnov test;
P<0.001), with a shift to smaller fish evident for both sexes (Figure 2). The TL of fish sampled during 1982-87
decreased significantly from 591 mm (SD=79 mm; N= 816; range 334-784 mm) to 524 mm during 1996-99 (SD=72
mm; n=628; range 333-734 mm)(P<0.0001; t=16.68; df=1,442). The mean TL of males sampled during the study
period was significantly larger than that of females (583 vs. 537 mm; P<0.0001; t=1.48; df=911; unequal variances;
Figure 2) and the mean TL of both males and females showed significant declines from 1982-87 to 1996-99 (males
– 653 vs. 538 mm; females – 559 vs. 500 mm; P<0.001).
Age and Growth:
Only 923 of the 1,451 blueline tilefish sampled were successfully aged and initial agreement between readers
was only 24%, although there was 64% agreement within two years. Age frequencies of males and females were
significantly different between the two time periods sampled (Kolmogorov-Smirnov test; P<0.001), with a shift to
younger fish evident for both sexes (Figure 3). The mean age decreased significantly from 16.9 yr (SD 7.9 yr;
range 3-43; n=519) during 1982-87 to 10 yr (SD 5.8 yr; range 3-40; N=404) during 1996-99 (P<0.0001, t=16.68).
Mean TL of males was always than that of females, yet mean age of males (11.2 yr) was younger than females (15.2
yr) and each sex showed significant decreases from 1982-87 to 1996-99 (15 to 8.6 for males; 17.7 to 11.2 for
females; P<0.001). Males were significantly larger than females for most ages sampled during 1982-87 (ages 6, 8-
27, 31: P<0.01); however, during 1996-99 males were significantly larger than females for younger ages only (ages
5-14; P<0.01; Figure 4). This change was the result of the decrease in length at age of male blueline fish from
1982-87 to 1996-99, which was significant for ages 8, 9, 13, 14 and 16 (P<0.01), while the lengths at age of females
between the two sampling periods did not show any significant differences. The power of some of these tests
would be low, however, due to the relatively small sample size of fish in each age class.
Von Bertalanffy growth parameters (Table 3) showed considerable differences, depending on the data used to
fit the curve, with Linf ranging from a low of 633 mm TL (females, both periods) to a high of 1,088 mm TL (males,
9

1996-99). Although values for K showed similar variability, values are uniformly low, confirming a slow growing
species.
Reproduction:
The overall sex ratio for blueline tilefish sampled during 1982-87 was 1 male: 2.12 females, significantly
different from 1:1 (Table 4). Females were also more abundant at TL <650 mm and the sex ratio was significantly
different from 1:1 in size classes between 451 and 650 mm TL. At TL >650 mm, males were more abundant and
there was a significant difference from a 1:1 ratio in TL classes between 651 and 750 mm (Table 4).
DRAFT
The overall sex ratio for blueline tilefish sampled during 1996-99 was 1 male: 0.85 female, not significantly
different from 1:1 (Table 4). Females were more abundant at TL <450 mm and the sex ratio was significantly
different from a 1:1 ratio in TL classes between 351 and 450 mm. At TL >450 mm, males were more abundant and
there was a significant difference from a 1:1 ratio in TL classes between 501 and 650 mm (Table 4).
Sex ratio at age indicates that males have increased in abundance relative to females for almost all age classes
(Table 5). During 1982-87, age-specific sex ratios favored males for 8-year old fish only, whereas in 1996-99,
males were dominant in all age classes except 9, 12, and 15+ (Table 5). The sex ratio of blueline tilefish aged 15
and older changed very little between 1982-87 and 1996-99, although the number of individuals aged 15 and older
decreased considerably. No chi-square analyses were attempted for age-based sex ratios due to the large number of
cells with a sample size smaller than 5.
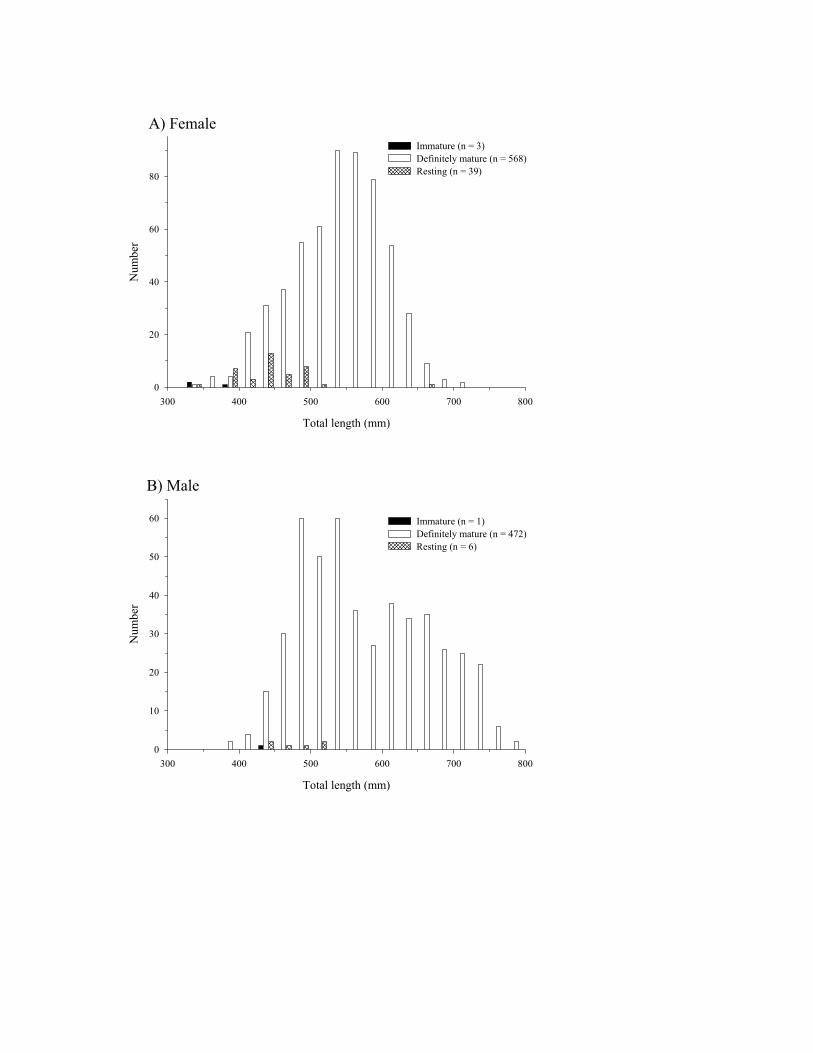
The near or complete overlap in the left tail of length histograms for specimens that were definitely mature and
specimens that were resting and the minimal overlap in the histograms for immature and resting specimens indicated
that reproductive tissue was correctly assigned to the immature and resting categories for females (Figure 6a) and
males (Figure 6b). Only four (3 female and 1 male) immature blueline tilefish were sampled (Figure 6). Immature
females were age 3 (336 mm TL) and age 6 (333 mm TL and 387 mm TL), and the smallest mature female was age
4 (338 mm TL). An age could not be assigned to the only immature male and the smallest mature male was 3 (393
mm TL). Fifty percent of females were mature at 326-350 mm TL (n=4), 100% at 351-375 mm TL (n=4), 92% at
376-400 mm TL, n=12), and 100% at larger sizes.
Based on the occurrence of hydrated oocytes and postovulatory follicles, spawning occurred from February
through October (Figure 7a). The spawning season may extend beyond October, but no specimens were collected
during November and December. Mean GSI values of females peaked in May and decreased progressively through
10

September (Figure 8). The prevalence of hydrated oocytes still surrounded by a follicle cell layer during daylight
hours indicated that blueline tilefish probably spawned in the evening (Figure 9). Spawning males were collected
during January and March through October (Figure 7b). Spawning females (n = 279) were captured on research
cruises off South Carolina (32o 04’ to 32o 52’ N) at depths of 48-232 m; only eight spawning females were captured
at depths <163 m. Approximate fishing locations provided by fishermen showed that spawning females sampled
from the commercial fishery (N = 77) were captured off South Carolina (32o 47’ to 32o 55’ N) at depths of 165-199
m.
Fecundity:
DRAFT
There was no significant difference in the density of hydrated and MN oocytes combined among three selected
locations in the ovaries of nine specimens (F=0.36, P=0.70, df=2), which indicated that samples for estimating total
fecundity and batch fecundity could be taken from any location without bias. Oocyte density ranged from 0.59 to
2.00 oocytes/mg of tissue.
Total fecundity as a function of total length was essentially constant throughout the spawning season (Figure
10), as the y-intercept did not decrease until September/October. The interaction term in an ANCOVA showed that
the slopes of the equations were not significantly different among months (F=0.41, P=0.6642, df=2; Table 6);
however, the intercept of the September/October equation was lower than those for April (P=0.0020) and
July/August (P=0.0522). Atretic oocytes were not prevalent.
Annual fecundity in blueline tilefish is indeterminate because total fecundity did not decrease until the end of
the spawning season and no size gap between stage-3 yolked oocytes and earlier stages of oocytes (Figure 11a)
developed at any time during the spawning season (Figure 11b-d). Continuous production of oocytes was also
evident in plots of oocyte-diameter frequency, as the percentage of stage-3 yolked oocytes did not progressively
decrease over time (Figure 11). That the percentage of MN oocytes and hydrated oocytes relative to stage-3 yolked
oocytes was small (8-18%) was evidence blueline tilefish are batch spawners.
Estimates of spawning frequency and batch fecundity, necessary to estimate potential annual fecundity, were
based on hydrated and MN oocytes because most fishery-independent sampling, and probably most commercial
fishing, occurred during daylight, which concurred with the time of hydration (Figure 9). The proportion of
specimens with hydrated or MN oocytes among females with oocytes undergoing vitellogenesis was similar in
fishery-dependent samples collected during 1996-98 (0.64; Table 7) and in all samples from 1980-99 (0.59; n=472).
11

One of the two proportions based on the occurrence of POFs (i.e. 24-48 h old) in 1996-98 matched the proportion
based on hydrated and MN oocytes (Table 7). The average of the three proportions based on 1996-1998 samples
was 0.56, which corresponded to a spawning periodicity of 1.8 days. With an extended spawning season of
approximately 240 days (March through October), an individual female could spawn 136 times. That blueline
tilefish have a high spawning frequency was evident in histological sections, which had criteria indicative of as
many as three batches of oocytes (i.e. MN or hydrated oocytes, < 24 h old POFs, and 24-48 h old POFs) in an
individual fish.
DRAFT
The relationships between batch fecundity and total length, fork length, whole body weight, and ovary-free
body weight were significant (Table 8). Batch fecundity was not regressed against age due to the low number of
specimens that were assigned an age (n=9). Batch fecundity as a function of TL did not differ among months, as
indicated by the lack of differences in slopes (F=0.16, P=0.856, df=2) and intercepts (F=2.39, P=0.107, df=2)
among months. Given the similarity of the monthly equations, data from all months were combined to estimate the
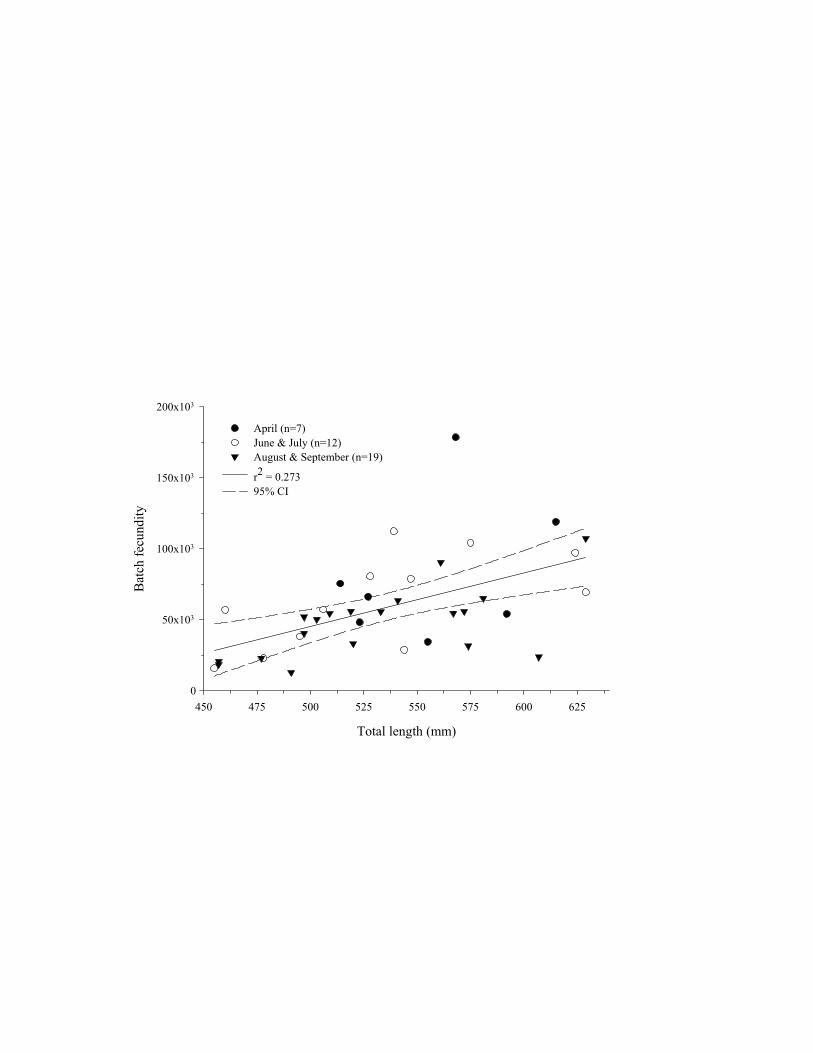
relationship between batch fecundity and total length (Figure 12). Batch fecundity ranged from 28,900 to 94,100
oocytes for specimens 455-629 mm TL. Multiplying the estimated number of spawning events (136) by batch
fecundity (BF) estimates (BF = -141537 + 374.6*TL; Table 8 and Figure 12) for blueline tilefish 455-629 mm TL
produced estimates of potential annual fecundity that ranged from 3,931,200 to 12,795,800 oocytes.
Discussion
Blueline tilefish have small otoliths that were difficult to age from sections. The otolith core was difficult
to identify clearly prior to sectioning, thus, many sections were off the core; however, even good sections are
difficult to age. We attempted to make all counts on the dorsal side of the otolith, but when patterns of increment
formation were observed some counts were made on the ventral side of the otolith, and some counts were made
using both sides. Frequently we observed a ‘group’ of increments with very narrow translucent and opaque zones,
separated from the next group by a larger translucent zone, particularly in the first few increments of older fish.
Increment grouping and tightly packed increments at the otolith edge of older fish, precluded validation of the
periodicity of increment formation. We counted each group of increments as a single increment and assumed that
our counts represent annual age and we have not assigned a birth date due to the uncertainty of the timing of
12

increment formation, although Ross and Huntsman (1982) used marginal increment analysis (whole otoliths) to
suggest the formation of one increment per year.
DRAFT
Other species in the deepwater species complex have age ranges similar to those we report, suggesting that
our estimated ages may be reasonable estimates of the real ages of the fish sampled (Turner et al., 1983; Harris and
Grossman, 1985; White et al., 1998; Wyanski et al., 2000). The increment groups observed during the first years of
growth may represent short term physical changes in the deepwater environment that are reflected in the growth of
blueline tilefish. For example, Low et al. (1983) reported low catch rates of tilefish (Lopholatilus
chamaeleonticeps) when bottom temperatures dropped below 9.50C. The decrease in catch rates could last for a
matter of hours or days, but would typically rebound almost as soon as bottom temperatures increased (G.F. Ulrich,
South Carolina Department of Natural Resources, personal communication.). We suggest the reduction in catch
rates is because tilefish do not feed at these low temperatures. If this is true for blueline tilefish, short periods of no
feeding may be reflected by the development of thin opaque zones on the otolith, as otolith growth does not
necessarily cease if fish growth ceases, i.e. otolith growth and somatic growth are uncoupled for a brief period.
(Secor and Dean 1992). Alternating narrow opaque and translucent zones that have formed in response to such
short-term changes would only be apparent on the otolith during the first few years of life, when otolith growth is
rapid enough for these sub-annual increments to be detected. Although the sub-annual increments may be spawning
checks (Ross and Huntsman 1982) and form in response to the multiple spawning events of individuals throughout
the protracted spawning season, these would not be formed until age 3, the age of first spawning.
Although several gear types were used to capture the blueline tilefish sampled for our study, the limited
amount of blueline tilefish habitat along the southeast coast appears to have resulted in the same population of fish
being sampled, regardless of the gear type used. All gear types used very similar hook sizes (except traps, which
accounted for 71 fish) and were fished on the bottom or up to two meters off the bottom in similar locations,
suggesting the selectivity of the gears were similar. Comparisons between gear types provided no evidence to
suggest different selectivities among gear types within a period, although sample size may not be large enough to
detect biologically significant differences for fishery-independent longline; therefore, our samples probably provide
an accurate representation of the population available to fishing gear in the sampled locations during the two
periods.
13

Sexual dimorphism (i.e. males grow to larger sizes than females) was pronounced in the blueline tilefish
sampled, particularly during 1982-87. The reduction in sexual dimorphism in 1996-98 is due to the loss of larger
fish from the population, presumably a result of increased fishing mortality during the early 1980s. Since then,
fishing mortality has remained high enough to preclude the re-establishment of large males in the population. The
lack of change in the size at age of females, in spite of a reduction in the mean size and age of females sampled over
the study period confirms the size-selective nature of the fishery.
DRAFT
The ratio of males to females collected with rod and reel off North and South Carolina during 1972-77 was
not significantly different from 1:1, although males outnumbered females (Ross and Merriner 1983). In our study,
the ratio was highly skewed toward females during 1982-87 and slightly, albeit not significantly, skewed toward
males during 1996-99. While it is possible these differences were due to gear selectivity, the range of lengths
sampled by Ross and Merriner (1983) and our study were similar. Extensive fishing mortality, thereby cropping off
the largest specimens (predominantly males), is a likely explanation for the shift in sex ratio toward females in
1982-87; however, another factor that should be investigated is the effect of water temperature on sex ratio during a
critical period in an early life history stage, particularly in reference to the increase in the abundance of males during
1996-99. A decrease in fishing mortality is not a likely cause for the greater abundance of males in the latter period
because a significant decrease in mean age for males indicates otherwise. In addition, a difference in sampling
depth is not a factor because 79-90% of the specimens from each period in the present study were collected at
depths of 160-190 m.
A review article by Devlin and Nagahama (2002) documents a growing body of evidence for
environmental effects (i.e. exogenous steroids, physical variables such as temperature, behavior, and pollution) on
sex determination in fishes. Experimental studies on diverse fishes (e.g. European eel Anguilla anguilla, Holmgren
(1996); Atlantic silverside Menidia menidia, Conover and Kynard 1981; and southern flounder Paralichthys
lethostigma, Lukenbach et al. 2003) have shown that incubation at higher temperatures increases the proportion of
males. We propose that temperature very likely affects the sex ratio of blueline tilefish, the larvae of which would
experience a wide range of temperature over an extended spawning season if they reside in surface waters of the
outer continental shelf and slope. Specimens of larval Caulolatilus sp. have been collect in surface waters off the
Atlantic coast (Ross 1978). To test hypotheses, the life history stage(s) at which temperature can affect sex
determination and the habitat of larvae and juveniles must be identified for blueline tilefish.
14

The changes in sex ratio may therefore reflect differences in population structure associated with depth, as well as
changes caused by increased fishing mortality. In an essentially unfished population (1972-77; Ross and Huntsman
1982; Ross and Merriner 1983), recreational fishermen captured smaller fish in shallower depths, and commercial
fishermen captured larger fish in deeper depths. We only sampled the deeper depths, and in 1982-87, captured only
the larger fish. However, by 1996-98, fishing mortality resulted in no record of capture of blueline tilefish in the
shallower recreational fishery after 1990 (Parker and Mays 1998) and a shift to smaller fish in the deeper waters
where larger fish had been removed.
DRAFT
The increase in the number of small mature males could be exacerbated by territoriality, as documented for
several species of tilefish (Baird, 1988; Grimes et al., 1988; Grimes and Turner 1999) since blueline tilefish occupy
burrows in a similar fashion to tilefish (Able et al. 1987). The removal of large males from the population may have
opened up territories to smaller mature males (satellite males) which were previously unable to occupy or maintain
burrows, as has been observed for sand tilefish (Baird 1988). A similar hypothesis was suggested for tilefish where
a group of mature, but non-spawning, satellite males and females appeared to be available to occupy territories of
individuals that may have been harvested (Harris et al. 2001). Baird (1988) reported that juvenile sand tilefish were
always associated with colonies of mature individuals and that colonies of entirely juvenile individuals were never
observed, perhaps owing to the limited habitat available to sand tilefish. Therefore, it is impossible to determine if
the satellite males were immature or mature prior to occupying a burrow.
We had insufficient immature specimens (n=4) to estimate TL at 50% maturity for either sex. The size of
mature females in our study generally agreed with the macroscopic maturity analysis done by Ross and Merriner
(1983; one of five females mature at 376-400 mm TL). We only collected six mature females <375 mm TL. Male
gonads were small and required the use of histological techniques to accurately assess their maturity. Ross and
Merriner (1983) found spermatogenesis and collections of spermatozoa in histological sections of testes from males
(390-500 mm TL; n = 11) that they assessed as immature macroscopically. In our collections, nearly all (117 of
118) males 385-500 mm TL (age range) were mature. Females reached maturity as early as age 3 in both studies,
but the oldest immature females in our study were age 6 versus age 5 in Ross and Merriner (1983).
We found evidence of spawning in blueline tilefish off the Carolinas from February through October,
which is in general agreement with the results of Ross and Merriner (1983), but we lacked samples from November
and December. GSI in both sexes and percentage of ripe females off North Carolina (Ross and Merriner 1983)
15

exhibited a primary peak in May and a smaller peak in September, but monthly sample sizes were typically less than
20 specimens. With larger sample sizes in our study, the GSI for females off South Carolina exhibited only a May
peak (Figure 8). No spawning peaks were evident in the histological data.
We found that oocyte densities were similar among three tested locations in ovaries of blueline tilefish,
which concurs with the finding of Ross (1978). We agree with Ross and Merriner (1983) that blueline tilefish are
multiple spawners because oocyte diameter frequency distributions have > 2 modes of oocytes that are developing
and the percentage of MN oocytes and hydrated oocytes relative to stage-3 yolked oocytes was <20%.
DRAFT
Annual fecundity in blueline tilefish is indeterminate because total fecundity does not decrease until the
end of the spawning season, and a gap in size between stage-3 yolked oocytes and earlier stages of oocytes does not
develop. Our estimates of total fecundity are one-third to one-half of the “fecundity” estimates of Ross and
Merriner (1983) for three similar time intervals because they counted early yolked to hydrated oocytes, whereas our
total fecundity estimates are based on only stage-3 yolked oocytes. Although the total fecundity estimates are
different, there is a noticeable decrease in total fecundity at the end of the spawning season in both studies. Until the
development of the concepts of determinate fecundity and indeterminate fecundity by Hunter et al. (1992), many
investigators assumed that total fecundity represented the annual production of oocytes, even in non-temperate fish
species. We found that blueline tilefish have indeterminate fecundity and used estimates of spawning frequency and
batch fecundity (batch size) to estimate potential annual fecundity as per the methods of Hunter et al. (1992). Our
estimate could be improved by the addition of small and large specimens.
Loss of larger and older blueline tilefish from the population and the significant relationship between female
size and batch fecundity suggest that the fecundity of the population is considerably less now than it was during
1972-77 and 1982-87. Environmental variables (e.g. temperature) could exacerbate the loss of female reproductive
potential in the population by causing fewer fish to differentiate into females. Nevertheless, blueline tilefish may be
more resilient to the relatively high levels of fishing mortality than tilefish because the fishery is not harvesting
immature individuals, and a high number of egg batches are released during a spawning season. Currently, the
fishery appears to maintaining a sustainable harvest. The degree to which blueline tilefish and tilefish share habitat
is uncertain, although it is known that the two species co-occur, and have been observed in the same burrow (Able
et al., 1987). Although the population appears to have recovered in size (as reflected by a slight increase in
landings) somewhat since the peak in landings in 1983, some of the recovery may have occurred as blueline tilefish
16

occupied territories previously occupied by tilefish, which is still considered severely overfished. Therefore, any
recovery of tilefish may negatively impact blueline tilefish. As the management of this deepwater complex
develops, all species must be closely monitored to ascertain how each is impacted by any management measures
that may be implemented.
Acknowledgments
DRAFT
We thank the late Captain J. Dickie Skipper, III, of Southport NC, for catching the specimens we needed in
1997-98, D. Codella of the National Marine Fisheries Service for providing additional samples, K. Grimball and J.
Burgos for preparing otolith and histological sections, and O. Pashuk for examining histological sections. We are
grateful to all members of MARMAP for their efforts to make those long drives to port-sample fish in North
Carolina and to the crews of the R/V Oregon and R/V Palmetto for their assistance in the collection of samples at
sea. C. Jackson and T. Prince of the Southport Fish Market allowed us to process specimens at their business. The
comments of four anonymous reviewers helped to significantly improve the manuscript. This work was funded by
the Marine Resources Monitoring, Assessment, and Prediction (MARMAP) Program contract (No.
50WCNF606013) sponsored by the National Marine Fisheries Service (Southeast Fisheries Center) and the South
Carolina Department of Natural Resources. This is contribution number XXX of the South Carolina Marine
Resources Center, P.O. Box 12559, Charleston, SC 29422.
17

References Able, K. W., C. B. Grimes, R. A. Cooper, and J. R. Usmann. 1982. Burrow construction and behaviour of tilefish,
Lopholatilus chamaleonticeps, in Hudson submarine canyon. Environmental Biology of Fish. 7:199-205
Able, K. W., D. C. Twichell, C. B. Grimes, and R. S. Jones. 1987. Tilefishes of the genus Caulotilus construct
burrows in the sea floor. Bulletin of Marine Science. 40:1-10.
Baird, T. A. 1988. Female and male territoriality and mating system of the sand tilefish, Malacanthus plumieri.
Environmental Biology of Fish. 22:101-116.
DRAFT Baird, T. A., and T. D. Baird. 1992. Colony formation and some possible benefits and costs of gregarious living in
the territorial sand tilefish, Malacanthus plumieri. Bulletin of Marine Science. 50:56-65.
Buxton, C. D. 1993. Life-history changes in exploited reef fishes on the east coast of South Africa. Environmental
Biology of Fish. 36:47-63.
Conover, D.O., and B.E. Kynard. 1981. Environmental sex determination: Interaction of temperature and
genotype in a fish. Science 213:577-579.
Cuellar, N., G.R. Sedberry, and D.M. Wyanski. 1996. Reproductive seasonality, maturation, fecundity, and
spawning frequency of the vermilion snapper, Rhomboplites aurorubens, off the southeastern United
States. Fishery Bulletin 94:635-653.
Dooley, J.K. 1978. Systematic revision and comparative biology of the tilefishes (Perciformes: Branchiostegidae
and Malacanthidae. Doctoral dissertation, University of North Carolina, Chapel Hill, USA.
Devlin, R.H., and Y. Nagahama. 2002. Sex determination and sex differentiation in fish: an overview of genetic,
physiological, and environmental influences. Aquaculture 208:191-364.
18

Erickson, D.L. and G.D. Grossman. 1986. Reproductive demography of tilefish from the South Atlantic Bight with
a test for the presence of protogynous hermaphroditism. Transactions of the American Fisheries Society.
115:279-285.
Fitzhugh, G.R., B.A. Thompson, and T.G. Snider III. 1993. Ovarian development, fecundity, and spawning
frequency of black drum Pogonias cromis in Louisiana. Fishery Bulletin 91:244-253.
DRAFT
Grimes, C. B., C. F. Idelberger, K. W. Able, and S. C. Turner. 1988. The reproductive biology of tilefish,
Lopholatilus chamaeleonticeps Goode and Bean, fron the United States Mid-Atlantic Bight, and the effects
of fishing on the breeding system. Fishery Bulletin. 86:745-762.
Grimes, C. B., and S. C. Turner. 1999. The complex life history of tilefish Lopholatilus chamaleoniticeps and
vulnerability to exploitation. American Fisheries Society Symposium. 23:17-26.
Harris, M. J., and G. D. Grossman 1985. Growth, mortality, and age composition of a lightly exploited tilefish
substock of Georgia. Transactions of the American Fisheries Society. 114:837-846.
Harris, P. J., S. M. Padgett, and P. T. Powers. 2001. Exploitation-related changes in the growth and reproduction of
tilefish and the implications for the management of deepwater fisheries. American Fisheries Society
Symposium. 25:155-210.
Harris, P.J. and J.C. McGovern. 1997. Changes in the life history of red porgy, Pagrus pagrus, from the
southeastern United States, 1972-1974. Fishery Bulletin. 95:732-747.
Helser, T.E. and F.P Almeida. 1997. Density-dependent growth and sexual maturity of silver hake in the north-
west Atlantic. Journal of Fish Biology. 51:607-623.
19

Holmgren, K. 1996. Effect of water temperature and growth variation on the sex ratio of experimentally reared
eels. Ecology of Freshwater Fish 5:203-212.
Hunter, J.R., and S.R. Goldberg. 1980. Spawning incidence and batch fecundity in northern anchovy, Engraulis
mordax. Fishery Bulletin. 77:641-652.
Hunter, J.R., N.C.H. Lo, and R.J.H. Leong. 1985. Batch fecundity in multiple spawning fishes. In R. Lasker (ed.),
An egg production method for estimating spawning biomass of pelagic fish: application to the northern
anchovy, Engraulis mordax, p. 67-77. NOAA Technical Report NMFS 36.
DRAFT Hunter, J.R., and B.J. Macewicz. 1985. Measurement of spawning frequency in multiple spawning fishes. In R.
Lasker (ed.), An egg production method for estimating spawning biomass of pelagic fish: application to the
northern anchovy, Engraulis mordax, p. 79-94. NOAA Technical Report NMFS 36.
Hunter, J.R., B.J. Macewicz, N.C.H. Lo, and C.A. Kimbrell. 1992. Fecundity, spawning, and maturity of female
Dover sole Microstomus pacificus, with an evaluation of assumptions and precision. Fishery Bulletin.
90:101-128.
Low, R. A., Jr., G. F. Ulrich, and F. Blum. 1983. Tilefish of South Carolina and Georgia. Marine Fisheries Review.
45:16-26.
Luckenbach, J.A., J. Godwin, H.V. Daniels, and R.J. Borski. 2003. Gonadal differentiation and effects of
temperature on sex determination in southern flounder (Paralichthys lethostigma). Aquaculture 216:315-
327.
Mathews, T.D., and O. Pashuk. 1986. Summer and winter hydrography of the U.S. South Atlantic Bight (1973-
1979). Journal of Coastal Research. 2:311-336.
20

Nikolsky, G.V. 1963. The ecology of fishes. Academic Press, New York.
Parker Jr, R.O. and J.L. Ross. 1986. Observing reef fishes from submersibles off North Carolina. Northeast Gulf
Science. 8:31-49.
Parker Jr, R.O. and R.W. Mays. 1998. Southeastern U.S. deepwater reef fish assemblages, habitat characteristics,
catches, and life history summaries. NOAA Technical Report NMFS 138.
Ross, J.L. 1978. Life history aspects of the gray tilefish Caulolatilus microps (Goode and Bean, 1878). Master’s
Thesis, College of William and Mary, Williamsburg, VA, 125 p.
DRAFT Ross, J.L. and G.R. Huntsman. 1982. Age, growth, and mortality of blueline tilefish from North Carolina and
South Carolina. Transactions of the American Fisheries Society. 111:585-592.
Ross, J.L., and J.V. Merriner. 1983. Reproductive biology of the blueline tilefish, Caulolatilus microps, off North
Carolina and South Carolina. Fishery Bulletin. 81:553-568.
Russell, G.M., E.J. Gutherz, and C.A. Barans. 1988. Evaluation of demersal longline gear off South Carolina and
Puerto Rico with emphasis on deepwater reef fish stocks. Marine Fisheries Review. 50:26-31.
SAS Institute Inc. 1989. SAS/STAT User's guide, Version 6, Fourth Edition Volume 2, Cary, NC: SAS Institute
Inc., 1989.
Schmidt, D.J., M.R. Collins, and D.M. Wyanski. 1993. Age, growth, maturity, and spawning of spanish mackerel,
Scomberomorus maculatus (Mitchill), from the Atlantic Coast of the southeastern Untited States. Fishery
Bulletin. 91:526-533.
21

Secor, D.H. and J.M. Dean. 1992. Comparison of otolith-based back-calculation methods to determine individual
growth histories of larval striped bass, Morone saxatilis. Canadian Journal of Fisheries and Aquatic
Sciences. 49:1439-1454.
Struhsaker, P. 1969. Demersal fish resources: composition, distribution, and commercial potential of the
continental shelf stocks off the southeastern United States. Fishery Industrial Research 4:261-300
Turner, S. C., C. B. Grimes, and K. W. Able 1983. Growth, mortality, and age/size structure of the fisheries for
tilefish, Lopholatilus chamaelonticeps, in the middle Atlantic-southern New England region. Fishery
Bulletin. 81:751-763.
DRAFT White, D. B., D. M. Wyanski, and G. R. Sedberry 1998. Age, growth, and reproductive biology of the blackbelly
rosefish from the Carolinas, U.S.A. Journal of Fishery Biology. 53:1274-1291.
Wyanski D.M., D.B. White and C.A. Barans. 2000. Growth, population age structure, and aspects of the
reproductive biology of snowy grouper, Epinephelus niveatus, off North Carolina and South Carolina.
Fishery Bulletin. 98:199-218.
22
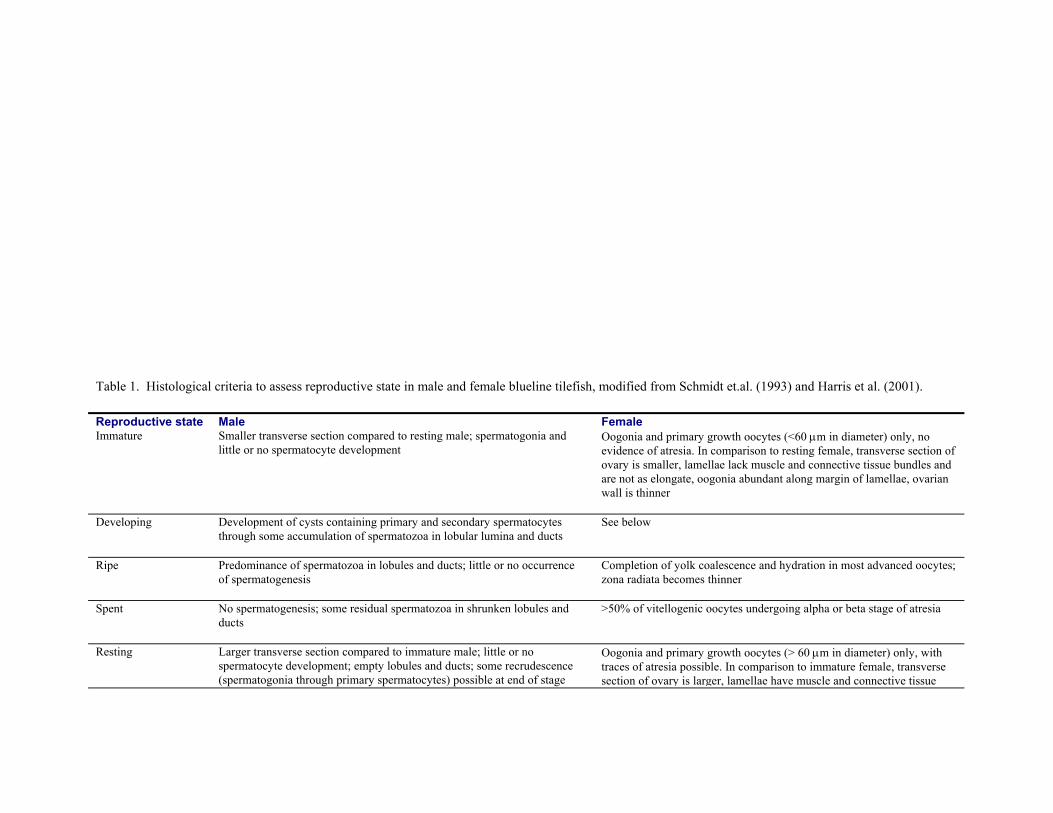
Table 1. Histological criteria to assess reproductive state in male and female blueline tilefish, modified from Schmidt et.al. (1993) and Harris et al. (2001).
Reproductive state Male Female Immature Smaller transverse section compared to resting male; spermatogonia and
little or no spermatocyte development Oogonia and primary growth oocytes (<60 µm in diameter) only, no evidence of atresia. In comparison to resting female, transverse section of ovary is smaller, lamellae lack muscle and connective tissue bundles and are not as elongate, oogonia abundant along margin of lamellae, ovarian wall is thinner
Developing Development of cysts containing primary and secondary spermatocytes through some accumulation of spermatozoa in lobular lumina and ducts
See below
Ripe Predominance of spermatozoa in lobules and ducts; little or no occurrence of spermatogenesis
Completion of yolk coalescence and hydration in most advanced oocytes; zona radiata becomes thinner
Spent No spermatogenesis; some residual spermatozoa in shrunken lobules and ducts
>50% of vitellogenic oocytes undergoing alpha or beta stage of atresia
Resting Larger transverse section compared to immature male; little or no spermatocyte development; empty lobules and ducts; some recrudescence (spermatogonia through primary spermatocytes) possible at end of stage
Oogonia and primary growth oocytes (> 60 µm in diameter) only, with traces of atresia possible. In comparison to immature female, transverse section of ovary is larger, lamellae have muscle and connective tissue

bundles, lamellae are more elongate and convoluted, oogonia less abundant along margin of lamellae, ovarian wall is thicker and exhibits varying degrees of expansion due to previous spawning
Developing, recent spawn
Vitellogenic oocytes predominant and POFs (postovulatory follicles) <24 hours old (sensu Hunter and Goldberg,1980)
Developing, recent spawn
Vitellogenic oocytes predominant and POFs ≥24 h but <48 h old (sensu Hunter and Goldberg, 1980)
Developing, recent spawn
Vitellogenic oocytes predominant and POFs >48 hours old
Early developing, cortical alveoli
Most advanced oocytes in cortical-alveoli stage
Developing, vitellogenesis
Most advanced oocytes in yolk-granule or yolk-globule stage
Final oocyte maturation
Most advanced oocytes in migratory-nucleus stage; partial coalescence of yolk globules possible
DRAFT

Table 2. Sample size by gear and period
Gear 1982-1987 1996-1999 Fishery-independent Fishery-dependent Fishery-independent Fishery-dependent
Hook & Line 39 283 0 4 Trap* 18 0 53 0
Kali Pole 391 0 0 0 Longline** 87 0 16 558
Trawl 0 2 0 0 Total 535 285 69 562
* - Chevron, Florida, and experimental traps ** - Horizontal longline and ‘short’ longline

Table 3. Von Bertalanffy parameters for growth curves fitted to weighted mean length at age for blueline
tilefish sampled during 1982-87 and 1996-99.
1982-1987 1996-1999 Periods combined L∞ K t0 N L∞ K t0 N L∞ K t0 N
Males 752 0.12 -4.83 104 1088 0.01 -35.6 201 758 0.1 -5.4 305 Females 633 0.12 -5.21 219 633 0.11 -4.94 172 634 0.11 -4.54 391
Sexes combined 645 0.17 -2.36 406 918 0.02 -37.6 400 671 0.08 -8.69 806
DRAFT
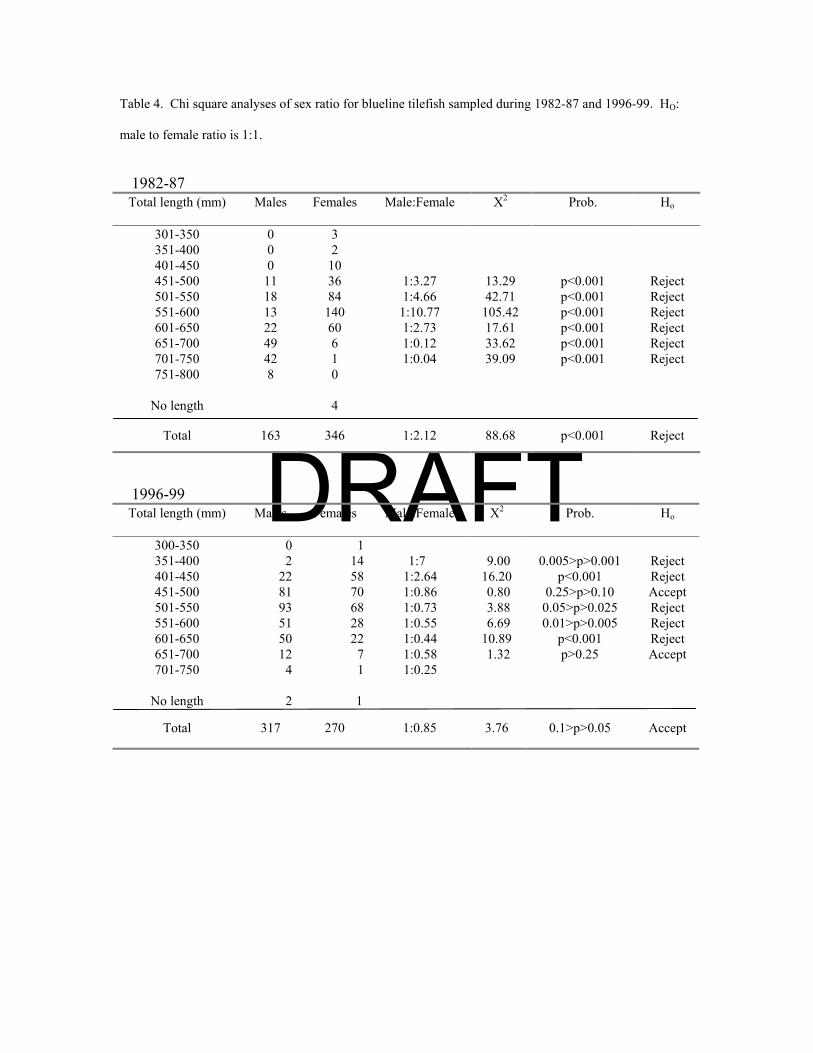
Table 4. Chi square analyses of sex ratio for blueline tilefish sampled during 1982-87 and 1996-99. HO:
male to female ratio is 1:1.
1982-87
DRAFT
Total length (mm) Males Females Male:Female X2 Prob. Ho
301-350 0 3 351-400 0 2 401-450 0 10 451-500 11 36 1:3.27 13.29 p<0.001 Reject 501-550 18 84 1:4.66 42.71 p<0.001 Reject 551-600 13 140 1:10.77 105.42 p<0.001 Reject 601-650 22 60 1:2.73 17.61 p<0.001 Reject 651-700 49 6 1:0.12 33.62 p<0.001 Reject 701-750 42 1 1:0.04 39.09 p<0.001 Reject 751-800 8 0
No length 4
Total 163 346 1:2.12 88.68 p<0.001 Reject
1996-99 Total length (mm) Males Females Male:Female X2 Prob. Ho
300-350 0 1 351-400 2 14 1:7 9.00 0.005>p>0.001 Reject 401-450 22 58 1:2.64 16.20 p<0.001 Reject 451-500 81 70 1:0.86 0.80 0.25>p>0.10 Accept 501-550 93 68 1:0.73 3.88 0.05>p>0.025 Reject 551-600 51 28 1:0.55 6.69 0.01>p>0.005 Reject 601-650 50 22 1:0.44 10.89 p<0.001 Reject 651-700 12 7 1:0.58 1.32 p>0.25 Accept 701-750 4 1 1:0.25
No length 2 1
Total 317 270 1:0.85 3.76 0.1>p>0.05 Accept

Table 5. Sex-ratio by age for blueline tilefish sampled during 1982-87 and 1996-99. Age class 15+
includes all specimens aged 15 and older.
DRAFT
Age 1982-87 1996-99
Male Female Male:Female Male Female Male:Female
4 1 2 1:2 8 3 1:0.38 5 4 4 1:1 30 21 1:0.7 6 5 8 1:1.6 33 20 1:0.61 7 3 10 1:3.33 23 13 1:0.57 8 10 8 1:0.8 26 12 1:0.46 9 9 13 1:1.44 14 19 1:1.36
10 8 12 1:1.50 14 13 1:0.93 11 9 15 1:1.67 15 12 1:0.8 12 10 17 1:1.7 8 14 1:1.75 13 8 11 1:1.38 8 8 1:1 14 12 17 1:1.42 5 4 1:0.8
15+ 54 171 1:3.17 12 35 1:2.92
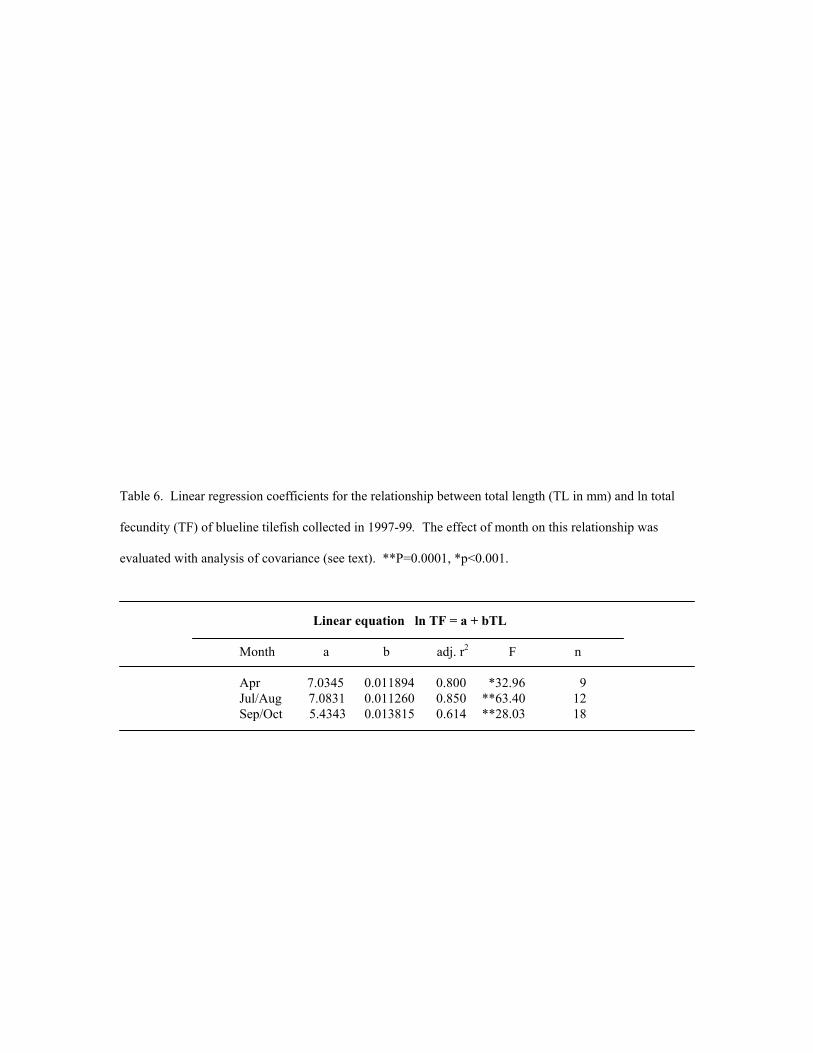
Table 6. Linear regression coefficients for the relationship between total length (TL in mm) and ln total
fecundity (TF) of blueline tilefish collected in 1997-99. The effect of month on this relationship was
evaluated with analysis of covariance (see text). **P=0.0001, *p<0.001.
Linear equation ln TF = a + bTL Month a b adj. r2 F n
Apr 7.0345 0.011894 0.800 *32.96 9 Jul/Aug 7.0831 0.011260 0.850 **63.40 12 Sep/Oct 5.4343 0.013815 0.614 **28.03 18

Table 7. Number of female blueline tilefish with hydrated oocytes or migratory nucleus (MN) oocytes, < 24 h old
postovulatory follicles (POFs), and 24 to < 48 h old POFs, and total number of mature females with
vitellogenic oocytes in samples collected with bottom longlines on commercial vessels during 1996-98.
The proportions were averaged to estimate spawning frequency.
Date
No. with hydrated or MN Oocytes
No. with < 24 h old POFs
No. with 24-48 h old POFs
Total mature females
April 40 17 24 53 May - - - - June 17 16 19 25 July 22 15 26 32
August 4 10 14 22 September 17 7 17 25
Total 100 65 100 157
Proportion of
total 0.637 0.414 0.637


Table 8. Linear regression coefficients for the relationship between batch fecundity (BF; number of hydrated and migratory nucleus
oocytes) and total length (mm), fork length (mm), whole weight (g) and ovary-free weight (g) in blueline tilefish from
fishery-dependent collections. Specimens were collected during April through October in 1997-98.
** P <0.0001 and *P<0.001.
Linear equation BF = a + bX
X a 95% CI b 95% CI Adjusted r2 F N Range
Total length -141537 10599 374.6 196.9 0.273 *14.88 38 455-629 mm Fork length -138508 105847 392.4 209.1 0.267 *14.48 38 429-591 mm
Whole weight -12488 32904 40.2 17.7 0.353 **21.17 38 930-2880 g Ovary-free weight -10957 33987 40.8 19.0 0.327 *18.96 38 892-2732 g


Figure legends Figure 1. Commercial landings of blueline tilefish for the US southeast Atlantic, 1985-1999.
Figure 2. Sex specific length-frequency of blueline tilefish sampled from fishery-dependent and fishery-
independent sources during 1982-87 and 1996-99.
Figure 3. Sex specific age-frequency of blueline tilefish sampled from fishery-dependent and fishery independent
sources during 1982-87 and 1996-99.
Figure 4. Mean length at age for male and female blueline tilefish sampled during 1982-87 and 1996-99. Error
bars represent one standard error.
Figure 5. A comparison of the mean length at age for male blueline tilefish sampled during 1982-87 and 1996-
99. Error bars represent one standard error.
Figure 6. Comparison of length frequencies of female (A) and male (B) blueline tilefish collected during 1980-
99 that were categorized as immature, definitely mature, or resting. Definitely mature specimens
were developing, ripe, or spent.
Figure 7. Reproductive states of female (A) and male (B) blueline tilefish collected during 1980-99. Number of
specimens examined by month is above each bar.
Figure 8. Gonadosomatic index (GSI) for female blueline tilefish. GSI = gonad weight/whole body
weight*100%. Error bars represent one standard error.

Figure 9. Time of spawning in female blueline tilefish collected during fishery-independent sampling in 1983-99.
All specimens (n = 296) were reproductively active and categorized according to dominant
histological criterion. Number of specimens examined is above each bar. MN = migratory nucleus,
POF = postovulatory follicle. 4 h EST = 0300-0459 hours.
Figure 10. Estimates of total fecundity in blueline tilefish relative to total length during three time intervals.
Stage-3 yolked oocytes were counted in 39 fishery-dependent specimens captured with bottom
longlines in 1997-98.
Figure 11. Frequency distribution of diameter for three oocyte stages (see Hunter et al. 1992) in eight blueline
tilefish. Specimens were collected with bottom longlines on commercial vessels during April (n = 3),
July (n = 2), and August (n = 3) 1997-98. Diameter is displayed by oocyte stage for one specimen
from April (Figure 11a). MNO = migratory nucleus oocyte, HO = hydrated oocyte.
DRAFigure 12. Estimates of batch fecundity in blueline tilefish relative to total length during three time intervals.
Migratory nucleus oocytes and hydrated oocytes were counted in 38 fishery-dependent specimens
captured with bottom longlines in 1997-98. FT

DRAFT Year
1984 1986 1988 1990 1992 1994 1996 1998 2000
Land
ings
(met
ric to
ns)
0
20
40
60
80
100
120
140

DRAFT Total length (mm)
300 400 500 600 700 800
Freq
uenc
y (n
umbe
r)
0
10
20
30
40
50
60
1982-87 1996-99
A: Male
Total length (mm)
300 400 500 600 700 800
Freq
uenc
y (n
umbe
r)
0
10
20
30
40
50
60
70
80
90
1982-87 1996-99
B: Female

DRAFT Age (years)
0 10 20 30 40
Freq
uenc
y (n
umbe
r)
0
5
10
15
20
25
30
1982-87 1996-99
A: Male
Age (years)
0 10 20 30 40
Freq
uenc
y (n
umbe
r)
0
5
10
15
20
1982-87 1996-99
B: Female

DRAFT Age (years)
0 10 20 30 40
Tota
l len
gth
(mm
)
300
400
500
600
700
800
MalesFemales
A: 1982-1987
Age (years)
0 10 20 30 40
Tota
l len
gth
(mm
)
300
350
400
450
500
550
600
650
700
750
800
MalesFemales
A: 1982-1987
B: 1996-1999
DRAFT
A)
Total length (mm)
300 400 500 600 700 800
Num
ber
0
20
40
60
80
Immature (n = 3)Definitely mature (n = 568)Resting (n = 39)
A) Female
Total length (mm)
300 400 500 600 700 800
Num
ber
0
10
20
30
40
50
60 Immature (n = 1)Definitely mature (n = 472)Resting (n = 6)
B) Male

DRAFT Jan Feb Mar Apr May Jun Jul Aug Sep Oct
Perc
enta
ge
0
20
40
60
80
100
Jan Feb Mar Apr May Jun Jul Aug Sep Oct
Perc
enta
ge
0
20
40
60
80
100
Developing Ripe Postovulatory follicles
Spent Resting
10 2 14 75 139 95 15 69 145 22
38 1 17 123 42 58 10 45 90 22
A) Female
B) Male

DRAFT Month
GSI
0
1
2
3
4
5
6
Tota
l len
gth
(mm
)
400
450
500
550
600
650
GSITotal length
Feb. April June Aug. Oct.
(9)
(1)
(13)(65)
(51)
(57)
(40)(3)
(30)
(19)

DRAFT
Total length (mm)
350 400 450 500 550 600 650 700
ln T
otal
fecu
ndity
(no.
of s
tage
-3 o
ocyt
es)
10
11
12
13
14
15
Apr (n = 9)Jul & Aug (n = 12)Sep & Oct (n = 18)

DRAFT Oocyte diameter (mm)
0.0 0.2 0.4 0.6 0.8 1.0
Perc
ent f
requ
ency
0
5
10
15
20
25
30
Oocyte diameter (mm)
0.0 0.2 0.4 0.6 0.8 1.0
Perc
ent f
requ
ency
0
5
10
15
20
25
30
0.0 0.2 0.4 0.6 0.8 1.0
Perc
ent f
requ
ency
0
5
10
15
20
25
30
0.0 0.2 0.4 0.6 0.8 1.0
Num
ber
0
20
40
60
80
100
120
140Stage 2Stage 3MNO & HO
April ( n = 1754)
August (n = 977)July (n = 1097)
A) B)
C) D)

DRAFT Eastern standard time (h)
2 4 6 8 10 12 14 16 18 20 22
Perc
ent
0
20
40
60
80
1004 69 42 70 42 52 16 1
VitellogenicMNHydratedPOF, 24-48 h oldPOF, < 24 h old
DRAFT
Total length (mm)
450 475 500 525 550 575 600 625
Bat
ch fe
cund
ity
0
50x103
100x103
150x103
200x103
April (n=7)June & July (n=12)August & September (n=19)
r2 = 0.27395% CI