Analytical Model of Cold-Formed Steel Framed Shear …/67531/metadc271920/m2/1/high... · The...
181
APPROVED: Cheng Yu, Major Professor Leticia Anaya, Committee Member Reza Mirshams, Committee Member Haifeng Zhang, Committee Member Enrique Barbieri, Chair of the Department of Engineering Technology Costas Tsatsoulis, Dean of the College of Engineering Mark Wardell, Dean of the Toulouse Graduate School ANALYTICAL MODEL OF COLD-FORMED STEEL FRAMED SHEAR WALL WITH STEEL SHEET AND WOOD-BASED SHEATHING Noritsugu Yanagi Thesis Prepared for the Degree of MASTER OF SCIENCE UNIVERSITY OF NORTH TEXAS May 2013
-
Upload
hoangxuyen -
Category
Documents
-
view
214 -
download
0
Transcript of Analytical Model of Cold-Formed Steel Framed Shear …/67531/metadc271920/m2/1/high... · The...

APPROVED: Cheng Yu, Major Professor Leticia Anaya, Committee Member Reza Mirshams, Committee Member Haifeng Zhang, Committee Member Enrique Barbieri, Chair of the Department
of Engineering Technology Costas Tsatsoulis, Dean of the College of
Engineering Mark Wardell, Dean of the Toulouse
Graduate School
ANALYTICAL MODEL OF COLD-FORMED STEEL FRAMED SHEAR WALL
WITH STEEL SHEET AND WOOD-BASED SHEATHING
Noritsugu Yanagi
Thesis Prepared for the Degree of
MASTER OF SCIENCE
UNIVERSITY OF NORTH TEXAS
May 2013

Yanagi, Noritsugu. Analytical Model of Cold-Formed Steel Framed Shear Wall with
Steel Sheet and Wood-Based Sheathing. Master of Science (Engineering Systems - Construction
Management), May 2013, 171 pp., 18 tables, 24 illustrations, references, 43 titles.
The cold-formed steel framed shear walls with steel sheets and wood-based sheathing are
both code approved lateral force resisting system in light-framed construction. In the United
States, the current design approach for cold-formed steel shear walls is capacity-based and
developed from full-scale tests. The available design provisions provide nominal shear strength
for only limited wall configurations. This research focused on the development of analytical
models of cold-formed steel framed shear walls with steel sheet and wood-based sheathing to
predict the nominal shear strength of the walls at their ultimate capacity level.
Effective strip model was developed to predict the nominal shear strength of cold-formed
steel framed steel sheet shear walls. The proposed design approach is based on a tension field
action of the sheathing, shear capacity of sheathing-to-framing fastener connections, fastener
spacing, wall aspect ratio, and material properties. A total of 142 full scale test data was used to
verify the proposed design method and the supporting design equations. The proposed design
approach shows consistent agreement with the test results and the AISI published nominal
strength values.
Simplified nominal strength model was developed to predict the nominal shear strength
of cold-formed steel framed wood-based panel shear walls. The nominal shear strength is
determined based on the shear capacity of individual sheathing-to-framing connections, wall
height, and locations of sheathing-to-framing fasteners. The proposed design approach shows a
good agreement with 179 full scale shear wall test data. This analytical method requires some
efforts in testing of sheathing-to-framing connections to determine their ultimate shear capacity.

However, if appropriate sheathing-to-framing connection capacities are provided, the proposed
design method provides designers with an analytical tool to determine the nominal strength of
the shear walls without conducting full-scale tests.

ii
Copyright 2013
by
Noritsugu Yanagi

iii
ACKNOWLEDGEMENT
First and foremost, I would like to express my sincere gratitude to my adviser Dr. Cheng
Yu for the financial support and mentorship throughout the two years of my graduate study, as
well as his great patience and challenging but invaluable learning opportunities.
I also would like to express my appreciation to my committee members – Dr. Leticia
Anaya, Dr. Reza Mirshams, and Dr. Haifeng Zhang for their support, advice, and guidance for
completing my thesis.
My colleagues – Webster, Praveen, Charlie, Mark, Eslam, Marcus, and Roger, I am really
thankful to you guys for the help that I received for my research and great friendship.
Finally, I am extremely grateful to my family in Japan for their support and
encouragement throughout my studies in the United States.

iv
TABLE OF CONTENTS
Page ACKNOWLEDGEMENT ............................................................................................................. iii
LIST OF TABLES ......................................................................................................................... vi
LIST OF FIGURES ...................................................................................................................... vii
CHAPTER 1. INTRODUCTION ....................................................................................................1
CHAPTER 2. PROBLEM STATEMENT AND RESEARCH OBJECTIVES ..............................4
2.1 Problem Statement .........................................................................................................4
2.2 Research Objectives .......................................................................................................6
CHAPTER 3. ANALYTICAL MODEL AND DESIGN METHOD FOR CFS SHEAR WALLS
USING STEEL SHEET SHEATHING ...............................................................................8
3.1 Literature Review...........................................................................................................8
3.1.1 Previously Conducted Experimental Studies ..................................................8
3.1.2 Related Analytical Model - Strip Model .........................................................9
3.1.3 Comparison of CFS Steel Sheet Shear Walls with SPSW ............................13
3.2 Analytical Model – Effective Strip Model...................................................................16
3.3 Design Formula for Effective Strip Width...................................................................23
3.4 Discussion ....................................................................................................................30
3.5 Summary ......................................................................................................................35
CHAPTER 4. ANALYTICAL MODEL AND DESIGN METHOD FOR CFS SHEAR WALLS
USING WOOD-BASED PANEL SHEATHING ..............................................................36
4.1 Literature Review.........................................................................................................36
4.1.1 Previously Conducted Experimental Studies ................................................36

v
4.1.2 Related Analytical Models ............................................................................40
4.1.3 Capacity of Individual Sheathing-to-Framing Connection ...........................43
4.1.4 Chen (2004) – Simplified Strength Model (SSM) ........................................45
4.1.5 Chen (2004) – Comparison of Shear Wall Capacity ....................................52
4.2 Screw Connection Test – UNT Shear Wall Testing Program .....................................54
4.2.1 Test Setup......................................................................................................55
4.2.2 Test Specimen ...............................................................................................56
4.2.3 Test results ....................................................................................................58
4.3 Effective Strip Model ...................................................................................................59
4.4 Simplified Nominal Strength Model ............................................................................64
4.5 Discussion ....................................................................................................................67
4.6 Summary ......................................................................................................................70
CHAPTER 5. CONCLUSIONS AND RECOMMENDATIONS .................................................71
5.1 Steel Sheet Shear Wall .................................................................................................71
5.2 Wood-based Panel Shear Wall .....................................................................................72
5.3 Recommendations for Future Research .......................................................................73
APPENDIX A DESIGN EXAMPLE OF CFS-STEEL SHEET SHEAR WALL .........................75
APPENDIX B DESIGN EXAMPLE OF CFS-WOOD-BASED PANEL SHEAR WALL .........80
APPENDIX C DATA SHEETS OF OSB AND PLYWOOD CONNECTION TESTS ...............83
APPENDIX D DATA SHEETS OF PLYWOOD SHEATHED SHEAR WALL TESTS .........156
REFERENCES ............................................................................................................................167
vi
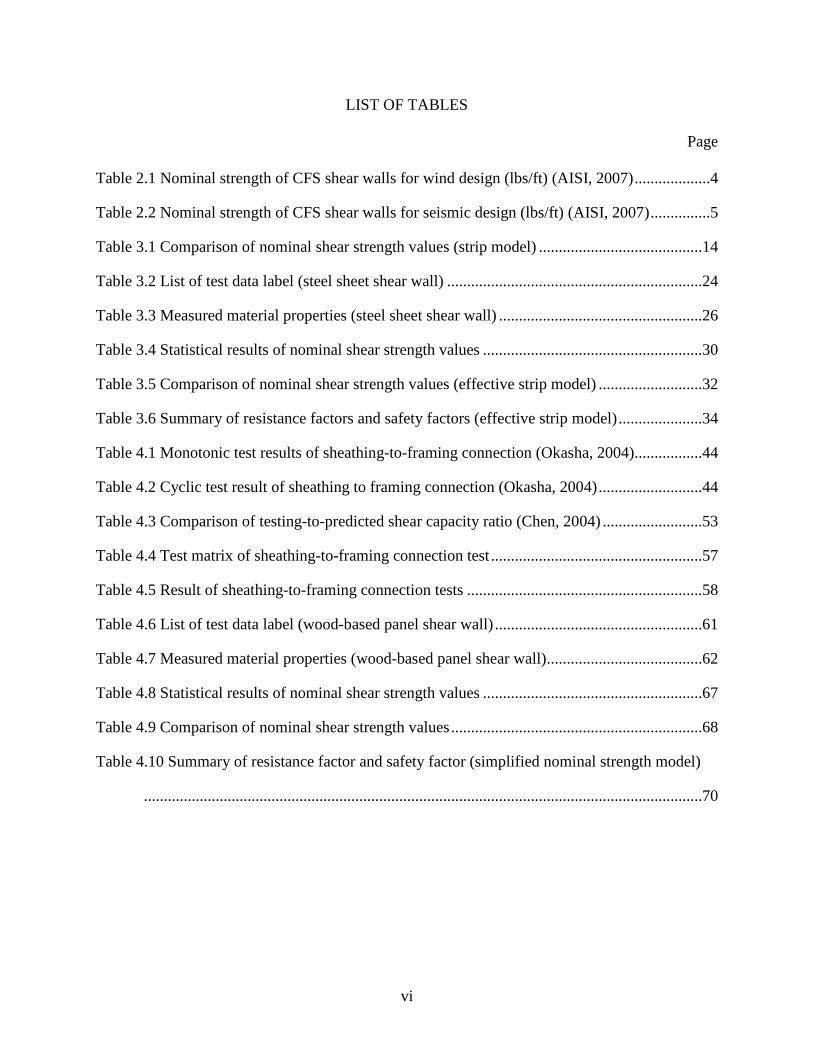
LIST OF TABLES
Page Table 2.1 Nominal strength of CFS shear walls for wind design (lbs/ft) (AISI, 2007) ...................4
Table 2.2 Nominal strength of CFS shear walls for seismic design (lbs/ft) (AISI, 2007) ...............5
Table 3.1 Comparison of nominal shear strength values (strip model) .........................................14
Table 3.2 List of test data label (steel sheet shear wall) ................................................................24
Table 3.3 Measured material properties (steel sheet shear wall) ...................................................26
Table 3.4 Statistical results of nominal shear strength values .......................................................30
Table 3.5 Comparison of nominal shear strength values (effective strip model) ..........................32
Table 3.6 Summary of resistance factors and safety factors (effective strip model) .....................34
Table 4.1 Monotonic test results of sheathing-to-framing connection (Okasha, 2004).................44
Table 4.2 Cyclic test result of sheathing to framing connection (Okasha, 2004) ..........................44
Table 4.3 Comparison of testing-to-predicted shear capacity ratio (Chen, 2004) .........................53
Table 4.4 Test matrix of sheathing-to-framing connection test .....................................................57
Table 4.5 Result of sheathing-to-framing connection tests ...........................................................58
Table 4.6 List of test data label (wood-based panel shear wall) ....................................................61
Table 4.7 Measured material properties (wood-based panel shear wall) .......................................62
Table 4.8 Statistical results of nominal shear strength values .......................................................67
Table 4.9 Comparison of nominal shear strength values ...............................................................68
Table 4.10 Summary of resistance factor and safety factor (simplified nominal strength model)
............................................................................................................................................70

vii
LIST OF FIGURES
Page
Figure 1.1 CFS shear walls using steel sheet sheathing (courtesy of Simpson Strong-Tie®) .........2
Figure 1.2 Components in a typical CFS shear wall ........................................................................3
Figure 3.1 Steel structure with SPSW system (courtesy of Magnusson Klemencic Associates) ..10
Figure 3.2 Components in typical SPSW ......................................................................................10
Figure 3.3 Diagonal tension field action of SPSW (Berman and Bruneau, 2005) ........................11
Figure 3.4 Strip model of SPSW....................................................................................................11
Figure 3.5 Tension field action of CFS steel sheet shear walls .....................................................13
Figure 3.6 Connection failure of CFS steel sheet shear wall .........................................................14
Figure 3.7 Definition of shear wall configuration .........................................................................15
Figure 3.8 Effective strip model of steel sheet sheathing ..............................................................17
Figure 3.9 Equilibrium of nominal tension force in sheathing and sum of nominal connection
shear capacity .....................................................................................................................19
Figure 3.10 Sheathing-to-framing fastener connection layout within effective strip ....................22
Figure 3.11 Definition of test data label (steel sheet shear wall) ...................................................25
Figure 3.12 Maximum width of effective strip ..............................................................................27
Figure 3.13 Comparison of proposed design curve with test results (actual material properties) .....
............................................................................................................................................28
Figure 3.14 Comparison of proposed design curve with test results (nominal material properties)
............................................................................................................................................29
Figure 4.1 Force distribution in frame members (Chen, 2004) .....................................................47
Figure 4.2 Force distribution in sheathing-to-framing connections (Chen, 2004) ........................47
Figure 4.3 Typical set up of a test specimen ..................................................................................56
viii
Figure 4.4 Close-up of a connection test specimen .......................................................................57
Figure 4.5 Definition of test ID (connection test) ..........................................................................58
Figure 4.6 Definition of test data label (wood-based panel shear wall) ........................................62
Figure 4.7 Effective ratio versus screw spacing ............................................................................63
Figure 4.8 Comparison of proposed design curve with test results ...............................................66

1
CHAPTER 1
INTRODUCTION
The use of cold-formed steel (CFS) framing in low and mid-rise building construction
has become very popular in recent years due to its many beneficial aspects. Some of its desirable
traits include cost-effectiveness, non-combustibility, recyclability, and excellence in material
consistency. Also, CFS has high durability and high strength despite the fact that it is
significantly lighter than traditional framing materials such as concrete and hot-rolled steel. The
use of CFS as structural framing members is a great choice for up to medium rise commercial
and public construction such as schools, office buildings, apartments, and hotels.
In building construction, CFS structural members are classified into two major
categories: individual structural framing members and panels and decks. The primary roles of
individual structural members are to transfer loads to the ground and provide structural strength
and stiffness to the building. Panels and decks also resist in-plane and out-of-plane loads, but
they also act as essential surface component of the building such as floors, walls, and roofs (Yu
and LaBoube, 2010).
Along with CFS framing, steel sheets and wood-based panels are used as sheathing
materials to provide lateral strength and stiffness to the framing. This type of structural
component is called shear wall and is widely employed in CFS construction as a lateral force
resisting system against wind and earthquake forces. Figure 1.1 shows a three-story residential
building using CFS steel sheet shear wall.

2
Figure 1.1 CFS shear walls using steel sheet sheathing (courtesy of Simpson Strong-Tie®)
Typical CFS shear walls consist of framing members (studs and tracks), sheathing,
fasteners, and hold-downs. Studs and tracks are vertical and horizontal framing members
respectively. Sheathing is fastened to the boundary framing members and the inner stud by self-
drilling self-tapping screws. Plywood, oriented strand board (OSB), and steel sheet are the most
popular sheathing materials. Hold-downs are installed on the boundary studs with screws, and
then the hold-downs are anchored to the foundation or footing of the structure by anchor bolts.
Figure 1.2 shows a typical 8 ft. × 4 ft. CFS steel sheet shear wall and its components.
Overturning and shear forces are the two forces acting on CFS shear walls when a lateral force is
applied at the top of the wall. Overturning force is resisted by the hold-downs and the anchor
bolts. In-plane shear force is resisted by the sheathing and sheathing-to-framing screw
connections.

3
Figure 1.2 Components in a typical CFS shear wall

4
CHAPTER 2
PROBLEM STATEMENT AND RESEARCH OBJECTIVES
2.1 Problem Statement
International Building Code (IBC 2006) and North American Standard for Cold-Formed
Steel Framing – Lateral Design (AISI S213, 2007) provide provisions for the design of CFS
shear walls. In these provisions, tabulated nominal shear strength values are presented for three
types of sheathing materials: 15/32 in. structural I plywood, 7/16 in. OSB, and 0.018 in. and
0.027 in. steel sheet. Those published values are based on full-scale shear wall tests conducted by
Serrette et al. (1996, 1997, and 2002). Table 2.1 and Table 2.2 show the tables of nominal
strength from AISI S213 (2007) for wind and seismic loads respectively. The tables are also
adopted by IBC (2006).
Table 2.1 Nominal strength of CFS shear walls for wind design (lbs/ft) (AISI, 2007)
Assembly Description
Maximum
Aspect
Ratio (h/w)
Fastener Spacing at Panel
Edges (inches) Designation
Thickness of
Stud, Track and
Blocking (mils)
Required
Sheathing
Screw Size 6 4 3 2
15/32" Structural 1
sheathing (4-ply), one side 2:1 1065 - - - 33 8
7/16" rated sheathing
(OSB), one side 2:1 910 1410 1735 1910 43 or 54 8
7/16" rated sheathing
(OSB), one side oriented
perpendicular to framing
2:1 1020 - - - 54 8
7/16" rated sheathing
(OSB), one side 4:1 - 1025 1425 1825 68 10
0.018" steel sheet, one side 2:1 485 - - - 33 (min.) 8
0.027" steel sheet, one side 4:1 - 1000 1085 1170 43 (min.) 8
2:1 647 710 778 845 33 (min.) 8

5
Table 2.2 Nominal strength of CFS shear walls for seismic design (lbs/ft) (AISI, 2007)
Assembly Description
Maximum
Aspect
Ratio (h/w)
Fastener Spacing at Panel
Edges (inches)
Designation
Thickness of
Stud, Track
and Blocking
(mils)
Required
Sheathing
Screw Size 6 4 3 2
15/32" Structural 1
sheathing (4-ply), one side
2:1 780 990 - - 33 or 43 8
2:1 890 1330 1775 2190 43 or 54 8
68 10
7/16" OSB, one side
4:1 700 915 - - 33 8
4:1 825 1235 1545 2060 43 or 54 8
2:1 940 1410 1760 2350 54 8
2:1 1232 1848 2310 3080 68 10
0.018" steel sheet, one side 2:1 390 - - - 33 (min.) 8
0.027" steel sheet, one side 4:1 - 1000 1085 1170 43 (min.) 8
2:1 647 710 778 845 33 (min.) 8
The current CFS design provisions are capacity based design and provide no analytical
methodology to predict the shear resistances of CFS shear walls. No analytical models or design
equations have been incorporated into design provisions for predicting the shear strength of CFS
shear walls. Instead, those provisions only provide nominal shear strength values for specified
and limited wall configurations. When designing CFS shear walls, it is apparent that with the
current design specifications, structural engineers have limited options in sheathing materials,
sheathing thickness, wall aspect ratios, etc. Oftentimes engineers are forced to conduct full-scale
shear wall testing to determine nominal shear strength of shear wall configurations that are not
listed in the provisions before incorporating the design to use. Contrarily, analytical models and
closed-form design equations for the hot-rolled steel plate shear wall (SPSW) and reinforced
concrete shear wall have been developed and adopted by design provisions (AISC Seismic
Design Manual, 2005; ACI Building Code Requirements 318, 2005). In order to provide more
design options to the engineers without conducting full-scale testing, it is necessary that
analytical models and design equations be developed to predict nominal shear strength of CFS
shear walls with steel sheet and wood-based panel sheathing.

6
2.2 Research Objectives
The purpose of this research is to develop an analytical method to predict nominal shear
strength of CFS shear walls with steel sheet and wood-based panel sheathing. Experimental data
from previously conducted full-scale shear wall testing programs is incorporated into this
research to analyze dominant failure mechanism of CFS shear wall systems. An analytical model
will be developed based on the identified failure mechanism and an engineering mechanics
approach. Since steel sheets and wood-based panels have completely different failure mechanism
and material properties, the development of the analytical models is conducted separately. Thus,
this research is divided into two parts. An analytical model of steel sheet shear wall will be
developed first. Once the model is developed, the analytical method for the design of steel sheet
shear walls will be applied to wood-based panel shear walls to see if the method is also
appropriate for wood-based panel shear walls. Otherwise a different analytical model will be
developed. The specific research objectives of this thesis are listed below:
For steel sheet shear walls,
i). Incorporate test data from Yu et al. (2007, 2009) and Balh (2010), obtain necessary
information to determine the dominant failure mechanism of shear wall system and
contributing factor to achieve its peak resistance;
ii). Develop an analytical model and design equations for steel sheet shear wall;
iii). Seek for an agreement between shear wall peak resistance from the test data and
estimated nominal strength values from the analytical approach;
iv). Recommend an efficient analytical model for steel sheet shear wall and perform
reliability analysis to determine the Load and Resistance Factor Design (LRFD)

7
resistance factor and Allowable Stress Design (ASD) safety factor for both wind and
seismic design.
For wood-based panel shear walls,
v). Perform OSB-to-framing and plywood-to-framing connection test to determine the
capacity of individual sheathing-to-framing connection;
vi). Incorporate test data from Branston (2004), Chen (2004), Boudreault (2005), Blais
(2006), Rokas (2006), and Li (2012);
vii). Apply the analytical method developed for steel sheet shear walls to see if the
analytical model is also applicable to wood-based panel shear walls;
viii). Review an analytical model proposed by Chen (2004) and apply the model to larger
pool of test data to seek for an agreement between shear wall peak resistance from the
test data and estimated nominal strength values from the analytical model;
ix). Recommend an efficient analytical model for wood-based panel shear wall and
perform reliability analysis to determine the LRFD resistance factor and ASD safety
factor for both wind and seismic design.

8
CHAPTER 3
ANALYTICAL MODEL AND DESIGN METHOD FOR CFS SHEAR WALLS USING
STEEL SHEET SHEATHING
3.1 Literature Review
In this section, brief overview of previously conducted experimental studies on steel
sheet shear walls is presented. Also, an existing analytical model of hot-rolled steel plate shear is
reviewed to seek its applicability to CFS steel sheet shear walls.
3.1.1 Previously Conducted Experimental Studies
As mentioned earlier, through literature review, no analytical methodology has been
developed to determine the nominal shear strength of CFS steel sheet shear walls. However,
some researchers have conducted experimental investigations to capture the characteristics and
behavior of CFS steel sheet shear walls (Serrette, 1997; Yu, 2007, 2009; Balh, 2010). A full-
scale testing program was sponsored by the American Iron and Steel Institute (AISI) and
conducted at Santa Clara University by Serrette (1997) in order to determine nominal shear
strength values for steel sheet shear walls. The total of 12 steel sheet sheathed shear walls were
test, in which six of them were monotonic and the other six were cyclic tests. In this test program,
wall configuration was limited: height to width wall aspect ratio of 2.0 (8 ft. × 4 ft.) and 4.0 (8 ft.
× 2 ft.), framing thickness of 33 mil, and sheathing thickness of 18 mil and 27 mil. It was noted
that all the shear wall specimens experienced some form of failure at sheathing to framing
connections especially at the corners of the walls. Yu et al. (2007, 2009) conducted two-phase
full-scale testing of steel sheet shear walls at University of North Texas to expand the available
nominal strength values for more wall configurations. In phase 1, the main purpose was to
provide nominal strength values for the walls with 30 mil and 33 mil steel sheet sheathing. 27
mil sheathing was also used for some specimens to replicate the results of test program by

9
Serrette (1997). Each wall type had 2 in., 4 in., and 6 in. edge fastener spacing, and in total, 33
monotonic and 33 cyclic tests were carried out. Yu et al. (2007) reported that for the wall
specimens with 4 in. and 6 in. edge fastener spacing, dominant mode of failure was a
combination of buckling of steel sheet sheathing and fastener pull-out from the framing. For the
walls with 2 in. fastener spacing, dominant mode of failure was a combination of buckling of
steel sheet sheathing and flange distortional buckling of boundary studs. Yu et al. (2009)
conducted additional shear wall testing with 18 mil and 27 mil steel sheet shear walls to verify
the published shear strength values in AISI S213 (2007). Also, Yu et al. (2009) conducted testing
of steel sheet shear walls with aspect ratio of 1.33 (8’x6’) to investigate appropriate seismic
detailing in framing and joint to the sheathing. Balh (2010) was involved in full-scale testing of
steel sheet shear walls at McGill University in Canada, and the result of comprehensive analysis
of the test data was reported in Balh (2010). Balh (2010) also reported sheathing-to-framing
connection failure at the corners of the walls and steel sheet buckling were the dominant failure
modes.
3.1.2 Related Analytical Model - Strip Model
Hot-rolled steel plate shear wall (SPSW) has been used as lateral load resisting systems
for buildings in North America and Japan for the last 30 years. During this time, SPSW has been
studied experimentally and analytically by a number of researchers (Thorburn et al., 1983;
Timler and Kulak, 1983; Tromposch and Kulak, 1987; Roberts and Sabouri-Ghomi, 1992;
Sabouri-Ghomi and Roberts, 1992; Cassese et al., 1993; Elgaaly et al., 1993; Driver et al., 1998;
Elgaaly and Liu, 1997; Elgaaly 1998; Rezai, 1999; Lubell et al., 2000; Berman and Bruneau,
2004, Vian and Bruneau, 2004). Figure 3.1 shows a hot-rolled steel structure using SPSWs as
lateral force resisting systems.
10
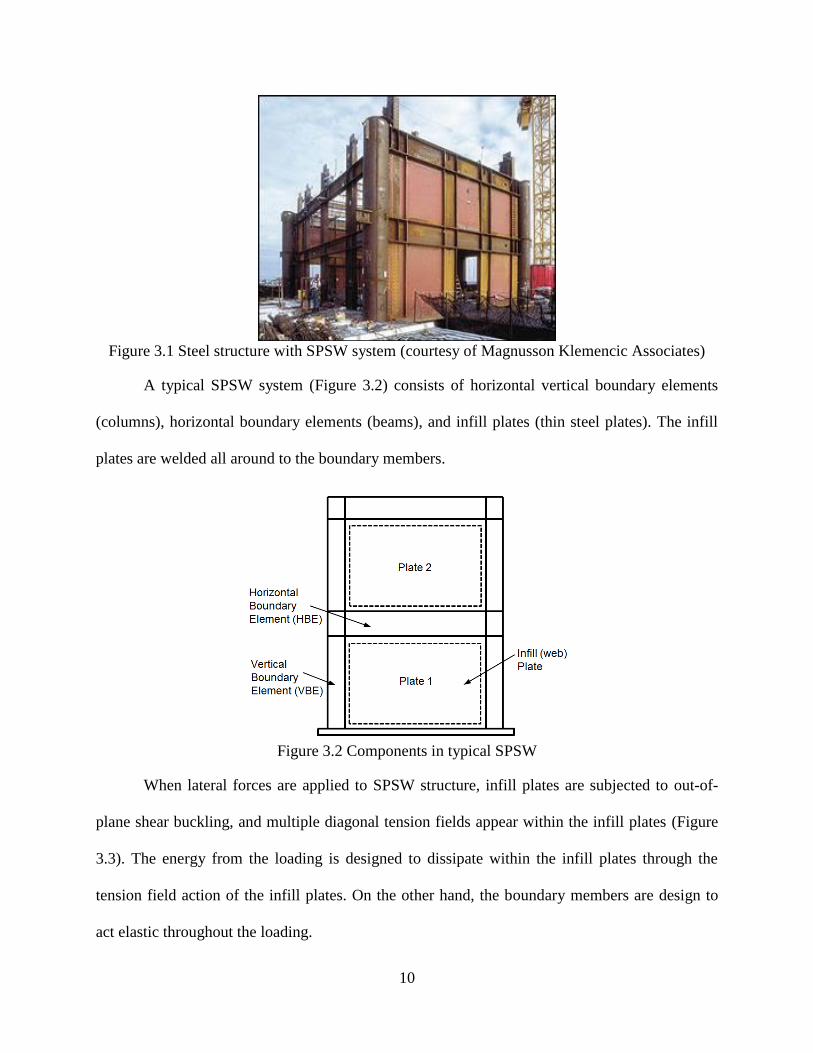
Figure 3.1 Steel structure with SPSW system (courtesy of Magnusson Klemencic Associates)
A typical SPSW system (Figure 3.2) consists of horizontal vertical boundary elements
(columns), horizontal boundary elements (beams), and infill plates (thin steel plates). The infill
plates are welded all around to the boundary members.
Figure 3.2 Components in typical SPSW
When lateral forces are applied to SPSW structure, infill plates are subjected to out-of-
plane shear buckling, and multiple diagonal tension fields appear within the infill plates (Figure
3.3). The energy from the loading is designed to dissipate within the infill plates through the
tension field action of the infill plates. On the other hand, the boundary members are design to
act elastic throughout the loading.

11
Figure 3.3 Diagonal tension field action of SPSW (Berman and Bruneau, 2005)
Based on the elastic strain energy assumption, Thorburn et al. (1983) developed an
analytical model known as a strip model (Figure 3.4). In strip model, the infill plate is divided
into a series of inclined strip elements. The inclination of the strip members, α is oriented in the
same direction as the direction of the tensile forces experienced in the panel, and the strips are
capable of transferring only tension forces. Individual strip members have identical cross section
area as the product of the width and thickness of the strip.
Figure 3.4 Strip model of SPSW
With respect to development of the analytical model, Thorburn et al. (1983) derived an
equation to determine the angle of inclination of the tension strips based on the principle of least
work. In the process of the derivation of the formula of angle of inclination by Thorburn et al.
(1983), both boundary members were considered rigid. However, Timler and Kulak (1983) re-

12
evaluated this formula to include the effect of bending of the vertical boundary elements. The
influence of the horizontal boundary members was excluded from the derivation of the formula
since the tension field created above and below the horizontal boundary members oppose to each
other and cancel out the influence to the infill plates. Based on the strip model, Berman and
Bruneau (2003b) derived an equation to determine the ultimate strength of SPSW using plastic
analysis.
The angle of inclination of the tension strips is given by:
√
(
)
(3.1)
where:
t = thickness of the infill plate;
h = height of the wall;
L = width of the wall;
Ic = moment of inertia of the vertical boundary element;
Ac = cross section area of the vertical boundary element;
Ab = cross section area of the horizontal boundary element.
The ultimate strength of single story SPSW is given by:
(3.2)
where:
V = horizontal shear force applied to the wall;
Fy = yield stress of the infill plate.
The strip model and the design equations were adopted by BSSC (2004) and AISC
(2005).

13
3.1.3 Comparison of CFS Steel Sheet Shear Walls with SPSW
The behavior of CFS steel sheet shear walls similar behaviors as SPSWs to some extent.
Both structures demonstrated out-of-plane shear buckling and create diagonal tension field in the
sheathing or infill plate. Diagonal tension field action of SPSW is previously presented in Figure
3.3. Figure 3.5 shows diagonal tension field action of CFS steel sheet shear walls with different
aspect ratio observed in Yu (2007, 2009).
Figure 3.5 Tension field action of CFS steel sheet shear walls
According to strip model, the ultimate strength of SPSW is determined when an infill
plate reaches its yielding capacity. However, the boundary conditions of SPSW and CFS shear
walls are different, and thus different types of failure modes are observed in CFS steel sheet
shear wall. The infill plate in SPSW is usually welded to the boundary elements while CFS steel
sheet sheathing is generally fastened to the boundary elements by self-drilling screws. In addition
to the sheathing shear buckling, commonly observed failure modes of CFS steel sheet shear wall
include sheathing-to-framing fastener pull-out, pull-over, and sheathing tear at the locations of
the fasteners. Figure 3.6 shows different types of connection failure of CFS steel sheet shear
AR=4 AR=2 AR=1.33

14
walls. These failures do not exist in SPSW and must be considered when predicting the shear
strength of CFS shear walls.
Figure 3.6 Connection failure of CFS steel sheet shear wall
In order to verify the applicability of strip model design approach to CFS steel sheet
shear wall, published nominal shear strength of CFS sheet steel shear walls from Table C2.1-1
(wind) and Table C2.1-3 (seismic) in AISI S213 (2007) are used to compare with the nominal
shear strength values calculated based on the strip model and equation 3.2. A total of eight shear
wall configurations are analyzed. Table 3.1 shows the comparison of published nominal shear
strength values with the ones estimated by using strip model approach.
Table 3.1 Comparison of nominal shear strength values (strip model)
Shear wall
Configuration
AISI S213
(2007) Table
C2.1-1 (plf)
AISI S213
(2007) Table
C2.1-3 (plf)
Predicted
Vn (plf)
2:1x33x18-6 485 390 1728
4:1x43x27-4 1000 1000 1935
4:1x43x27-3 1085 1085 1935
4:1x43x27-2 1170 1170 1935
2:1x33x27-6 647 647 2531
2:1x33x27-4 710 710 2531
2:1x33x27-3 778 778 2531
2:1x33x27-2 845 845 2531

15
In Table 3.1, the first column from the left lists wall configurations included in AISI
S213 (2007), the second and third columns list the published nominal shear strength of CFS steel
sheet shear walls for wind and seismic loads respectively, and the fourth column lists the
nominal shear strength values estimated by using strip model design approach. The definition of
wall configuration is illustrated in Figure 3.7.
Figure 3.7 Definition of shear wall configuration
The grade of steel sheet sheathing and framing members is considered to be ASTM
A1003 Grade 33, having minimum yield strength of 33 ksi and tensile strength of 45 ksi. Design
values are used for sheathing thicknesses and cross-sectional area and moment of inertia of
boundary members. According to the results shown in Table 3.1, all of the estimated nominal
shear strength values are significantly higher than the published values. This is a good indication
that the yielding of steel sheathing is not likely the primary mode of failure for CFS steel sheet
shear wall. Also, according to strip model approach, screw spacing does not affect the nominal
strength values as long as all the other design parameters remain the same. However, this is not
true in reality, and the published values indicate that the nominal strength is higher as the screw
spacing gets closer. Strip model assumes that material of infill plate or sheathing is the only
failure of the shear wall system, and it also fails to capture the important trend that are obvious in
CFS steel sheet shear walls. Thus, the strip model cannot be applied to CFS steel sheet shear
walls to estimate its nominal shear strength. A new analytical model has to be developed in order

16
to include sheathing-to-framing connection failure as one of the failure modes and capture the
effect of screw spacing.
3.2 Analytical Model – Effective Strip Model
As mentioned in the previous section, steel sheet sheathing of CFS steel sheet shear walls
(SSSWs) exhibit tension field action under lateral loading, and the shear resistance of CFS-
SSSWs was primarily provided by the steel sheathing through the diagonal tension field action.
The dominant failure mechanism was screw connection failure within the diagonal tension field.
As illustrated in Figure 3.5, the steel sheathing is not equally contributing to the shear resistance
across the width of the entire shear wall. It was observed that a partial width of the sheathing was
accountable for conveying most of the tension force in the system. Also, in most tested wall
specimens, sheathing-to-framing connection failure occurred at the corners of the shear walls
normally inside the observed tension field. This observation led to the creation of an analytical
model - effective strip model, for predicting the shear strength of CFS-SSSWs as illustrated in
Figure 3.8. In the effective strip model, it is assumed that a particular width of the sheathing in
the diagonal direction – the effective strip is involved in the tension field action to provide shear
resistance to the lateral force which is applied to the top of the wall.

17
Figure 3.8 Effective strip model of steel sheet sheathing
In Figure 3.8, Va is the applied lateral load, T is the resulting tension force in the effective
strip of the sheathing, and h and W are the height and the width of the wall respectively. α is the
angle at which the tension force is acting. We is the width of the effective strip that is
accountable for conveying all the tension force in the system and is defined in a way that it is
perpendicular to the direction of the strip. It is assumed that the effective strip is centered to the
diagonal line from the corner to the other corner of the wall. Based on the effective strip model,
the applied lateral load Va can be expressed in the following equation.
(3.3)

18
In this model, the applied lateral load is directly related to the tension force experienced
in the effective strip of the steel sheet sheathing. In other words, the maximum force obtained
from shear wall system is limited by the maximum tension force in the sheathing. The maximum
tension force in the sheathing is then limited by capacities of two components in the system. The
first component is the capacity of sheathing-to-framing connection at both ends of the effective
strip (e.g. the corners of shear walls inside the effective tension field). The second component is
the material yield strength of the effective strip. The yielding of the sheathing material was not
observed in the actual experimental investigation by Yu (2007, 2009). However, this type of
failure mode could possibly happen when a large number of fasteners are used to connect the
sheathing to the CFS frame. Thus, the nominal shear force in a CFS-SSSW can be determined as
follows.
(3.4)
where Vn is the nominal shear strength of a CFS-SSSW and Tn is the nominal tension
strength of the effective strip of the sheathing. As previously discussed, the nominal tension
force is determined as follows.
{∑ } (3.5)
where Pns is the nominal shear strength of individual sheathing-to-framing connection, tsh
is the sheathing thickness, Fy is the sheathing yield stress, and n is the total number of fasteners
at one end of the effective strip. The proposed model assumes that the fastener configurations are
equivalent at both ends of the effective strip. When the fastener configurations are different at the
two ends of the effective strip, the fastener strength on the weaker end shall be used in Equation
3.5. The nominal tension force Tn is determined as the smaller of the sum of the nominal shear

19
strengths of sheathing-to-framing connections and the material yield strength of the effective
strip of sheathing. Figure 3.9 illustrates the equilibrium of the tension force in sheathing and the
sum of connection shear strength.
Figure 3.9 Equilibrium of nominal tension force in sheathing and sum of nominal connection
shear capacity
Nominal shear strength of fastener connections is limited by three types of failure
mechanisms. The first is connection shear limited by tilting and bearing. The second is
connection shear limited by end distance measured in line of force from center of a standard hole
to the nearest end of connected parts. The third is shear failure in screws. The consideration of
those three types of fastener failures is consistent with the fastener provisions in the North
American Specification for the Design of Cold-Formed Steel Structural Members (AISI S100,
2007). Thus, sheathing-to-framing connection shear strengths are determined based on the
smallest value obtained from calculation by following E4.3.1, E4.3.2, and E4.3.3 of AISI S100
(2007).

20
Connection capacity based on tilting and bearing can be determined based on section
E.4.3.1 of AISI S100 (2007) and for t2/t1 ≤ 1.0,
{
⁄ } (3.6)
where t1 is the thickness of member in contact with screw head or washer, t2 is the
thickness of member not in contact with screw head or washer, d is the nominal screw diameter,
Fu1 is the tensile strength of member in contact with screw head or washer, and Fu2 is the tensile
strength of member not in contact with screw head or washer. For t2/t1 ≥ 2.5,
{ } (3.7)
For 1.0 < t2/t1 < 2.5, Pns shall be calculated by linear interpolation between the above
two cases.
Connection capacity limited by end distance can be determined based on section E.4.3.2.
(3.8)
where t is the thickness of part in which end distance is measured, e is the distance
measured in line of force from center of a standard hole to nearest end of connected part, and Fu
is the tensile strength of part in which end distance is measured. The end distance e can be
determined based on one half of the flange width of stud or track and aspect ratio of a shear wall.
Connection strength limited by shear in screw is generally provided by the manufacturer
or determined by tests. The provision of E4.3.3 in AISI S100 (2007) does not provide design
equations for shear strength in screw. It is worth noting that the screw’s pull-out and pull-over
strength do affect the shear wall’s shear strength. However those forces are out-of-plane, not
directly contributing to the in-plane shear strength, therefore the limit states of screw’s pull-out
and pull-over are not considered in the calculation of Pns.

21
Equations 3.4 and 3.5 express the key concept of the Effective Strip Model for
calculating the shear strength of CFS-SSSWs. The nominal shear strength of a CFS-SSSW can
be further represented in terms of the number of sheathing-to-framing connections and the
connection strength within its effective strip. By substituting Eq. 3.5 into Eq. 3.4 and considering
practical construction details (shown in Figure 3.9), the following equation can be obtained.
{ } (3.9)
where nt is the number of fasteners on tracks within the effective strip at one end, ns is
the number of fasteners on boundary studs within the effective strip at one end, Pns is the
nominal shear strength of the fasteners, the subscript t and s are regarding connections on track
and stud respectively, and the subscript t&s is regarding a fastener at the corner of the wall at
which its fastener is penetrating through sheathing, track, and stud.
Equation 3.9 summarizes the proposed effective strip model for predicting the nominal
shear strength of a CFS-SSSW. Based on the geometry shown in Figure 3.10, the number of
connections can be related to effective strip width.

22
Figure 3.10 Sheathing-to-framing fastener connection layout within effective strip
In Figure 3.10, s is the fastener spacing (assuming that the fastener spacing is uniform on
the panel edges) and lt is the approximate length on track that is contributing to the effective
tension strip determined by the product of the number of fasteners on track within its effective
width and the fastener spacing. Likewise, ls is the approximate contributing length on stud and
determined by the product of the number of fasteners on stud within its effective width and the
fastener spacing. The effective strip width of sheathing can be expressed as follows.
or (3.10)
In these equations, the short distances of the fastener at the corner to the outer face of
stud and to the outer face of track are not included in lt and ls respectively. Inclusion of these
short distances will complicate the equations, and also, the deviations due to the exclusion of
these short distances are considered to be minimal. The number of the fasteners on track within
its effective width can be described as following equations.
(3.11)

23
Likewise, the number of fasteners on stud can be expressed in the form of the following
as well.
(3.12)
Note that the number of fasteners on stud to the number of fasteners on track ratio gives
the tangent of an angle α, which is the height to width aspect ratio of the shear wall. Substituting
the number of fasteners on track and stud within its effective width to the previously defined
equation of nominal shear strength of a CFS steel sheet shear walls, the equation becomes as
follows.
{
} (3.13)
The proposed Effective Strip Model requires the knowledge of the width of the effective
strip in order to obtain the shear strength of CFS-SSSWs. The following section emphasizes the
work of developing closed-form formula of We.
3.3 Design Formula for Effective Strip Width
Based on the proposed effective strip model, nominal shear strength of a CFS steel sheet
shear walls can be calculated in terms of nominal shear capacity of sheathing-to-framing
connections and material yield capacity of an effective strip once the effective width of the
tension strip is determined. In order to do so, design formula had to be developed to predict the
effective strip width of different configurations of CFS steel sheet shear walls. Experimental
testing data of 142 monotonic and cyclic tests of CFS steel sheet shear walls from Yu et al. (2007,
2009) and Balh (2010) are analyzed to develop and verify the formula of the effective strip width.
The 142 tests, 70 monotonic and 72 cyclic, cover a large range of variations in the wall
configurations which include framing thickness 33 mil to 68 mil, steel sheathing thickness 18 mil

24
to 33 mil, fastener spacing 2 inches to 6 inches, and wall aspect ratio 1.0 to 4.0. The list of test
data used in this research is presented in Table 3.2.
Table 3.2 List of test data label (steel sheet shear wall)
Monotonic Cyclic
Yu
(2007)
4x8x43x33-6-M-2 4x8x43x33-6-C-2
4x8x43x33-4-M-2 4x8x43x33-4-C-2
4x8x43x33-2-M-2 4x8x43x33-2-C-2
4x8x43x30-6-M-2 4x8x43x30-6-C-2
4x8x43x30-4-M-2 4x8x43x30-4-C-2
4x8x43x30-2-M-2 4x8x43x30-2-C-2
4x8x33x27-6-M-2 4x8x33x27-6-C-2
4x8x33x27-4-M-2 4x8x33x27-4-C-2
4x8x33x27-2-M-2 4x8x33x27-2-C-2
2x8x43x33-6-M-2 2x8x43x33-6-C-2
2x8x43x33-4-M-2 2x8x43x33-4-C-2
2x8x43x33-2-M-2 2x8x43x33-2-C-2
2x8x43x30-6-M-2 2x8x43x30-6-C-2
2x8x43x30-4-M-2 2x8x43x30-4-C-2
2x8x43x30-2-M-2 2x8x43x30-2-C-2
Yu
(2009)
2x8x33x27-6-M-2
2x8x33x27-6-C-2
4x8x33x18-6-M-2
4x8x33x18-6-C-2
2x8x33x27-2-M-3
2x8x33x27-2-C-3
6x8x43x33-2-M-1-C
6x8x43x30-2-C-1-A
6x8x43x30-2-M-1-C
6x8x43x30-2-C-1-B
6x8x43x33-2-M-1-C
6x8x43x33-2-C-2-C
6x8x54x33-2-M-1-B
6x8x43x30-2-C-2-C
6x8x43x27-2-M-1-D
6x8x43x33-2-C-2-C
6x8x54x33-2-M-1-C
6x8x54x33-2-C-2-B
Balh
(2010)
4x8x43x18-6-M-3
6x8x43x27-2-C-1-D
4x8x43x18-2-M-2 6x8x54x33-2-C-2-C
4x8x33x18-6-M-2 4x8x43x33-2-C-2-C
4x8x43x30-6-M-2 2x8x43x33-2-C-2-C
4x8x43x30-4-M-2
4x8x43x18-6-C-2
4x8x43x30-2-M-2
4x8x43x18-2-C-2
2x8x43x30-4-M-2
4x8x33x18-6-C-2
2x8x43x30-2-M-3
4x8x43x30-6-C-2
2x8x33x30-4-M-1
4x8x43x30-4-C-2
8x8x43x30-4-M-2
4x8x43x30-2-C-2
6x8x43x30-4-M-1
2x8x43x30-4-C-2
6x8x43x30-2-M-1
2x8x43x30-2-C-2
4x8x43x30-4-M-1
8x8x43x30-4-C-2
4x8x43x18-2-M-2
4x8x43x18-3-M-1

25
Definition of test specimen label is presented in Table 3.2. Seismic detailing designation
is only applicable to some of the specimens in Yu (2009). Full description and illustration of the
seismic detailing of each specimen are available in Yu (2009).
Figure 3.11 Definition of test data label (steel sheet shear wall)
In Yu et al. (2007, 2009) and Balh (2010), material properties of test specimens were
verified and reported. In this research, the development of the design formula of the effective
strip width was based on actual measurements of the material thicknesses and mechanical
properties. The measured material and mechanical properties of the tested specimens are
presented in Table 3.3.

26
Table 3.3 Measured material properties (steel sheet shear wall)
Test
Program
Framing
Member
Nominal Properties Measured Properties
Thickness (in.) Fy (ksi) Thickness (in.) Fy (ksi) Fu (ksi)
Yu
(2007)
Steel
Sheet
0.027 33 0.0240 50.3 57.8
0.030 33 0.0286 48.9 55.6
0.033 33 0.0358 43.4 53.8
Stud 0.033 33 0.0330 47.7 55.7
0.043 33 0.0430 47.6 55.1
Track 0.033 33 0.0330 57.4 67.2
0.043 33 0.0420 43.1 55.6
Yu
(2009)
Steel
Sheet
0.018 33 0.0189 51.0 55.0
0.027 33 0.0294 46.8 54.9
0.030 33 0.0286 48.9 55.6
0.033 33 0.0358 47.2 53.6
Stud
0.033 33 0.0341 49.8 58.1
0.043 33 0.0430 47.6 55.1
0.054 50 0.0535 55.4 73.8
Track
0.033 33 0.0339 67.5 87.5
0.043 33 0.0420 43.1 55.6
0.054 50 0.0534 62.3 82.3
Balh
(2010)
Steel
Sheet
0.018 33 0.0181 43.5 57.3
0.030 33 0.0299 41.2 54.1
Stud/Track 0.033 33 0.0343 49.6 56.7
0.043 33 0.0449 50.2 71.9
The proposed formula for the effective strip width is listed in Equation 3.14.
{ ≤
(3.14)
(3.15)
(3.16)
where:
Wmax = maximum width of effective strip as illustrated in Figure 3.12;
= w/ α;

27
a = aspect ratio of a shear wall (height / width);
α1 = Fush/45;
α2 = Fumin/45;
β1 = tush/0.018;
β2 = tumin/0.018;
β3 = s/6;
Fush = tensile strength of steel sheet sheathing in ksi;
Fumin = controlling tensile strength of framing materials in ksi (smaller tensile strength of
track and stud);
tush = thickness of steel sheet sheathing in inches;
tumin = smaller of thicknesses of track and stud in inches.
Figure 3.12 Maximum width of effective strip

28
Figure 3.13 shows a comparison between the proposed formulas of effective strip width
with the experimental results. Based on the proposed effective strip model, We can be obtained
using Equation 3.17 for each test.
{
} (3.17)
where Vtest is the peak load obtained from each shear wall test, and all the other notations are
previously defined.
Figure 3.13 Comparison of proposed design curve with test results (actual material properties)
Figure 3.13 indicates that the proposed effective strip model and the design formula for
the effective strip width work well for the CFS-SSSWs. The data points are well mixed since
CFS-SSSWs demonstrated similar peak loads for monotonic and cyclic loading; therefore the
proposed analytical model shall be used for both wind and seismic design. As mentioned earlier,
0 1 2 3 4 5 6 70
0.2
0.4
0.6
0.8
1
We
/Wmax
Monotonic Tests
Cyclic Tests
Proposed Design Curve

29
the proposed design equations to determine the effective strip width are developed by using
actual material properties of the framing members. However, these properties are usually not
readily accessible by design engineers. In order to allow the use of nominal material properties in
the proposed design method, further analyses were carried out. Fig. 10 shows the comparison
between the proposed design curve with test results when nominal mechanical properties and
design thickness of steel sheathing and framing members are used to determine the effective strip
width.
Figure 3.14 Comparison of proposed design curve with test results (nominal material properties)
When using nominal and design material properties, the proposed design equation is still
able to capture the trend of the test data. Compared to Figure 3.13, in Figure 3.14, most of the
test data points are slightly above the design curve. It indicates that when using nominal and
0 0.5 1 1.5 2 2.5 3 3.50
0.2
0.4
0.6
0.8
1
We/W
max
Monotonic Tests
Cyclic Tests
Proposed Design Curve

30
design material properties, the design equation yields a slightly conservative result compared to
using the actual material properties. However the difference is not significant enough to require a
different equation for We. The statistics of the comparisons is listed in Table 3.4. The results
indicate that the use of nominal material properties in the proposed effective width method will
yield 2.2% more conservative results with 15% greater variation than the results by using actual
material properties. Those differences will be considered in the resistance factor calculation
described in the following section.
Table 3.4 Statistical results of nominal shear strength values
Material
Property
No. of
tests
/
Avg. Std.
dev. COV
Actual 142 1.000 0.114 0.114
Nominal 142 1.022 0.133 0.131
During the development of the design formula, it was crucial to determine contributing
factors or combinations of those factors that form trends in data plots so that design equations
can be estimated based on those trends. Some of the contributing factors were obvious from test
data (screw spacing and thickness of sheathing and framing members), but finding other factors
and combinations of those factors was ultimately a try and error procedure. The ratio of effective
strip width from test over maximum strip width (effective width ratio) was plot against a possible
factor individually to see the trend of the plot. Then, the effective width ratio was plot against
combinations of the factors which produced similar trends in order to increase the trend of the
plot.
3.4 Discussion
The proposed effective strip model and design equations suggest that the effective strip
width is controlled by the framing and sheathing’s thickness and tensile strength, fastener

31
spacing, and the wall’s aspect ratio. The proposed analytical model can be used to predict the
shear capacity of the CFS-SSSWs without failures in boundary studs or hold-downs. The failures
in boundary studs and hold-downs shall be successfully prevented if the designers follow the
design guidance by AISI S213 (2007) which requires that the chord studs and uplift anchorage
have the nominal strength to resist the lesser of the load that the system can deliver or the
amplified seismic load.
The proposed design approach is developed based on actual thicknesses and mechanical
properties of the test specimens. And it has been found that the actual mechanical properties of
specimens are generally greater than the nominal or design values specified by the industry.
AISI S213 (2007) requires a reduction factor be used for CFS shear walls with an aspect
ratio equal to or greater than 4 for the purpose of deflection control of slender walls. The
proposed effective strip model determines the nominal strength without aspect ratio reduction for
slender walls. Therefore the reduction factor in AISI S213 applies to the results calculated by the
proposed design approach.
In order to verify the validity of the effective strip model and the design equation,
published nominal shear strength values of CFS-SSSWs from Table C2.1-1 (wind) and Table
C2.1-3 (seismic) in AISI S213 (2007) are used to compare with the nominal shear strength
values determined based on the effective strip model and the proposed design equations. Table
3.5 shows the comparison of published nominal shear strength values with the values calculated
by using effective strip model.

32
Table 3.5 Comparison of nominal shear strength values (effective strip model)
Shear wall
Configuration
AISI S213
(2007) Table
C2.1-1 (plf)
AISI S213
(2007) Table
C2.1-3 (plf)
Predicted Vn
(plf)
2:1x33x18-6 485 390 399
4:1x43x27-4 1000 1000 785
4:1x43x27-3 1085 1085 891
4:1x43x27-2 1170 1170 1064
2:1x33x27-6 647 647 597
2:1x33x27-4 710 710 712
2:1x33x27-3 778 778 803
2:1x33x27-2 845 845 935
Table 3.5 is essentially equivalent to Table 3.1 except the predicted Vn in Table 3.5 is
replaced by calculated nominal shear strength values using effective strip model. The definition
of wall configuration is also previously defined in Figure 3.7. The design parameters are same as
the ones used in the comparison with strip model approach in section 3.1.3 the grade of steel
sheet sheathing and framing members is considered to be ASTM A1003 Grade 33, having
minimum yield strength of 33 ksi and tensile strength of 45 ksi. The sheathing-to-framing
fastener size is #8 as specified in AISI S213 (2007). Nominal values are used for sheathing and
framing material tensile strengths and screw diameters, and design values are used for sheathing
and framing thicknesses to determine the nominal shear strength of each wall configuration.
According to the results shown in Table 3.5, most of the estimated nominal shear strength
values are a little conservative or almost equivalent to the published values. Also, the developed
analytical model is able to capture the trends of the impacts of key parameters (e.g. screw
spacing, framing and sheathing material thickness, etc) to the shear wall strength.
A reliability analysis was also carried out to evaluate the proposed design approach by
following the provisions in Chapter F of AISI S100 (2007). The resistance factors, , for LRFD

33
approach can be determined in accordance with AISI S100 (2007) using a target reliability index,
β, of 2.5. The resistance factors, , can be determined as Equation 3.18.
√
(3.18)
where:
C = calibration coefficient (1.52 for LRFD);
Mm = mean value of material factor (1.0 for actual, 1.178 for nominal);
Fm = mean value of fabrication factor (1.0 for actual, 0.965 for nominal);
Pm = mean value of professional factor (1.000 for actual, 1.022 for nominal);
e = natural logarithmic base (2.718);
β = target reliability index (2.5);
VM = coefficient of variation of material factor (0.1 for actual, 0.085 for nominal);
VF = coefficient of variation of fabrication factor (0.05 for actual, 0.053 for nominal);
Cp = correction factor (1.022);
VP = coefficient of variation of test results (0.114 for actual, 0.131 for nominal);
VQ = coefficient of variation of load factor (0.21 for LRFD).
For the case in which actual material properties (yield stress, tensile strength, thickness)
are used (actual case), the values of Mm, VM, Fm, and VF were taken from Table F1 in AISI S100
(2007) for “Structural Members Not Listed Above”. For the case in which nominal and design
material properties were adopted (nominal case), the values of Mm and VM were determined by
taking the mean and the coefficient of variation of the ratios between the actual mechanical
properties and the nominal mechanical properties of the materials used in the 142 specimens.
Similarly, the factors regarding the effect of fabrication, Fm and VF for the nominal case were

34
determined by taking the mean and the coefficient of variation of the ratio between the actual
thickness and the design thickness of the materials used in the 142 specimens. According to the
reliability analysis, the resistance factors are 0.79 for the actual case and 0.90 for the nominal
case. Thus, it is recommended that the resistance factor of 0.79 be used when actual material
properties are used in the design and the resistance factor of 0.90 be used when nominal and
design material properties are used instead. The AISI S213 (2007) adopts an LRFD resistance
factor of 0.65 for wind load design and 0.60 for seismic design.
ASD safety factors were also calculated for both actual and nominal cases by following
the provisions in Chapter F of AISI S100 (2007) and using the following equation.
(3.19)
where Ω is the ASD safety factor and is the LRFD resistance factor previously
calculated in accordance with AISI S100 (2007). The safety factors for this method turned out to
be 2.00 for the actual case and 1.80 for the nominal case. The AISI S213 (2007) adopts an ASD
safety factor of 2.00 for wind load design and 2.50 for seismic design. The summary of the
resistance factors and safety factors for this proposed design method is presented in Table 3.6.
Table 3.6 Summary of resistance factors and safety factors (effective strip model)
Design
Philosophy
Loading
Type AISI S213
Effective Strip Method
Actual Nominal
LRFD Resistance
Factor ()
Wind 0.65 0.79 0.90
Seismic 0.60
ASD Safety
Factor (Ω)
Wind 2.00 2.00 1.80
Seismic 2.50

35
The developed analytical model offers an accurate and reliable method to predict the
nominal strength of CFS-SSSWs. The new approach provides designers an analytical way of
determining the shear wall capacities without carrying out full-scale physical testing.
3.5 Summary
An analytical model – effective strip model is proposed in this thesis to predict the
nominal strength of CFS-SSSWs. The proposed design approach shows consistent agreement
with experimental results. The design equations are developed by using actual material and
mechanical properties of the framing members. Further analyses indicate that the nominal
material properties can also be used in the proposed equations to provide reliable shear wall
strength. The resistance factors are calculated for both cases. The developed design equations
provide designers an analytical tool to calculate the nominal strength of CFS-SSSWs without
conducting full-scale shear wall tests.
36
CHAPTER 4
ANALYTICAL MODEL AND DESIGN METHOD FOR CFS SHEAR WALLS USING
WOOD-BASED PANEL SHEATHING
4.1 Literature Review
Previously conducted experimental studies and analytical design approach of CFS framed
wood-based panel shear walls (CFS-WPSWs) are reviewed in this section. Also, applicability of
the proposed analytical model for CFS-SSSWs (effective strip model) to CFS-WPSWs is studied.
4.1.1 Previously Conducted Experimental Studies
Many researchers have conducted experimental investigations of CFS-WPSWs in the last
20 years. A testing program to investigate the behavior of CFS framed shear walls sheathed with
plywood, OSB, and gypsum wallboard (GWB) was set by AISI’s shear wall task committee and
performed by Serrette et al. (1996a, b) and Serrette (1997). This test program was divided in
three phases. The primary purpose of phase 1 was to investigate the differences in static
performance of plywood (15/32 in. American Plywood Association (APA) rated 4-ply) and OSB
(7/16 in. APA rated) sheathed shear walls. In phase 2, the main objectives were to capture the
characteristics of OSB sheathed walls with tighter fastener schedules, shear walls sheathed with
OSB on one side and GWB on the other side, and shear walls with GWB on both sides under
monotonic loading. The final phase of the test program focused on the cyclic testing of 4 ft. × 8
ft. OSB and plywood sheathed shear walls with different fastener spacing schedules.
The behavior of the OSB and plywood shear walls was found to be essentially identical
for both monotonic and cyclic loading case. However, it was noted that the resistance of
plywood shear walls was slightly greater in general. The dominant mode of failure was
unzipping of the wall panel as a result of the panel being pulled over the screw heads. It was
noted that the walls lost their load carrying capacity immediately after the screw pull-over failure.
37
Only three instances of screw pull-out from the stud flanges were observed in the entire test
program.
Serrette (1997b) initiated a new test program in order to provide wider range of design
options and verify some of the test results from Serrette (1996a, b) and Serrette (1997). The
testing program was divided into five phases in which various materials were employed as
sheathing: plywood, OSB, flat strap X-brace, and sheet steel. In phase 1, the main objective was
to investigate the performance of 4 ft. × 8 ft. 15/32 in. plywood and 7/16 in. OSB shear walls
framed with 0.033 in. studs. The sheathing was fastened to the framing with screws at 3 in. and 2
in. spacing. In phase 2, the main goal was to establish the limit on framing member thickness for
sheathing attached with No. 8 screws. Same configuration and sheathing materials as phase 1
were employed except for the thickness of the studs (up to 0.054 in.). Phase 3 and 4 investigated
the performance of shear walls with flat strap X-brace and sheet steel as sheathing materials.
Finally, phase 5 investigated the behavior of shear walls with OSB and plywood with high aspect
ratio (4:1).
With respect to CFS-WPSWs (OSB and plywood), Serrette (1997b) concluded that the
wall assemblies with thicker framing members and tighter fastener spacing yielded greater shear
resistance. The failure of the shear walls usually resulted from a combination of pull-over and
pull-out of the screws. Also, Serrette et al. (1997b) noted that shear failure in screws was
identified in the assemblies with 0.054 in. framing members.
In 2003, a test program of CFS-WPSWs was conducted at McGill University in Canada
to assemble a large pool of data for different wall configurations constructed with Canadian steel
and sheathing products, and the total of 109 shear wall specimens were tested under monotonic

38
and cyclic loading. The result of the test program was reported in Branston (2004), Chen (2004),
and Boudreault (2005).
Branston (2004) performed 43 out of 109 tests. The test specimens were sheathed with
15/32 in. (12.5 mm) Douglas Fir Plywood (DFP) and Canadian Soft Plywood (CSP), as well as
7/16 in. (11 mm) performance rated OSB. Branston (2004) also reviewed existing data
interpretation techniques and proposed an appropriate method for the analysis of all the data
from the test program. The use of equivalent energy elastic-plastic (EEEP) method (originally
developed by Park (1989) and further refined by Foliente (1996)) was recommended to
determine the design parameters for in-plane stiffness and strength.
Chen (2004) conducted a total of 46 monotonic and cyclic testing of CFS framed shear
walls sheathed with 15/32 in. CSP and 7/16 in. OSB. He investigated characteristics of the walls
by evaluating the important design parameters by using the method recommended by Branston
(2004). The design parameters included ultimate shear strength and yield strength, elastic
stiffness, energy dissipation capacity and ductility, load capacity related to relative deflection,
and steel chord capacity under compression. He also reviewed existing analytical models of
wood framed wood–based panel sheathed shear walls and developed an analytical model of CFS
framed wood-based panel sheathed shear walls to theoretically calculate the resistance and lateral
deflection.
Boudreault (2005) reviewed existing reversed cyclic loading protocols for light framed
shear walls in order to select the most appropriate protocol to be used in the test program.
CUREE reversed cyclic loading protocol (Krawinkler et al., 2000; ASTM E2126, 2005) was
selected to be incorporated in the test program and the remaining 20 tests of CFS shear walls
with 15/32 in. DFP and CSP sheathing were carried out.

39
Branston (2004), Chen (2004), and Boudreault (2005) reported that the dominant mode of
failure of the wall specimen involved CFS framing-to-sheathing screw connections. In most of
the cases, bearing surface of the wood panel at screw connections were crushed by the screw
heads, and the screws were pulled through the sheathing. Tear-out of the wood sheathing was
another common failure, and usually occurred at panel edges and especially at the corners of the
wall. A few instances of shear failure of the screws were identified especially at the corner
locations of the walls. Surprisingly, no pull-out failure of the screws was identified in the entire
test program.
In 2004, another test program of CFS-WPSW was conducted at McGill University to add
more data for different wall configurations, and the total of 43 shear wall specimens were tested
under monotonic and cyclic loading. The result of the test program was reported in Rokas (2006)
and Blais (2006). In the research by Branston (2004), Chen (2004), and Boudreault (2005), the
thickness of OSB sheathing was 7/16 in., and the thickness of DFP and CSP was 15/32. Rokas
(2006) and Blais (2006) employed 3/8 in. OSB, DFP, and CSP. Blais (2006) tested 18 specimens
with 3/8 in. OSB sheathing, and Rokas (2006) tested 25 specimens with 3/8 in. DFP and CSP
sheathing under monotonic and cyclic loading.
In Rokas (2006) and Blais (2006), failure modes of the shear wall assemblies were very
similar to the ones reported by Branston (2004), Chen (2004), and Boudreault (2005). Pull-over
of screws and tear-out of the wood panel or the combination of those two were the most common
cases. Shear failure in screws was also reported in a few instances.
In 2010, a test program of CFS-WPSWs was initiated and conducted by Dr. Cheng Yu
and his students at University of North Texas to verify the published values of nominal strength
provided in the tables C2.1-1 and C2.1-2 by AISI S213 (2007) and to propose shear strength

40
values of different wall configurations not listed in those tables. Li (2012) reported results of this
test program for 36 shear walls sheathed with 7/16 in. OSB tested under both monotonic and
cyclic loading protocols. In this test program, for OSB sheathed shear walls, in most cases, the
bearing failure of the sheathing panel initiated the screws to be pulled though the sheathing. Also,
sheathing bearing failure caused the edge tear-out, and shear failure of screws was also
frequently observed. For some wall specimens with 2 in screw spacing, shear failure in the
sheathing and buckling of chord studs were identified. Screw pull-out failure was rarely observed.
In the test program at UNT, 10 shear walls with plywood sheathing were also tested
under monotonic and cyclic loading. The test results are included in the Appendix D of this
thesis. These data will be incorporated in the development of the analytical model of CFS-
WPSWs as well. For plywood sheathed shear walls, similar failures as OSB sheathed shear walls
(pull-through, sheathing edge tear-out, and screw shear) were observed. Also, splits of the
sheathing through the line of screw connections were identified in many cases regardless of the
direction of the grain.
4.1.2 Related Analytical Models
As mentioned earlier, Chen (2004) reviewed existing analytical models of wood framed
shear wall using wood-based panel sheathing. He reviewed several analytical models, but based
on the assumption and applicability to CFS shear walls, he picked five models by Tuomi and
McCutcheon (1978), Easley et al. (1982), and Kallsner and Lam (1995) to be further analyzed.
These models are used to predict the lateral load capacity at yield shear strength level by using
the EEEP method, and these values were compared with the shear resistance values recorded in
his tests and the tests performed by Branston (2004) and Boudreault (2005).

41
Tuomi and McCutcheon (1978) developed an analytical model of wood framed shear
walls to calculate the racking resistance of sheathing panels. The primary assumptions and
limitations employed in this model are:
1. The entire external work is dissipated by the distortion of the fasteners at the
sheathing-to-framing connections.
2. The lateral load versus displacement curve of single sheathing-to-framing
connection is linear.
3. When lateral force is applied, the framing behaves as a parallelogram, but the
sheathing stays rigid.
4. Spacing of the fasteners is even and in symmetry.
5. The speed of loading is slow enough so that the dynamic and impact effects are
disregarded.
6. The fasteners at the four corners of the wall are free to rotate along the lines of the
sheathing’s diagonal.
Easley et al. (1982) developed closed form equations to determine the strength of wood
framed shear walls based on the deformation pattern of the wall specimens in actual testing. In
this model, sheathing panels also become parallelogram along with the framing when lateral load
is applied. The following is the assumptions and limitations of this model:
1. The forces experienced in the panel edges have horizontal and vertical
components. The horizontal components of the forces are uniform, but the vertical
components are proportional to the distance from the center of the panel.
2. The lateral load versus displacement curve of single sheathing-to-framing
connection is linear.

42
3. Spacing of the fasteners is even and in symmetry
Kallsner and Lam (1995) developed three analytical models of wood framed shear walls
in which, one is elastic and the other two are plastic models.
In the elastic model, the deformation and shear capacity of the walls were calculated
based on the principal of minimum potential energy. The following assumptions and limitations
are considered:
1. The framing members are rigid and hinged to each other.
2. The sheathing panel is rigid and free to rotate.
3. The lateral load versus displacement curve of sheathing-to-framing connection is
linear.
4. Relative displacements between the framing and the sheathing are considered
very small compared to the dimension of the wall.
5. The displacements of the center of the framing and the sheathing are the same,
and there is no relative displacement between them.
In the first plastic model, lower bound model, the following assumptions and limitations
are considered:
1. The lateral load versus displacement curve is completely plastic.
2. All the edge fasteners convey the same amount of force except for the ones at the
corners of the wall.
3. Fasteners on top and bottom track carry only horizontal force, fasteners on
boundary studs carry only vertical force, and fasteners at the corners of the wall
carry half of both horizontal and vertical forces.

43
The second plastic model, upper bound model considers the following as assumption and
limitations:
1. Each framing member has its own rotational center.
2. The framing members are hinged to each other.
3. All fasteners reach their plastic capacity at the same time.
4.1.3 Capacity of Individual Sheathing-to-Framing Connection
As indicated in the previous sections, it is essential to know the capacity of individual
sheathing-to-framing connections for all the previously discussed analytical models in order to
calculate the resistance of shear wall assemblies. Unlike, steel sheathing-to-steel framing screw
connection capacity, calculation method of wood panel-to-steel framing connection capacities is
not codified. Therefore, Okasha (2004) performed monotonic and cyclic tests of wood sheathing
panel-to-steel framing connection by using the same sheathing and framing materials used in the
test program by Branston (2004), Chen (2004), and Boudreault (2005).
The test specimen matrix was setup in a way that reflects all the connection
configurations used in the full scale shear wall testing. The wood panel sheathing type included
DFP, CSP, and OSB. The sheathing thickness included 3/8 in. and 15/32 in. DFP and CSP and
3/8 in. and 7/16 in. OSB. The framing thickness covered 0.033 in., 0.043 in., 0.054 in., and 0.068
in. Also, orientation of the loading with respect to the grain of the sheathing material and fastener
edge distance were considered (0.24 in., 0.37 in., 0.5 in., 0.63 in., and 1.0 in.).
The monotonic tests were performed according to the ASTM Standard D1761 (1988),
and the cyclic tests were performed in accordance with CUREE protocol. Two failure modes
were reported. The first was screw pull-through from the sheathing, and the second was

44
sheathing tear-out at the edge. No screw pull-out failure was observed in the entire test program.
It was also noted that the connection capacity of specimens loaded perpendicular to the grain of
sheathing was consistently higher than the capacity of specimens loaded parallel to the grain.
Also, based on the initial evaluation of monotonic test results, the shear resistance estimated with
the connection test with 1.0 in. screw edge distance had greater match with the shear resistance
values obtained from the full scale tests. Thus, the capacity of the connections of parallel-to-
grain specimens with 1.0 in. screw edge distance was employed as the connection property to be
utilized in the analysis of shear walls in Chen (2004). The results of the monotonic tests and
cyclic tests by Okasha (2004) that were considered relevant to this research are listed in Table
4.1 and Table 4.2 respectively.
Table 4.1 Monotonic test results of sheathing-to-framing connection (Okasha, 2004)
Specimen ID Max Load (lb) EEEP Yield Load (lb)
CSP 391 334
OSB 440 369
DFP 643 532
Table 4.2 Cyclic test result of sheathing to framing connection (Okasha, 2004)
Specimen ID Max Load (lb) EEEP Yield Load (lb)
CSP 501 495
OSB 484 440
DFP 716 626
The shear resistance of the connections for cyclic tests is much higher than the one from
monotonic test. Chen (2004) explained this with two reasoning. The first is the difference in
loading protocol. The loading speed in cyclic tests is much faster compared to the monotonic
loading. The second is the inconsistency in the sheathing material properties. It was noted that
these two effects may have been more significant when only single connections were tested.

45
Thus, in order to achieve more rational and conservative prediction of the strength of the walls,
Chen (2004) employed the results from monotonic connection tests to estimate the shear strength
of walls for both monotonic and cyclic cases.
4.1.4 Chen (2004) – Simplified Strength Model (SSM)
By reviewing the assumptions, limitations, and formulation of the existing analytical
models, Chen (2004) concluded that the analytical approach of wood framed wood panel shear
walls can be applied to CFS framed wood-based panel shear walls. Chen (2004) adapted elastic
model approach by Kallsner and Lam (2004) and simplified its assumptions and limitations in
order to apply them to CFS framed shear walls with wood-based panel sheathing. The following
is the list of assumptions formulated by Chen (2004) as the bases of a simplified analytical model,
namely, simplified strength model.
1. Framing studs and tracks remain rigid and are hinged to each other.
2. Wood-based panels stay rigid throughout the loading process as well.
3. The lateral load versus displacement curves of the sheathing-to-framing
connections are idealized as bilinear EEEP curves.
4. The relative displacements between the sheathing and framing are small
compared to the entire shear wall dimension, and the wood sheathing and steel
framing do not separate from each other throughout the loading process.
5. No relative displacement exists between the center of the sheathing panel and the
corresponding location of the framing, so the origin of the established coordinate
system on the panel and on the framing will be identical throughout the loading
process.

46
6. Sheathing panel will not be joined to adjacent panels, meaning that the height of
the sheathing corresponds to the height of the framing.
7. Rotation of the bottom track is prevented by full anchoring of the wall to the
lower level support.
8. The entire external work done by the lateral loading is completely dissipated by
the distortion of the sheathing-to-framing connection.
9. The sheathing-to-framing connection capacity is the same in all directions.
Figure 4.1 shows the relative displacement of the sheathing panel to the steel framing
members based in the assumptions formulated by Chen (2004). The boundary studs rotate about
the bottom base by the angle of γ, and the entire framing forms the parallelogram. Whereas, the
sheathing panel remains rigid and rotates about its original center by the angle of φ. The
resulting force distribution of sheathing-to-framing connections is presented in Figure 4.2.

47
Figure 4.1 Force distribution in frame members (Chen, 2004)
Figure 4.2 Force distribution in sheathing-to-framing connections (Chen, 2004)

48
Assuming that clockwise rotation is positive, the displacement of the framing relative to
the sheathing at any point is given by the following equations. (Given that horizontal direction if
X-axis and vertical direction is Y-axis)
Along X-axis: (4.1)
Along Y-axis: (4.2)
where:
u = relative displacement of the framing to the sheathing panel in X direction;
uframe = displacement of the framing in the X direction;
upanel = displacement of the sheathing panel in the X direction
v = relative displacement of the framing to the sheathing panel in the Y direction;
vframe = displacement of the framing in the Y direction;
vpanel = displacement of the sheathing panel in the Y direction
x = X coordinate of the location in concern relative to the original center of the
sheathing panel;
y = Y coordinate of the location in concern relative to the original center of the
sheathing panel.
The force in each sheathing-to-framing connection can be broken into X and Y
components and expressed as:
(4.3)
(4.4)
where:
Sxi,conn = X component of the force in sheathing-to-framing connections;

49
Syi,conn = Y component of the force in sheathing-to-framing connections;
i = the number of the fasteners;
k = the shear stiffness of sheathing-to-framing connections.
The sum of the potential energy based on the shear distortion of the entire sheathing-to-
framing connections can be expressed as:
∑
(4.5)
where:
U1 = the sum of the potential energy due to the shear distortion of the entire sheathing-
to-framing connections;
N = the total number of the sheathing-to-framing connections.
The potential energy based on the displacement caused by the applied lateral load is
expressed as:
(4.6)
where:
F = the applied lateral load at the top of the shear wall;
H = the height of the shear wall.
By substituting Equations 4.3 and 4.4 into Equation 4.5 and summing the Equations 4.5
and 4.6, the total potential energy stored in the shear wall system can be determined by the
following expression:
∑ { [
] } (4.7)
By taking partial derivatives of the above expression in terms of γ and φ and applying the
principle of minimum potential energy, the resulting expressions are set to equal zero:

50
and
(4.8)
Solving the above expressions, the resultant expressions are the following:
∑
(4.9)
[ ∑ ∑
] (4.10)
Again, solving the above expressions and equating them with respect to γ and φ, the
following expressions are derived:
(
∑
∑
) (4.11)
∑
(4.12)
Now, substituting Equations 4.11 and 4.12 into Equations 4.3 and 4.4, the each force
component can be expressed without shear stiffness of sheathing-to-framing connections:
∑
(4.13)
∑
(4.14)
The resultant force of the sheathing-to-framing connections can be expressed as:
√
√(
∑
)
(
∑
)
(4.15)
where:
Si,conn = the resultant force in the sheathing-to-framing connections.

51
The maximum force is experienced at the farthest locations from the origin of the
sheathing panel, which are the four corners of the wall panels, and the maximum force can be
expressed as:
√(
∑
)
(
∑
)
(4.16)
where:
Smax,conn = the maximum force experienced in the sheathing-to-framing connections
at the four corners of the wall;
xmax = X coordinate of the sheathing-to-framing connections at the four corners of the
shear walls;
ymax = Y coordinate of the sheathing-to-framing connections at the four corners of the
shear walls.
In simplified strength model, the failure of a shear wall assembly is determined when the
maximum connection force reaches its design capacity, Sy,conn, so the shear capacity of the entire
wall assembly, Sy,wall can be expressed as:
√(
∑
)
(
∑
)
(4.17)
Also, it is reasonable to assume that the ultimate capacity of a shear wall assembly, Su,wall
can be characterized by the ultimate capacity of sheathing-to-framing connections, Su,conn. Thus,
the ultimate capacity of a shear wall can be expressed as:
√(
∑
)
(
∑
)
(4.18)

52
It is worth noting that the shear capacity of a shear wall assembly is determined based on
the wall height, configuration of the edge fasteners, and shear capacity of individual sheathing-
to-framing connection. Equations 4.11 to 4.17 were originally presented by Kallsner and Lam
(1995).
4.1.5 Chen (2004) – Comparison of Shear Wall Capacity
In order to verify the accuracy and reliability of Kallsner’s and Lam’s elastic model
(simplified strength model), Chen (2004) performed comparisons between the shear capacity
values from full scale testing and the values predicted by the analytical models. By using the
connection test data (Table 4.1) by Okasha (2004), shear capacities of the walls were estimated
at its yield capacity level and ultimate capacity level (Sy,wall and Su,wall respectively). The
estimated shear wall capacities were then compared to the shear capacity values obtained from
Branston (2004), Chen (2004), and Boudreault (2005). The total of 32 wall configurations was
considered in this comparison, which covered 103 out of 109 shear wall specimens. Also, the
same comparison was conducted for the other analytical models including upper and lower
bound models by Kallsner and Lam (1995) and models by Easley (1982) and Tuomi and
McCutcheon (1978). Table 4.3 shows the result of the comparison including the ratio of full
scale test value to estimated value and other statistical results.

53
Table 4.3 Comparison of testing-to-predicted shear capacity ratio (Chen, 2004)
Loading
Type
Capacity
Limit
Kallsner and Lam (1995)
Elastic Model
Kallsner and Lam (1995)
Lower Plastic Model
Kallsner and Lam (1995)
Upper Plastic Model Easly (1982)
Tuomi and McCutcheon
(1978)
Ratio SD COV Ratio SD COV Ratio SD COV Ratio SD COV Ratio SD COV
Monotonic EEEP 1.050 0.122 0.116 1.022 0.120 0.117 0.927 0.098 0.106 1.336 0.152 0.114 1.025 0.132 0.129
Max Load 0.918 0.117 0.128 0.900 0.119 0.133 0.835 0.129 0.155 1.142 0.127 0.112 0.902 0.127 0.140
Cyclic EEEP 1.012 0.129 0.127 0.985 0.125 0.126 0.893 0.107 0.120 1.288 0.162 0.126 0.988 0.135 0.136
Max Load 0.885 0.122 0.137 0.868 0.123 0.141 0.806 0.138 0.171 1.102 0.141 0.128 0.869 0.128 0.148

54
At EEEP yield capacity level, Kallsner’s and Lam’s elastic model, lower bound plastic
model, and Tuomi’s and McCutcheon’s model show good agreements between the tested and the
predicted. However, the elastic model shows slightly conservative ratios and is consistent in both
monotonic and cyclic cases. The ratios show that the upper bound plastic model overestimates
and Easley’s model underestimates the predicted values. Based on the statistical analysis results
as well as the given assumptions and limitations of the model, Chen (2004) concluded that
Kallsner’s and Lam’s elastic model was the best model to be used to predict the shear yield
capacity of CFS-WPSWs. At the ultimate load level, most of the models overestimate the
predicted values. Still, the elastic model gives fairly decent prediction at the ultimate load level
among all the models compared.
Since one of the primary objectives of the research by Chen (2004) was to develop an
analytical model of CFS-WPSWs to predict the shear resistance at its yield capacity, he did not
give any conclusion about which model is suitable for predicting the shear wall lateral load
capacity at its ultimate load level. However, combined with the statistical results by Chen (2004),
the assumptions and limitations of the simplified strength model seem reasonable to be applied to
CFS-WPSWs at their ultimate capacity level. Later in this research, the simplified strength
model will be used as a base model to develop an analytical model for CFS-WPSWs.
4.2 Screw Connection Test – UNT Shear Wall Testing Program
As mentioned in the previous sections, the failures of CFS-WPSWs mainly occur at
sheathing-to-framing connections. All the previously discussed analytical models require the
capacity of individual sheathing-to-framing connections to be used to predict the shear capacity
of the entire shear wall assembly. As noted earlier, Chen (2004) utilized the experimental data of
connection tests done by Okasha (2004) to estimate the shear capacities of CFS-WPSWs of

55
different configurations and compared the results with the values obtained from the full scale
tests by Branston (2004), Chen (2004), and Boudreault (2005). In Okasha (2004), the connection
test specimens covered the entire connection configurations used in the tests.
Earlier in the literature review section of previously conducted full scale shear wall tests,
a test program conducted at UNT was introduced. The data from this test program was later
incorporated in this research for the development of an analytical model of CFS-WPSWs to
estimate the shear resistance at their ultimate shear capacity. However, in order to do so, it was
necessary to determine the shear capacity of individual sheathing-to-framing connections.
Furthermore, it was important to cover all the connection types used in the test program at UNT.
In the connection tests done by Okasha (2004), cyclic loading case constantly resulted in
greater capacity than monotonic loading case. In order to achieve more consistent prediction of
full scale shear wall strength, Chen (2004) adapted only the monotonic connection test results
and applied them to his analytical approach in both monotonic and cyclic loading cases. Thus,
only monotonic connection tests were performed at UNT.
4.2.1 Test Setup
A total of 48 OSB and 24 plywood connection tests were performed under monotonic
loading on 20 kip INSTRON® 4482 universal testing machine at UNT. The testing was
conducted under displacement control mode with a loading rate of 0.3 in/min. The machine is
connected to a PC, and during the testing, the machine provides digital reading of the applied
force and displacement. Figure 4.3 shows the testing machine and its typical test setup with an
OSB connection specimen installed.

56
Figure 4.3 Typical set up of a test specimen
The specimen is held to the bottom table by two clamps and is connected to the upper
holder with five screws.
4.2.2 Test Specimen
For OSB connection tests, specimens were constructed with APA rated 7/16 in. OSB
(24/16 span rating, exposure I) and 0.043 and 0.054 in. studs and tracks. For plywood connection
tests, specimens were constructed with APA rated 15/32 in. 4-ply (32/16 span rating, structural I,
exposure I) and 0.043 in. studs and tracks. Studs and tracks were placed web side down on the
bottom table, and wood panels were set down flush to the bottom table and screwed to the stud
or track at approximately half distance of the flange with No. 8 x 1.0 screws. The effect of the
grain direction of sheathing panels was also considered in the development of test matrix. Figure
4.4 shows the close up of a plywood connection specimen from front and back. Also, Table 4.4
shows the test matrix of the entire connection test program.

57
Figure 4.4 Close-up of a connection test specimen
Table 4.4 Test matrix of sheathing-to-framing connection test
Test ID Sheathing Type
Member
Thickness
(in.)
Orientation of
Grain # of Tests
43-S-OSB-V
APA rated
7/15 in. OSB
24/16 span rating
Exposure I
43 mil Stud Vertical 6
43-S-OSB-H Horizontal 6
43-T-OSB-V 43 mil Track
Vertical 6
43-T-OSB-H Horizontal 6
54-S-OSB-V 54 mil Stud
Vertical 6
54-S-OSB-H Horizontal 6
54-T-OSB-V 54 mil Track
Vertical 6
54-T-OSB-H Horizontal 6
43-S-Ply-V APA rated
15/32 in. 4-ply
32/16 span rating
Structural I
Exposure I
43 mil Stud Vertical 6
43-S-Ply-H Horizontal 6
43-T-Ply-V 43 mil Track
Vertical 6
43-T-Ply-H Horizontal 6

58
Each configuration was tested six times, and the average value of the ultimate shear
capacities from the six identical tests was taken as the ultimate shear capacity of the given
configuration. The definition of the test ID is presented in Figure 4.5.
Figure 4.5 Definition of test ID (connection test)
4.2.3 Test results
The result of the connection tests is summarized in Table 4.5. For each configuration,
average value of the ultimate capacities recorded in the tests is presented in the second column
from the left.
Table 4.5 Result of sheathing-to-framing connection tests
Test ID Average Ultimate
Shear Capacity (lb)
ESM Connection
Shear Capacity (lb)
SSM Connection
Shear Capacity (lb)
43-S-OSB-V 619 619
619 43-S-OSB-H 721
43-T-OSB-V 651 625
43-T-OSB-H 625
54-S-OSB-V 676 676
676 54-S-OSB-H 680
54-T-OSB-V 755 739
54-T-OSB-H 739
43-S-Ply-V 606 606
606 43-S-Ply-H 802
43-T-Ply-V 638 619
43-T-Ply-H 619
It is worth noting that the direction of the grain did not seem to affect the difference in the
strength of the connections or at least there was no sign of such trends in this test program.

59
However, it was obvious that the connections with a thicker framing material yielded higher
resistance consistently. These connection shear capacity values are later used along with
previously discussed analytical models (effective strip model and simplified strength model) to
estimate the ultimate shear capacity of CFS-WPSWs. The effective strip model requires three
different types of connection capacities (connection with its screw connecting sheathing and stud,
sheathing and track, and sheathing and both stud and track). The second column from the right in
Table 4.5 shows the connection shear capacity values to be used in the effective strip model. The
smaller of the shear capacity values between vertical and horizontal grains is used. The greater
value between the connection capacity for the stud and track is used for the shear capacity of the
connection that is penetrating both stud and track. The simplified strength model assumes that
the shear capacity of sheathing-to-framing is same in all direction and also its difference is
minimal between connections on track and stud. Therefore, the smaller value from the ESM
connection shear capacity is employed for the values to be used in SSM as shown in the right
column of Table 4.5.
The failure modes observed in these tests were fairly consistent with the ones identified
in the full scale test program. For OSB connections, sheathing edge tear-out and shear failure of
the screw was by far the most observed failure modes. Pull-through failure was rarely seen, but
pull over failure was never observed in the test. For plywood connections, shear failure in screw
and sheathing edge tear-out were also the dominant modes of failure. Also, split of the sheathing
through the location of the screw was seen in some specimens.
4.3 Effective Strip Model
In chapter three, the effective strip model was developed to predict the nominal shear
capacity of CFS-SSSWs. When a shear wall assembly is under lateral loading, the steel sheet

60
sheathing undergoes out-of-plane elastic buckling and create diagonal tension field. The effective
strip model assumes that the diagonal tension field (effective strip) is responsible for carrying the
entire tension force experienced in the sheathing. Thus, the ultimate shear capacity of a shear
wall assembly is limited by the yield capacity of the effective strip or the capacity of sheathing-
to-framing connections within the effective strip.
Mechanical properties between steel sheet sheathing and wood-based panels are
completely different. Steel sheet sheathing is thin, flexible, and subject to out-of-plane buckling
throughout the loading process. On the other hand, a wood-based panel stays rigid and shows
minimal deformation across the panel. However, some of their failure modes are similar, and
failures related to sheathing-to-framing connections are reported for both steel sheet and wood-
based panel shear walls from previously discussed full scale testing programs. Besides, often
times, sheathing-to-framing connection failures of wood-based panel shear walls are also
identified at the corners of the walls, which could possibly be the region within its effective strip
width. Therefore, in this section, assumptions and limitations of the effective strip model
approach are employed to investigate if design equations of the effective strip width for CFS-
WPSWs can be developed.
As discussed earlier in chapter three, in order to estimate the nominal shear strength of
the shear walls, it is necessary to know the width of the effective strip. Similar method employed
in chapter three will be used to develop the design equations to estimate the effective strip width.
The total of 179 full scale shear wall test data (93 monotonic and 86 cyclic) from Branston
(2004), Chen (2004), Boudreault (2005), Rokas (2006), Blais (2006), and the test program
conducted at UNT (Li, 2012) are incorporated in this research to develop and verify the design
equations. The test data from Serrette et al. (1996a, b, 1997a, and b) was not included in the

61
analysis since the sheathing-to-framing connection capacities of the tested specimens were not
reported in these test programs. The list of test data used in this research is presented in Table 4.6.
Also, the definition of test specimen label is presented in Figure 4.6.
Table 4.6 List of test data label (wood-based panel shear wall)
Monotonic Cyclic
OSB
UNT
8x2x43xOSB-2-M-2 8x2x43xOSB-2-C-2
8x2x43xOSB-6-M-2
8x2x43xOSB-6-C-2
8x2x54xOSB-2-M-2
8x2x54xOSB-2-C-1
8x4x43xOSB-2-M-2
8x4x43xOSB-2-C-2
8x4x43xOSB-6-M-2
8x4x43xOSB-4-C-2
Branston
(2004)
8x4x43xOSB-6-M-3 8x4x43xOSB-6-C-2
8x4x43xOSB-4-M-3
8x4x43xOSB-6-C-3
8x4x43xOSB-3-M-3
8x4x43xOSB-4-C-3
Chen
(2004)
8x2x43xOSB-6-M-3 8x4x43xOSB-3-C-3
8x2x43xOSB-4-M-3
8x2x43xOSB-6-C-3
Blais
(2006)
8x4x43xOSB-6-M-3 8x2x43xOSB-4-C-3
8x4x43xOSB-4-M-3
8x4x43xOSB-6-C-3
8x4x43xOSB-3-M-3
8x4x43xOSB-4-C-3
Plywood
UNT 8x4x43xPLY-2-M-2 8x4x43xOSB-3-C-3
8x4x43xPLY-6-M-2
8x4x43xPLY-2-C-2
Chen
(2004)
8x2x43xCSP-6-M-3
8x4x43xPLY-4-C-2
8x2x43xCSP-4-M-3 8x4x43xPLY-6-C-2
8x8x43xCSP-6-M-3
8x2x43xCSP-6-C-3
8x8x43xCSP-4-M-6
8x2x43xCSP-4-C-3
8x8x43xCSP-3-M-3
8x8x43xCSP-6-C-3
Boudreault
(2004)
8x4x43xCSP-4-M-6
8x8x43xCSP-4-C-3
8x4x43xDFP-4-M-4 8x8x43xCSP-3-C-4
Branston
(2004)
8x4x43xCSP-6-M-3
8x4x43xCSP-4-C-3
8x4x43xCSP-3-M-3 8x4x43xDFP-4-C-3
8x4x43xDFP-6-M-3
8x4x43xCSP-6-C-3
8x4x43xDFP-3-M-3
8x4x43xCSP-3-C-3
Rokas
(2006)
8x4x43xCSP-6-M-6
8x4x43xDFP-6-C-3
8x4x43xCSP-4-M-6 8x4x43xDFP-3-C-4
8x4x43xCSP-3-M-3
8x4x43xCSP-6-C-3
8x4x43xCSP-4-C-3
8x4x43xCSP-3-C-4
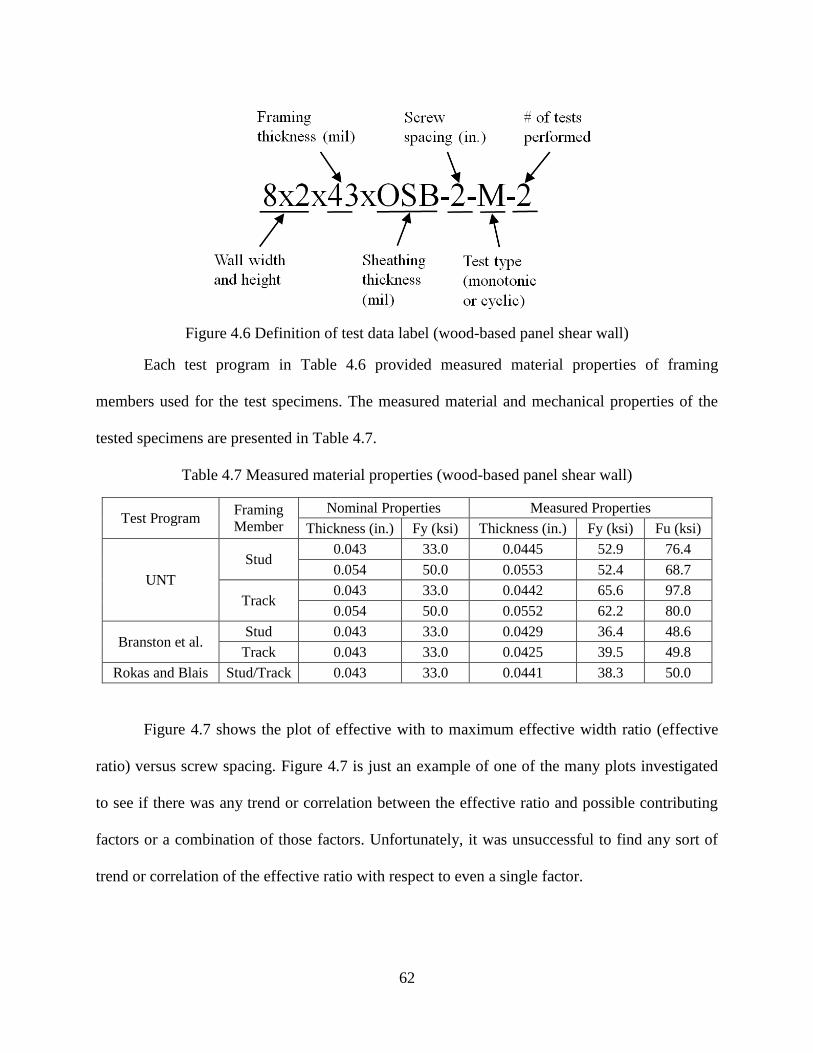
62
Figure 4.6 Definition of test data label (wood-based panel shear wall)
Each test program in Table 4.6 provided measured material properties of framing
members used for the test specimens. The measured material and mechanical properties of the
tested specimens are presented in Table 4.7.
Table 4.7 Measured material properties (wood-based panel shear wall)
Test Program Framing
Member
Nominal Properties Measured Properties
Thickness (in.) Fy (ksi) Thickness (in.) Fy (ksi) Fu (ksi)
UNT
Stud 0.043 33.0 0.0445 52.9 76.4
0.054 50.0 0.0553 52.4 68.7
Track 0.043 33.0 0.0442 65.6 97.8
0.054 50.0 0.0552 62.2 80.0
Branston et al. Stud 0.043 33.0 0.0429 36.4 48.6
Track 0.043 33.0 0.0425 39.5 49.8
Rokas and Blais Stud/Track 0.043 33.0 0.0441 38.3 50.0
Figure 4.7 shows the plot of effective with to maximum effective width ratio (effective
ratio) versus screw spacing. Figure 4.7 is just an example of one of the many plots investigated
to see if there was any trend or correlation between the effective ratio and possible contributing
factors or a combination of those factors. Unfortunately, it was unsuccessful to find any sort of
trend or correlation of the effective ratio with respect to even a single factor.
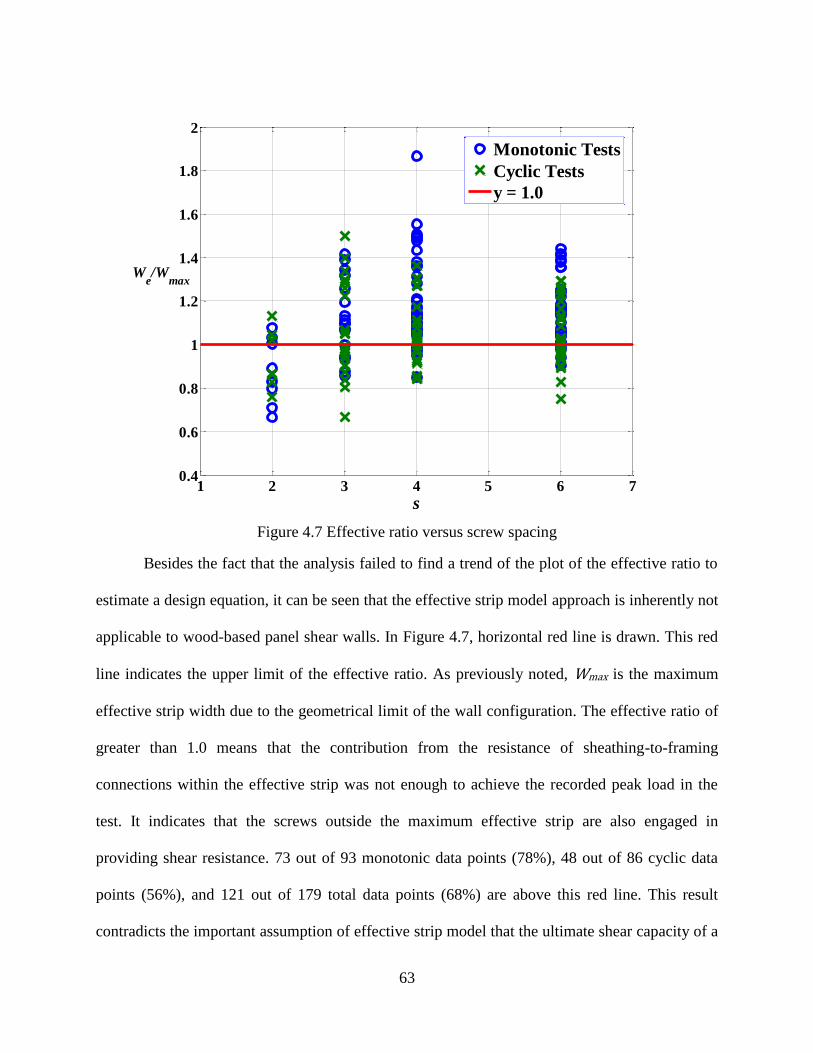
63
Figure 4.7 Effective ratio versus screw spacing
Besides the fact that the analysis failed to find a trend of the plot of the effective ratio to
estimate a design equation, it can be seen that the effective strip model approach is inherently not
applicable to wood-based panel shear walls. In Figure 4.7, horizontal red line is drawn. This red
line indicates the upper limit of the effective ratio. As previously noted, Wmax is the maximum
effective strip width due to the geometrical limit of the wall configuration. The effective ratio of
greater than 1.0 means that the contribution from the resistance of sheathing-to-framing
connections within the effective strip was not enough to achieve the recorded peak load in the
test. It indicates that the screws outside the maximum effective strip are also engaged in
providing shear resistance. 73 out of 93 monotonic data points (78%), 48 out of 86 cyclic data
points (56%), and 121 out of 179 total data points (68%) are above this red line. This result
contradicts the important assumption of effective strip model that the ultimate shear capacity of a
1 2 3 4 5 6 70.4
0.6
0.8
1
1.2
1.4
1.6
1.8
2
s
We/W
max
Monotonic Tests
Cyclic Tests
y = 1.0

64
shear wall is controlled by the capacity of sheathing-to-framing connections within the effective
strip. This is also obvious when comparing Figure 4.7 to Figure 3.13. All the data points are
below 1.0 in Figure 3.13.
This analysis indicates that the effective strip model is more than likely not applicable to
wood-based panel shear walls. The reasoning for this difference between steel sheet and wood-
based panel shear wall is that the characteristics of the sheathing materials probably dictate the
behavior of the entire shear wall assembly. Thin and flexible steel sheet sheathing create
diagonal tension field and exhibit obvious contribution of connections at the corners of the walls.
However, this assumption is probably not applicable to wood-based panels. Wood-based panels
are rigid and exhibit little deformation within the panel, thus the wood-based panels involve
more screws around the parameter to resist the lateral loading.
4.4 Simplified Nominal Strength Model
Chen (2004) verified that the simplified strength model is capable of estimating the shear
capacity of CFS-WPSWs at yield level by using EEEP method. However, he also noted that the
simplified strength model overestimated the shear resistance of CFS-WPSWs at their ultimate
capacity level. In this section, the foundations of the simplified strength model were employed,
and its design equation was modified to predict the nominal shear strength of CFS-WPSWs more
precisely. For convenience, the simplified strength model-based design equation to calculate the
ultimate shear capacity of CFS-WPSWs is written as follows:
√(
∑
)
(
∑
)
(4.19)
where:

65
Vssn = ultimate shear capacity of CFS-WPSWs based on the simplified strength model
approach.
The rest of the notations are same as previously defined.
The nominal shear strength of CFS-WPSWs is determined by multiplying the ultimate
shear resistance from the simplified strength model approach by a modification factor to address
the overestimation of the ultimate strength values. The design formula to calculate the nominal
shear strength of CFS-WPSWs is expressed as follows:
(4.20)
where:
Vn = nominal shear strength of CFS-WPSWs;
ρ = reduction factor;
{
≤ α ≤ α ≤ ≤
(4.21)
α = s/2;
s = parameter screw spacing in inches.
This design formula is also verified with 179 full scale shear wall test data from Branston
(2004), Chen (2004), Boudreault (2005), Rokas (2006), Blais (2006), and test program
conducted at UNT. Figure 4.8 shows the comparison between the propose design curve for the
nominal shear strength and experimental data.

66
Figure 4.8 Comparison of proposed design curve with test results
The identified trend in Figure 4.8 is that as the ratio gets lower as the spacing becomes
narrower. This trend indicates that the overestimation of the ultimate shear resistance values is
more significant when the screw spacing is closer. The data plots may look scattered, but most of
the data points are around its average points where the design curve is going through. The data
points of plywood are more scattered than those of OSB, but the average values of the ratio was
very similar for both OSB and plywood at each location of the screw spacing. Also, both OSB
and plywood sheathed shear walls performed similar under monotonic and cyclic loading and
achieved similar peak load values. Thus, the proposed design approach shall be used for both
OSB and plywood sheathed shear walls for both wind and seismic design. The statistical result of
the ratio of the shear strength value from tests to the estimated value is presented in
Table 4.8.
1 1.5 2 2.5 30.4
0.5
0.6
0.7
0.8
0.9
1
1.1
1.2
1.3
1.4
s
Vt/V
n
OSB and Plywood
OSB Monotonic
OSB Cyclic
Plywood Monotonic
Plywood Cyclic
Proposed Design Curve

67
Table 4.8 Statistical results of nominal shear strength values
No. of
tests
/
Avg. Std.
dev.
COV
179 1.000 0.180 0.180
4.5 Discussion
The proposed simplified nominal strength model and its design equations are based on
the assumptions and limitations of simplified strength model by Chen (2004). The obvious
difference is that the simplified nominal strength model predicts the shear resistance of a CFS-
WPSW at its ultimate capacity using the ultimate capacity of sheathing-to-framing connections.
Whereas the simplified strength model predicts the shear yield capacity with using yield strength
of sheathing-to-framing connections. Other than this difference, all the assumptions from the
simplified strength model apply to the simplified nominal strength model.
Similar to the effective strip model for the CFS-SSSWs, requirements from AISI S213
(2007) also apply to the simplified nominal strength model, such as provisions to prevent failures
in boundary studs and use of aspect ratio reduction factor for slender walls. More detailed
discussion was provided in section 3.4.
In order to verify the validity of the simplified nominal strength model and the design
equation, some of the published nominal shear strength values of CFS-WPSWs in AISI S213
(2007) are used to compare with the nominal shear strength values determined by the simplified
nominal strength model. Table 4.9 shows the comparison of published nominal shear strength
values with the values calculated by using simplified nominal strength model.

68
Table 4.9 Comparison of nominal shear strength values
Shear wall
Configuration
AISI S213
(2007) Table
C2.1-1 (plf)
AISI S213
(2007) Table
C2.1-3 (plf)
Vn
(UNT)
(plf)
Vn
(Okasha
CSP)
(plf)
Vn
(Okasha
DFP)
(plf)
2:1x43xPLY-6 1065 890 1105 713 1172
2:1x43xPLY-4 - 1330 1601 1033 1698
2:1x43xPLY-3 - 1775 2057 1300 2137
2:1x43xPLY-2 - 2190 2508 1618 2661
2:1x43xOSB-6 910 825 1129 802 802
2:1x43xOSB-4 1410 1235 1635 1162 1162
2:1x43xOSB-3 1735 1545 2014 1462 1462
2:1x43xOSB-2 1910 2060 2561 1821 1821
The published nominal shear strength values of CFS-WPSWs in AISI S213 (2007) are
based on the test program by Serrette et al. (1996a, b and 1997). Since the ultimate capacity of
individual sheathing-to-framing connections for the shear wall specimens used in these test
programs was not reported, the nominal shear strength values were calculated by using the
connection capacity values reported in the connection tests at UNT and the ones by Okasha
(2004). Table 4.9 shows that the estimated values using connection test at UNT and DFP
connection test values from Okasha (2004) are greater than the published values. Also, the
estimated values using the CSP connection test values from Okasha (2004) are consistently less
than the published values.
It should be noted that sheathing-to-framing connection capacity of CFS-WPSWs is
inherent to the characteristics of the wood-based sheathing and the framing members actually
used to construct the tested specimens. Thus, connection test data from one test program does not
reflect the connection capacity characteristics of shear walls in other test programs. This is a
major setback in this model compared to the effective strip model for CFS-SSSWs, in which,
connection capacities can be determined by following a calculation method in a design

69
specification. However, the simplified nominal strength model captures the important trend of
the shear strength values being higher as the screw spacing gets closer.
The reliability analysis was also performed for this model to evaluate its design approach
by following the provisions in Chapter F of AISI S100 (2007). The details of the resistance
factor calculation are previously introduced in section 3.4 of this thesis. The resistance factor can
be calculated by using Equation 3.18. The parameters for the calculation of the resistance factor
for this method are as follows.
C = 1.52 for LRFD;
Mm = 1.0;
Fm = 1.0;
Pm = 1.000;
e = 2.718;
β = 2.5;
VM = 0.1;
VF = 0.05;
Cp = 1.017;
VP = 0.180;
VQ = 0.21 for LRFD.
All of the above notations were previously defined in section 3.4, and the values of Mm,
VM, Fm, and VF were taken from Table F1 in AISI S100 (2007) for “Structural Members Not
Listed Above”. The AISI S213 (2007) uses a LRFD resistance factor of 0.65 for wind and 0.60
for seismic design. The resistance factor for the proposed design method turned out to be 0.72.

70
ASD safety factor was also calculated for this method by following the provisions in
Chapter F of AISI S100 (2007) and using the Equation 3.19. The safety factors for this method
turned out to be 2.20. The AISI S213 (2007) adopts an ASD safety factor of 2.00 for wind load
design and 2.50 for seismic design. The summary of the resistance factor and safety factor for the
proposed design method is presented in Table 4.10.
Table 4.10 Summary of resistance factor and safety factor (simplified nominal strength model)
Design Philosofy Loading
Type AISI S213
Simplified Nominal
Strength Model
LRFD Resistance
Factor (Φ)
Wind 0.65 0.72
Seismic 0.60
ASD Safety
Factor (Ω)
Wind 2.00 2.20
Seismic 2.50
.
4.6 Summary
An analytical model – Simplified Nominal Strength Model is proposed in this thesis to
predict the nominal strength of CFS-WPSWs. The proposed design approach shows consistent
agreement with experimental results. Statistical analysis indicates the new method provides
reliable results. This analytical method requires some efforts in testing of sheathing-to-framing
connections to determine their ultimate shear capacity, but the developed design equations
provide designers an analytical tool to calculate the nominal strength of CFS-WPSWs without
conducting full-scale shear wall tests.

71
CHAPTER 5
CONCLUSIONS AND RECOMMENDATIONS
The primary objective of this research was to develop analytical models of CFS framed
shear walls with steel sheet and wood-based sheathing. Existing analytical models from different
structural systems were reviewed to seek an applicability of their assumptions, limitations, and
its formulation of their design equations to estimate the nominal shear strength of shear wall
assemblies to CFS shear wall systems. Previously conducted CFS shear wall testing programs
were also reviewed to identify some of the most dominant failure mechanisms, and the test data
from those shear wall testing programs were collected to develop and verify the analytical model
and design equations. Finally, reliability analysis was conducted to determine the LRFD
resistance factor and ASD safety factor for the proposed design approach.
5.1 Steel Sheet Shear Wall
An analytical model for CFS-SSSWs has not been developed from a comprehensive
literature review. According to the literature review of previously conducted testing program for
CFS-SSSWs, the most dominant failure mode was identified as the sheathing-to-framing screw
connection failure within the observed diagonal tension field (effective strip). Based on this
failure mechanism, an analytical model – effective strip model was developed to predict the
nominal shear strength of CFS-SSSWs. 142 monotonic and cyclic full scale shear wall test data
was collected and used to seek a consistent agreement between the proposed design approach
and the experimental results. The design equations were developed by using actual material and
mechanical properties of the sheathing and framing members. The proposed design approach
show consistent agreement with the test results and also the AISI published nominal strength
values of different wall configurations. Further analyses indicated that the nominal material

72
properties could also be used in the proposed equations to provide reliable shear wall strength.
The resistance factors were calculated for both actual and nominal cases. The developed design
equations provide designers an analytical tool to calculate the nominal strength of CFS-SSSWs
without conducting full-scale shear wall tests.
5.2 Wood-based Panel Shear Wall
Based on the literature review of previously performed full scale testing of CFS-WPSWs,
some of the most dominant failure mechanisms were sheathing edge tear-out, pull-through, and
shear in connection screws or a combination of these failures. These failures are all related to a
capacity of individual sheathing-to-framing connections. Along with the literature review of
existing analytical models, it was found that the key to successfully estimate the nominal shear
strength of CFS-WPSWs is finding the nominal capacity of sheathing-to-framing connections.
Since the calculation method of the capacity of wood panel-to-steel framing screw connection is
not codified in design provisions, its determination is solely dependent on experimental
investigation. Thus, connection tests were conducted to determine the sheathing-to-framing
connection capacity of shear wall specimens used in the full scale shear wall testing program at
UNT. The effective strip model approach did not work for CFS-WPSWs because of the
difference in its behavior and material properties. By applying the assumptions of the simplified
strength model and elastic model, an analytical model – simplified nominal strength model was
developed in this research to predict the nominal strength of CFS-WPSWs. The total of 179
monotonic and cyclic full scale shear wall test data was collected and used to seek an agreement
between the proposed design approach and the experimental results. The proposed design
approach show consistent agreement with the test results. The resistance factor was calculated
for the LRFD design approach. This analytical method requires some efforts in testing of

73
sheathing-to-framing connections to determine their ultimate shear capacity, but if appropriate
sheathing-to-framing connection capacities are provided, the developed design equations provide
designers an analytical tool to calculate the nominal strength of CFS-WPSWs without
conducting full-scale shear wall tests.
5.3 Recommendations for Future Research
In order to expand the knowledge about CFS-SSSWs and WPSWs and better understand
the characteristics of their behaviors, many factors that are not incorporated in this research need
to be addressed with respect to both testing and analytical models.
The configurations of the shear walls addressed in this research are very basic in terms of
test specimens and wall configuration assumption of analytical models. However, in the real
construction practice, CFS shear walls have more details such as ledger framing and opening in
sheathing. Those details will more or less affect the performance of the shear walls. The
influences of those detail need to be identified in full scale shear wall testing, and it is necessary
to address in those influences analytical models and incorporate into a design procedure.
Especially in commercial building, along with the use of sheathing, steel ledger is
frequently installed to the top of a framing to support floor joints. Steel ledgers are usually
thicker than the framing members, and they are considered to add some stiffness and resistance
to the shear wall system. Often times, the dimension of the shear walls with steel ledgers are 9ft.
tall 4 ft. wide, which was not covered in this research.
Opening in sheathing is another example of the shear wall details often employed in
actual construction. The openings are essential to install windows and doors. Testing of shear
walls with perforated sheathing is necessary to capture the effect of the openings.

74
The combined effect of lateral loading and gravity loading has to be considered in the
future research. In this research, shear walls are subjected to only in-plane lateral force. However,
in a real situation, the structure and activities from the floors above the shear walls will exert
gravity and live loading. The gravity loading may increase the stiffness of the structure and result
in different load versus displacement relationship.
Most importantly, the connection test data has to be enhanced to obtain better estimation
of the strength of individual sheathing-to-framing connections for CFS-WPSWs. In both
effective strip model and simplified nominal strength model, it is crucial to obtain accurate
sheathing-to-framing connection capacity for a better estimation of the nominal strength of an
entire shear wall assembly. Unlike steel sheet, material properties of wood-based panels are not
very consistent, and the determination of the connection capacity is totally dependent on testing.
A better connection test procedure has to be developed to obtain more consistent results.
75
APPENDIX A
DESIGN EXAMPLE OF CFS-STEEL SHEET SHEAR WALL

76
A design example of 4 ft. × 8 ft. CFS-SSSW using 33 mil framing and 27 mil sheet steel
sheathing is provided. The nominal yield stress of the framing and the sheathing are both 33 ksi.
Sheathing-to-framing fasteners at the perimeter are No. 8 self-drilling tapping screws spaced at 3
inches. This design example assumes that actual material properties are obtained from coupon
tests, and those actual material properties are used in calculation. The material properties of the
framing members are listed in Table A.1:
Table A.1 Material properties of the framing members
Member Thickness
t (in.)
Yield Stress
Fy (ksi)
Tensile Strength
Fu (ksi)
27 mil steel sheet 0.024 50.3 57.8
33 mil stud 0.033 47.7 55.7
33 mil track 0.033 57.4 67.2
Step 1: Estimating the effective strip width
/
Maximum effective width of the steel sheet sheathing
α / /
α / /
β / /

77
β / /
β / /
Effective strip width of the steel sheet sheathing
Step 2: Determining the nominal shear capacity of individual connections
Sheathing-to-stud connection
Connection shear limited by tilting and bearing
/ /
/
For t2/t1 ≤ 1.0,
{
⁄ { }
⁄
For t2/t1 ≥ 2.5,

78
{
By linear interpolating the smallest of the above two cases,
Connection shear limited by end distance
(assuming that the screws are installed at the center of the
flange of outer stud)
Connection shear limited by shear in screw
The nominal shear strength of screw is provided by the manufacturer. It is assumed that No. 8-18
Phillips Truss Head screw by HILTI is used. The screw shear strength can be found at a HILTI
self-drilling screws report (ESR-2196, 2011).
{ } (sheathing to stud connection)
Similarly,
(sheathing to track connection)
(sheathing to track and stud connection at corners)
Step 3: Determining the nominal shear strength of the shear wall

79
{
}
Limited by connection capacity
(
)
(
)
Limited by sheathing yield capacity
{ }
Nominal shear strength of the shear wall
/
The published value of nominal shear strength for this wall configuration in AISI S213-07 is 778
lb/ft, which is close to the calculated value by the proposed method.
LRFD design shear strength of the shear wall
/ /

80
APPENDIX B
DESIGN EXAMPLE OF CFS-WOOD-BASED PANEL SHEAR WALL

81
A design example of 4 ft × 8 ft CFS-WPSW using 43 mil framing and 7/16 in. OSB
sheathing is provided. The nominal yield stress of the framing and the sheathing are both 33 ksi.
Sheathing-to-framing fasteners at the perimeter are No. 8 self-drilling tapping screws spaced at 6
inches. This design example uses the connection test data from UNT in calculation.
Capacity of individual OSB sheathing-to-framing connections
The coordinate of the farthest screw from the origin original center of the sheathing) the screw at
the four corner of the wall.
Sum of square of each horizontal coordinate of the screws
∑
Sum of square of each vertical coordinate of the screws
∑
The shear resistance of the wall at its ultimate capacity level based on the simplified strength
model
√(
∑
)
(
∑
)
√(
)
(
)
/
Determine the reduction factor based on the spacing of the sheathing-to-framing fasteners
≤ ≤
Nominal shear strength of the shear wall

82
/ /
LRFD design shear strength of the shear wall
/ /
83
APPENDIX C
DATA SHEETS OF OSB AND PLYWOOD CONNECTION TESTS

84
Test Label: osb_43_stud_horz_#1
Specimen Configuration
Wall dimension: 4 1/2 in. × 6 1/2 in. Stud: 33 ksi 362S162-43 Sheathing: APA rated, 24/16, Exposure I, 7/16 OSB Grain direction: Horizontal
Fastener: #8-18x1” modified truss head self-drilling screw
Test results
Maximum load: 774.2 lbs
Net lateral displacement at top of
wall at Maximum load: 0.453 in.
Observed Failure Mode: Sheathing panel bearing failure/sheathing edge tear-out in a wide range
0 0.1 0.2 0.3 0.4 0.5 0.6 0.70
100
200
300
400
500
600
700
800
Displacement (in)
Load (
lb)
osb 43 stud horz #1

85
Test Label: osb_43_stud_horz_#2
Specimen Configuration
Wall dimension: 4 1/2 in. × 6 1/2 in. Stud: 33 ksi, 362S162-43
Sheathing: APA rated, 24/16, Exposure I, 7/16 OSB Grain direction: Horizontal
Fastener: #8-18x1” modified truss head self-drilling screw
Test results Maximum load: 722.2 lbs
Net lateral displacement at top of
wall at Maximum load: 0.434 in.
Observed Failure Mode: Shear failure in the screw
0 0.05 0.1 0.15 0.2 0.25 0.3 0.35 0.4 0.450
100
200
300
400
500
600
700
800
Displacement (in)
Load (
lb)
osb 43 stud horz #2

86
Test Label: osb_43_stud_horz_#3
Specimen Configuration
Wall dimension: 4 1/2 in. × 6 1/2 in. Stud: 33 ksi, 362S162-43
Sheathing: APA rated, 24/16, Exposure I, 7/16 OSB Grain direction: Horizontal
Fastener: #8-18x1” modified truss head self-drilling screw
Test results Maximum load: 748.5 lbs
Net lateral displacement at top of
wall at Maximum load: 0.532 in.
Observed Failure Mode: Sheathing edge tear-out/bearing failure
0 0.1 0.2 0.3 0.4 0.5 0.6 0.70
100
200
300
400
500
600
700
800
Displacement (in)
Load (
lb)
osb 43 stud horz #3

87
Test Label: osb_43_stud_horz_#4
Specimen Configuration
Wall dimension: 4 1/2 in. × 6 1/2 in. Stud: 33 ksi, 362S162-43
Sheathing: APA rated, 24/16, Exposure I, 7/16 OSB Grain direction: Horizontal
Fastener: #8-18x1” modified truss head self-drilling screw
Test results Maximum load: 740.4 lbs
Net lateral displacement at top of
wall at Maximum load: 0.354 in.
Observed Failure Mode: Shear failure in the screw
0 0.05 0.1 0.15 0.2 0.25 0.3 0.35 0.40
100
200
300
400
500
600
700
800
Displacement (in)
Load (
lb)
osb 43 stud horz #4

88
Test Label: osb_43_stud_horz_#5
Specimen Configuration
Wall dimension: 4 1/2 in. × 6 1/2 in. Stud: 33 ksi, 362S162-43
Sheathing: APA rated, 24/16, Exposure I, 7/16 OSB Grain direction: Horizontal
Fastener: #8-18x1” modified truss head self-drilling screw
Test results Maximum load: 699.6 lbs
Net lateral displacement at top of
wall at Maximum load: 0.392 in.
Observed Failure Mode: Shear failure in the screw
0 0.05 0.1 0.15 0.2 0.25 0.3 0.35 0.40
100
200
300
400
500
600
700
Displacement (in)
Load (
lb)
osb 43 stud horz #5

89
Test Label: osb_43_stud_horz_#6
Specimen Configuration
Wall dimension: 4 1/2 in. × 6 1/2 in. Stud: 33 ksi, 362S162-43
Sheathing: APA rated, 24/16, Exposure I, 7/16 OSB Grain direction: Horizontal
Fastener: #8-18x1” modified truss head self-drilling screw
Test results Maximum load: 644.3 lbs
Net lateral displacement at top of
wall at Maximum load: 0.422 in.
Observed Failure Mode: Sheathing edge tear-out/bearing failure
0 0.1 0.2 0.3 0.4 0.5 0.6 0.70
100
200
300
400
500
600
700
Displacement (in)
Load (
lb)
osb 43 stud horz #6

90
Test Label: osb_43_stud_vert_#1
Specimen Configuration
Wall dimension: 4 1/2 in. × 6 1/2 in. Stud: 33 ksi, 362S162-43
Sheathing: APA rated, 24/16, Exposure I, 7/16 OSB Grain direction: Vertical
Fastener: #8-18x1” modified truss head self-drilling screw
Test results Maximum load: 620.7 lbs
Net lateral displacement at top of
wall at Maximum load: 0.363 in.
Observed Failure Mode: Sheathing edge tear-out/bearing failure
0 0.1 0.2 0.3 0.4 0.5 0.6 0.70
100
200
300
400
500
600
700
Displacement (in)
Load (
lb)
osb 43 stud vert #1

91
Test Label: osb_43_stud_vert_#2
Specimen Configuration
Wall dimension: 4 1/2 in. × 6 1/2 in. Stud: 33 ksi, 362S162-43
Sheathing: APA rated, 24/16, Exposure I, 7/16 OSB Grain direction: Vertical
Fastener: #8-18x1” modified truss head self-drilling screw
Test results Maximum load: 548.2 lbs
Net lateral displacement at top of
wall at Maximum load: 0.348 in.
Observed Failure Mode: Sheathing edge tear-out/bearing failure
0 0.1 0.2 0.3 0.4 0.5 0.6 0.7 0.80
100
200
300
400
500
600
Displacement (in)
Load (
lb)
osb 43 stud vert #2

92
Test Label: osb_43_stud_vert_#3
Specimen Configuration
Wall dimension: 4 1/2 in. × 6 1/2 in. Stud: 33 ksi, 362S162-43
Sheathing: APA rated, 24/16, Exposure I, 7/16 OSB Grain direction: Vertical
Fastener: #8-18x1” modified truss head self-drilling screw
Test results Maximum load: 636.2 lbs
Net lateral displacement at top of
wall at Maximum load: 0.318 in.
Observed Failure Mode: Sheathing edge tear-out/bearing failure
0 0.1 0.2 0.3 0.4 0.5 0.6 0.7 0.80
100
200
300
400
500
600
700
Displacement (in)
Load (
lb)
osb 43 stud vert #3

93
Test Label: osb_43_stud_vert_#4
Specimen Configuration
Wall dimension: 4 1/2 in. × 6 1/2 in. Stud: 33 ksi, 362S162-43
Sheathing: APA rated, 24/16, Exposure I, 7/16 OSB Grain direction: Vertical
Fastener: #8-18x1” modified truss head self-drilling screw
Test results Maximum load: 736.1 lbs
Net lateral displacement at top of
wall at Maximum load: 0.466 in.
Observed Failure Mode: Sheathing edge tear-out/bearing failure
0 0.1 0.2 0.3 0.4 0.5 0.6 0.7 0.8 0.9 10
100
200
300
400
500
600
700
800
Displacement (in)
Load (
lb)
osb 43 stud vert #4

94
Test Label: osb_43_stud_vert_#5
Specimen Configuration
Wall dimension: 4 1/2 in. × 6 1/2 in. Stud: 33 ksi, 362S162-43
Sheathing: APA rated, 24/16, Exposure I, 7/16 OSB Grain direction: Vertical
Fastener: #8-18x1” modified truss head self-drilling screw
Test results Maximum load: 553.0 lbs
Net lateral displacement at top of
wall at Maximum load: 0.355 in.
Observed Failure Mode: Sheathing edge tear-out/bearing failure
0 0.1 0.2 0.3 0.4 0.5 0.6 0.70
100
200
300
400
500
600
Displacement (in)
Load (
lb)
osb 43 stud vert #5

95
Test Label: osb_43_stud_vert_#6
Specimen Configuration
Wall dimension: 4 1/2 in. × 6 1/2 in. Stud: 33 ksi, 362S162-43
Sheathing: APA rated, 24/16, Exposure I, 7/16 OSB Grain direction: Vertical
Fastener: #8-18x1” modified truss head self-drilling screw
Test results Maximum load: 619.6 lbs
Net lateral displacement at top of
wall at Maximum load: 0.233 in.
Observed Failure Mode: Shear failure in the screw
0 0.05 0.1 0.15 0.2 0.25 0.3 0.350
100
200
300
400
500
600
700
Displacement (in)
Load (
lb)
osb 43 stud vert #6

96
Test Label: osb_43_track_horz_#1
Specimen Configuration
Wall dimension: 4 1/2 in. × 6 1/2 in. Track: 33ksi, 362T150-43
Sheathing: APA rated, 24/16, Exposure I, 7/16 OSB Grain direction: Horizontal
Fastener: #8-18x1” modified truss head self-drilling screw
Test results Maximum load: 666.3 lbs
Net lateral displacement at top of
wall at Maximum load: 0.253 in.
Observed Failure Mode: Shear failure in the screw
0 0.05 0.1 0.15 0.2 0.25 0.3 0.35 0.4 0.450
100
200
300
400
500
600
700
Displacement (in)
Load (
lb)
osb 43 track horz #1

97
Test Label: osb_43_track_horz_#2
Specimen Configuration
Wall dimension: 4 1/2 in. × 6 1/2 in. Track: 33ksi, 362T150-43
Sheathing: APA rated, 24/16, Exposure I, 7/16 OSB Grain direction: Horizontal
Fastener: #8-18x1” modified truss head self-drilling screw
Test results Maximum load: 652.9 lbs
Net lateral displacement at top of
wall at Maximum load: 0.265 in.
Observed Failure Mode: Shear failure in the screw
0 0.05 0.1 0.15 0.2 0.25 0.3 0.350
100
200
300
400
500
600
700
Displacement (in)
Load (
lb)
osb 43 track horz #2

98
Test Label: osb_43_track_horz_#3
Specimen Configuration
Wall dimension: 4 1/2 in. × 6 1/2 in. Track: 33ksi, 362T150-43
Sheathing: APA rated, 24/16, Exposure I, 7/16 OSB Grain direction: Horizontal
Fastener: #8-18x1” modified truss head self-drilling screw
Test results Maximum load: 620.1 lbs
Net lateral displacement at top of
wall at Maximum load: 0.29 in.
Observed Failure Mode: Sheathing edge tear-out/bearing failure
0 0.1 0.2 0.3 0.4 0.5 0.6 0.7 0.80
100
200
300
400
500
600
700
Displacement (in)
Load (
lb)
osb 43 track horz #3

99
Test Label: osb_43_track_horz_#4
Specimen Configuration
Wall dimension: 4 1/2 in. × 6 1/2 in. Track: 33ksi, 362T150-43
Sheathing: APA rated, 24/16, Exposure I, 7/16 OSB Grain direction: Horizontal
Fastener: #8-18x1” modified truss head self-drilling screw
Test results Maximum load: 541.8 lbs
Net lateral displacement at top of
wall at Maximum load: 0.380 in.
Observed Failure Mode: Sheathing tear-out/bearing failure
0 0.1 0.2 0.3 0.4 0.5 0.6 0.70
100
200
300
400
500
600
Displacement (in)
Load (
lb)
osb 43 track horz #4

100
Test Label: osb_43_track_horz_#5
Specimen Configuration
Wall dimension: 4 1/2 in. × 6 1/2 in. Track: 33ksi, 362T150-43
Sheathing: APA rated, 24/16, Exposure I, 7/16 OSB Grain direction: Horizontal
Fastener: #8-18x1” modified truss head self-drilling screw
Test results Maximum load: 664.2 lbs
Net lateral displacement at top of
wall at Maximum load: 0.373 in.
Observed Failure Mode: Sheathing tear-out/bearing failure
0 0.1 0.2 0.3 0.4 0.5 0.6 0.7 0.80
100
200
300
400
500
600
700
Displacement (in)
Load (
lb)
osb 43 track horz #5

101
Test Label: osb_43_track_horz_#6
Specimen Configuration
Wall dimension: 4 1/2 in. × 6 1/2 in. Track: 33ksi, 362T150-43
Sheathing: APA rated, 24/16, Exposure I, 7/16 OSB Grain direction: Horizontal
Fastener: #8-18x1” modified truss head self-drilling screw
Test results Maximum load: 604.0 lbs
Net lateral displacement at top of
wall at Maximum load: 0.320 in.
Observed Failure Mode: Sheathing tear-out/bearing failure
0 0.1 0.2 0.3 0.4 0.5 0.6 0.7 0.80
100
200
300
400
500
600
700
Displacement (in)
Load (
lb)
osb 43 track horz #6

102
Test Label: osb_43_track_vert_#1
Specimen Configuration
Wall dimension: 4 1/2 in. × 6 1/2 in. Track: 33ksi, 362T150-43
Sheathing: APA rated, 24/16, Exposure I, 7/16 OSB Grain direction: Vertical
Fastener: #8-18x1” modified truss head self-drilling screw
Test results Maximum load: 426.9 lbs
Net lateral displacement at top of
wall at Maximum load: 0.218 in.
Observed Failure Mode: Sheathing edge tear-out/bearing failure
0 0.05 0.1 0.15 0.2 0.25 0.3 0.35 0.40
50
100
150
200
250
300
350
400
450
Displacement (in)
Load (
lb)
osb 43 track vert #1

103
Test Label: osb_43_track_vert_#2
Specimen Configuration
Wall dimension: 4 1/2 in. × 6 1/2 in. Track: 33ksi, 362T150-43
Sheathing: APA rated, 24/16, Exposure I, 7/16 OSB Grain direction: Vertical
Fastener: #8-18x1” modified truss head self-drilling screw
Test results Maximum load: 516.0 lbs
Net lateral displacement at top of
wall at Maximum load: 0.332 in.
Observed Failure Mode: Sheathing edge tear-out/bearing failure
0 0.05 0.1 0.15 0.2 0.25 0.3 0.35 0.4 0.45 0.50
100
200
300
400
500
600
Displacement (in)
Load (
lb)
osb 43 track vert #2

104
Test Label: osb_43_track_vert_#3
Specimen Configuration
Wall dimension: 4 1/2 in. × 6 1/2 in. Track: 33ksi, 362T150-43
Sheathing: APA rated, 24/16, Exposure I, 7/16 OSB Grain direction: Vertical
Fastener: #8-18x1” modified truss head self-drilling screw
Test results Maximum load: 608.3 lbs
Net lateral displacement at top of
wall at Maximum load: 0.35 in.
Observed Failure Mode: Sheathing edge tear-out/bearing failure
0 0.1 0.2 0.3 0.4 0.5 0.6 0.7 0.80
100
200
300
400
500
600
700
Displacement (in)
Load (
lb)
osb 43 track vert #3

105
Test Label: osb_43_track_vert_#4
Specimen Configuration
Wall dimension: 4 1/2 in. × 6 1/2 in. Track: 33ksi, 362T150-43
Sheathing: APA rated, 24/16, Exposure I, 7/16 OSB Grain direction: Vertical
Fastener: #8-18x1” modified truss head self-drilling screw
Test results Maximum load: 778.0 lbs
Net lateral displacement at top of
wall at Maximum load: 0.268 in.
Observed Failure Mode: Shear failure in the screw
0 0.05 0.1 0.15 0.2 0.25 0.3 0.35 0.4 0.450
100
200
300
400
500
600
700
800
Displacement (in)
Load (
lb)
osb 43 track vert #4

106
Test Label: osb_43_track_vert_#5
Specimen Configuration
Wall dimension: 4 1/2 in. × 6 1/2 in. Track: 33ksi, 362T150-43
Sheathing: APA rated, 24/16, Exposure I, 7/16 OSB Grain direction: Vertical
Fastener: #8-18x1” modified truss head self-drilling screw
Test results Maximum load: 768.3 lbs
Net lateral displacement at top of
wall at Maximum load: 0.262 in.
Observed Failure Mode: Shear failure in the screw
0 0.05 0.1 0.15 0.2 0.25 0.3 0.35 0.4 0.45 0.50
100
200
300
400
500
600
700
800
Displacement (in)
Load (
lb)
osb 43 track vert #5

107
Test Label: osb_43_track_vert_#6
Specimen Configuration
Wall dimension: 4 1/2 in. × 6 1/2 in. Track: 33ksi, 362T150-43
Sheathing: APA rated, 24/16, Exposure I, 7/16 OSB Grain direction: Vertical
Fastener: #8-18x1” modified truss head self-drilling screw
Test results Maximum load: 808.1 lbs
Net lateral displacement at top of
wall at Maximum load: 0.491 in.
Observed Failure Mode: Sheathing edge tear-out/bearing failure
0 0.1 0.2 0.3 0.4 0.5 0.6 0.7 0.80
100
200
300
400
500
600
700
800
900
Displacement (in)
Load (
lb)
osb 43 track vert #6

108
Test Label: osb_54_stud_horz_#1
Specimen Configuration
Wall dimension: 4 1/2 in. × 6 1/2 in. Stud: 50ksi, 362S162-54
Sheathing: APA rated, 24/16, Exposure I, 7/16 OSB Grain direction: Horizontal
Fastener: #8-18x1” modified truss head self-drilling screw
Test results Maximum load: 850.5 lbs
Net lateral displacement at top of
wall at Maximum load: 0.429 in.
Observed Failure Mode: Sheathing edge tear-out/bearing failure
0 0.1 0.2 0.3 0.4 0.5 0.6 0.70
100
200
300
400
500
600
700
800
900
Displacement (in)
Load (
lb)
osb 54 stud horz #1

109
Test Label: osb_54_stud_horz_#2
Specimen Configuration
Wall dimension: 4 1/2 in. × 6 1/2 in. Stud: 50ksi, 362S162-54
Sheathing: APA rated, 24/16, Exposure I, 7/16 OSB Grain direction: Horizontal
Fastener: #8-18x1” modified truss head self-drilling screw
Test results Maximum load: 728.6 lbs
Net lateral displacement at top of
wall at Maximum load: 0.356 in.
Observed Failure Mode: Shear failure in the screw
0 0.05 0.1 0.15 0.2 0.25 0.3 0.35 0.40
100
200
300
400
500
600
700
800
Displacement (in)
Load (
lb)
osb 54 stud horz #2

110
Test Label: osb_54_stud_horz_#3
Specimen Configuration
Wall dimension: 4 1/2 in. × 6 1/2 in. Stud: 50ksi, 362S162-54
Sheathing: APA rated, 24/16, Exposure I, 7/16 OSB Grain direction: Horizontal
Fastener: #8-18x1” modified truss head self-drilling screw
Test results Maximum load: 685.1 lbs
Net lateral displacement at top of
wall at Maximum load: 0.434 in.
Observed Failure Mode: Sheathing edge tear-out/bearing failure
0 0.05 0.1 0.15 0.2 0.25 0.3 0.35 0.4 0.45 0.50
100
200
300
400
500
600
700
Displacement (in)
Load (
lb)
osb 54 stud horz #3

111
Test Label: osb_54_stud_horz_#4
Specimen Configuration
Wall dimension: 4 1/2 in. × 6 1/2 in. Stud: 50ksi, 362S162-54
Sheathing: APA rated, 24/16, Exposure I, 7/16 OSB Grain direction: Horizontal
Fastener: #8-18x1” modified truss head self-drilling screw
Test results Maximum load: 514.4 lbs
Net lateral displacement at top of
wall at Maximum load: 0.442 in.
Observed Failure Mode: Sheathing edge tear-out/bearing failure
0 0.05 0.1 0.15 0.2 0.25 0.3 0.35 0.4 0.45 0.50
100
200
300
400
500
600
Displacement (in)
Load (
lb)
osb 54 stud horz #4

112
Test Label: osb_54_stud_horz_#5
Specimen Configuration
Wall dimension: 4 1/2 in. × 6 1/2 in. Stud: 50ksi, 362S162-54
Sheathing: APA rated, 24/16, Exposure I, 7/16 OSB Grain direction: Horizontal
Fastener: #8-18x1” modified truss head self-drilling screw
Test results Maximum load: 626.6 lbs
Net lateral displacement at top of
wall at Maximum load: 0.469 in.
Observed Failure Mode: Sheathing tear along the grain at the location of the screw/bearing failure
0 0.1 0.2 0.3 0.4 0.5 0.6 0.70
100
200
300
400
500
600
700
Displacement (in)
Load (
lb)
osb 54 stud horz #5

113
Test Label: osb_54_stud_horz_#6
Specimen Configuration
Wall dimension: 4 1/2 in. × 6 1/2 in. Stud: 50ksi, 362S162-54
Sheathing: APA rated, 24/16, Exposure I, 7/16 OSB Grain direction: Horizontal
Fastener: #8-18x1” modified truss head self-drilling screw
Test results Maximum load: 673.3 lbs
Net lateral displacement at top of
wall at Maximum load: 0.337 in.
Observed Failure Mode: Sheathing tear-out/bearing failure
0 0.05 0.1 0.15 0.2 0.25 0.3 0.35 0.4 0.45 0.50
100
200
300
400
500
600
700
Displacement (in)
Load (
lb)
osb 54 stud horz #6

114
Test Label: osb_54_stud_vert_#1
Specimen Configuration
Wall dimension: 4 1/2 in. × 6 1/2 in. Stud: 50ksi, 362S162-54
Sheathing: APA rated, 24/16, Exposure I, 7/16 OSB Grain direction: Vertical
Fastener: #8-18x1” modified truss head self-drilling screw
Test results Maximum load: 680.8 lbs
Net lateral displacement at top of
wall at Maximum load: 0.276 in.
Observed Failure Mode: Shear failure in the screw
0 0.05 0.1 0.15 0.2 0.25 0.3 0.350
100
200
300
400
500
600
700
Displacement (in)
Load (
lb)
osb 54 stud vert #1

115
Test Label: osb_54_stud_vert_#2
Specimen Configuration
Wall dimension: 4 1/2 in. × 6 1/2 in. Stud: 50ksi, 362S162-54
Sheathing: APA rated, 24/16, Exposure I, 7/16 OSB Grain direction: Vertical
Fastener: #8-18x1” modified truss head self-drilling screw
Test results Maximum load: 583.6 lbs
Net lateral displacement at top of
wall at Maximum load: 0.258 in.
Observed Failure Mode: Shear failure in the screw
0 0.05 0.1 0.15 0.2 0.25 0.3 0.350
100
200
300
400
500
600
Displacement (in)
Load (
lb)
osb 54 stud vert #2

116
Test Label: osb_54_stud_vert_#3
Specimen Configuration
Wall dimension: 4 1/2 in. × 6 1/2 in. Stud: 50ksi, 362S162-54
Sheathing: APA rated, 24/16, Exposure I, 7/16 OSB Grain direction: Vertical
Fastener: #8-18x1” modified truss head self-drilling screw
Test results Maximum load: 606.7 lbs
Net lateral displacement at top of
wall at Maximum load: 0.271 in.
Observed Failure Mode: Shear failure in the screw
0 0.05 0.1 0.15 0.2 0.25 0.3 0.350
100
200
300
400
500
600
700
Displacement (in)
Load (
lb)
osb 54 stud vert #3

117
Test Label: osb_54_stud_vert_#4
Specimen Configuration
Wall dimension: 4 1/2 in. × 6 1/2 in. Stud: 50ksi, 362S162-54
Sheathing: APA rated, 24/16, Exposure I, 7/16 OSB Grain direction: Vertical
Fastener: #8-18x1” modified truss head self-drilling screw
Test results Maximum load: 751.1 lbs
Net lateral displacement at top of
wall at Maximum load: 0.301 in.
Observed Failure Mode: Shear failure in the screw
0 0.05 0.1 0.15 0.2 0.25 0.3 0.350
100
200
300
400
500
600
700
800
Displacement (in)
Load (
lb)
osb 54 stud vert #4

118
Test Label: osb_54_stud_vert_#5
Specimen Configuration
Wall dimension: 4 1/2 in. × 6 1/2 in. Stud: 50ksi, 362S162-54
Sheathing: APA rated, 24/16, Exposure I, 7/16 OSB Grain direction: Vertical
Fastener: #8-18x1” modified truss head self-drilling screw
Test results Maximum load: 677.6 lbs
Net lateral displacement at top of
wall at Maximum load: 0.284 in.
Observed Failure Mode: Shear failure in the screw
0 0.05 0.1 0.15 0.2 0.25 0.3 0.350
100
200
300
400
500
600
700
Displacement (in)
Load (
lb)
osb 54 stud vert #5

119
Test Label: osb_54_stud_vert_#6
Specimen Configuration
Wall dimension: 4 1/2 in. × 6 1/2 in. Stud: 50ksi, 362S162-54
Sheathing: APA rated, 24/16, Exposure I, 7/16 OSB Grain direction: Vertical
Fastener: #8-18x1” modified truss head self-drilling screw
Test results Maximum load: 756.0 lbs
Net lateral displacement at top of
wall at Maximum load: 0.293 in.
Observed Failure Mode: Shear failure in the screw
0 0.05 0.1 0.15 0.2 0.25 0.3 0.350
100
200
300
400
500
600
700
800
Displacement (in)
Load (
lb)
osb 54 stud vert #6

120
Test Label: osb_54_track_horz_#1
Specimen Configuration
Wall dimension: 4 1/2 in. × 6 1/2 in. Track: 50ksi, 362S150-54
Sheathing: APA rated, 24/16, Exposure I, 7/16 OSB Grain direction: Horizontal
Fastener: #8-18x1” modified truss head self-drilling screw
Test results Maximum load: 617.5 lbs
Net lateral displacement at top of
wall at Maximum load: 0.341 in.
Observed Failure Mode: Shear failure in the screw
0 0.05 0.1 0.15 0.2 0.25 0.3 0.35 0.40
100
200
300
400
500
600
700
Displacement (in)
Load (
lb)
osb 54 track horz #1

121
Test Label: osb_54_track_horz_#2
Specimen Configuration
Wall dimension: 4 1/2 in. × 6 1/2 in. Track: 50ksi, 362S150-54
Sheathing: APA rated, 24/16, Exposure I, 7/16 OSB Grain direction: Horizontal
Fastener: #8-18x1” modified truss head self-drilling screw
Test results Maximum load: 891.8 lbs
Net lateral displacement at top of
wall at Maximum load: 0.396 in.
Observed Failure Mode: Sheathing edge tear-out/bearing failure
0 0.1 0.2 0.3 0.4 0.5 0.6 0.7-100
0
100
200
300
400
500
600
700
800
900
Displacement (in)
Load (
lb)
osb 54 track horz #2
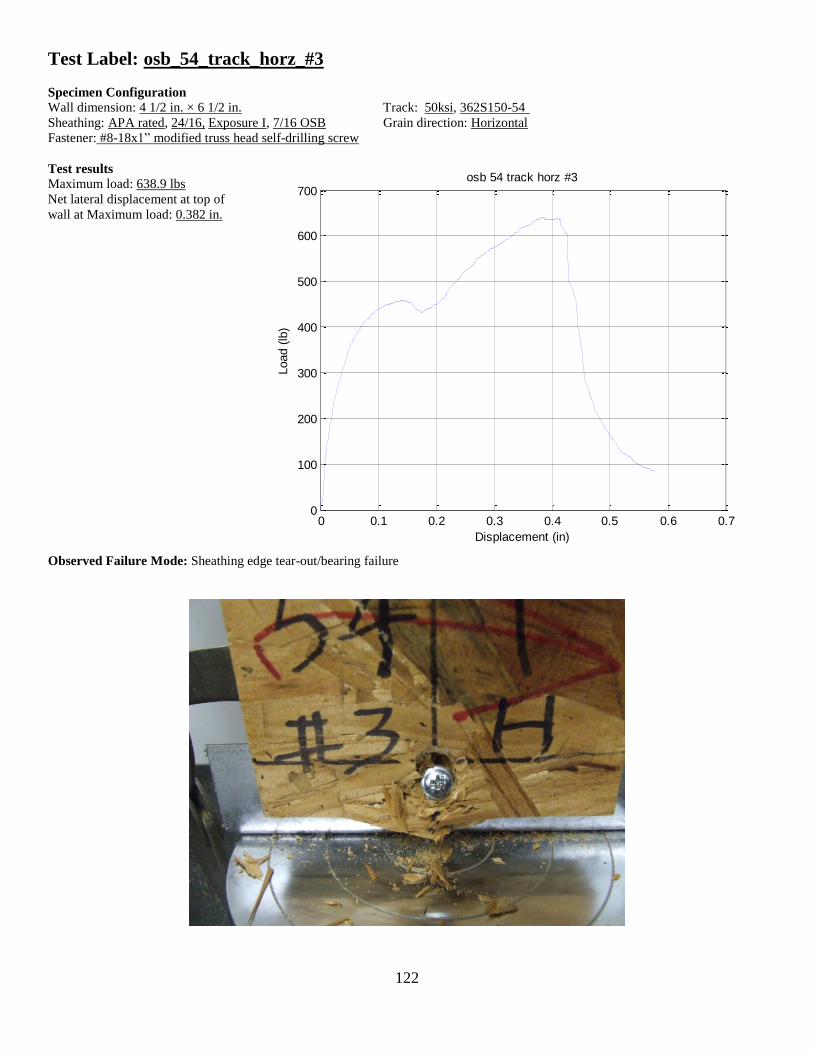
122
Test Label: osb_54_track_horz_#3
Specimen Configuration
Wall dimension: 4 1/2 in. × 6 1/2 in. Track: 50ksi, 362S150-54
Sheathing: APA rated, 24/16, Exposure I, 7/16 OSB Grain direction: Horizontal
Fastener: #8-18x1” modified truss head self-drilling screw
Test results Maximum load: 638.9 lbs
Net lateral displacement at top of
wall at Maximum load: 0.382 in.
Observed Failure Mode: Sheathing edge tear-out/bearing failure
0 0.1 0.2 0.3 0.4 0.5 0.6 0.70
100
200
300
400
500
600
700
Displacement (in)
Load (
lb)
osb 54 track horz #3

123
Test Label: osb_54_track_horz_#4
Specimen Configuration
Wall dimension: 4 1/2 in. × 6 1/2 in. Track: 50ksi, 362S150-54
Sheathing: APA rated, 24/16, Exposure I, 7/16 OSB Grain direction: Horizontal
Fastener: #8-18x1” modified truss head self-drilling screw
Test results Maximum load: 789.3 lbs
Net lateral displacement at top of
wall at Maximum load: 0.379 in.
Observed Failure Mode: Sheathing tear along the grain through the location of the screw
0 0.05 0.1 0.15 0.2 0.25 0.3 0.35 0.4 0.45 0.50
100
200
300
400
500
600
700
800
Displacement (in)
Load (
lb)
osb 54 track horz #4

124
Test Label: osb_54_track_horz_#5
Specimen Configuration
Wall dimension: 4 1/2 in. × 6 1/2 in. Track: 50ksi, 362S150-54
Sheathing: APA rated, 24/16, Exposure I, 7/16 OSB Grain direction: Horizontal
Fastener: #8-18x1” modified truss head self-drilling screw
Test results Maximum load: 808.6 lbs
Net lateral displacement at top of
wall at Maximum load: 0.319 in.
Observed Failure Mode: Sheathing tear-out/bearing failure
0 0.1 0.2 0.3 0.4 0.5 0.6 0.70
100
200
300
400
500
600
700
800
900
Displacement (in)
Load (
lb)
osb 54 track horz #5

125
Test Label: osb_54_track_horz_#6
Specimen Configuration
Wall dimension: 4 1/2 in. × 6 1/2 in. Track: 50ksi, 362S150-54
Sheathing: APA rated, 24/16, Exposure I, 7/16 OSB Grain direction: Horizontal
Fastener: #8-18x1” modified truss head self-drilling screw
Test results Maximum load: 686.2 lbs
Net lateral displacement at top of
wall at Maximum load: 0.516 in.
Observed Failure Mode: Sheathing bearing failure/pull-through
0 0.1 0.2 0.3 0.4 0.5 0.6 0.7 0.80
100
200
300
400
500
600
700
Displacement (in)
Load (
lb)
osb 54 track horz #6

126
Test Label: osb_54_track_vert_#1
Specimen Configuration
Wall dimension: 4 1/2 in. × 6 1/2 in. Track: 50ksi, 362S150-54
Sheathing: APA rated, 24/16, Exposure I, 7/16 OSB Grain direction: Vertical
Fastener: #8-18x1” modified truss head self-drilling screw
Test results Maximum load: 751.7 lbs
Net lateral displacement at top of
wall at Maximum load: 0.255 in.
Observed Failure Mode: Sheathing edge tear-out/bearing failure
0 0.1 0.2 0.3 0.4 0.5 0.6 0.7 0.80
100
200
300
400
500
600
700
800
Displacement (in)
Load (
lb)
osb 54 track vert #1

127
Test Label: osb_54_track_vert_#2
Specimen Configuration
Wall dimension: 4 1/2 in. × 6 1/2 in. Track: 50ksi, 362S150-54
Sheathing: APA rated, 24/16, Exposure I, 7/16 OSB Grain direction: Vertical
Fastener: #8-18x1” modified truss head self-drilling screw
Test results Maximum load: 684.6 lbs
Net lateral displacement at top of
wall at Maximum load: 0.398 in.
Observed Failure Mode: Sheathing bearing failure/semi pull-through
0 0.1 0.2 0.3 0.4 0.5 0.6 0.7 0.80
100
200
300
400
500
600
700
Displacement (in)
Load (
lb)
osb 54 track vert #2

128
Test Label: osb_54_track_vert_#3
Specimen Configuration
Wall dimension: 4 1/2 in. × 6 1/2 in. Track: 50ksi, 362S150-54
Sheathing: APA rated, 24/16, Exposure I, 7/16 OSB Grain direction: Vertical
Fastener: #8-18x1” modified truss head self-drilling screw
Test results Maximum load: 753.8 lbs
Net lateral displacement at top of
wall at Maximum load: 0.385 in.
Observed Failure Mode: Sheathing bearing failure/semi pull-through and sheathing edge tear-out on the framing side
0 0.1 0.2 0.3 0.4 0.5 0.6 0.7 0.80
100
200
300
400
500
600
700
800
Displacement (in)
Load (
lb)
osb 54 track vert #3

129
Test Label: osb_54_track_vert_#4
Specimen Configuration
Wall dimension: 4 1/2 in. × 6 1/2 in. Track: 50ksi, 362S150-54
Sheathing: APA rated, 24/16, Exposure I, 7/16 OSB Grain direction: Vertical
Fastener: #8-18x1” modified truss head self-drilling screw
Test results Maximum load: 700.7 lbs
Net lateral displacement at top of
wall at Maximum load: 0.350 in.
Observed Failure Mode: Sheathing bearing failure/semi pull-through and sheathing tear-out on the framing side
0 0.1 0.2 0.3 0.4 0.5 0.6 0.7 0.80
100
200
300
400
500
600
700
800
Displacement (in)
Load (
lb)
osb 54 track vert #4
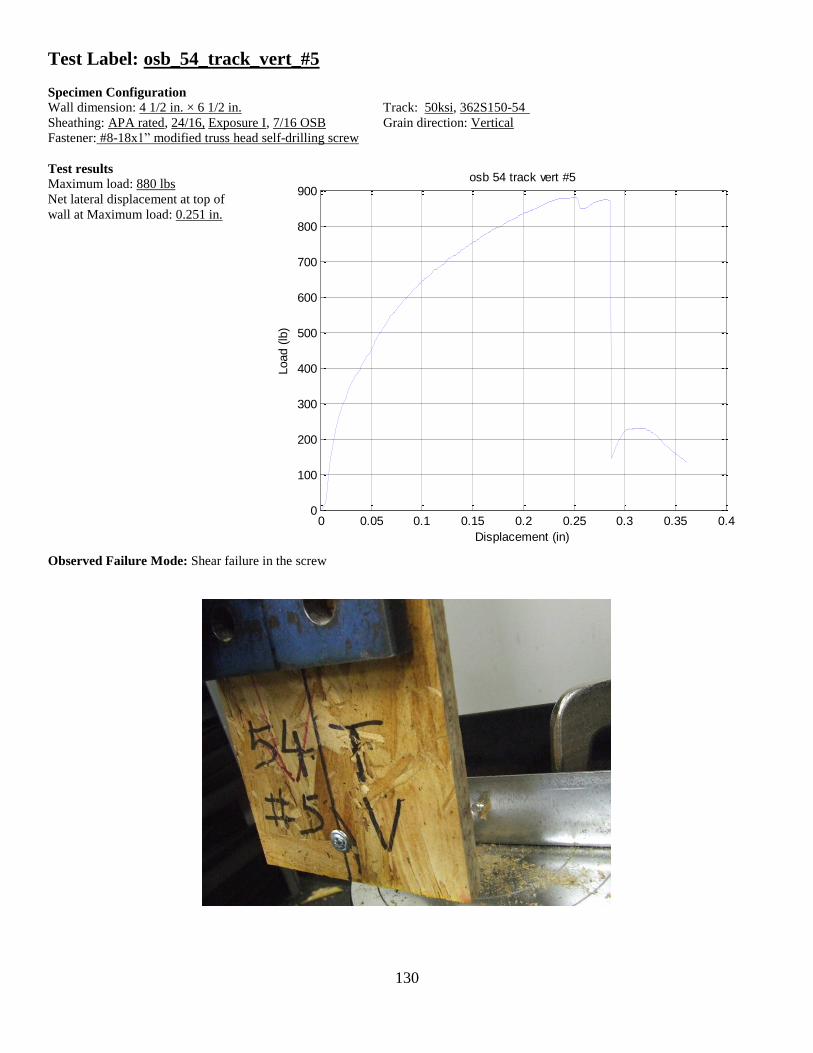
130
Test Label: osb_54_track_vert_#5
Specimen Configuration
Wall dimension: 4 1/2 in. × 6 1/2 in. Track: 50ksi, 362S150-54
Sheathing: APA rated, 24/16, Exposure I, 7/16 OSB Grain direction: Vertical
Fastener: #8-18x1” modified truss head self-drilling screw
Test results Maximum load: 880 lbs
Net lateral displacement at top of
wall at Maximum load: 0.251 in.
Observed Failure Mode: Shear failure in the screw
0 0.05 0.1 0.15 0.2 0.25 0.3 0.35 0.40
100
200
300
400
500
600
700
800
900
Displacement (in)
Load (
lb)
osb 54 track vert #5

131
Test Label: osb_54_track_vert_#6
Specimen Configuration
Wall dimension: 4 1/2 in. × 6 1/2 in. Track: 50ksi, 362S150-54
Sheathing: APA rated, 24/16, Exposure I, 7/16 OSB Grain direction: Vertical
Fastener: #8-18x1” modified truss head self-drilling screw
Test results Maximum load: 756.5 lbs
Net lateral displacement at top of
wall at Maximum load: 0.380 in.
Observed Failure Mode: Shear failure in the screw
0 0.05 0.1 0.15 0.2 0.25 0.3 0.35 0.40
100
200
300
400
500
600
700
800
Displacement (in)
Load (
lb)
osb 54 track vert #6

132
Test Label: ply_43_stud_horz_#1
Specimen Configuration
Wall dimension: 4 1/2 in. × 6 1/2 in. Stud: 33ksi, 362S162-43
Sheathing: APA rated, 32/16, Structural I, Exposure I, 15/32 4-Ply Grain direction: Horizontal
Fastener: #8-18x1” modified truss head self-drilling screw
Test results Maximum load: 884.8 lbs
Net lateral displacement at top of
wall at Maximum load: 0.544 in.
Observed Failure Mode: Sheathing bearing failure at the location of the screw/sheathing tear on the framing side
0 0.1 0.2 0.3 0.4 0.5 0.6 0.7 0.80
100
200
300
400
500
600
700
800
900
Displacement (in)
Load (
lb)
ply 43 stud horz #1

133
Test Label: ply_43_stud_horz_#2
Specimen Configuration
Wall dimension: 4 1/2 in. × 6 1/2 in. Stud: 33ksi, 362S162-43
Sheathing: APA rated, 32/16, Structural I, Exposure I, 15/32 4-Ply Grain direction: Horizontal
Fastener: #8-18x1” modified truss head self-drilling screw
Test results Maximum load: 824.7 lbs
Net lateral displacement at top of
wall at Maximum load: 0.552 in.
Observed Failure Mode: Sheathing bearing failure / semi pull-through
0 0.1 0.2 0.3 0.4 0.5 0.6 0.7 0.80
100
200
300
400
500
600
700
800
900
Displacement (in)
Load (
lb)
ply 43 stud horz #2

134
Test Label: ply_43_stud_horz_#3
Specimen Configuration
Wall dimension: 4 1/2 in. × 6 1/2 in. Stud: 33ksi, 362S162-43
Sheathing: APA rated, 32/16, Structural I, Exposure I, 15/32 4-Ply Grain direction: Horizontal
Fastener: #8-18x1” modified truss head self-drilling screw
Test results Maximum load: 869.8 lbs
Net lateral displacement at top of
wall at Maximum load: 0.456 in.
Observed Failure Mode: Sheathing bearing failure/sheathing tear on the framing side
0 0.1 0.2 0.3 0.4 0.5 0.6 0.7 0.80
100
200
300
400
500
600
700
800
900
Displacement (in)
Load (
lb)
ply 43 stud horz #3

135
Test Label: ply_43_stud_horz_#4
Specimen Configuration
Wall dimension: 4 1/2 in. × 6 1/2 in. Stud: 33ksi, 362S162-43
Sheathing: APA rated, 32/16, Structural I, Exposure I, 15/32 4-Ply Grain direction: Horizontal
Fastener: #8-18x1” modified truss head self-drilling screw
Test results Maximum load: 785.5 lbs
Net lateral displacement at top of
wall at Maximum load: 0.448 in.
Observed Failure Mode: Sheathing bearing failure/tear along the grain through the location of the screw
0 0.1 0.2 0.3 0.4 0.5 0.6 0.7 0.80
100
200
300
400
500
600
700
800
Displacement (in)
Load (
lb)
ply 43 stud horz #4

136
Test Label: ply_43_stud_horz_#5
Specimen Configuration
Wall dimension: 4 1/2 in. × 6 1/2 in. Stud: 33ksi, 362S162-43
Sheathing: APA rated, 32/16, Structural I, Exposure I, 15/32 4-Ply Grain direction: Horizontal
Fastener: #8-18x1” modified truss head self-drilling screw
Test results Maximum load: 686.2 lbs
Net lateral displacement at top of
wall at Maximum load: 0.392 in.
Observed Failure Mode: Sheathing bearing failure/tear along the grain through the location of the screw
0 0.1 0.2 0.3 0.4 0.5 0.6 0.70
100
200
300
400
500
600
700
Displacement (in)
Load (
lb)
ply 43 stud horz #5

137
Test Label: ply_43_stud_horz_#6
Specimen Configuration
Wall dimension: 4 1/2 in. × 6 1/2 in. Stud: 33ksi, 362S162-43
Sheathing: APA rated, 32/16, Structural I, Exposure I, 15/32 4-Ply Grain direction: Horizontal
Fastener: #8-18x1” modified truss head self-drilling screw
Test results Maximum load: 739.9 lbs
Net lateral displacement at top of
wall at Maximum load: 0.531 in.
Observed Failure Mode: Sheathing bearing failure/semi pull-through
0 0.1 0.2 0.3 0.4 0.5 0.6 0.7 0.80
100
200
300
400
500
600
700
800
Displacement (in)
Load (
lb)
ply 43 stud horz #6

138
Test Label: ply_43_stud_vert_#1
Specimen Configuration
Wall dimension: 4 1/2 in. × 6 1/2 in. Stud: 33ksi, 362S162-43
Sheathing: APA rated, 32/16, Structural I, Exposure I, 15/32 4-Ply Grain direction: Vertical
Fastener: #8-18x1” modified truss head self-drilling screw
Test results Maximum load: 477.9 lbs
Net lateral displacement at top of
wall at Maximum load: 0.601 in.
Observed Failure Mode: Shear failure in the screw
0 0.1 0.2 0.3 0.4 0.5 0.6 0.7 0.80
50
100
150
200
250
300
350
400
450
500
Displacement (in)
Load (
lb)
ply 43 stud vert #1

139
Test Label: ply_43_stud_vert_#2
Specimen Configuration
Wall dimension: 4 1/2 in. × 6 1/2 in. Stud: 33ksi, 362S162-43
Sheathing: APA rated, 32/16, Structural I, Exposure I, 15/32 4-Ply Grain direction: Vertical
Fastener: #8-18x1” modified truss head self-drilling screw
Test results Maximum load: 728.6 lbs
Net lateral displacement at top of
wall at Maximum load: 0.343 in.
Observed Failure Mode: Sheathing tear through the location of the screw
0 0.1 0.2 0.3 0.4 0.5 0.6 0.70
100
200
300
400
500
600
700
800
Displacement (in)
Load (
lb)
ply 43 stud vert #2

140
Test Label: ply_43_stud_vert_#1
Specimen Configuration
Wall dimension: 4 1/2 in. × 6 1/2 in. Stud: 33ksi, 362S162-43
Sheathing: APA rated, 32/16, Structural I, Exposure I, 15/32 4-Ply Grain direction: Vertical
Fastener: #8-18x1” modified truss head self-drilling screw
Test results Maximum load: 803.2 lbs
Net lateral displacement at top of
wall at Maximum load: 0.400 in.
Observed Failure Mode: Sheathing bearing failure/tear through the location of the screw
0 0.1 0.2 0.3 0.4 0.5 0.6 0.70
100
200
300
400
500
600
700
800
900
Displacement (in)
Load (
lb)
ply 43 stud vert #3

141
Test Label: ply_43_stud_vert_#4
Specimen Configuration
Wall dimension: 4 1/2 in. × 6 1/2 in. Stud: 33ksi, 362S162-43
Sheathing: APA rated, 32/16, Structural I, Exposure I, 15/32 4-Ply Grain direction: Vertical
Fastener: #8-18x1” modified truss head self-drilling screw
Test results Maximum load: 480.5 lbs
Net lateral displacement at top of
wall at Maximum load: 0.220 in.
Observed Failure Mode: Shear failure in the screw
0 0.05 0.1 0.15 0.2 0.25 0.3 0.35 0.4 0.450
50
100
150
200
250
300
350
400
450
500
Displacement (in)
Load (
lb)
ply 43 stud vert #4

142
Test Label: ply_43_stud_vert_#5
Specimen Configuration
Wall dimension: 4 1/2 in. × 6 1/2 in. Stud: 33ksi, 362S162-43
Sheathing: APA rated, 32/16, Structural I, Exposure I, 15/32 4-Ply Grain direction: Vertical
Fastener: #8-18x1” modified truss head self-drilling screw
Test results Maximum load: 590.1 lbs
Net lateral displacement at top of
wall at Maximum load: 0.275 in.
Observed Failure Mode: Sheathing tear through the location of the screw
0 0.05 0.1 0.15 0.2 0.25 0.3 0.35 0.4 0.450
100
200
300
400
500
600
Displacement (in)
Load (
lb)
ply 43 stud vert #5

143
Test Label: ply_43_stud_vert_#6
Specimen Configuration
Wall dimension: 4 1/2 in. × 6 1/2 in. Stud: 33ksi, 362S162-43
Sheathing: APA rated, 32/16, Structural I, Exposure I, 15/32 4-Ply Grain direction: Vertical
Fastener: #8-18x1” modified truss head self-drilling screw
Test results Maximum load: 535.8 lbs
Net lateral displacement at top of
wall at Maximum load: 0.297 in.
Observed Failure Mode: Sheathing tear through the location of the screw
0 0.05 0.1 0.15 0.2 0.25 0.3 0.35 0.40
100
200
300
400
500
600
Displacement (in)
Load (
lb)
ply 43 stud vert #6

144
Test Label: ply_43_track_horz_#1
Specimen Configuration
Wall dimension: 4 1/2 in. × 6 1/2 in. Track: 33ksi, 362T150-43
Sheathing: APA rated, 32/16, Structural I, Exposure I, 15/32 4-Ply Grain direction: Horizontal
Fastener: #8-18x1” modified truss head self-drilling screw
Test results Maximum load: 786.6 lbs
Net lateral displacement at top of
wall at Maximum load: 0.412 in.
Observed Failure Mode: Shear failure in screw
0 0.05 0.1 0.15 0.2 0.25 0.3 0.35 0.4 0.450
100
200
300
400
500
600
700
800
Displacement (in)
Load (
lb)
ply 43 track horz #1

145
Test Label: ply_43_track_horz_#2
Specimen Configuration
Wall dimension: 4 1/2 in. × 6 1/2 in. Track: 33ksi, 362T150-43
Sheathing: APA rated, 32/16, Structural I, Exposure I, 15/32 4-Ply Grain direction: Horizontal
Fastener: #8-18x1” modified truss head self-drilling screw
Test results Maximum load: 626.0 lbs
Net lateral displacement at top of
wall at Maximum load: 0.373 in.
Observed Failure Mode: Shear failure in screw
0 0.05 0.1 0.15 0.2 0.25 0.3 0.35 0.4 0.45 0.50
100
200
300
400
500
600
700
Displacement (in)
Load (
lb)
ply 43 track horz #2

146
Test Label: ply_43_track_horz_#3
Specimen Configuration
Wall dimension: 4 1/2 in. × 6 1/2 in. Track: 33ksi, 362T150-43
Sheathing: APA rated, 32/16, Structural I, Exposure I, 15/32 4-Ply Grain direction: Horizontal
Fastener: #8-18x1” modified truss head self-drilling screw
Test results Maximum load: 748.5 lbs
Net lateral displacement at top of
wall at Maximum load: 0.473 in.
Observed Failure Mode: Shear failure in screw
0 0.05 0.1 0.15 0.2 0.25 0.3 0.35 0.4 0.45 0.50
100
200
300
400
500
600
700
800
Displacement (in)
Load (
lb)
ply 43 track horz #3

147
Test Label: ply_43_track_horz_#4
Specimen Configuration
Wall dimension: 4 1/2 in. × 6 1/2 in. Track: 33ksi, 362T150-43
Sheathing: APA rated, 32/16, Structural I, Exposure I, 15/32 4-Ply Grain direction: Horizontal
Fastener: #8-18x1” modified truss head self-drilling screw
Test results Maximum load: 740.9 lbs
Net lateral displacement at top of
wall at Maximum load: 0.431 in.
Observed Failure Mode: Shear failure in screw
0 0.05 0.1 0.15 0.2 0.25 0.3 0.35 0.4 0.450
100
200
300
400
500
600
700
800
Displacement (in)
Load (
lb)
ply 43 track horz #4

148
Test Label: ply_43_track_horz_#5
Specimen Configuration
Wall dimension: 4 1/2 in. × 6 1/2 in. Track: 33ksi, 362T150-43
Sheathing: APA rated, 32/16, Structural I, Exposure I, 15/32 4-Ply Grain direction: Horizontal
Fastener: #8-18x1” modified truss head self-drilling screw
Test results Maximum load: 686.2 lbs
Net lateral displacement at top of
wall at Maximum load: 0.377 in.
Observed Failure Mode: Shear failure in screw
0 0.05 0.1 0.15 0.2 0.25 0.3 0.35 0.4 0.450
100
200
300
400
500
600
700
Displacement (in)
Load (
lb)
ply 43 track horz #5

149
Test Label: ply_43_track_horz_#6
Specimen Configuration
Wall dimension: 4 1/2 in. × 6 1/2 in. Track: 33ksi, 362T150-43
Sheathing: APA rated, 32/16, Structural I, Exposure I, 15/32 4-Ply Grain direction: Horizontal
Fastener: #8-18x1” modified truss head self-drilling screw
Test results Maximum load: 725.4 lbs
Net lateral displacement at top of
wall at Maximum load: 0.442 in.
Observed Failure Mode: Sheathing bearing failure / sheathing tears along the grain through the location of the screw
0 0.1 0.2 0.3 0.4 0.5 0.6 0.7 0.80
100
200
300
400
500
600
700
800
Displacement (in)
Load (
lb)
ply 43 track horz #6

150
Test Label: ply_43_track_horz_#1
Specimen Configuration
Wall dimension: 4 1/2 in. × 6 1/2 in. Track: 33ksi, 362T150-43
Sheathing: APA rated, 32/16, Structural I, Exposure I, 15/32 4-Ply Grain direction: Vertical
Fastener: #8-18x1” modified truss head self-drilling screw
Test results Maximum load: 668.5 lbs
Net lateral displacement at top of
wall at Maximum load: 0.408 in.
Observed Failure Mode: Sheathing bearing/tear-out failure
0 0.05 0.1 0.15 0.2 0.25 0.3 0.35 0.4 0.45 0.50
100
200
300
400
500
600
700
Displacement (in)
Load (
lb)
ply 43 track vert #1

151
Test Label: ply_43_track_vert_#2
Specimen Configuration
Wall dimension: 4 1/2 in. × 6 1/2 in. Track: 33ksi, 362T150-43
Sheathing: APA rated, 32/16, Structural I, Exposure I, 15/32 4-Ply Grain direction: Vertical
Fastener: #8-18x1” modified truss head self-drilling screw
Test results Maximum load: 616.4 lbs
Net lateral displacement at top of
wall at Maximum load: 0.451 in.
Observed Failure Mode: Sheathing bearing/tear-out failure through the location of the screw
0 0.1 0.2 0.3 0.4 0.5 0.6 0.70
100
200
300
400
500
600
700
Displacement (in)
Load (
lb)
ply 43 track vert #2
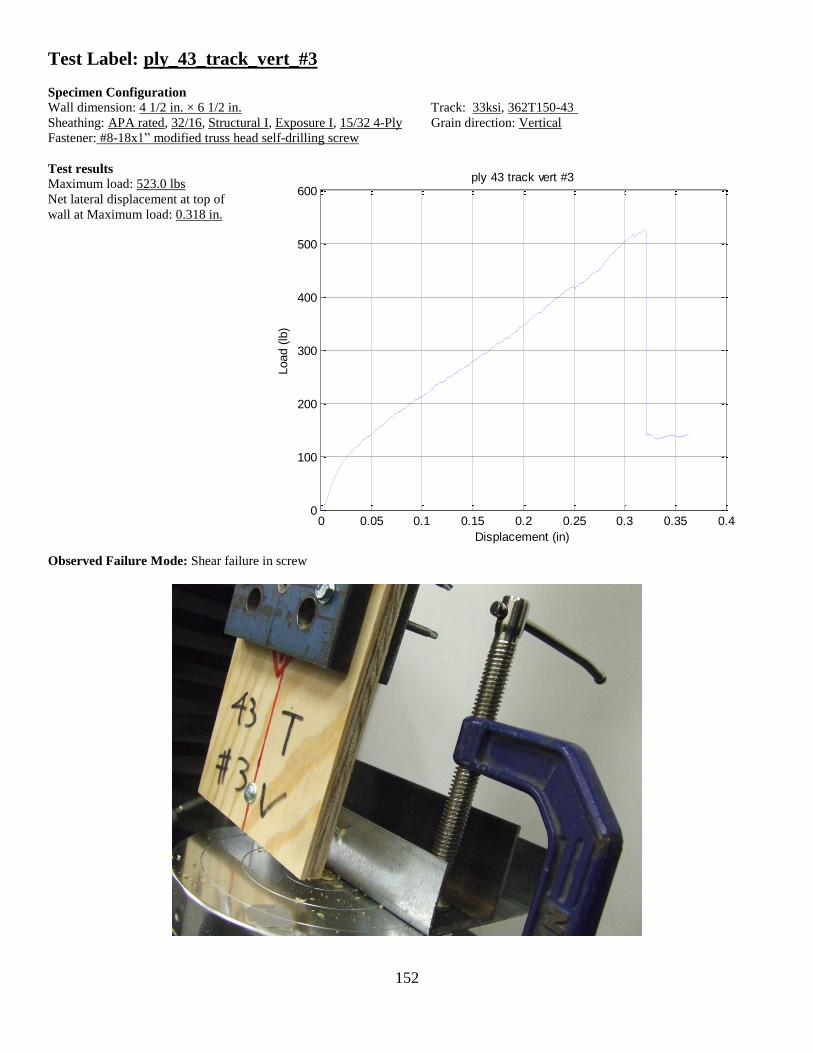
152
Test Label: ply_43_track_vert_#3
Specimen Configuration
Wall dimension: 4 1/2 in. × 6 1/2 in. Track: 33ksi, 362T150-43
Sheathing: APA rated, 32/16, Structural I, Exposure I, 15/32 4-Ply Grain direction: Vertical
Fastener: #8-18x1” modified truss head self-drilling screw
Test results Maximum load: 523.0 lbs
Net lateral displacement at top of
wall at Maximum load: 0.318 in.
Observed Failure Mode: Shear failure in screw
0 0.05 0.1 0.15 0.2 0.25 0.3 0.35 0.40
100
200
300
400
500
600
Displacement (in)
Load (
lb)
ply 43 track vert #3

153
Test Label: ply_43_track_vert_#4
Specimen Configuration
Wall dimension: 4 1/2 in. × 6 1/2 in. Track: 33ksi, 362T150-43
Sheathing: APA rated, 32/16, Structural I, Exposure I, 15/32 4-Ply Grain direction: Vertical
Fastener: #8-18x1” modified truss head self-drilling screw
Test results Maximum load: 722.7 lbs
Net lateral displacement at top of
wall at Maximum load: 0.363 in.
Observed Failure Mode: Tilting/bearing failure, eventually a shear failure in screw
0 0.05 0.1 0.15 0.2 0.25 0.3 0.35 0.4 0.45 0.50
100
200
300
400
500
600
700
800
Displacement (in)
Load (
lb)
ply 43 track vert #4

154
Test Label: ply_43_track_vert_#5
Specimen Configuration
Wall dimension: 4 1/2 in. × 6 1/2 in. Track: 33ksi, 362T150-43
Sheathing: APA rated, 32/16, Structural I, Exposure I, 15/32 4-Ply Grain direction: Vertical
Fastener: #8-18x1” modified truss head self-drilling screw
Test results Maximum load: 561.1 lbs
Net lateral displacement at top of
wall at Maximum load: 0.286 in.
Observed Failure Mode: Sheathing edge tear-out
0 0.1 0.2 0.3 0.4 0.5 0.6 0.70
100
200
300
400
500
600
Displacement (in)
Load (
lb)
ply 43 track vert #5

155
Test Label: ply_43_track_vert_#6
Specimen Configuration
Wall dimension: 4 1/2 in. × 6 1/2 in. Track: 33ksi, 362T150-43
Sheathing: APA rated, 32/16, Structural I, Exposure I, 15/32 4-Ply Grain direction: Vertical
Fastener: #8-18x1” modified truss head self-drilling screw
Test results Maximum load: 60.4.0 lbs
Net lateral displacement at top of
wall at Maximum load: 0.317 in.
Observed Failure Mode: Shear failure in screw
0 0.05 0.1 0.15 0.2 0.25 0.3 0.35 0.40
100
200
300
400
500
600
700
Displacement (in)
Load (
lb)
ply 43 track vert #6

156
APPENDIX D
DATA SHEETS OF PLYWOOD SHEATHED SHEAR WALL TESTS
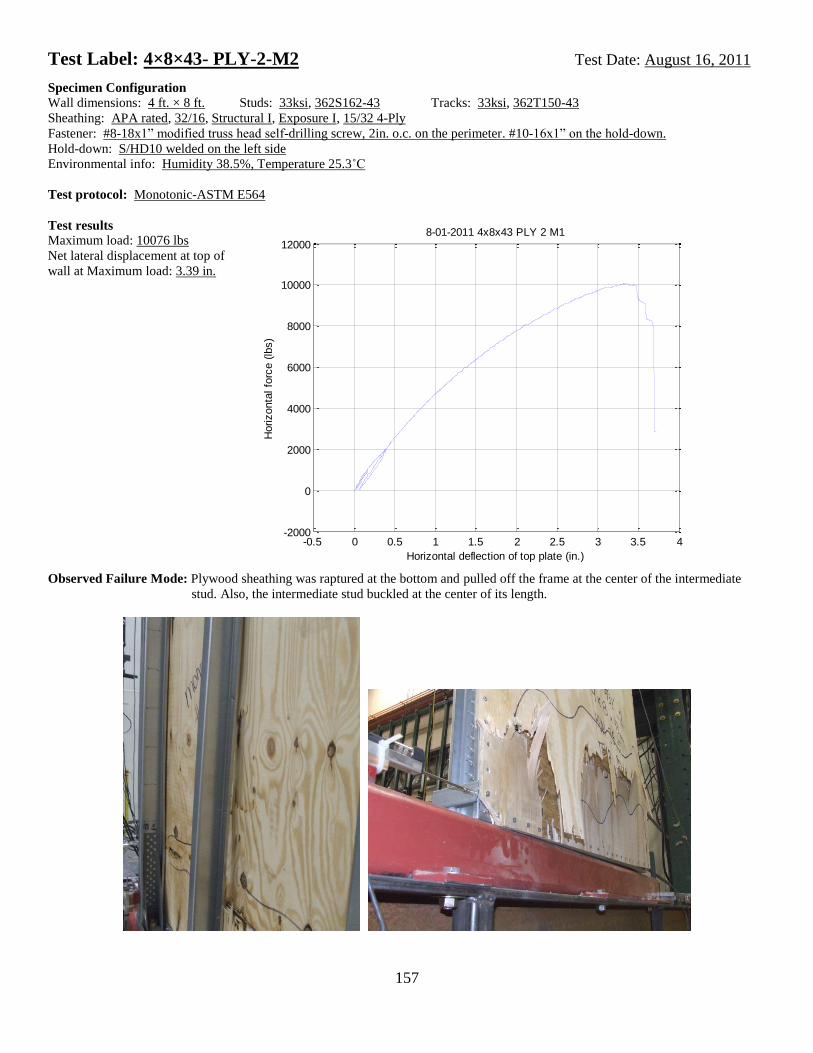
157
Test Label: 4×8×43- PLY-2-M2 Test Date: August 16, 2011
Specimen Configuration Wall dimensions: 4 ft. × 8 ft. Studs: 33ksi, 362S162-43 Tracks: 33ksi, 362T150-43
Sheathing: APA rated, 32/16, Structural I, Exposure I, 15/32 4-Ply
Fastener: #8-18x1” modified truss head self-drilling screw, 2in. o.c. on the perimeter. #10-16x1” on the hold-down.
Hold-down: S/HD10 welded on the left side Environmental info: Humidity 38.5%, Temperature 25.3˚C
Test protocol: Monotonic-ASTM E564
Test results Maximum load: 10076 lbs
Net lateral displacement at top of
wall at Maximum load: 3.39 in.
Observed Failure Mode: Plywood sheathing was raptured at the bottom and pulled off the frame at the center of the intermediate
stud. Also, the intermediate stud buckled at the center of its length.
-0.5 0 0.5 1 1.5 2 2.5 3 3.5 4-2000
0
2000
4000
6000
8000
10000
12000
Horizontal deflection of top plate (in.)
Horizonta
l fo
rce (
lbs)
8-01-2011 4x8x43 PLY 2 M1
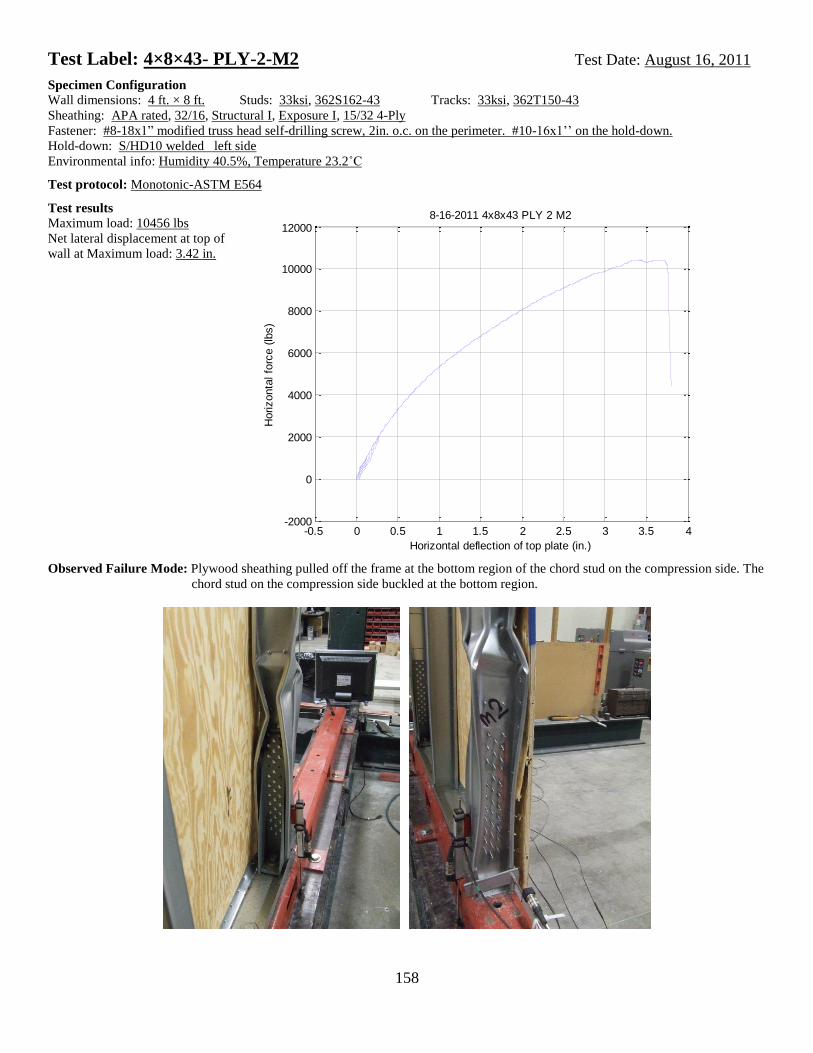
158
Test Label: 4×8×43- PLY-2-M2 Test Date: August 16, 2011
Specimen Configuration
Wall dimensions: 4 ft. × 8 ft. Studs: 33ksi, 362S162-43 Tracks: 33ksi, 362T150-43
Sheathing: APA rated, 32/16, Structural I, Exposure I, 15/32 4-Ply
Fastener: #8-18x1” modified truss head self-drilling screw, 2in. o.c. on the perimeter. #10-16x1’’ on the hold-down.
Hold-down: S/HD10 welded left side Environmental info: Humidity 40.5%, Temperature 23.2˚C
Test protocol: Monotonic-ASTM E564
Test results Maximum load: 10456 lbs
Net lateral displacement at top of
wall at Maximum load: 3.42 in.
Observed Failure Mode: Plywood sheathing pulled off the frame at the bottom region of the chord stud on the compression side. The
chord stud on the compression side buckled at the bottom region.
-0.5 0 0.5 1 1.5 2 2.5 3 3.5 4-2000
0
2000
4000
6000
8000
10000
12000
Horizontal deflection of top plate (in.)
Horizonta
l fo
rce (
lbs)
8-16-2011 4x8x43 PLY 2 M2

159
Test Label: 4×8×43- PLY-6-M1 Test Date: August 16, 2011
Specimen Configuration
Wall dimensions: 4 ft. × 8 ft. Studs: 33ksi, 362S162-43 Tracks: 33ksi, 362T150-43
Sheathing: APA rated, 32/16, Structural I, Exposure I, 15/32 4-Ply
Fastener: #8-18x1” modified truss head self-drilling screw, 6in. o.c. on the perimeter. #10-16x1’’ on the hold-down.
Hold-down: S/HD10 / welded left side Environmental info: N.A.
Test protocol: Monotonic-ASTM E564
Test results Maximum load: 4616 lbs
Net lateral displacement at top of
wall at Maximum load: 2.09 in.
Observed Failure Mode: Plywood sheathing pulled off the frame along the bottom track and also along both of the chord studs at the
lower half of the frame.
-0.5 0 0.5 1 1.5 2 2.5 3 3.5 4 4.5-1000
0
1000
2000
3000
4000
5000
Horizontal deflection of top plate (in.)
Horizonta
l fo
rce (
lbs)
8-16-2011 4x8x43 PLY 6 M1

160
Test Label: 4×8×43- PLY-6-M2 Test Date: August 16, 2011
Specimen Configuration
Wall dimensions: 4 ft. × 8 ft. Studs: 33ksi, 362S162-43 Tracks: 33ksi, 362T150-43
Sheathing: APA rated, 32/16, Structural I, Exposure I, 15/32 4-Ply
Fastener: #8-18x1” modified truss head self-drilling screw, 6in. o.c. on the perimeter. #10-16x1’’ on the hold-down.
Hold-down: S/HD10 / welded left side Environmental info: N.A.
Test protocol: Monotonic-ASTM E564
Test results Maximum load: 4273 lbs
Net lateral displacement at top of
wall at Maximum load: 1.94 in.
Observed Failure Mode: One of the screws pulled off the top track at the top corner of the frame on the loading side. Screws tilted
because of the steel framing bearing failure along the boundary studs
-0.5 0 0.5 1 1.5 2 2.5-500
0
500
1000
1500
2000
2500
3000
3500
4000
4500
Horizontal deflection of top plate (in.)
Horizonta
l fo
rce (
lbs)
8-16-2011 4x8x43 PLY 6 M2

161
Test Label: 4×8×43- PLY-2-C1 Test Date: August 17, 2011
Specimen Configuration
Wall dimensions: 4 ft. × 8 ft. Studs: 33ksi, 362S162-43 Tracks: 33ksi, 362T150-43
Sheathing: APA rated, 32/16, Structural I, Exposure I, 15/32 4-Ply
Fastener: #8-18x1” modified truss head self-drilling screw, 2in. o.c. on the perimeter. #10-16x1’’ on the hold-down.
Hold-down: S/HD10 Environmental info: N.A.
Test protocol: Cyclic-CRUEE, reference displacement: 1.23 in. @ 43 cycles plus 3 cycles
Test results Maximum +load: 10278 lbs
Net lateral displacement at top of
wall at Maximum +load: 2.83 in.
Maximum -load: 10557 lbs
Net lateral displacement at top of
wall at Maximum -load: 2.53 in.
Average maximum load: 10418 lbs
Average net displacement: 2.68 in.
Observed Failure Mode: Plywood sheathing fractured and the chord stud on the loading side was distorted at the top region. Bearing
failure of sheathing at fasteners along the top track was evident and the sheathing edge was almost torn off.
-4 -3 -2 -1 0 1 2 3-1.5
-1
-0.5
0
0.5
1
1.5x 10
4
Horizontal deflection of top plate (in.)
Horizonta
l fo
rce (
lbs)
8-17-2011 4x8x43 PLY 2 C1

162
Test Label: 4×8×43- PLY-2-C2 Test Date: August 19, 2011
Specimen Configuration
Wall dimensions: 4 ft. × 8 ft. Studs: 33ksi, 362S162-43 Tracks: 33ksi, 362T150-43
Sheathing: APA rated, 32/16, Structural I, Exposure I, 15/32 4-Ply
Fastener: #8-18x1” modified truss head self-drilling screw, 2in. o.c. on the perimeter. #10-16x1’’ on the hold-down.
Hold-down: S/HD10 Environmental info: Humidity 43.4%, Temperature 22.9˚C
Test protocol: Cyclic-CRUEE, reference displacement: 1.23 in. @ 46 cycles plus 3 cycles
Test results Maximum +load: 11193 lbs
Net lateral displacement at top of
wall at Maximum +load: 2.94 in.
Maximum -load: 10650 lbs
Net lateral displacement at top of
wall at Maximum -load: 2.88 in.
Average maximum load: 10922 lbs
Average net displacement: 2.91 in.
Observed Failure Mode: Plywood sheathing fractured at the bottom corner on the loading side and finally pulled off the frame along
the bottom track. Also, screws were pulled through the sheathing and some screw heads were sheared off
along the bottom track.
-4 -3 -2 -1 0 1 2 3 4-1.5
-1
-0.5
0
0.5
1
1.5x 10
4
Horizontal deflection of top plate (in.)
Horizonta
l fo
rce (
lbs)
9-19-2011 4x8x43 PLY 2 C2

163
Test Label: 4×8×43- PLY-4-C1-Retest Test Date: October 21, 2011
Specimen Configuration
Wall dimensions: 4 ft. × 8 ft. Studs: 33ksi, 362S162-43 Tracks: 33ksi, 362T150-43
Sheathing: APA rated, 32/16, Structural I, Exposure I, 15/32 4-Ply
Fastener: #8-18x1” modified truss head self-drilling screw, 4in. o.c. on the perimeter. #10-16x1’’ on the hold-down.
Hold-down: S/HD10 Environmental info: Humidity 31.3%, Temperature 21.1˚C
Test protocol: Cyclic-CRUEE, reference displacement: 2.8 in. @ 40 cycles
Test results Maximum +load: 7165 lbs
Net lateral displacement at top of
wall at Maximum +load: 1.96 in.
Maximum -load: 6293 lbs
Net lateral displacement at top of
wall at Maximum -load: 1.86 in.
Average maximum load: 6729 lbs
Average net displacement: 1.91 in.
Observed Failure Mode: Plywood sheathing pulled off the frame along the chord stud on the loading side, the top track on the
loading side, and the bottom track because the screws were pulled though the sheathing and some screw
heads were sheared off.
-5 -4 -3 -2 -1 0 1 2 3 4 5-8000
-6000
-4000
-2000
0
2000
4000
6000
8000
Horizontal deflection of top plate (in.)
Horizonta
l fo
rce (
lbs)
10-21-2011 4x8x43 PLY 4 C1 Retest

164
Test Label: 4×8×43- PLY-4-C2 Test Date: October 21, 2011
Specimen Configuration
Wall dimensions: 4 ft. × 8 ft. Studs: 33ksi, 362S162-43 Tracks: 33ksi, 362T150-43
Sheathing: APA rated, 32/16, Structural I, Exposure I, 15/32 4-Ply
Fastener: #8-18x1” modified truss head self-drilling screw, 4in. o.c. on the perimeter. #10-16x1’’ on the hold-down.
Hold-down: S/HD10 Environmental info: Humidity 30.6%, Temperature 21.5˚C
Test protocol: Cyclic-CRUEE, reference displacement: 2.8 in. @ 40 cycles
Test results Maximum +load: 6868 lbs
Net lateral displacement at top of
wall at Maximum +load: 1.94 in.
Maximum -load: 6908 lbs
Net lateral displacement at top of
wall at Maximum -load: 1.87 in.
Average maximum load: 6888 lbs
Average net displacement: 1.91 in.
Observed Failure Mode: Plywood sheathing pulled off the frame along the bottom track and chord studs at the lower half region
because the screws were pulled though the sheathing and some screw heads were sheared off.
-5 -4 -3 -2 -1 0 1 2 3 4 5-8000
-6000
-4000
-2000
0
2000
4000
6000
8000
Horizontal deflection of top plate (in.)
Horizonta
l fo
rce (
lbs)
10-21-2011 4x8x43 PLY 4 C2

165
Test Label: 4×8×43- PLY-6-C1 Test Date: September, 2011
Specimen Configuration
Wall dimensions: 4 ft. × 8 ft. Studs: 33ksi, 362S162-43 Tracks: 33ksi, 362T150-43
Sheathing: APA rated, 32/16, Structural I, Exposure I, 15/32 4-Ply
Fastener: #8-18x1” modified truss head self-drilling screw, 6in. o.c. on the perimeter. #10-16x1’’ on the hold-down.
Hold-down: S/HD10 Environmental info: Humidity 38.9%, Temperature 22.6˚C
Test protocol: Cyclic-CRUEE, reference displacement: 1.23 in. @ 49 cycles
Test results Maximum +load: 4533 lbs
Net lateral displacement at top of
wall at Maximum +load: 1.82 in.
Maximum -load: 3694 lbs
Net lateral displacement at top of
wall at Maximum -load: 1.51 in.
Average maximum load: 4114 lbs
Average net displacement: 1.67 in.
Observed Failure Mode: Plywood sheathing pulled off the frame along the chord stud on the loading side because the screws were
pulled though the sheathing and some screw heads were sheared off. One of the screws that were
connecting the loading T-beam to the top track was pulled off.
-4 -3 -2 -1 0 1 2 3 4 5-4000
-3000
-2000
-1000
0
1000
2000
3000
4000
5000
Horizontal deflection of top plate (in.)
Horizonta
l fo
rce (
lbs)
9-20-2011 4x8x43 PLY 6 C1

166
Test Label: 4×8×43- PLY-6-C1 Test Date: September, 2011
Specimen Configuration
Wall dimensions: 4 ft. × 8 ft. Studs: 33ksi, 362S162-43 Tracks: 33ksi, 362T150-43
Sheathing: APA rated, 32/16, Structural I, Exposure I, 15/32 4-Ply
Fastener: #8-18x1” modified truss head self-drilling screw, 6in. o.c. on the perimeter. #10-16x1’’ on the hold-down.
Hold-down: S/HD10 Environmental info: Humidity 40.5%, Temperature 23.2˚C
Test protocol: Cyclic-CRUEE, reference displacement: 1.23 in. @ 49 cycles
Test results Maximum +load: 4542 lbs
Net lateral displacement at top of
wall at Maximum +load: 1.73 in.
Maximum -load: 3395 lbs
Net lateral displacement at top of
wall at Maximum -load: 1.83 in.
Average maximum load: 3969 lbs
Average net displacement: 1.78
in.
Observed Failure Mode: Plywood sheathing fractured in the middle at the lower half region and finally pulled off the frame along
the bottom track, intermediate stud, and the chord stud on the loading side because the screws were pulled
though the sheathing and some screw heads were sheared off. Also, some screws pulled off the T-beam
connected to the top track.
-4 -3 -2 -1 0 1 2 3 4-4000
-3000
-2000
-1000
0
1000
2000
3000
4000
5000
Horizontal deflection of top plate (in.)
Horizonta
l fo
rce (
lbs)
9-21-2011 4x8x43 PLY 6 C2

167
REFERENCES
ACI 318 (2005), “Building Code Requirements for Structural Concrete and Commentary”,
American Concrete Institute, Detroit, MI.
AISC (2005), “Seismic Provisions for Structural Steel Buildings”, ANSI/AISC 341-05,
American Institute of Steel Construction, Inc., Chicago, IL.
AISI S100 (2007). North American Specification for Cold-Formed Steel Structural Members,
2007 Edition. American Iron and Steel Institute, Washington, D.C.
AISI S213 (2007). North American Standard for Cold-Formed Steel Framing – Lateral
Provisions. American Iron and Steel Institute, Washington, D.C., AISI-S213-07
ASTM E2126. (2007), “Standard Test Methods for Cyclic (Reversed) Load Test for Shear
Resistance of Vertical Elements of the Lateral Force Resisting Systems for Buildings,” ASTM
International, West Conshohocken, PA, USA.
Balh, N. (2010). “Development of Seismic Design Provisions for Steel Sheathed Shear Walls”,
M.Eng. Thesis, Department of Civil Engineering and Applied Mechanics, McGill University.
Montreal, QC, Canada.
Berman, J.W. and Bruneau, M. (2003b), “Plastic Analysis and Design of Steel Plate Shear Walls,”
Journal of Structural Engineering, ASCE, Vol. 129, No. 11, pp. 1448–1456.
Berman, J.W. and Bruneau, M. (2004), “Steel Plate Shear Walls are Not Plate Girders,”
Engineering Journal, AISC, Vol. 41, No. 3, pp. 95–106.
Berman, J. and Bruneau, M. (2005). ”Experimental Investigation of Light-Gauge Steel Plate
Shear Walls.” Journal of Structural Engineering, ASCE, Vol.131, No. 2, pp. 259–267.
Blais, C. (2006), “Testing and analysis of light gauge steel frame / 9mm OSB panel shear walls,”
M.Eng. thesis, Department of Civil Engineering and Applied Mechanics, McGill University.
Montreal, QC, Canada.
Boudreault, F.A. (2005), “Seismic analysis of steel frame / wood panel shear walls”, M.Eng.
thesis, Department of Civil Engineering and Applied Mechanics, McGill University. Montreal,
QC, Canada.

168
Branston, A.E. (2004), “Development of a design methodology for steel frame / wood panel
shear walls”, M.Eng. thesis, Department of Civil Engineering and Applied Mechanics, McGill
University. Montreal, QC, Canada.
BSSC (2004), “NEHRP Recommended Provisions for Seismic Regulations for New Buildings
and Other Structures,” FEMA 450-1/2003 Edition, Building Seismic Safety Council,
Washington, DC.
Cassese, V., Elgaaly, M., and Chen, R. (1993), “Experimental Study of Thin Steel-Plate Shear
Walls Under Cyclic Load,” Journal of Structural Engineering, ASCE, Vol.119, No. 2, Feb.,
pp. 573–587.
Chen, C.Y. (2004), “Testing and performance of steel frame / wood panel shear walls,” M.Eng.
thesis, Department of Civil Engineering and Applied Mechanics, McGill University. Montreal,
QC, Canada.
Driver, R.G., Kulak, G.L., Kennedy, D.J.L., and Elwi, A.E. (1998), “Cyclic Test of Four-Story
Steel Plate Shear Wall,” Journal of Structural Engineering, ASCE, Vol. 124, No. 2, Feb. 1998,
pp. 112–120.
Easley, J. T, Foomani, M., and Dodds, R. H. (1982), "Formulas for Wood Shear Walls," Journal
of Structural Division, ASCE, Vol. 108 No. ST11, pp. 2460-2478.
Elgaaly, M. (1998), “Thin Steel Plate Shear Walls Behavior and Analysis,” Thin Walled
Structures, Vol. 32, pp. 151–180.
Elgaaly, M., Cassese, V., and Du, C. (1993), “Post-buckling Behavior of Steel-Plate Shear Walls
Under Cyclic Loads,” Journal of Structural Engineering, ASCE, Vol. 119, No. 2, Feb. 1993,
pp. 588–605.
Elgaaly, M. and Lui, Y. (1997), “Analysis of Thin-Steel- Plate Shear Walls,” Journal of
Structural Engineering, ASCE, Vol. 123, No. 11, Nov., pp. 1487–1496.
Foliente, G.C. (1996), “Issues in Seismic Performance Testing and Evaluation of Timber
Structural Systems,” Proc., International Wood Engineering Conference. New Orleans, LA,
USA, Vol. 1, 29 – 36.
IBC (2006). “International Building Code”, International Code Council, Washington, DC.

169
Kallsner, B. and Lam, F. (1995), “Diaphragms and Shear Walls,” STEP Lectures: Holzbauwerke
nach Eurocode 5-Grundlagen, Entwicklungen, Ergaenzungen, Fachverlag Holz, Duesseldorf,
Germany, pp. 15/1-15/19.
Krawinkler, H., Parisi, F., Ibarra, L., Ayoub, A., Medina, R. (2000), “Development of a Testing
Protocol for Woodframe Structures,”, Report W-02 covering Task 1.3.2, CUREE/Caltech
Woodframe Project. Consortium of Universities for Research in Earthquake Engineering
(CUREE). Richmond, CA, USA.
Li, C. (2012), “Nominal Shear Strength of Cold-formed Steel Shear Walls Using OSB
Sheathing,” M.Sci. Thesis, Department of Engineering Technology, University of North
Texas. Denton, TX.
Lubell, A.S., Prion, H.G.L., Ventura, C.E., and Rezai, M. (2000), “Unstiffened Steel Plate Shear
Wall Performance under Cyclic Loading,” Journal of Structural Engineering, ASCE, Vol. 126,
No. 4, pp. 453–460.
Okasha, A. (2004), "Evaluation of Connection Performance for Steel Frame / Wood Panel Shear
Walls," M.Eng. Department of Civil Engineering and Applied Mechanics, McGill University.
Montreal, QC, Canada.
Park, R. (1989), “Evaluation of Ductility of Structures and Structural Assemblages from
Laboratory Testing,” Bulletin of the New Zealand National Society for Earthquake
Engineering, Vol. 22, No. 3, 155 – 166.
Rezai, M. (1999), “Seismic Behavior of Steel Plate Shear Walls by Shake Table Testing,” Ph.D.
Dissertation, University of British Columbia, Vancouver, British Columbia, Canada.
Roberts, T.M. and Sabouri-Ghomi, S. (1992), “Hysteretic Characteristics of Unstiffened
Perforated Steel Plate Shear Walls,” Thin Walled Structures, Vol. 14, pp. 139–151.
Rokas, D. (2006), “Testing of Steel Frame / 9.5 mm CSP Wood Panel Shear Walls”, M.Eng.
thesis, Department of Civil Engineering and Applied Mechanics, McGill University. Montreal,
QC, Canada.
Sabouri-Ghomi, S. and Roberts, T.M. (1992), “Nonlinear Dynamic Analysis of Steel Plate Shear
Walls Including Shear and Bending Deformations,” Engineering Structures, Vol. 14, No. 3,
pp. 309–317.

170
Serrette, R.L. (1997). “Additional Shear Wall Values for Light Weight Steel Framing.” Report
No. LGSRG-1-97, Santa Clara University. Santa Clara, CA.
Serrette, R.L. (2002) “Performance of Cold-Formed Steel –Framed Shear walls: Alternative
Configurations,” Final Report : LGSRG-06-02, Santa Clara University. Santa Clara, CA.
Serrette, R., Hall, G., Nguyen, H. (1996a), “Dynamic Performance of Light Gauge Steel Framed
Shear Walls,” Proc., Thirteenth International Specialty Conference on Cold-Formed Steel
Structures. St-Louis, MO, USA, 487 – 498.
Serrette, R.L., Nguyen, H., and Hall, G. (1996b). “Shear wall values for light weight steel
framing.” Report No. LGSRG-3-96, Santa Clara University. Santa Clara, CA.
Thorburn, L.J., Kulak, G.L., and Montgomery, C.J. (1983), “Analysis of Steel Plate Shear Walls,”
Structural Engineering Report No. 107, Department of Civil Engineering, University of
Alberta, Edmonton, Alberta, Canada.
Timler, P.A. and Kulak, G.L. (1983), “Experimental Study of Steel Plate Shear Walls,”
Structural Engineering Report No. 114, Department of Civil Engineering, University of
Alberta, Edmonton, Alberta, Canada.
Tromposch, E.W. and Kulak, G.L. (1987), “Cyclic and Static Behaviour of Thin Panel Steel
Plate Shear Walls,” Structural Engineering Report No. 145, Department of Civil Engineering,
University of Alberta, Edmonton, Alberta, Canada.
Tuomi, R. L. and McCutcheon, W. J. (1978), “Racking Strength of Light-Frame Nailed Walls,”
ASCE, Vol. 104, No. ST7, July 1978. pp. 1131-1140.
Vian, D. and Bruneau, M. (2005). “Steel plate shear walls for seismic design and retrofit of
building structures.” Tech. Rep. MCEER-05-0010, Multidisciplinary Center for Earthquake
Engineering Research, State University of New York at Buffalo, Buffalo, New York.
Yu, C. (2007). ”Steel Sheet Sheathing Options for Cold-Formed Steel Framed Shear Wall
Assemblies,” Research Report RP07-3 submitted to American Iron and Steel Institute,
Washington, DC.
171
Yu, C. and Chen, Y. (2009). “Steel Sheet Sheathing Options for Cold-Formed Steel Framed
Shear Wall Assemblies Providing Shear Resistance - Phase 2, Research Report.” RP09-2,
American Iron and Steel Institute, Washington, D.C.