Analytical electron tomography mapping of the SiC pore oxidation at the nanoscale
11
Analytical electron tomography mapping of the SiC pore oxidation at the nanoscale† Ileana Florea, a Ovidiu Ersen, * a Charles Hirlimann, a Lucian Roiban, a Adrien Deneuve, b Matthieu Houll e, b Izabela Janowska, b Patrick Nguyen, c Charlotte Pham c and Cuong Pham-Huu b Received 28th June 2010, Accepted 21st July 2010 DOI: 10.1039/c0nr00449a Silicon carbide is a ceramic material that has been widely studied because of its potential applications, ranging from electronics to heterogeneous catalysis. Recently, a new type of SiC materials with a medium specific surface area and thermal conductivity, called b-SiC, has attracted overgrowing interest as a new class of catalyst support in several catalytic reactions. A primary electron tomography study, performed in usual mode, has revealed a dual surface structure defined by two types of porosities made of networks of connected channels with sizes larger than 50 nm and ink-bottled pores with sizes spanning from 4 to 50 nm. Depending on the solvent nature, metal nanoparticles could be selectively deposited inside one of the two porosities, a fact that illustrates a selective wetting titration of the two types of surfaces by different liquids. The explaining hypothesis that has been put forward was that this selectivity against solvents is related to the pore surface oxidation degree of the two types of pores. A new technique of analytical electron tomography, where the series of projections used to reconstruct the volume of an object is recorded in energy filtered mode (EFTEM), has been implemented to map the pore oxidation state and to correlate it with the morphology and the accessibility of the porous network. Applied, for the first time, at a nanoscale resolution, this technique allowed us to obtain 3D elemental maps of different elements present in the analysed porous grains, in particular oxygen; we found thus that the interconnected channel pores are more rapidly oxidized than the ink-bottled ones. Alternatively, our study highlights the great interest of this method that opens the way for obtaining precise information on the chemical composition of a 3D surface at a nanometer scale. Introduction Silicon carbide is a ceramic material that has been widely studied because of its potential applications, ranging from electronics to heterogeneous catalysis. 1 Alpha silicon carbide (a-SiC) is the most common crystalline form of the material exhibiting a wurtzite like hexagonal crystalline structure. The beta poly- morph of silicon carbide (b-SiC), that exhibits a zinc blend crystal structure, has attracted a growing interest during the last decades as a new class of catalyst support owing to its relatively large specific surface area (>20 m 2 g 1 ) as compared to a-SiC synthesized via the Acheson process that leads to low specific surface areas (0.1–1 m 2 g 1 ). 2 The SiC material is also thermally conductive compared to traditional catalyst supports such as alumina or silica and that could allow a rapid heat transfer throughout the catalyst body and thus, prevent hot spots formation in exothermic reactions which is detrimental for the reaction selectivity. 1 The medium specific surface area allows for the deposition of metallic active phases with reasonably high dispersion while the good thermal conductivity of the substrate strongly influences the selectivity of the catalyst for exothermic reactions like the Fischer–Tropsch synthesis (FTS), 3 n-butane partial oxidation, 4 H 2 S selective oxidation 5 or methanol dehy- dration to dimethylether. 6 These properties are attributed to the synthesis method based on a gas-solid reaction involving SiC vapour and solid carbon at moderate temperature (about 1400 C) that avoids the sintering of the material, as it is the case of high-temperature synthesis. 7 Previous analysis based on gas adsorption and mercury intrusion methods have shown that this specific preparation generates a dual porosity inside the material, made of mesopores (4–50 nm) and macropores (>50 nm), giving rise to two types of SiC surfaces. One should expect that the reactivity of these spatially separated surfaces, especially towards oxygen, depends strongly on the morphology, the accessibility and the hydrophilic-hydrophobic character of the corresponding pores. A recent electron tomography study has shown that beta SiC exhibits a dual surface structure corresponding to a porosity made of a network of connected channels (C-pore) with typical sizes larger than 50 nm and ink-bottled pores (R-pore) with sizes spanning from 4 to 50 nm. 8 The channel pores have been observed to be easily wetted by water, i.e. they have a hydrophilic surface behaviour, whereas the ink-bottled pores are wetted by alcoholic or organic solvents, i.e. their surface has a hydrophobic behaviour. From this observation the hypothesis has been put forward that this selective wetting against solvents could be related to the oxidation degree of the two classes of pores: hydrophilic surface containing a higher concentration of the a Institut de Physique et Chimie des Mat eriaux de Strasbourg, CNRS - Universit e de Strasbourg (UDS) UMR 7504, 23, rue du Loess, BP 43, 67037 Strasbourg cedex 02, France. E-mail: ovidiu.ersen@ipcms. u-strasbg.fr; Fax: +33(0) 03 88 10 72 48; Tel: +33(0) 03 88 10 70 28 b Laboratoire des Mat eriaux, Surfaces et Proc ed es pour la Catalyse, CNRS - Universit e de Strasbourg (UDS), UMR 7515, 25, rue Becquerel, 67087 Strasbourg cedex 08, France c Technical Center, Sicat, 1, rue du Broetch, 67700 Otterswiller, France † Electronic supplementary information (ESI) available: SI-1–SI-4. See DOI: 10.1039/c0nr00449a 2668 | Nanoscale, 2010, 2, 2668–2678 This journal is ª The Royal Society of Chemistry 2010 PAPER www.rsc.org/nanoscale | Nanoscale Published on 11 October 2010. Downloaded on 22/10/2014 19:52:43. View Article Online / Journal Homepage / Table of Contents for this issue
Transcript of Analytical electron tomography mapping of the SiC pore oxidation at the nanoscale
PAPER www.rsc.org/nanoscale | Nanoscale
Publ
ishe
d on
11
Oct
ober
201
0. D
ownl
oade
d on
22/
10/2
014
19:5
2:43
. View Article Online / Journal Homepage / Table of Contents for this issue
Analytical electron tomography mapping of the SiC pore oxidation at thenanoscale†
Ileana Florea,a Ovidiu Ersen,*a Charles Hirlimann,a Lucian Roiban,a Adrien Deneuve,b Matthieu Houll�e,b
Izabela Janowska,b Patrick Nguyen,c Charlotte Phamc and Cuong Pham-Huub
Received 28th June 2010, Accepted 21st July 2010
DOI: 10.1039/c0nr00449a
Silicon carbide is a ceramic material that has been widely studied because of its potential applications,
ranging from electronics to heterogeneous catalysis. Recently, a new type of SiC materials with
a medium specific surface area and thermal conductivity, called b-SiC, has attracted overgrowing
interest as a new class of catalyst support in several catalytic reactions. A primary electron tomography
study, performed in usual mode, has revealed a dual surface structure defined by two types of porosities
made of networks of connected channels with sizes larger than 50 nm and ink-bottled pores with sizes
spanning from 4 to 50 nm. Depending on the solvent nature, metal nanoparticles could be selectively
deposited inside one of the two porosities, a fact that illustrates a selective wetting titration of the two
types of surfaces by different liquids. The explaining hypothesis that has been put forward was that this
selectivity against solvents is related to the pore surface oxidation degree of the two types of pores. A
new technique of analytical electron tomography, where the series of projections used to reconstruct the
volume of an object is recorded in energy filtered mode (EFTEM), has been implemented to map the
pore oxidation state and to correlate it with the morphology and the accessibility of the porous
network. Applied, for the first time, at a nanoscale resolution, this technique allowed us to obtain 3D
elemental maps of different elements present in the analysed porous grains, in particular oxygen; we
found thus that the interconnected channel pores are more rapidly oxidized than the ink-bottled ones.
Alternatively, our study highlights the great interest of this method that opens the way for obtaining
precise information on the chemical composition of a 3D surface at a nanometer scale.
Introduction
Silicon carbide is a ceramic material that has been widely studied
because of its potential applications, ranging from electronics to
heterogeneous catalysis.1 Alpha silicon carbide (a-SiC) is the
most common crystalline form of the material exhibiting a
wurtzite like hexagonal crystalline structure. The beta poly-
morph of silicon carbide (b-SiC), that exhibits a zinc blend
crystal structure, has attracted a growing interest during the last
decades as a new class of catalyst support owing to its relatively
large specific surface area (>20 m2 g�1) as compared to a-SiC
synthesized via the Acheson process that leads to low specific
surface areas (0.1–1 m2 g�1).2 The SiC material is also thermally
conductive compared to traditional catalyst supports such as
alumina or silica and that could allow a rapid heat transfer
throughout the catalyst body and thus, prevent hot spots
formation in exothermic reactions which is detrimental for the
reaction selectivity.1 The medium specific surface area allows for
the deposition of metallic active phases with reasonably high
aInstitut de Physique et Chimie des Mat�eriaux de Strasbourg, CNRS -Universit�e de Strasbourg (UDS) UMR 7504, 23, rue du Loess, BP 43,67037 Strasbourg cedex 02, France. E-mail: [email protected]; Fax: +33(0) 03 88 10 72 48; Tel: +33(0) 03 88 10 70 28bLaboratoire des Mat�eriaux, Surfaces et Proc�ed�es pour la Catalyse, CNRS -Universit�e de Strasbourg (UDS), UMR 7515, 25, rue Becquerel, 67087Strasbourg cedex 08, FrancecTechnical Center, Sicat, 1, rue du Broetch, 67700 Otterswiller, France
† Electronic supplementary information (ESI) available: SI-1–SI-4. SeeDOI: 10.1039/c0nr00449a
2668 | Nanoscale, 2010, 2, 2668–2678
dispersion while the good thermal conductivity of the substrate
strongly influences the selectivity of the catalyst for exothermic
reactions like the Fischer–Tropsch synthesis (FTS),3 n-butane
partial oxidation,4 H2S selective oxidation5 or methanol dehy-
dration to dimethylether.6 These properties are attributed to the
synthesis method based on a gas-solid reaction involving SiC
vapour and solid carbon at moderate temperature (about
1400 �C) that avoids the sintering of the material, as it is the case
of high-temperature synthesis.7 Previous analysis based on gas
adsorption and mercury intrusion methods have shown that this
specific preparation generates a dual porosity inside the material,
made of mesopores (4–50 nm) and macropores (>50 nm), giving
rise to two types of SiC surfaces. One should expect that the
reactivity of these spatially separated surfaces, especially towards
oxygen, depends strongly on the morphology, the accessibility
and the hydrophilic-hydrophobic character of the corresponding
pores. A recent electron tomography study has shown that beta
SiC exhibits a dual surface structure corresponding to a porosity
made of a network of connected channels (C-pore) with typical
sizes larger than 50 nm and ink-bottled pores (R-pore) with
sizes spanning from 4 to 50 nm.8 The channel pores have been
observed to be easily wetted by water, i.e. they have a hydrophilic
surface behaviour, whereas the ink-bottled pores are wetted by
alcoholic or organic solvents, i.e. their surface has a hydrophobic
behaviour. From this observation the hypothesis has been put
forward that this selective wetting against solvents could be
related to the oxidation degree of the two classes of pores:
hydrophilic surface containing a higher concentration of the
This journal is ª The Royal Society of Chemistry 2010
Publ
ishe
d on
11
Oct
ober
201
0. D
ownl
oade
d on
22/
10/2
014
19:5
2:43
. View Article Online
oxygenated functional groups whereas hydrophobic surface
having less oxygenated functional groups. Such surface behav-
iour is very similar to the one occurring on carbon nanotubes
surfaces where the hydrophilic and hydrophobic character can be
controlled at will as a function of the chemical or thermal
treatment.9 In the catalysis field, the oxidative resistance of the
support is of tremendous importance, as at an extensive oxida-
tion degree the influence of pore migration and plugging and
active phase encapsulation become predominant contributing to
an activity loss. The oxygen concentration on the support surface
is also of great importance as it allows the anchorage and
dispersion of the metal or oxide active phase on the support
surface. However, the oxygen concentration, i.e. the thickness of
the oxide layer, on each type of pore is not easy to map using
traditional techniques at hand. Indeed, high oxygen concentra-
tion or thick layers of oxide could plug the pore or encapsulate
the active phases that are deposited on the surface deteriorating
the overall catalyst activity. Up to now, no technique was able to
give a direct access to such pore surface behavior. It is thus of
great interest to find a new and appropriate characterization
technique allowing to selectively map the pore oxidation degree
in the two classes of pores of beta SiC, as well as to correlate this
parameter to the morphology and to the accessibility of the
porous network at a nanoscale spatial resolution. Comparing the
various existing techniques able to provide specific information
at a nanometer scale, it appears that one of the best ways to
acquire 3D compositional mapping is the Energy Filtered TEM
(EFTEM) tomography. In that regard, the first goal of this paper
is to demonstrate the feasibility of the electron tomography in
the analytical mode with a resolution down to the nanometer.
Applied in a quantitative way, this technique was subsequently
used to determine the pore oxidation degree, or in other words,
the thickness of the oxide layer, at the surfaces defined by the two
types of pores present in b-SiC. The characterization of such pore
surfaces could be helpful for the understanding of the support
behavior towards oxidation reactivity which, in turn, would
represent a powerful tool for controlling the active phase local-
ization and its accessibility as a function of the pore encapsula-
tion by the oxide layer. The developed technique could also be
further applied to the study of other one-dimensional catalyst
supports, i.e. inner versus outer surface reactivity of carbon
nanotubes, as well as to other porous catalytic systems, either
pure or doped with foreign elements, in order to build-up the
relationship between the catalytic performance and surface
composition.
Emergence and state-of-the-art of the EFTEM tomography
Generally, to obtain chemically selective information at the
nanoscale, the electron energy loss spectroscopy (EELS) tech-
nique is commonly used and allows the mapping of the elemental
composition (in both image and spectroscopic mode), the
chemical state or the phase distribution.10–12 Related to the Si–C–
O-based materials, a typical example of EELS analysis concerns
the investigation of the chemical bonding in bulk ceramics
prepared by pyrolysis technique as a function of O content.13
However, by recording individual images or spectra, this tech-
nique remains a 2D analysis tool because the projection effect
gives only access to thickness-integrated information along the
This journal is ª The Royal Society of Chemistry 2010
direction of observation. Interpretation needs the setting of
hypothesis about the studied nano-object nature and can be
sometimes difficult or ambiguous, especially for objects with
complex 3D morphologies or random spatial distribution of their
components. From the morphological point of view, the analysis
of objects at a nanometer scale implies the use of electron
microscopy in the tomographic mode, which produces 3D
reconstructions of the said objects and thus, eliminates the
hypothetical interpretations. Electron tomography in a bright-
field mode has been extensively employed in the field of biology
research and it has only recently been translated in the field of
materials at a nanoscale, since the pioneering work published by
de Jong and co-workers.14 More recently, a new experimental
mode has been implemented, using for the volume reconstruc-
tion, images recorded with a high angle annular dark-field
detector in the scanning mode (STEM-HAADF). This mode is
indeed extremely valuable to characterize crystalline systems,
because it avoids diffraction contrast and allows the recording of
images mainly sensitive to the atomic number. However, the
difference in atomic number, especially for light elements, of the
chemical elements present in the sample frequently leads to
insufficient contrast preventing the use of this density-sensitive
method. To overcome this drawback, a third chemically selective
mode was recently implemented based on energy-filtered TEM
(EFTEM) imaging to acquire the tilt projection series used
subsequently to compute the reconstruction. The individual
images are formed across a spectrometer that selects inelastic
scattered electrons with a given energy loss allowing the collec-
tion of signals emitted from a specific chemical element amongst
the others. The EFTEM tomography method has been first used
to study nanocrystals15 or composite materials.16 Recent results17
were obtained from tilt series of EFTEM images on the basis of
an appropriate choice of materials (constituting elements with
very distinct energy losses: Fe, Ni, O) and with a compromise
between data acquisition speed and resolution. In another work,
filtered images recorded in the plasmon region of an EELS
spectrum have been used to reconstruct a 3D signal sensitive to
local changes in the specimen density.18 Some specific applica-
tions have also recently been published in the field of biology,
either in zero-loss mode selecting only elastically scattered elec-
trons in order to enhance the contrast,19 or in a more quantitative
way to provide 3D maps of phosphorous in nucleic acid, by
recording L2,3 pre-edge and post-edge images.20 However,
exploiting a unique 3D chemical map is not accurate enough,
since the method is very sensitive to various parameters,
including extraction of the background (for a proper extraction,
it is certainly better to use two pre-edge images than only one),
change in specimen thickness when tilting, and data processing.
A more valuable analysis can be performed when all the chemical
elements present in the specimen are mapped altogether, yielding
relative 3D chemical maps with unknown parameters. Thomas
et al.21 have shown that it is possible to perform chemical tomo-
graphy using the spectroscopic mode instead of the image mode
of EELS spectroscopy. This technique, referred to as 4D
STEM-EELS tomography, requires a 360� rotation holder and
pillar-shaped samples to minimize artifacts, thus limiting its
applications in a routine way. However, in the more convenient
EFTEM mode the current spatial resolution reported up to now
is limited to only a few tens of nm. In this framework, reaching
Nanoscale, 2010, 2, 2668–2678 | 2669
Publ
ishe
d on
11
Oct
ober
201
0. D
ownl
oade
d on
22/
10/2
014
19:5
2:43
. View Article Online
the nanometer range represents a great breakthrough for
extending this technique to full characterization of complex
nano-objects. In this way, correlations between the distributions
of the chemical elements can be obtained, as for example the
oxygen distribution in the vicinity of a surface having a complex
3D morphology.
Even being beneficial as a characterization technique in the
materials field, the EFTEM technique implementation and
application at the nanoscale remain slow to show up. Similarly as
in the case of classical EFTEM imaging, the first concern about
the technique is the high doses of electrons needed to obtain
series of chemical projections with a significant signal to noise
ratio (SNR). Furthermore, in the tomographic mode, in order to
obtain relevant 3D chemical maps, the number of projections (N)
must be higher than 50 and each projection is obtained from
three filtered images. Even if the sample under study is not
known to be sensitive to electron irradiations, long exposition
times can produce small damages accumulation leading to non-
reliable 3D reconstructions. The second obstacle in this tech-
nique is that the image intensities in the so-called ‘‘chemically
selective projections’’ must satisfy the projection requirement for
tomography that stipulates that the signal must vary mono-
tonically through the structure to be suitable for reconstruc-
tion.21 This consideration generally requires the acquisition of
three energy-filtered images for each chemical element at each tilt
angle, two before the chosen edge to estimate the background
and one on the edge from which the background will be extrac-
ted. Once the tilt series of chemical projections and the corre-
sponding elemental reconstructions are computed, the combined
analysis of the obtained 3D maps for the major elements present
in the specimen becomes possible. The main practical difficulties
and drawbacks of the technique are further discussed in the
Experimental Methods section.
In this context, the challenge was here to adapt the acquisition
and the data treatment to insure accurate 3D chemical maps
constructions with a nanometer resolution which was not achieved
so far. Indeed, as predicted by some authors,16,22 improving the
spatial resolution seems to be possible if the sampling of the
angular range is performed with an increased pixel and angular
resolution. Considerable work has therefore been devoted in this
study to carefully optimise the acquisition parameters, computing
and analysis processes in order to achieve chemical mapping with
a nanometer-scale resolution. In particular, for the system studied
in this work, the analytical electron tomography is the unique
method which allows performing a quantitative analysis of the
oxygen content on the two types of surfaces. More generally, it is
thought that such result could be extremely helpful for studying the
real chemical composition of the active phases in the heterogeneous
catalysis field, especially their composition with spatial resolution
on the topmost surface where the catalytic steps do occur, and to
determine the relationship between the chemical composition of
the active phases and the performance of the catalyst.
Results
Classical analysis by 3D-TEM and XPS: selective localization of
nanoparticles versus porous structure and surface chemistry
In this work the b-SiC material was synthesized by allowing solid
carbon and SiO to react in an argon flow at a moderate
2670 | Nanoscale, 2010, 2, 2668–2678
temperature (�1400 �C).23 The low synthesis temperature avoi-
ded specific surface area loss through surface pore diffusion. The
as-synthesized material was further calcined in air at 800 �C for 2
h in order to remove residual carbon inside the matrix. Using the
Brunauer, Emett, and Teller technique (BET), we measured
a specific surface area of 25 m2 g�1, a reasonably large value due
to the presence of both meso- and macropores.
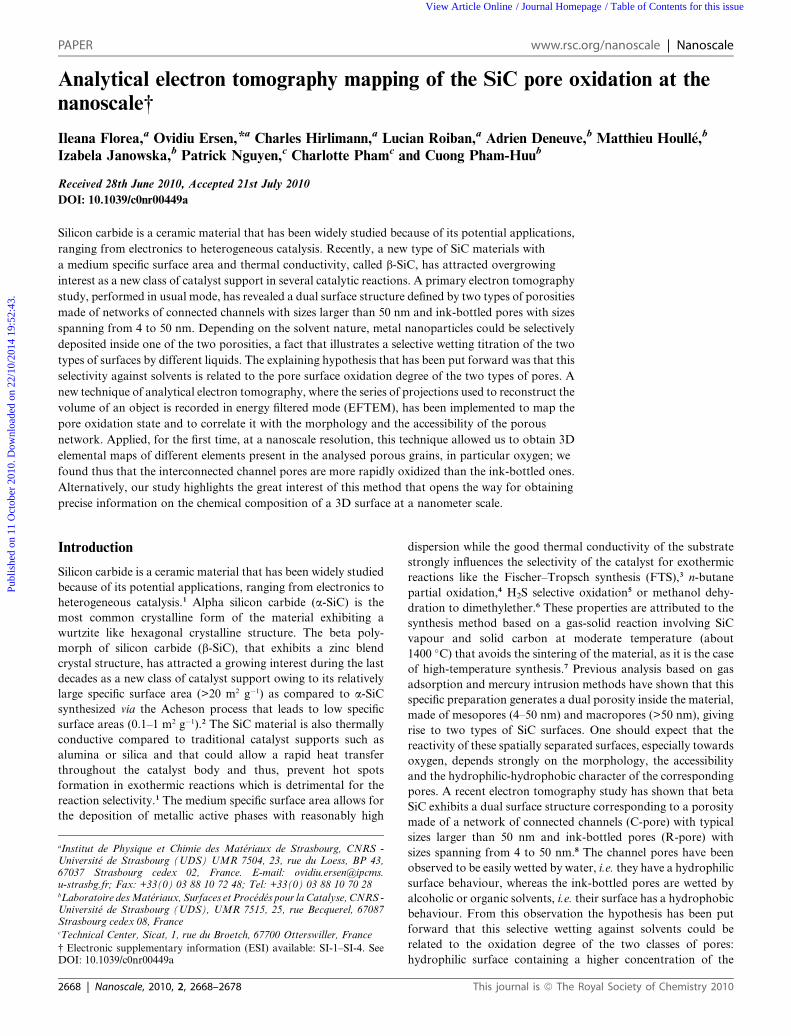
A meticulous analysis using 3D-TEM imaging revealed that
the resulting ceramic material possesses two types of porosities
with different surface wetting behavior.8 The main results
obtained by analyzing the 3D reconstruction computed from
a tomographic record following the procedure described in the
Experimental Method section are summarized in Fig. 1A, B and
C, which highlight the presence of both channel pores with
typical size larger than 50 nm on average and ink-bottled pores
with sizes spanning from 4 to 50 nm. In particular, Fig. 1B shows
a typical slice through the reconstructed volume on which both
the interconnected channel pores (C-pores) and the ink-bottled
pores (R-pores) are observable. In Fig. 1C, a modelling of the 3D
reconstruction of the SiC grain is shown that gives a better
intuitive perception of the two different types of pores defining
the two spatially separated surfaces.
The averaged surface oxygen content on the two surfaces which
is the core of our questioning has been first characterized using
XPS analysis. The XPS Si2p spectrum recorded on the SiC sample
after synthesis and air calcination at 800 �C is presented in Fig. 1D.
The decomposition of the raw spectrum indicates that at least three
Si-based species are present on the SiC surface. The Si2p peak
located at low binding energy, i.e. 101 eV, could be attributed to the
Si atoms engaged in the SiC phase, whereas the two other Si2p
peaks located at higher binding energies were attributed to the Si
atoms engaged in the SiCxOy and SiO2 phases.24 According to the
relative intensity of the different Si2p peaks, one can conclude that
oxygen-containing Si compounds were present in a large amount
on the topmost surface of the SiC material after the calcination
step. Silicon carbide is well-known to be highly reactive with
oxygen and, thus, soon after its exposure to air the SiC surface was
steadily covered with a thin layer of oxygen-containing species,
i.e. SiCxOy and SiO2.25–27 Mozdzierz et al.28 have proposed the
following chemical formula for the silicon oxycarbide phase:
SiO1.52C0.6–1.05. In the present work, the concentration of these
various species on the SiC surface after air calcination at 800 �C,
determined from the XPS decomposition, is 34 at. % for SiC, 33 at.
% for SiCxOy and 33 at. % for SiO2. Such results are in good
agreement with the HRTEM analysis that reveals an amorphous
layer on the SiC surface (Fig. 1E), as well with the previously
reported results on the oxidation state of the SiC surface upon air
calcination.24 The next question addresses the localization of the
various species either on the whole surface of the material or onto
specific localizations depending on the nature of the pores.
The total amount of the SiCxOy and SiO2 species present on
the topmost surface of SiC is determined by submitting the
sample to a soda (20 wt. %) treatment at 80 �C that removes the
oxygen-containing species. According to the results the oxygen
concentration on the SiC material was found to be 3.5 wt. %. The
complete removal of the oxygen-containing species on the SiC
after the soda treatment was already shown in a previous
reported study.29 Similar results have also been observed in our
previous work using a Zeta potential technique.8
This journal is ª The Royal Society of Chemistry 2010
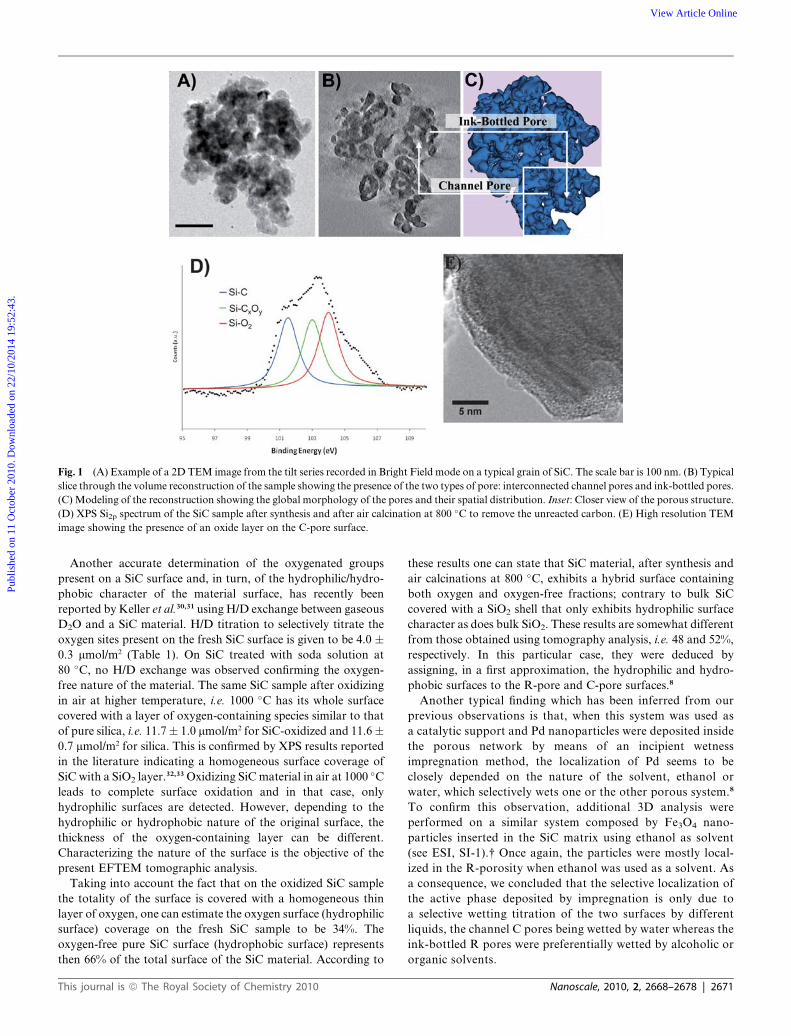
Fig. 1 (A) Example of a 2D TEM image from the tilt series recorded in Bright Field mode on a typical grain of SiC. The scale bar is 100 nm. (B) Typical
slice through the volume reconstruction of the sample showing the presence of the two types of pore: interconnected channel pores and ink-bottled pores.
(C) Modeling of the reconstruction showing the global morphology of the pores and their spatial distribution. Inset: Closer view of the porous structure.
(D) XPS Si2p spectrum of the SiC sample after synthesis and after air calcination at 800 �C to remove the unreacted carbon. (E) High resolution TEM
image showing the presence of an oxide layer on the C-pore surface.
Publ
ishe
d on
11
Oct
ober
201
0. D
ownl
oade
d on
22/
10/2
014
19:5
2:43
. View Article Online
Another accurate determination of the oxygenated groups
present on a SiC surface and, in turn, of the hydrophilic/hydro-
phobic character of the material surface, has recently been
reported by Keller et al.30,31 using H/D exchange between gaseous
D2O and a SiC material. H/D titration to selectively titrate the
oxygen sites present on the fresh SiC surface is given to be 4.0 �0.3 mmol/m2 (Table 1). On SiC treated with soda solution at
80 �C, no H/D exchange was observed confirming the oxygen-
free nature of the material. The same SiC sample after oxidizing
in air at higher temperature, i.e. 1000 �C has its whole surface
covered with a layer of oxygen-containing species similar to that
of pure silica, i.e. 11.7� 1.0 mmol/m2 for SiC-oxidized and 11.6�0.7 mmol/m2 for silica. This is confirmed by XPS results reported
in the literature indicating a homogeneous surface coverage of
SiC with a SiO2 layer.32,33 Oxidizing SiC material in air at 1000 �C
leads to complete surface oxidation and in that case, only
hydrophilic surfaces are detected. However, depending to the
hydrophilic or hydrophobic nature of the original surface, the
thickness of the oxygen-containing layer can be different.
Characterizing the nature of the surface is the objective of the
present EFTEM tomographic analysis.
Taking into account the fact that on the oxidized SiC sample
the totality of the surface is covered with a homogeneous thin
layer of oxygen, one can estimate the oxygen surface (hydrophilic
surface) coverage on the fresh SiC sample to be 34%. The
oxygen-free pure SiC surface (hydrophobic surface) represents
then 66% of the total surface of the SiC material. According to
This journal is ª The Royal Society of Chemistry 2010
these results one can state that SiC material, after synthesis and
air calcinations at 800 �C, exhibits a hybrid surface containing
both oxygen and oxygen-free fractions; contrary to bulk SiC
covered with a SiO2 shell that only exhibits hydrophilic surface
character as does bulk SiO2. These results are somewhat different
from those obtained using tomography analysis, i.e. 48 and 52%,
respectively. In this particular case, they were deduced by
assigning, in a first approximation, the hydrophilic and hydro-
phobic surfaces to the R-pore and C-pore surfaces.8
Another typical finding which has been inferred from our
previous observations is that, when this system was used as
a catalytic support and Pd nanoparticles were deposited inside
the porous network by means of an incipient wetness
impregnation method, the localization of Pd seems to be
closely depended on the nature of the solvent, ethanol or
water, which selectively wets one or the other porous system.8
To confirm this observation, additional 3D analysis were
performed on a similar system composed by Fe3O4 nano-
particles inserted in the SiC matrix using ethanol as solvent
(see ESI, SI-1).† Once again, the particles were mostly local-
ized in the R-porosity when ethanol was used as a solvent. As
a consequence, we concluded that the selective localization of
the active phase deposited by impregnation is only due to
a selective wetting titration of the two surfaces by different
liquids, the channel C pores being wetted by water whereas the
ink-bottled R pores were preferentially wetted by alcoholic or
organic solvents.
Nanoscale, 2010, 2, 2668–2678 | 2671
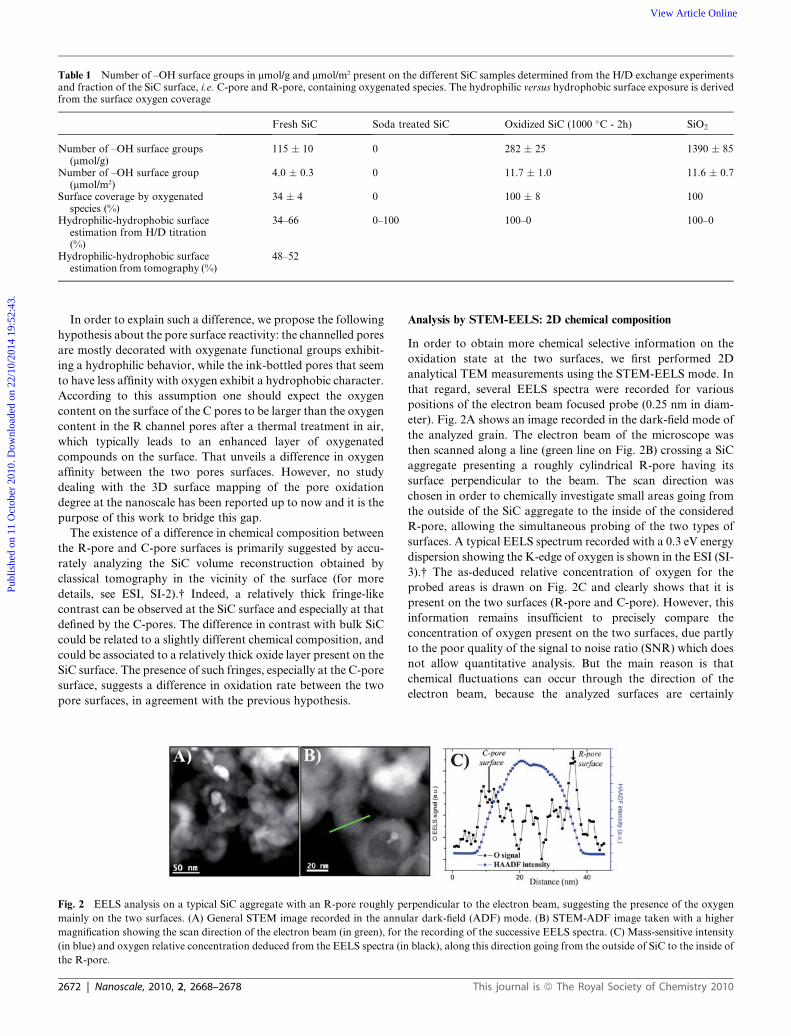
Table 1 Number of –OH surface groups in mmol/g and mmol/m2 present on the different SiC samples determined from the H/D exchange experimentsand fraction of the SiC surface, i.e. C-pore and R-pore, containing oxygenated species. The hydrophilic versus hydrophobic surface exposure is derivedfrom the surface oxygen coverage
Fresh SiC Soda treated SiC Oxidized SiC (1000 �C - 2h) SiO2
Number of –OH surface groups(mmol/g)
115 � 10 0 282 � 25 1390 � 85
Number of –OH surface group(mmol/m2)
4.0 � 0.3 0 11.7 � 1.0 11.6 � 0.7
Surface coverage by oxygenatedspecies (%)
34 � 4 0 100 � 8 100
Hydrophilic-hydrophobic surfaceestimation from H/D titration(%)
34–66 0–100 100–0 100–0
Hydrophilic-hydrophobic surfaceestimation from tomography (%)
48–52
Publ
ishe
d on
11
Oct
ober
201
0. D
ownl
oade
d on
22/
10/2
014
19:5
2:43
. View Article Online
In order to explain such a difference, we propose the following
hypothesis about the pore surface reactivity: the channelled pores
are mostly decorated with oxygenate functional groups exhibit-
ing a hydrophilic behavior, while the ink-bottled pores that seem
to have less affinity with oxygen exhibit a hydrophobic character.
According to this assumption one should expect the oxygen
content on the surface of the C pores to be larger than the oxygen
content in the R channel pores after a thermal treatment in air,
which typically leads to an enhanced layer of oxygenated
compounds on the surface. That unveils a difference in oxygen
affinity between the two pores surfaces. However, no study
dealing with the 3D surface mapping of the pore oxidation
degree at the nanoscale has been reported up to now and it is the
purpose of this work to bridge this gap.
The existence of a difference in chemical composition between
the R-pore and C-pore surfaces is primarily suggested by accu-
rately analyzing the SiC volume reconstruction obtained by
classical tomography in the vicinity of the surface (for more
details, see ESI, SI-2).† Indeed, a relatively thick fringe-like
contrast can be observed at the SiC surface and especially at that
defined by the C-pores. The difference in contrast with bulk SiC
could be related to a slightly different chemical composition, and
could be associated to a relatively thick oxide layer present on the
SiC surface. The presence of such fringes, especially at the C-pore
surface, suggests a difference in oxidation rate between the two
pore surfaces, in agreement with the previous hypothesis.
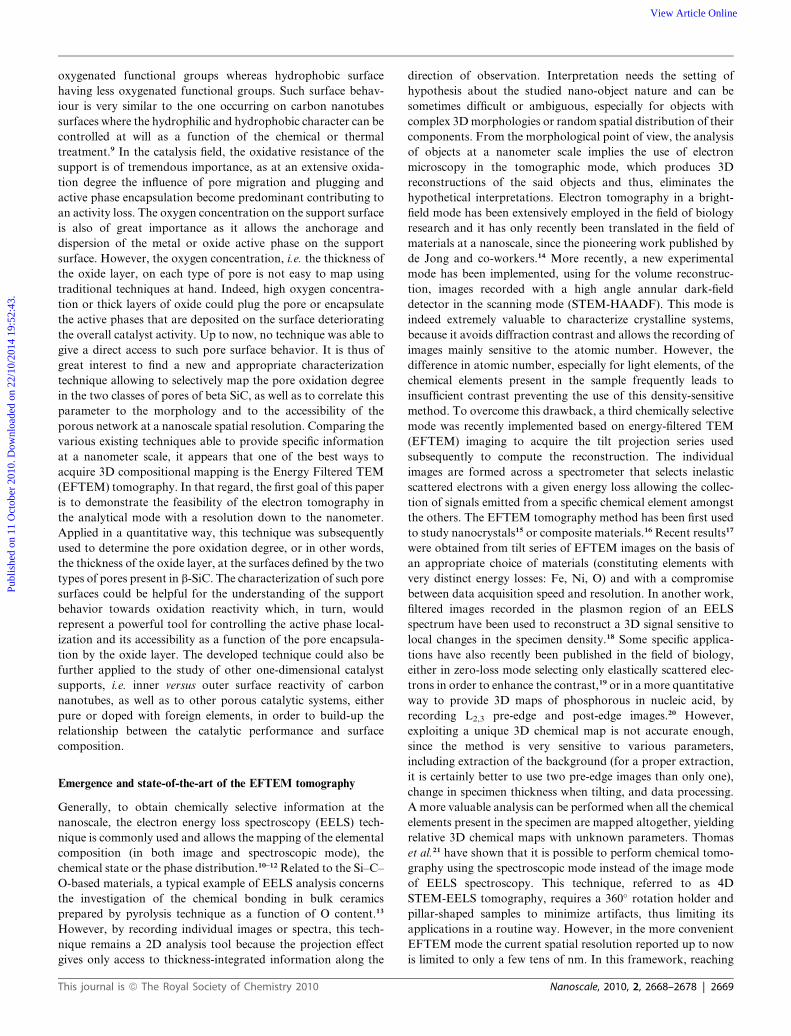
Fig. 2 EELS analysis on a typical SiC aggregate with an R-pore roughly pe
mainly on the two surfaces. (A) General STEM image recorded in the annu
magnification showing the scan direction of the electron beam (in green), for t
(in blue) and oxygen relative concentration deduced from the EELS spectra (in
the R-pore.
2672 | Nanoscale, 2010, 2, 2668–2678
Analysis by STEM-EELS: 2D chemical composition
In order to obtain more chemical selective information on the
oxidation state at the two surfaces, we first performed 2D
analytical TEM measurements using the STEM-EELS mode. In
that regard, several EELS spectra were recorded for various
positions of the electron beam focused probe (0.25 nm in diam-
eter). Fig. 2A shows an image recorded in the dark-field mode of
the analyzed grain. The electron beam of the microscope was
then scanned along a line (green line on Fig. 2B) crossing a SiC
aggregate presenting a roughly cylindrical R-pore having its
surface perpendicular to the beam. The scan direction was
chosen in order to chemically investigate small areas going from
the outside of the SiC aggregate to the inside of the considered
R-pore, allowing the simultaneous probing of the two types of
surfaces. A typical EELS spectrum recorded with a 0.3 eV energy
dispersion showing the K-edge of oxygen is shown in the ESI (SI-
3).† The as-deduced relative concentration of oxygen for the
probed areas is drawn on Fig. 2C and clearly shows that it is
present on the two surfaces (R-pore and C-pore). However, this
information remains insufficient to precisely compare the
concentration of oxygen present on the two surfaces, due partly
to the poor quality of the signal to noise ratio (SNR) which does
not allow quantitative analysis. But the main reason is that
chemical fluctuations can occur through the direction of the
electron beam, because the analyzed surfaces are certainly
rpendicular to the electron beam, suggesting the presence of the oxygen
lar dark-field (ADF) mode. (B) STEM-ADF image taken with a higher
he recording of the successive EELS spectra. (C) Mass-sensitive intensity
black), along this direction going from the outside of SiC to the inside of
This journal is ª The Royal Society of Chemistry 2010
Publ
ishe
d on
11
Oct
ober
201
0. D
ownl
oade
d on
22/
10/2
014
19:5
2:43
. View Article Online
not perfectly perpendicular to this direction and have also a 3D
morphology.
3D oxygen mapping in SiC through EFTEM tomography
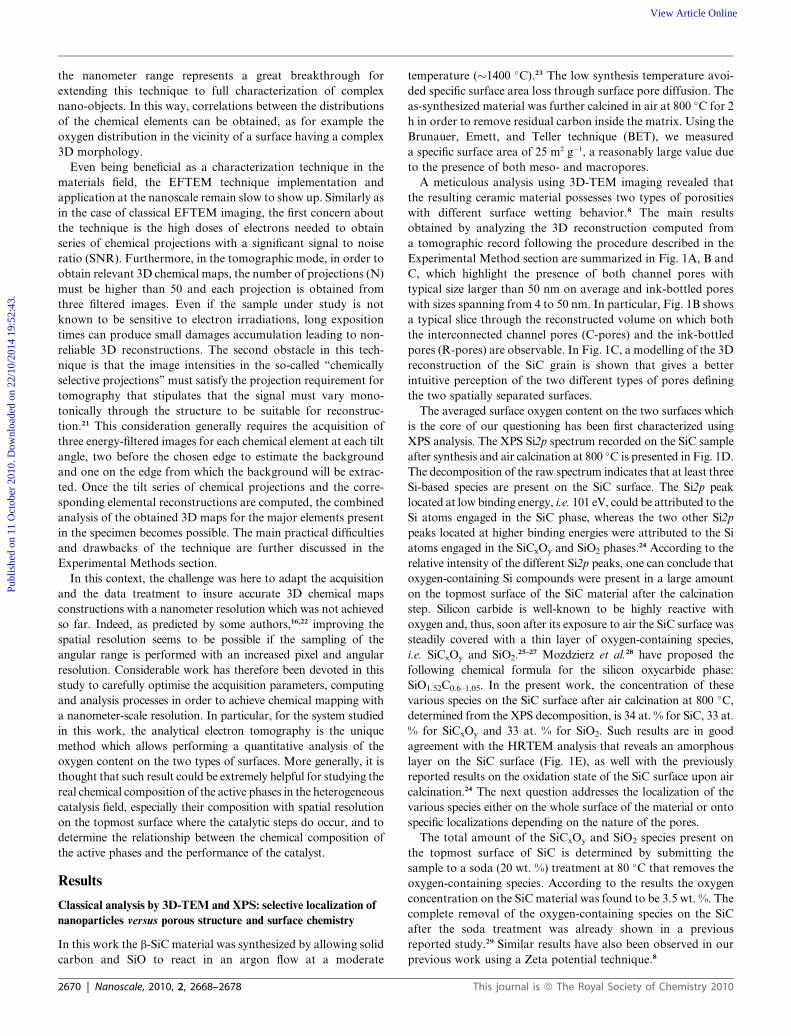
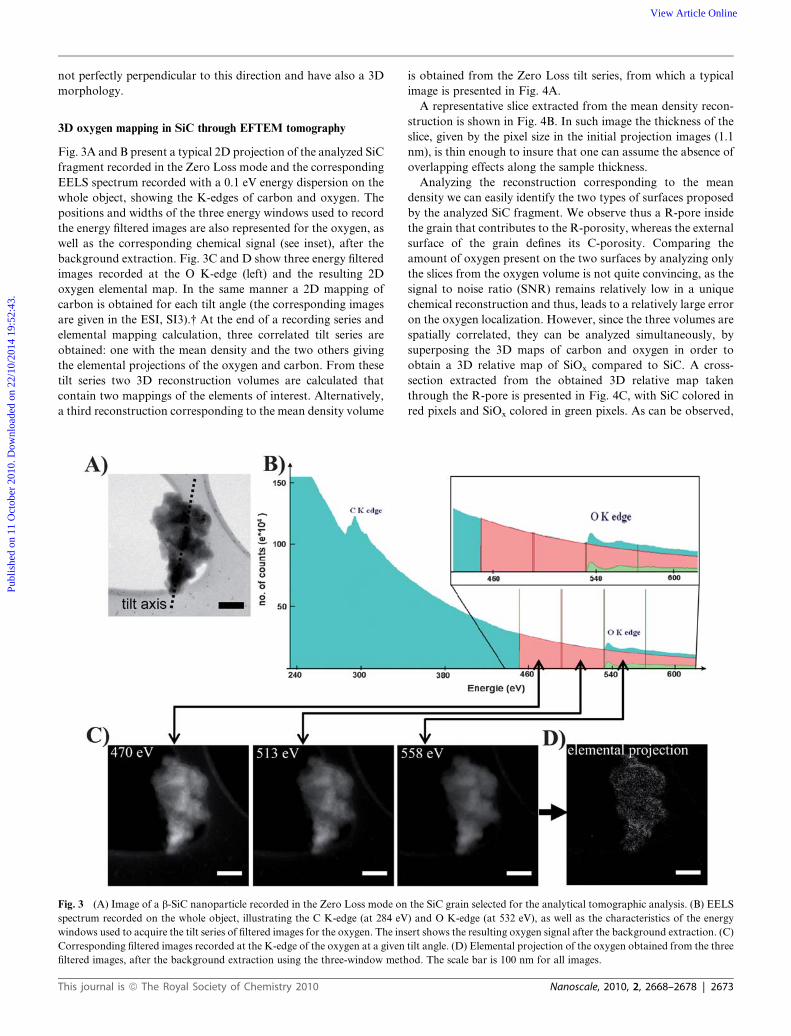
Fig. 3A and B present a typical 2D projection of the analyzed SiC
fragment recorded in the Zero Loss mode and the corresponding
EELS spectrum recorded with a 0.1 eV energy dispersion on the
whole object, showing the K-edges of carbon and oxygen. The
positions and widths of the three energy windows used to record
the energy filtered images are also represented for the oxygen, as
well as the corresponding chemical signal (see inset), after the
background extraction. Fig. 3C and D show three energy filtered
images recorded at the O K-edge (left) and the resulting 2D
oxygen elemental map. In the same manner a 2D mapping of
carbon is obtained for each tilt angle (the corresponding images
are given in the ESI, SI3).† At the end of a recording series and
elemental mapping calculation, three correlated tilt series are
obtained: one with the mean density and the two others giving
the elemental projections of the oxygen and carbon. From these
tilt series two 3D reconstruction volumes are calculated that
contain two mappings of the elements of interest. Alternatively,
a third reconstruction corresponding to the mean density volume
Fig. 3 (A) Image of a b-SiC nanoparticle recorded in the Zero Loss mode on
spectrum recorded on the whole object, illustrating the C K-edge (at 284 eV
windows used to acquire the tilt series of filtered images for the oxygen. The ins
Corresponding filtered images recorded at the K-edge of the oxygen at a given
filtered images, after the background extraction using the three-window meth
This journal is ª The Royal Society of Chemistry 2010
is obtained from the Zero Loss tilt series, from which a typical
image is presented in Fig. 4A.
A representative slice extracted from the mean density recon-
struction is shown in Fig. 4B. In such image the thickness of the
slice, given by the pixel size in the initial projection images (1.1
nm), is thin enough to insure that one can assume the absence of
overlapping effects along the sample thickness.
Analyzing the reconstruction corresponding to the mean
density we can easily identify the two types of surfaces proposed
by the analyzed SiC fragment. We observe thus a R-pore inside
the grain that contributes to the R-porosity, whereas the external
surface of the grain defines its C-porosity. Comparing the
amount of oxygen present on the two surfaces by analyzing only
the slices from the oxygen volume is not quite convincing, as the
signal to noise ratio (SNR) remains relatively low in a unique
chemical reconstruction and thus, leads to a relatively large error
on the oxygen localization. However, since the three volumes are
spatially correlated, they can be analyzed simultaneously, by
superposing the 3D maps of carbon and oxygen in order to
obtain a 3D relative map of SiOx compared to SiC. A cross-
section extracted from the obtained 3D relative map taken
through the R-pore is presented in Fig. 4C, with SiC colored in
red pixels and SiOx colored in green pixels. As can be observed,
the SiC grain selected for the analytical tomographic analysis. (B) EELS
) and O K-edge (at 532 eV), as well as the characteristics of the energy
ert shows the resulting oxygen signal after the background extraction. (C)
tilt angle. (D) Elemental projection of the oxygen obtained from the three
od. The scale bar is 100 nm for all images.
Nanoscale, 2010, 2, 2668–2678 | 2673
Fig. 4 (A) 2D-TEM image at 0� tilt from the tilt series used to reconstruct the mean density volume. (B) Section through the reconstructed volumes
corresponding to the mean density. (C) Cross-section, taken at the same depth and angle with respect to the initial orientation as that of Fig. 4A, through
the 3D relative map of SiC (red) with respect to SiOx (green), in white the guide for the external surface and the pore. (D) Threshold sorting modeling of
the 3D SiC/SiOx map showing the spatial spread of the SiOx on the two surfaces; inset a: zoom in the vicinity of the R-pore showing the presence of less
oxygen on the R-pore surface; inset b: zoom near the external C-pore surface illustrating its high oxidation degree. (E) Global modeling of the analyzed
SiC grain.
Publ
ishe
d on
11
Oct
ober
201
0. D
ownl
oade
d on
22/
10/2
014
19:5
2:43
. View Article Online
the determination of the relative spatial spread of the two
different chemical phases is much more accurate compared to the
results obtained by analyzing the individual elemental recon-
structions. In order to get a more intuitive view of the oxygen
distribution and to perform a quantitative analysis, a modeling
of the 3D relative map was realized using a criterion based on the
comparison of the intensities of individual elemental maps, pixel
by pixel. A typical view of the modeling is showed in Fig. 4D,
giving a clearer view on the difference in terms of oxidative
resistance between the R-pore and C pore surfaces (see insets
a and b). Note that the spatial resolution in this analytical
tomographic mode estimated by taking into consideration the
experimental conditions and specimen characteristics, is of the
order of 7 nm. In addition, the quantitative analysis of the 3D
relative map allows us to determine the mean concentration in
oxygen in the analyzed grain to be of the order of 10 wt. %, in
agreement with the global value obtained by the thermo-gravi-
metric analysis.
Discussion
High-temperature oxidative treatment slowly leads to the
complete oxidation of the SiC surface leading to a hydrophilic
behavior. However, the thickness of the oxygen-containing layer
largely varies in a great manner depending on the hydrophilic or
2674 | Nanoscale, 2010, 2, 2668–2678
hydrophobic nature of the original SiC surface. According to the
presented slice and to the 3D modeling, one can conclude that the
oxidation mostly starts on the surface of the C-pores whereas it is
less important on the surface exposed in the R-pores. That
clearly evidences, in the limit of our spatial resolution (7 nm),
a different oxidative behavior induced by the pore morphology.
Increasing the oxidation treatment duration leads to a more
complete transformation of SiC into SiO2 especially on the
C-pore surface. Classical TEM micrograph evidences the
progressive channel pore (C-pore) plugging by the extensive
growth of SiO2 away from the SiC surface which bridges the pore
gap (see ESI, SI-3).† Such pore plugging is also at the origin of
the overall specific surface area decrease after oxidation. It is
worth noting that during the oxidation process, the R-pore
surface also undergoes oxidizing as well but probably with
a lower rate due to the hydrophobic character of the original
surface.
The results obtained in this work clearly evidence the fact that
b-SiC having a dual porosity exhibits an atypical behavior
against oxidation. The interconnected channel pores (C-pore) are
more affected by the calcinations step due to their high oxygen
affinity provided by the presence of a higher defect density. The
C-pores result from the aggregation of several SiC grains
stacking along a channel where grain boundaries do generate
topological defects, which make the pores more reactive against
This journal is ª The Royal Society of Chemistry 2010
Publ
ishe
d on
11
Oct
ober
201
0. D
ownl
oade
d on
22/
10/2
014
19:5
2:43
. View Article Online
oxygen. On the other hand, the ink-bottled pores are much less
affected by the oxidative treatment due to the following points:
(i) an ink-bottled aperture is less prone to oxygen diffusion and is
therefore less oxidized than the more accessible channel pores,
(ii) the less defective surface characteristics of the ink-bottled
pores prevents further oxygen adsorption and consecutive
oxidation. It appears that an active catalytic phase specifically
localized inside an ink-bottled pore is less affected during
oxidative treatments or reaction and this improves the catalyst
life-time.
The low oxygen content on the R-pore surface also signifi-
cantly modifies their wetting behavior against liquid media. It is
expected that organic liquid media will have a strong wetting
behavior with such a surface and thus, will significantly influence
the catalytic activity as well. Previous results have shown that
despite the larger size of palladium particles localized within the
R-pore, they display a higher hydrogenation activity for cinna-
maldehyde than the smaller ones localized on the C-pore surface.
Conclusion
In conclusion, it can be stated that the analytical electron
tomography technique is a powerful characterization tool for
imaging pores oxidation states in SiC, as the thickness of oxygen-
containing layers, and the connectivity of a porous material. In
this work it has been applied to porous b-SiC that was submitted
to a thermal treatment. It showed that interconnected channel
pores are more affected by an oxidative treatment due to the
presence of high defects density with a high affinity for oxygen
adsorption and to their open access, than ink-bottled pores that
exhibit a higher oxidative resistance owing to the presence of
a lower defects density and a constrained access. Such results are
of great interest for the subsequent use of the material in catal-
ysis. According to our results, the most accessible pore allowing
the reactants access to the active phase is the first to be plugged
after prolonged oxidative treatment due to the extensive devel-
opment of a thick layer of SiO2 over the pore channel, which
blocks the access to the reactants.
From a general point of view, the development of this new and
powerful technique with a nanometer resolution will have an
important impact in the field of nanomaterials, as it allows one to
get access to two most critical parameters: (i) the 3D structure of
the sample in the tomographic mode and (ii) the chemical
composition of the analyzed material through the electron-
energy-loss signature. The technique used in the present work
can be employed for analyzing other catalytic systems, where the
access to the topmost surface chemical composition represents an
important parameter for understanding their catalytic perfor-
mances, as for instance intimate Si-Al catalysts or zeolite mate-
rials, or the chemical composition of various surfaces in carbon
nanotubes, inner versus outer, as a function of either a chemical
or a thermal treatment.
Experimental methods
Set-up of EFTEM tomography at the nanoscale
EFTEM tomography uses a tilt series of elemental projections to
compute an elemental selective reconstruction volume. For our
studied system, i.e. b-SiC, the elements of interest are oxygen,
This journal is ª The Royal Society of Chemistry 2010
present especially on the surface as SiOx compounds, and
carbon, present in the bulk as SiC. As the global concentration of
oxygen is rather low in an individual SiC aggregate since it is only
present as a native oxide layer on the surface, we performed our
analysis on oxidized SiC samples, containing 10% of oxygen in
weight in order to reach a reasonable signal to noise ratio (SNR)
and therefore minimizing the recording duration.
For the electron tomography analysis, the b-SiC samples were
crushed in a mortar into a very fine powder and dispersed in
ethanol in an ultrasonic bath for a few minutes. The solution was
then deposited on a copper grid recovered by a holey carbon
membrane where finally a drop of a solution containing gold
calibrated nanoparticles of 5 nm was deposited. These nano-
particles will be used as fiducial markers in the data treatment
process, in particular for the fine alignment of the tilt series
before the reconstruction.
The energy filtered images of the tilt series were obtained using
a JEOL 2100F (FEG) TEM/STEM electron microscope oper-
ating at 200 kV, equipped with a TRIDIEM post-column
imaging filter of the Gatan Company. The images acquired on
a 2048*2048 pixel cooled CCD detector were hardware-binned to
512*512 pixels with a pixel size of about 1.1 nm. The EFTEM
tomography software, implemented as a plug-in in Digital
Micrograph, provides automated acquisition of data by
controlling the spectrum energy offset and the width of the
energy selecting slit. In addition, the software allows to auto-
matically change the specimen tilt step by step, to correct the
defocusing and the specimen drift. In order to limit the irradia-
tion damage, a total of 57 angle positions were selected in the
angular range between�70 and 70�, with projections taken every
2.5�.
In order to ensure a monotonic dependence of the chemical
signal as a function of thickness and concentration, we used the
three-window method for the two elements of interest C and
O.34,35 This allows a proper extraction of the background in the
considered energy range and furnishes elemental projections with
a quite good approximation. In that regard, eight images were
recorded at each tilt angle: a first Zero-Loss image collecting the
elastic scattered electrons, three filtered images at the K-edge of
carbon (theoretical position 284 eV) used as a signature of SiC,
three energy filtered images at the K-edge of oxygen (theoretical
position 532 eV) used as a signature of SiOx, and finally a second
Zero-Loss image, used to check the immobility of the sample
during the acquisition procedure of the eight filtered images. The
energy positions of the filtered images for the carbon atoms were
244, 270 and 300 eV for the two pre-edge windows and the post-
edge window respectively, with an energy slit of 24 eV and an
exposure time of 5 s for each image; for the oxygen, the energy
positions were 470, 513 and 558 eV, with an energy slit of 40 eV
and an exposure time of each image of 12 s. A 120 mm diameter
objective aperture was used to record all these images.
After the acquisition process of the tilt series is finished, the
pre-processing steps and the reconstruction procedure were
performed using the IMOD and TOMOJ/EFTETJ softwares.36,37
In a first step, two series of chemical 2D maps (one for the oxygen
and the other for the carbon, so-called ‘‘elemental projections’’),
were computed from the tilt series of filtered images, tilt angle by
tilt angle. For one element, starting from the three tilt series
corresponding to the three chosen energy windows (previously
Nanoscale, 2010, 2, 2668–2678 | 2675
Publ
ishe
d on
11
Oct
ober
201
0. D
ownl
oade
d on
22/
10/2
014
19:5
2:43
. View Article Online
aligned to correct for the specimen drift between their successive
acquisitions), a series of chemical projections were computed by
extracting from the post-edge image the background estimated
from the two pre-edge images using an exponential law. The tilt
series are further aligned, in order to set all the projections,
elemental or mass-sensitive, in the same frame of reference. Since
the signal to noise ratio (SNR) in the chemical projections of C
and O is relatively poor, the usual alignment procedure based on
cross-correlation or fiducial markers gives poor results.
However, in the Zero-Loss tilt series the signal to noise ratio
(SNR) is high enough as to allow the implementation of cross-
correlation algorithms. In addition, the gold fiducial markers
deposited on the TEM grid membrane supporting the object are
clearly observable in that case and can be used as reference points
to make a more accurate alignment of the tilt series. After
checking the stability of the sample during the acquisition
process of the successive images recorded at the same tilt angle
(by comparing the two Zero-Loss images recorded at the
beginning and at the end of the energy record set), the spatial
parameters used to align the Zero-Loss tilt series can be applied
to align the two elemental projection series. We obtained thus
three projection series aligned in a unique frame of reference: the
first one corresponds to the Zero-Loss images, which are mass-
sensitive, and the two others to the elemental projection series for
O and C, which are chemically sensitive. These three projection
series are spatially correlated one relative to the others and, as
a consequence, the corresponding reconstruction volumes are
also spatially correlated, allowing performing a combined anal-
ysis. To reduce the typical artifacts appearing in the recon-
struction, due to the limited maximum tilt angle and number of
projections,15 the three reconstructed volumes were computed
using iterative algorithms.38 With respect to the simple back-
projection method, the use of these algorithms is also strongly
recommended for the tilt series with poor signal to noise ratio
(SNR), as it gives a refined solution.39 To extract from the whole
reconstruction useful information, a segmentation procedure is
needed consisting on a threshold sorting of the voxels of the
reconstructed volumes as a function of their grey-level intensity.
In our case, for the chemical selective volumes, this procedure is
difficult to apply due to a poor resulting signal to noise ratio
(SNR). However, as all the volumes are spatially correlated, one
can use the segmentation obtained from the mean density volume
(with high signal to noise ratio (SNR)) and apply the mask of
the analyzed grain, which delimits the borders of the object, to
the elemental volumes. In that regard, one can consider for the
analysis of elemental maps only the voxels corresponding to the
full material. A relative 3D map can finally be deduced, by
superposing with different colors the intensities of the considered
elemental 3D maps.
To estimate the spatial resolution in the analytical tomo-
graphic mode, we have used a method simply based on the
superposition of the 2D analytical resolution and of that of
the tomographic approach. The first, which depends mainly on
the microscope aberrations and experimental conditions used
in the acquisition of the filtered images, was estimated by using
the relations given by Egerton,40 resulting in a resolution limit of
about 5 nm. Furthermore, as usual in the field of electron
tomography, the resolution of the tomographic approach was
determined by using the analytical formula incorporating the
2676 | Nanoscale, 2010, 2, 2668–2678
parameters of the acquisition process.15 Using this mathematical
approach, the value obtained for the tomographic-specific reso-
lution was about 5.5 nm. By combining this resolution with that
of the initial 2D elemental maps deduced previously, we found
a lower limit for the spatial resolution of the order of 7 nm, which
allows to comparatively analyze the presence of a silicon oxide
layer on the R-pore and C-pore surfaces.
Drawbacks and practical difficulties of the EFTEM tomography
technique
In addition to the usual artifacts of the electron tomography due
to an incomplete sampling of the angular range, another limi-
tation of the EFTEM tomography comes out from the poor
signal to noise ratio (SNR) in the chemical projections, which
degrades the accuracy of the reconstructions in terms of differ-
ence between the 3D solution and the chemical distribution in the
original object. To obtain significant results, it is recommended
to analyze simultaneously several complementary chemical
volumes of the same specimen, in a combined manner. Apart
from the problem related with the signal to noise ratio (SNR),
other main practical difficulty of this analytical mode is related to
the calculation of the elemental projections, in particular to the
extraction of the background from the pre-edge filtered images.
For instance, one must totally prevent the existence of a negative
signal in all the pixels of the 2D elemental maps corresponding to
a negative number of atoms. For this reason, with respect to the
other methods used to compute the 2D elemental maps as for
instance the jump-ratio method,34 the use of the three-windows
method is the most suitable. It requires recording three filtered
images for each chemical element, but allows a better estimation
of the background, pixel by pixel, and furnishes intensities in the
elemental projections that monotonically depend on the number
of atoms. The effect of the thickness variation when tilting the
sample must also be taken into account, as the plural inelastic
scattering affects the shape of the spectrum and consequently the
background calculation. Such an effect can be neglected in a first
approximation, provided that the three windows method is used
and especially if the thickness of the object does not change
drastically when tilting, as in the case of the grain analyzed in this
study. In addition, in order to fulfil the projection requirement
for the tomography technique, the effect of the plural scattering
on the 2D elemental maps must be neglected in a first approxi-
mation. This is generally the case when the sample thickness is
lower than the effective inelastic mean free path in any point of
the specimen and that for all angular positions of the tilt series.21
In that regard, one has to systematically compare the maximum
specimen thickness to the inelastic mean free path for the
analyzed specimen. However, if the maximum thickness is
reached only on a limited area of the specimen and it is not to
different from the estimated mean free path, the contribution of
the single scatterings to the total spectrum is still predominant40
and thus the projection requirement for the tomography is ful-
filled in a first approximation.
Concerning the pre-processing steps of the elemental tilt series
before the reconstruction, owing to their poor signal to noise
ratio (SNR), the alignment must be performed in an indirect
manner, using the parameters deduced from the alignment of the
Zero-Loss tilt series. These projections have high SNR and
This journal is ª The Royal Society of Chemistry 2010
Publ
ishe
d on
11
Oct
ober
201
0. D
ownl
oade
d on
22/
10/2
014
19:5
2:43
. View Article Online
furthermore the presence of the fiducial markers allows to
precisely refining the rough cross-correlation solution. Finally,
a last experimental limitation is the presence of the irradiation
damages in the specimen, especially if long acquisition duration
is employed with the general aim to increase the SNR. The
optimization of all these parameters, from the acquisition
conditions to the parameters and methods for the data treatment
and analysis, is needed for obtaining realistic and significant 3D
chemical maps with a nanometer spatial resolution.
Acquisition parameters for the STEM-EELS mode
The STEM-EELS mode was locally employed to perform 2D
analytical measurement for accessing the pore oxidation degree.
The recording of the EELS spectra near the O-K edge was per-
formed using Gatan DigiScan in combination with Spectrum
Imaging (SI) plug-in in Digital Micrograph software. The
diameter of the probe, used to raster the sample in the chosen
direction was about 0.2 nm. The final spectrum was obtained
from 70 EELS SI spectra with 2 s exposure time per spectra using
a 2 mm spectrometer aperture and a dispersion of 0.3 eV/
channel.
Acknowledgements
This work was financially supported by SiCat Co. The SEM and
TEM experiments were carried out at the facilities of the IPCMS
(UMR 7504 CNRS). XPS experiments were carried out at the
facilities of the LMSPC (UMR 7515 CNRS) and P. Bernhardt is
gratefully acknowledged for performing the experiments.
References
1 M. J. Ledoux and C. Pham-Huu, Silicon Carbide a novel catalystsupport for heterogeneous catalysis, CATTECH, 2001, 5, 226–246.
2 G. C. T. Wei, Beta Sic Powders Produced by Carbothermic Reductionof Silica in a High-Temperature Rotary Furnace, J. Am. Ceram. Soc.,1983, 66, c111–113.
3 S. Sarin-Poncet; M. J. Ledoux; C. Pham-Huu; J. Bonsquet;B. Madani, Pat. Appl., WO 2005/013345 A1, 2005.
4 M. J. Ledoux, C. Crouzet, C. Pham-Huu, V. Turines,K. D. Kourtakis, P. L. Mills and J. J. Lerou, High-Yield Butane toMaleic Anhydride Direct Oxidation on Vanadyl PyrophosphateSupported on Heat-Conductive Materials: SiC, Si3N4, and BN, J.Catal., 2001, 203, 495–508.
5 P. Nguyen, D. Edouard, J. M. Nhut, M. J. Ledoux and C. Pham-Huu,High thermal conductive b-SiC for selective oxidation of H2S: A newsupport for exothermal reactions, Appl. Catal., B, 2007, 76, 300–310.
6 S. Ivanova, E. Vanhaecke, B. Louis, S. Libs, M. J. Ledoux, S. Rigolet,C. Marichal, C. Pham, F. Luck and C. Pham-Huu, Efficient Synthesisof Dimethyl Ether over HZSM-5 Supported on Medium-Surface-Area Beta-SiC Foam, ChemSusChem, 2008, 1, 851–857.
7 M. J. Ledoux, S. Hantzer, C. Pham-Huu, J. Guille andM. P. Desaneaux, New synthesis and uses of high-specific-surfaceSiC as a catalytic support that is chemically inert and has highthermal resistance, J. Catal., 1988, 114, 176.
8 I. Florea, M. Houlle, O. Ersen, L. Roiban, A. Deneuve, I. Janowska,P. Nguyen, C. Pham and C. Pham-Huu, Selective Deposition ofPalladium Nanoparticles inside the Bimodal Porosity of SiCInvestigated by Electron Tomography, J. Phys. Chem. C, 2009, 113,17711–17719.
9 J. P. Tessonnier, O. Ersen, G. Weinberg, C. Pham-Huu, D. Sheng Suand R. Schl€ogl, Selective Deposition of Metal Nanoparticles Inside orOutside Multiwalled Carbon Nanotubes, ACS Nano, 2009, 3, 2081–2089.
This journal is ª The Royal Society of Chemistry 2010
10 C. Colliex, T. Manoubi and O. L. Krivanek, EELS in the ElectronMicroscopy- A review of present trends, Journal of ElectronMicroscopy, 1986, 35, 307–313.
11 P. Bayle-Guillemaud, R. Radtke and M. Sennour, Electronspectroscopy imaging to study ELNES at a nanoscale, J. Microsc.,2003, 210, 66–73.
12 P. Bayle-Guillemaud, A. Barbier and C. Mocuta, Development ofquantitative energy filtering TEM method to study a reactiveNiO/80Ni20Fe interface, Ultramicroscopy, 2001, 88, 99–110.
13 K. Kaneko and K.-I. Kakimoto, HRTEM and ELNES analysis ofpolycarbosilane-derived Si–C–O bulk ceramics, J. Non-Cryst.Solids, 2000, 270, 181–190.
14 A. J. Koster, U. Ziese, A. J. Verkleij, A. H. Janssen and K. P. DeJong, Three-Dimensional Transmission Electron Microscopy: ANovel Imaging and Characterization Technique with NanometerScale Resolution for Material Science, J. Phys. Chem. B, 2000, 104,9368–9370.
15 P. A. Midgley and M. Weyland, 3D electron microscopy in thephysical sciences: The development of Z-contrast and EFTEMtomography, Ultramicroscopy, 2003, 96, 413–431.
16 G. Mobus and B. J. Inkson, Three-dimensional reconstruction ofburied nanoparticles by element-sensitive tomography based oninelastically scattered electrons, Appl. Phys. Lett., 2001, 79, 1369–1371.
17 M. Weyland, T. J. V. Yates, R. E. Dunin-Borkowski, T. Laffont andP. A. Midgley, Nanoscale analysis of three-dimensional structures byelectron tomography, Scripta Materialia, 2006, 55, 29–33.
18 M. H. Gass, K. K. K. Koziol, A. H. Windle and P. A. Midgley, Four-Dimensional Spectral Tomography of carbonaceousNanocomposites, Nano Lett., 2006, 6, 376–379.
19 R. D. Leapmann, E. Kocsis, G. Zhang, T. L. Talbot andP. Laquerriere, Three-dimensional distribution of elements inbiological samples by energy-filtered electron tomography,Ultramicroscopy, 2004, 100, 115–125.
20 M. A. Aronova, Y. C. Kim, R. Harmon, A. A. Sousa, A. Zhang andR. D. Leapman, Three-dimensional elemental mapping ofphosphorus by quantitative electron spectroscopic tomography(QuEST), J. Struct. Biol., 2007, 160, 35–48.
21 K. Jarausch, P. Thomas, D. N. Leonard, R. Twesten and C. R. Booth,Four-dimensional STEM-EELS: Enabling nano-scale chemicaltomography, Ultramicroscopy, 2009, 109, 326–337.
22 G. Mobus, R. C. Doole and B. J. Inkson, Spectroscopic electrontomography, Ultramicroscopy, 2003, 96, 433–451.
23 C. Pham-Huu; O. Ersen; M. J. Ledoux, in Nanoparticles andCatalysis, D. Astruc (Ed.), Wiley-VCH, 2008.
24 N. Keller, C. Pham-Huu, S. Roy, M. J. Ledoux, C. Estourn�es andGuille, Influence of the preparation conditions on the synthesis ofhigh surface area SiC for use as a heterogeneous catalyst support, J.Mater. Sci., 1999, 34, 3189.
25 R. Pampuch, W. Ptak, S. Jonas and J. Stoch, Mater. Sci. Monographs,1980, 6, 435.
26 L. Porte and A. Sartre, J. Mater. Sci., 1989, 24, 271.27 R. Moene, M. Makkee and J. A. Moulijin, High Surface Area Silicon
Carbide as catalyst support characterization and stability, Appl.Catal., A, 1998, 167, 321.
28 N. Mozdzierz, M. Backhaus-Ricoult and D. Imhoff, Proc. 13thInt. Congr. On Electron Microscopy, Les Editions de Physique,1994, 325.
29 N. Keller, C. Pham-Huu, M. J. Ledoux, C. Estourn�es and G. Ehret,Preparation and characterization of SiC microtubes, Appl. Catal.,A, 1999, 187, 255–268.
30 N. Keller, G. Koehl, F. Garin and V. Keller, Chem. Commun., 2005,201.
31 N. Keller, F. Di Gr�egorio, C. Pham-Huu and V. Keller, DiamondRelat. Mater., 2008, 17, 1867–1870.
32 N. Keller, C. Pham-Huu and M. J. Ledoux, Low temperature use ofSiC-supported NiS2-based catalysts for selective H2S oxidation Roleof SiC surface heterogeneity and nature of the active phase, Appl.Catal., A, 2002, 234, 191.
33 S. Ivanova, B. Louis, B. Madani, J. P. Tessonnier, M. J. Ledoux andC. Pham-Huu, ZSM-5 Coatings on a SiC Monoliths: Possible NewStructured Catalyst for the Methanol-to-Olefins Process, J. Phys.Chem. C, 2007, 111, 4368.
34 P. J. Thomas and P. A. Midgley, An introduction to energy-filteredtransmission electron microscopy, Top. Catal., 2002, 21, 109–138.
Nanoscale, 2010, 2, 2668–2678 | 2677

Publ
ishe
d on
11
Oct
ober
201
0. D
ownl
oade
d on
22/
10/2
014
19:5
2:43
. View Article Online
35 J. Veerbeck, D. Van Dyck and G. Van Tendeloo, Energy-filteredtransmission electron microscopy: an overview, Spectrochim. Acta,Part B, 2004, 59, 1529–1534.
36 D. N. Mastronarde, Dual-axis tomography: An approach withalignment methods that preserve resolution, J. Struct. Biol., 1997,120, 343–352.
37 C. Messaoudii, T. Boudier, C. O. Sanchez Sorzano and S. Marco,TomoJ: tomography software for three-dimensional reconstructionin transmission electron microscopy, BMC Bioinformatics, 2007, 6,288.
2678 | Nanoscale, 2010, 2, 2668–2678
38 R. Gordon, R. Bender and Gabor T. Herman, AlgebraicalReconstruction Technique (ART) for Three-Dimensional ElectronMicroscopy and X-Rays Photography, J. Theor. Biol., 1970, 24,471–481.
39 H. Friedrich, M. R. McCartney and P. R. Buseck, Comparison ofintensity distribution in tomograms from BF TEM, ADF STEM,HAADF STEM, and calculated tilt series, Ultramicroscopy, 2005,106, 18–27.
40 R. F. Egerton; Electron Energy-Loss Spectroscopy in the ElectronMicroscope Second Edition, Plenum Press New York and London.
This journal is ª The Royal Society of Chemistry 2010