Analytical Development and Support
52
2017 Project Peer Review WBS# 2.5.1.101 Analytical Development and Support Technology Area Session: Biochemical Conversion Principal Investigator: Ed Wolfrum March 8, 2017 This presentation does not contain any proprietary, confidential, or otherwise restricted information
Transcript of Analytical Development and Support
2017 Project Peer ReviewWBS# 2.5.1.101Analytical Development and SupportTechnology Area Session: Biochemical ConversionPrincipal Investigator: Ed WolfrumMarch 8, 2017
This presentation does not contain any proprietary, confidential, or otherwise restricted information
2
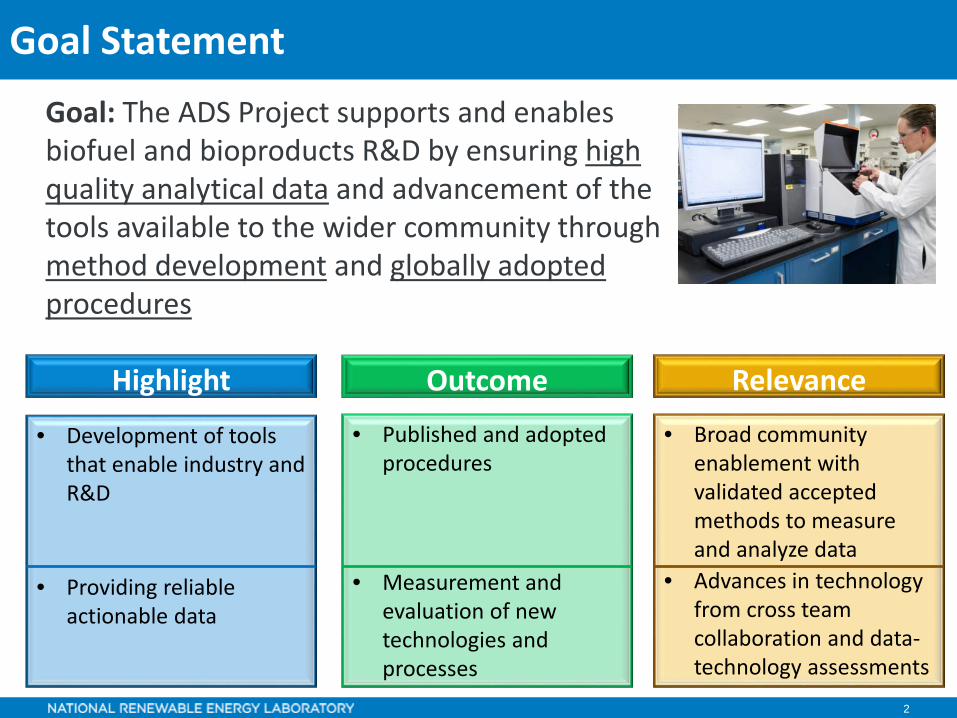
• Published and adopted procedures
• Measurement and evaluation of new technologies and processes
Goal Statement
Goal: The ADS Project supports and enables biofuel and bioproducts R&D by ensuring high quality analytical data and advancement of the tools available to the wider community through method development and globally adopted procedures
• Broad community enablement with validated accepted methods to measure and analyze data
• Advances in technology from cross team collaboration and data-technology assessments
• Development of tools that enable industry and R&D
• Providing reliable actionable data
Highlight Outcome Relevance
3
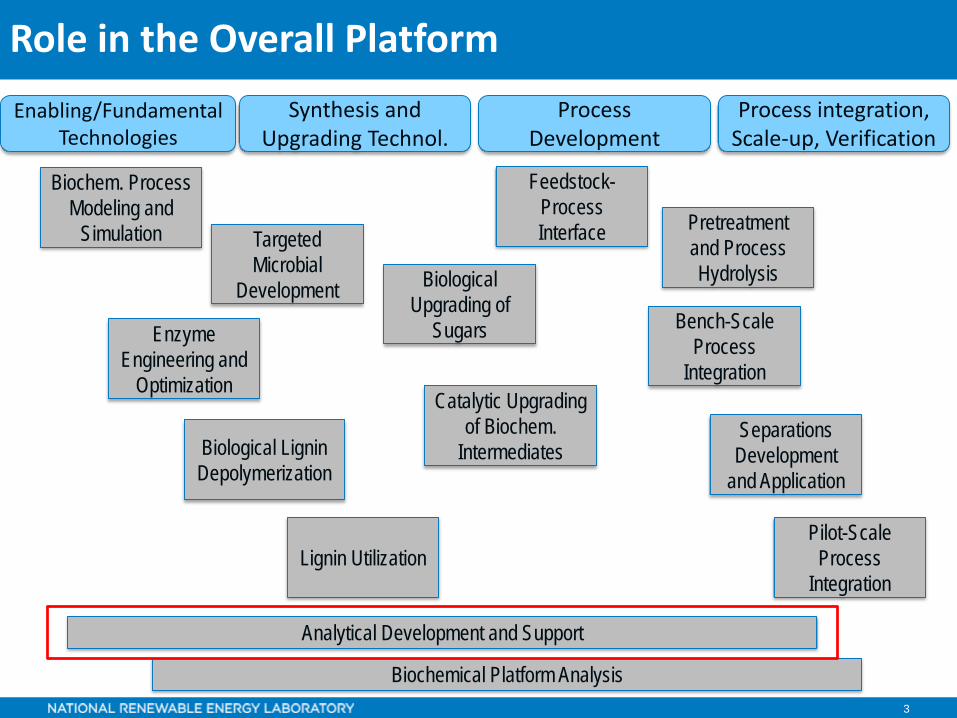
Role in the Overall PlatformProcess integration,
Scale-up, VerificationProcess
DevelopmentSynthesis and
Upgrading Technol.Enabling/Fundamental
Technologies
Feedstock-Process Interface Pretreatment
and Process Hydrolysis
Separations Development
and Application
Enzyme Engineering and
Optimization
Biological Upgrading of
Sugars Bench-Scale Process
Integration
Pilot-Scale Process
Integration
Biochemical Platform Analysis
Targeted Microbial
Development
Biochem. Process Modeling and
Simulation
Lignin Utilization
Catalytic Upgrading of Biochem.
IntermediatesBiological Lignin Depolymerization
Analytical Development and Support
4
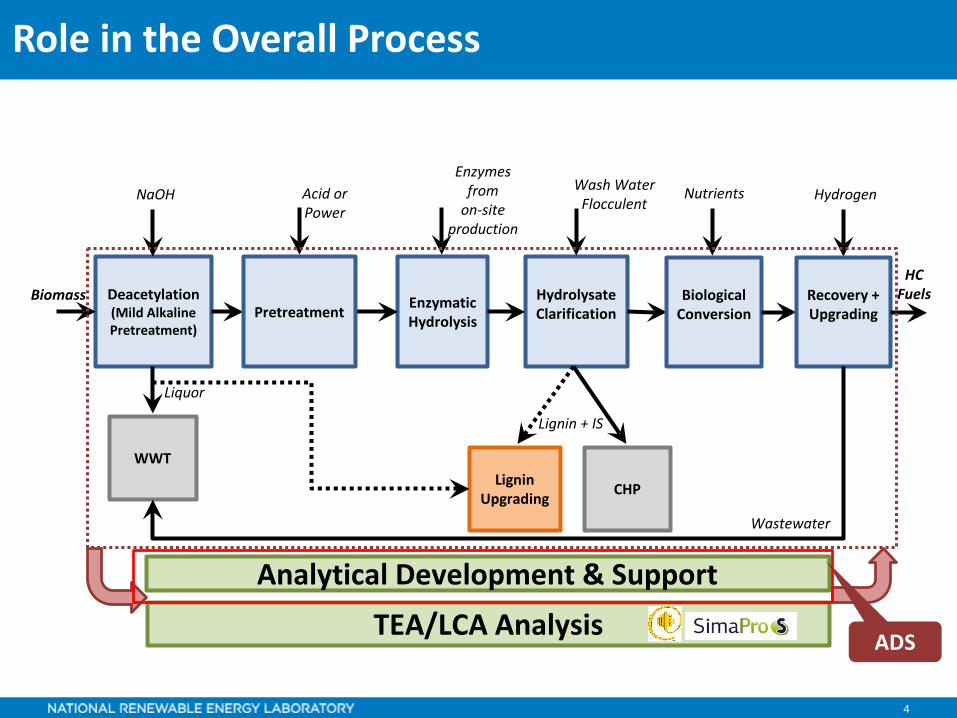
Role in the Overall Process
Analytical Development & Support
Enzymatic Hydrolysis
Deacetylation(Mild Alkaline Pretreatment)
HydrolysateClarification
BiologicalConversion
Biomass
NaOH HydrogenWash WaterFlocculent
Enzymesfrom
on-siteproduction
Pretreatment
WWT
Liquor
CHPLignin Upgrading
Lignin + IS
Recovery + Upgrading
Wastewater
HCFuels
Acid or Power
Nutrients
TEA/LCA Analysis ADS

5
Quad Chart Overview
• Project start date - FY16• Project end date - FY18• Percent complete - 50%
Bt-B. Biomass Variability• Develop methods to assess variabilityBt-C. Biomass Recalcitrance• Measure reactivity and intermediatesBt-D. Pretreatment Processing• Track mass balance and constituents
Timeline
Budget
Barriers
Analytical chemistry work and rapid prediction models facilitated partnerships with:• INL• Shell• Toyota• Grain Millers• LONG LIST
Partners
Total Costs
FY12 –14FY15 Costs
FY16 Costs
Total Planned Funding
(FY17-18)
DOE Funds $4.2M* $1.2M $1.2M $2.4M
* This project was part of former BPI Task
6
External Collaborators for previous slide
AbengoaASTM InternationalCiris EnergyChromatinCobaltCornellCSUDONG Energy
DupontEarth EnergyEcoPetrolEdenIQEnvironmental Protection AgencyGrainMillersKellogg
Leaf ResourcesKST KiORMetabolixNexsteppePetrobrasPurdueShell
ToyotaUIUCUT-AustinVirentWaste EmpoweredWSUZeaChem

7
Project OverviewMethod DevelopmentWork with colleagues to develop and implement new analytical methods
Laboratory SupportMaintain four analytical laboratoriesMaintain existing instrumentation and identify and validate new instruments
Sample Coordination and QCMore than 14,600 platform analyses
RelationshipsCultivate relationships with industry, academia, and other laboratoriesMaintain NIR calibration models for licensing to partners
Quality Data
Method Development
Published Procedures
Relationships
Instruments
8
Approach
Analytical Development and Support (ADS) Project

9
Approach – Management
Scientists • Communicate and coordinate with PIs from program tasks• Anticipate analytical needs based on work plans• Recommend new methods for development• Carry out milestones and publish workResearch technicians• Produce consistent quality data• Maintain laboratory equipment• Cross train on methods to have staff available to all projects
We conduct relevant research across the conversion value chain and work jointly with other projects across the platform to provide quality data to evaluate and meet all technical goals
Task 1: Analytical DevelopmentPerform cross cutting research to enable technologies by providing high quality data, and recommend and develop methods
Task 2: Analytical SupportEnsure consistent data, provide functional labs, and handle sample management

10
Approach – Technical
Challenges• Keeping abreast of changing program needs• Developing robust methods quickly• Managing analysis for multiple platform projects• Maintaining four laboratories and a large
number of analytical instruments
Identify Program and Industry Needs
Develop Options for New Methods
Validate Chosen Methods
Optimize Methods for Minimal Time &
Labor
Help Select Preferred Methods
We focus on the evolving needs of our colleague’s research, always a moving target. We are responsive to new analytical needs across multiple projects.
Critical Success Factors • Provide quality data in a timely manner to allow research to proceed• Ensure data is reliable and actionable• Provide methods to the broad biomass conversion research, development, and
commercialization community• Go/no-go decision provides all analytical methods
necessary for reliable data analysis for advanced biofuels/bioproducts processes
11
Approach – Sample Management & Data Handling
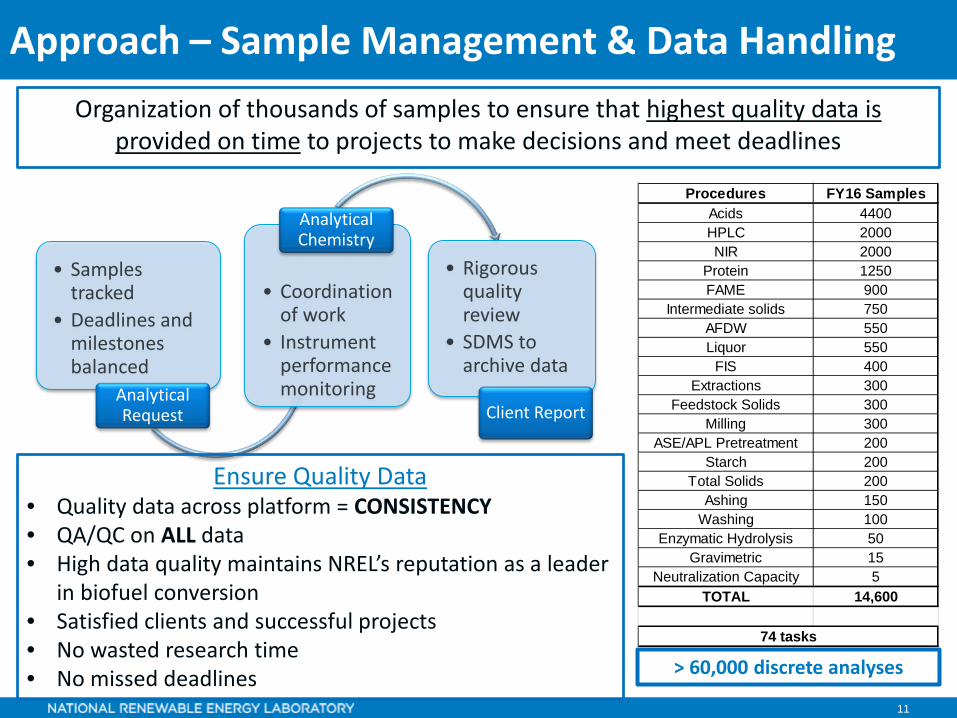
• Samples tracked
• Deadlines and milestones balanced
Analytical Request
• Coordination of work
• Instrument performance monitoring
Analytical Chemistry
• Rigorous quality review
• SDMS to archive data
Client Report
Procedures FY16 SamplesAcids 4400HPLC 2000NIR 2000
Protein 1250FAME 900
Intermediate solids 750AFDW 550Liquor 550
FIS 400Extractions 300
Feedstock Solids 300Milling 300
ASE/APL Pretreatment 200Starch 200
Total Solids 200Ashing 150
Washing 100Enzymatic Hydrolysis 50
Gravimetric 15Neutralization Capacity 5
TOTAL 14,600
74 tasks
Organization of thousands of samples to ensure that highest quality data is provided on time to projects to make decisions and meet deadlines
Ensure Quality Data • Quality data across platform = CONSISTENCY• QA/QC on ALL data• High data quality maintains NREL’s reputation as a leader
in biofuel conversion• Satisfied clients and successful projects• No wasted research time• No missed deadlines > 60,000 discrete analyses

12
Technical Accomplishments (TA)
Analytical Development and Support (ADS) Project
13
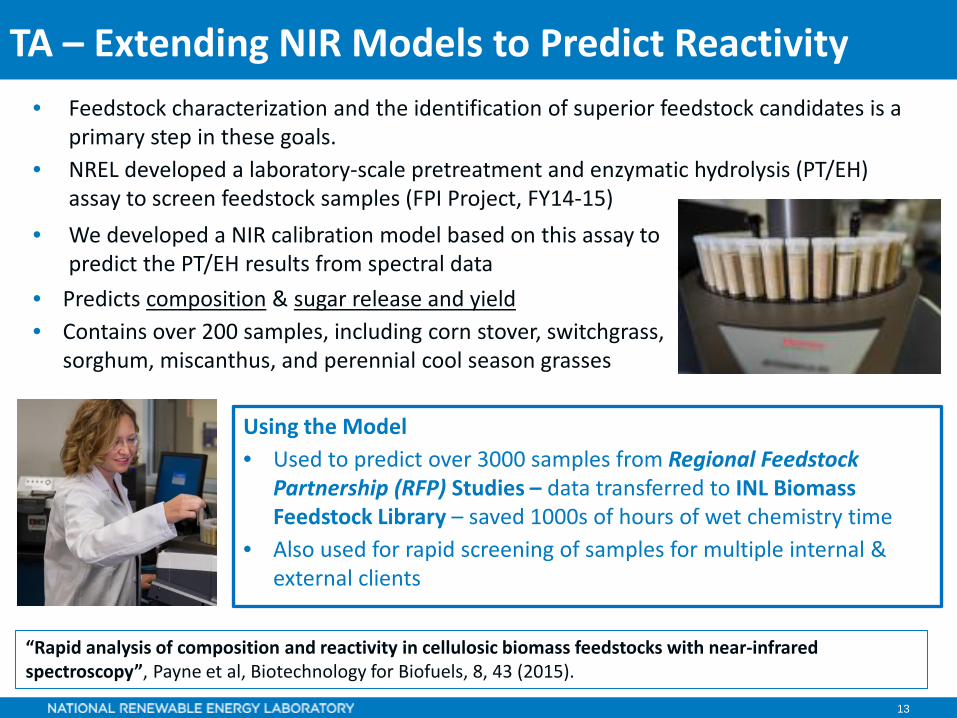
TA – Extending NIR Models to Predict Reactivity
“Rapid analysis of composition and reactivity in cellulosic biomass feedstocks with near-infrared spectroscopy”, Payne et al, Biotechnology for Biofuels, 8, 43 (2015).
• Predicts composition & sugar release and yield• Contains over 200 samples, including corn stover, switchgrass,
sorghum, miscanthus, and perennial cool season grasses
• Feedstock characterization and the identification of superior feedstock candidates is a primary step in these goals.
• NREL developed a laboratory-scale pretreatment and enzymatic hydrolysis (PT/EH) assay to screen feedstock samples (FPI Project, FY14-15)
• We developed a NIR calibration model based on this assay to predict the PT/EH results from spectral data
Using the Model • Used to predict over 3000 samples from Regional Feedstock
Partnership (RFP) Studies – data transferred to INL Biomass Feedstock Library – saved 1000s of hours of wet chemistry time
• Also used for rapid screening of samples for multiple internal & external clients
14
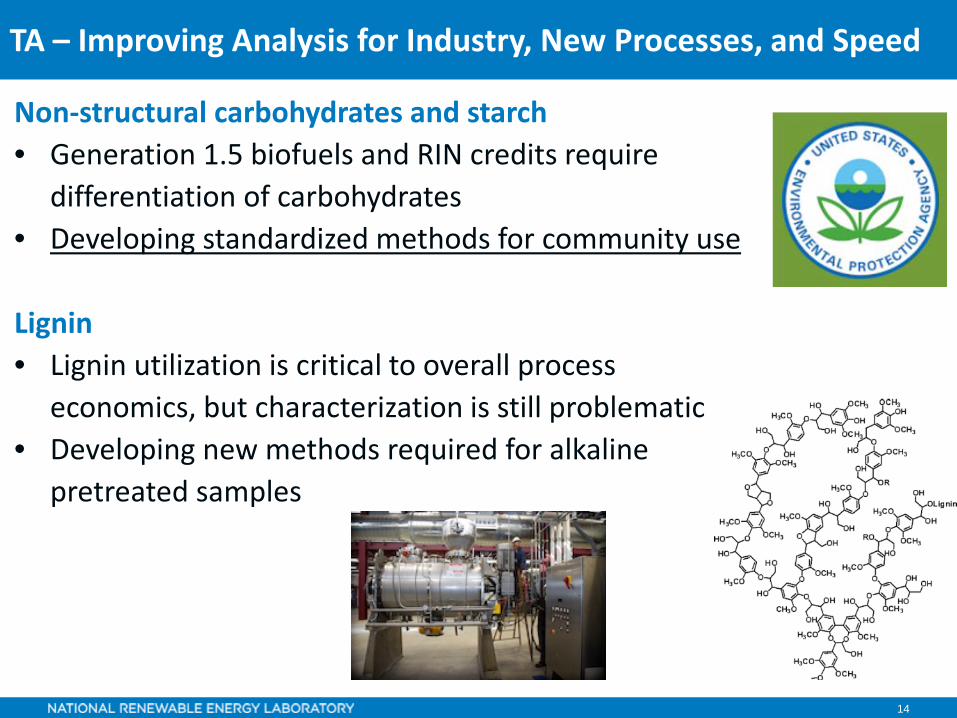
Non-structural carbohydrates and starch• Generation 1.5 biofuels and RIN credits require
differentiation of carbohydrates• Developing standardized methods for community use
Lignin• Lignin utilization is critical to overall process
economics, but characterization is still problematic• Developing new methods required for alkaline
pretreated samples
TA – Improving Analysis for Industry, New Processes, and Speed

15
High Throughput• 3X increase in analytical hydrolysis
throughput • New lignin measurements 8 times faster• Increased throughput extractionsInvesting in new analytical technology• LCMS (Q-ToF) for identification of
compounds (lignin, lipids, carbohydrates) based on molecular structure
• IC-PAD for improved carbohydrate measurement
TA – Improving Analysis for Industry, New Processes, and Speed
16
TA – Carbohydrate Tracking across DMR to Enable Process Evaluation
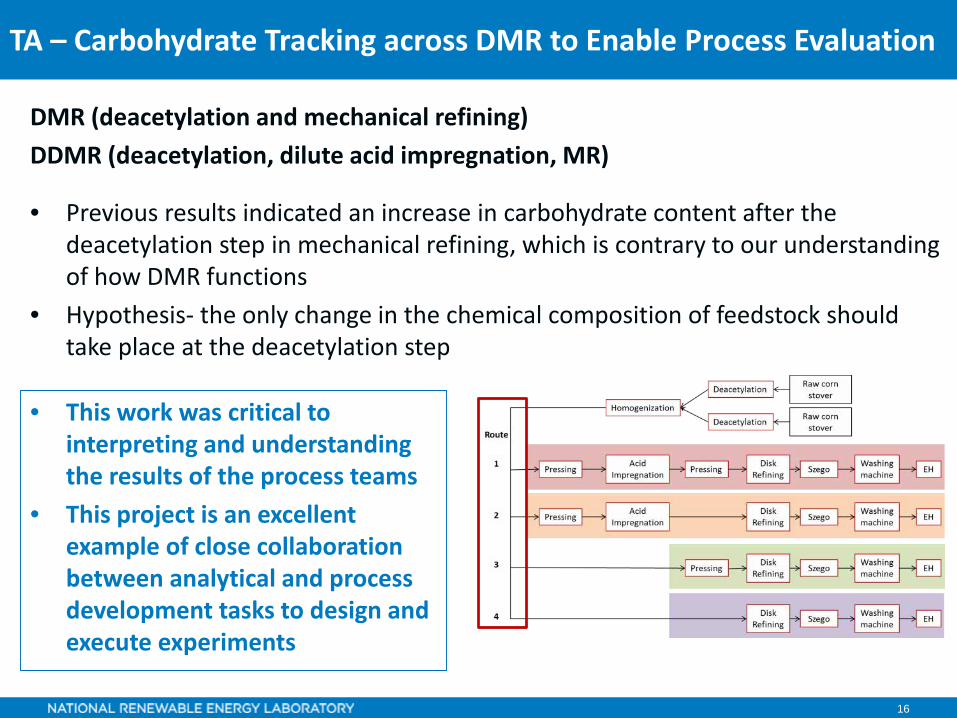
DMR (deacetylation and mechanical refining)DDMR (deacetylation, dilute acid impregnation, MR)
• Previous results indicated an increase in carbohydrate content after the deacetylation step in mechanical refining, which is contrary to our understanding of how DMR functions
• Hypothesis- the only change in the chemical composition of feedstock should take place at the deacetylation step
• This work was critical to interpreting and understanding the results of the process teams
• This project is an excellent example of close collaboration between analytical and process development tasks to design and execute experiments

17
• We saw no practical differences in carbohydrate content across mechanical refining
• Materials were very difficult to sample representatively
• Lignin and acetate measurements under these conditions were problematic – working on this in FY17
This work demonstrates a collaboration between analytical and process development teams to deconvolute processes and data.
Additionally, work done in the pilot plant is very different than work done on the bench; the pilot plant is more representative of industrial environments.
Route 1 Route 2 Route 3 Route 4
TA – Carbohydrate tracking across DMR to Enable Process Evaluation
18
TA – Developed Improved Fraction Insoluble Solids (FIS) Method for Throughput and At-line Capability
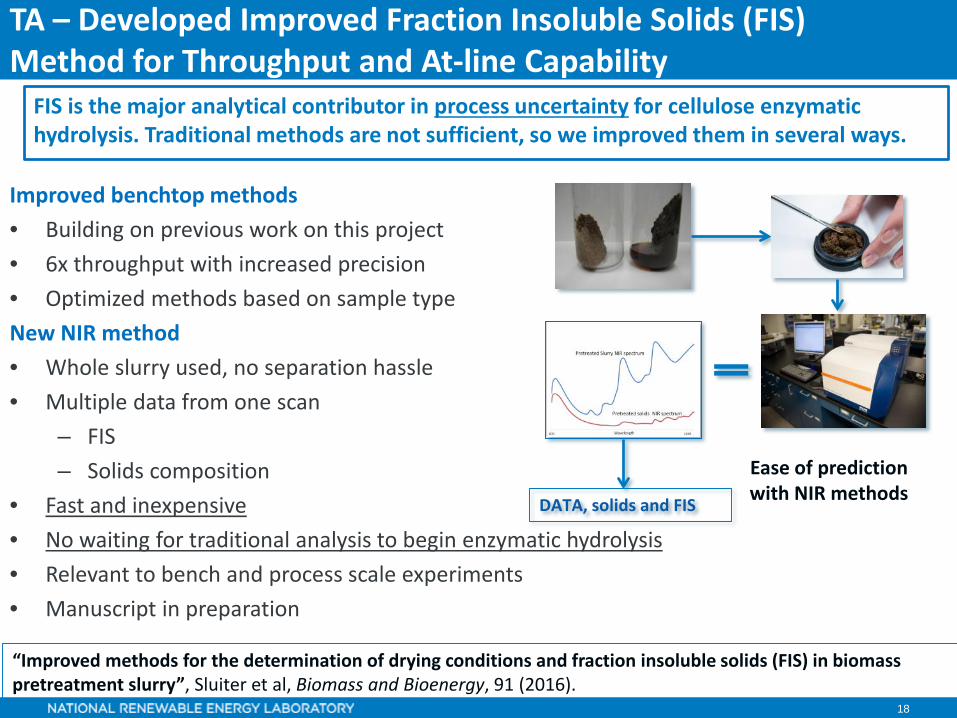
Improved benchtop methods• Building on previous work on this project• 6x throughput with increased precision• Optimized methods based on sample typeNew NIR method• Whole slurry used, no separation hassle• Multiple data from one scan
– FIS– Solids composition
• Fast and inexpensive• No waiting for traditional analysis to begin enzymatic hydrolysis• Relevant to bench and process scale experiments• Manuscript in preparation
DATA, solids and FIS
“Improved methods for the determination of drying conditions and fraction insoluble solids (FIS) in biomass pretreatment slurry”, Sluiter et al, Biomass and Bioenergy, 91 (2016).
Ease of prediction with NIR methods
FIS is the major analytical contributor in process uncertainty for cellulose enzymatic hydrolysis. Traditional methods are not sufficient, so we improved them in several ways.

19
Relevance
Analytical Development and Support (ADS) Project
Goal: The ADS Project supports and enables biofuel and bioproducts R&D by ensuring high quality analytical dataand advancement of the tools available to the wider community through method development and globally adopted procedures
20
Relevance – Technology Transfer
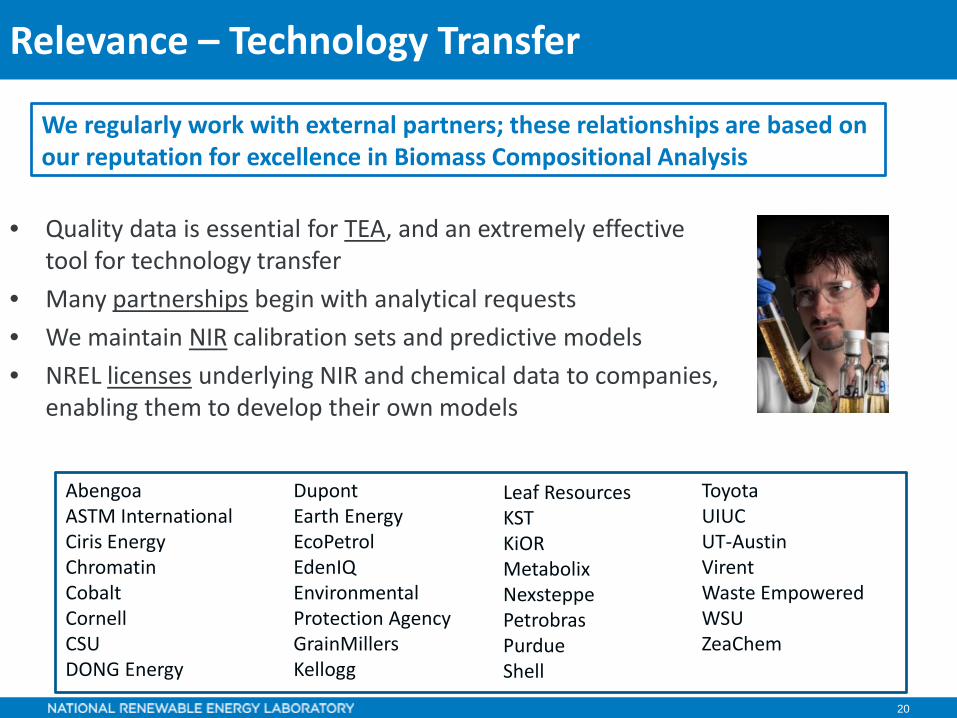
• Quality data is essential for TEA, and an extremely effective tool for technology transfer
• Many partnerships begin with analytical requests• We maintain NIR calibration sets and predictive models• NREL licenses underlying NIR and chemical data to companies,
enabling them to develop their own models
We regularly work with external partners; these relationships are based on our reputation for excellence in Biomass Compositional Analysis
AbengoaASTM InternationalCiris EnergyChromatinCobaltCornellCSUDONG Energy
DupontEarth EnergyEcoPetrolEdenIQEnvironmental Protection AgencyGrainMillersKellogg
Leaf ResourcesKST KiORMetabolixNexsteppePetrobrasPurdueShell
ToyotaUIUCUT-AustinVirentWaste EmpoweredWSUZeaChem
21
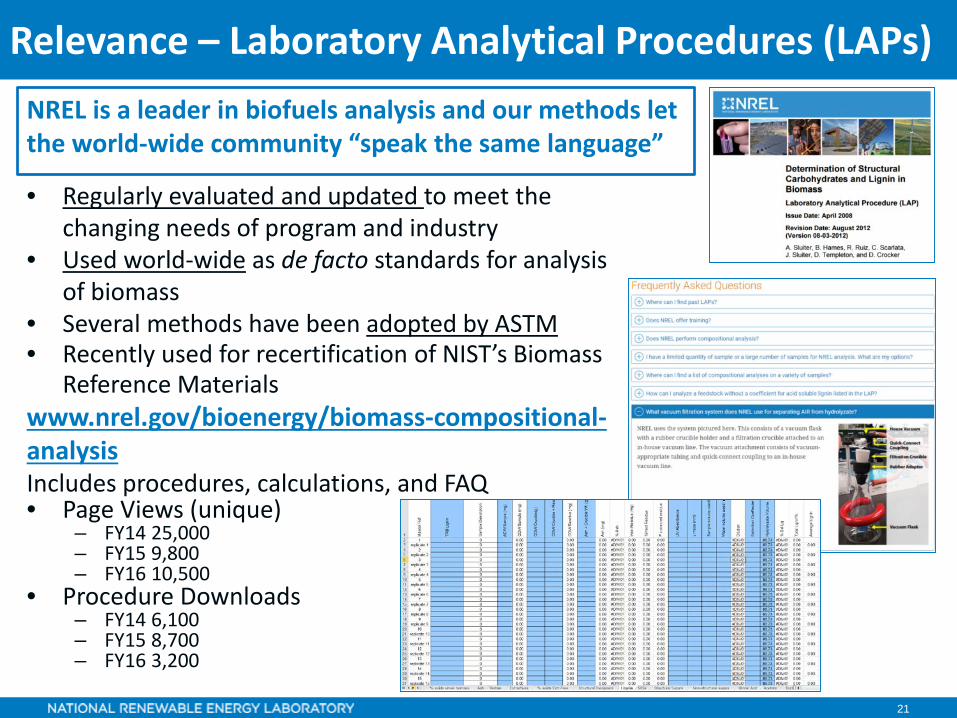
• Regularly evaluated and updated to meet the changing needs of program and industry
• Used world-wide as de facto standards for analysis of biomass
• Several methods have been adopted by ASTM• Recently used for recertification of NIST’s Biomass
Reference Materialswww.nrel.gov/bioenergy/biomass-compositional-analysisIncludes procedures, calculations, and FAQ• Page Views (unique)
– FY14 25,000 – FY15 9,800– FY16 10,500
• Procedure Downloads– FY14 6,100 – FY15 8,700– FY16 3,200
Relevance – Laboratory Analytical Procedures (LAPs)NREL is a leader in biofuels analysis and our methods let the world-wide community “speak the same language”
22
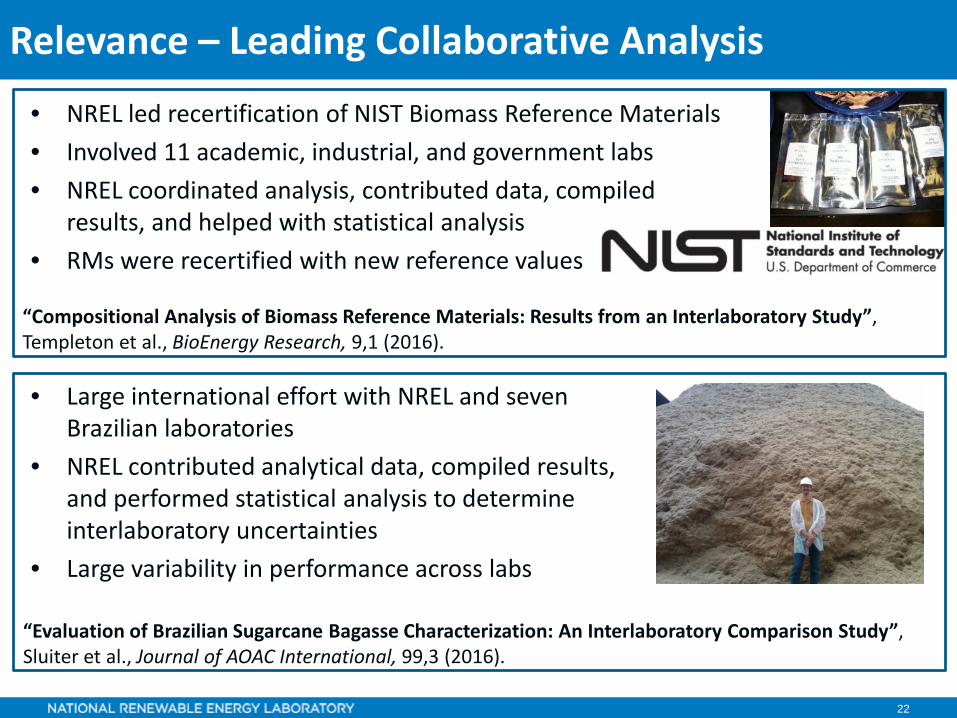
Relevance – Leading Collaborative Analysis
• Large international effort with NREL and seven Brazilian laboratories
• NREL contributed analytical data, compiled results, and performed statistical analysis to determine interlaboratory uncertainties
• Large variability in performance across labs
“Compositional Analysis of Biomass Reference Materials: Results from an Interlaboratory Study”, Templeton et al., BioEnergy Research, 9,1 (2016).
“Evaluation of Brazilian Sugarcane Bagasse Characterization: An Interlaboratory Comparison Study”, Sluiter et al., Journal of AOAC International, 99,3 (2016).
• NREL led recertification of NIST Biomass Reference Materials• Involved 11 academic, industrial, and government labs • NREL coordinated analysis, contributed data, compiled
results, and helped with statistical analysis• RMs were recertified with new reference values
23
Relevance – Outreach to External Stakeholders
• NREL is a member of Subcommittee E48.05 on Biomass Conversion• NREL Laboratory Analytical Procedures (LAPs) were adopted by ASTM
almost 10 years ago• NREL is leading ongoing discussions to improve lignin analysis
• Working with EPA on the Renewable Fuels Standard (RFS) guidelines for qualifying pathways to cellulosic ethanol
• This work is developing a better understanding on suitable analytical methods for quantification of cellulose converted to ethanol in “Gen 1.5” processes
• The ADS Project is uniquely suited to this role with its history of analytical methods and relationship with the ASTM methods
24
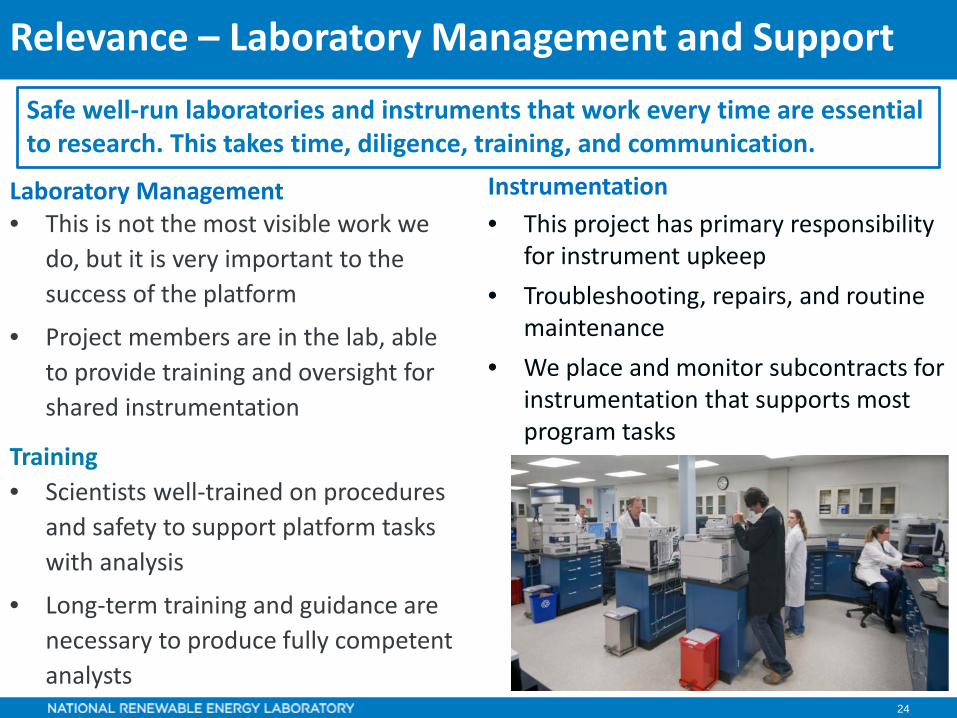
Relevance – Laboratory Management and Support
Laboratory Management• This is not the most visible work we
do, but it is very important to the success of the platform
• Project members are in the lab, able to provide training and oversight for shared instrumentation
Training• Scientists well-trained on procedures
and safety to support platform tasks with analysis
• Long-term training and guidance are necessary to produce fully competent analysts
Instrumentation• This project has primary responsibility
for instrument upkeep• Troubleshooting, repairs, and routine
maintenance• We place and monitor subcontracts for
instrumentation that supports most program tasks
Safe well-run laboratories and instruments that work every time are essential to research. This takes time, diligence, training, and communication.
25
Future Work
Analytical Development and Support (ADS) Project
26
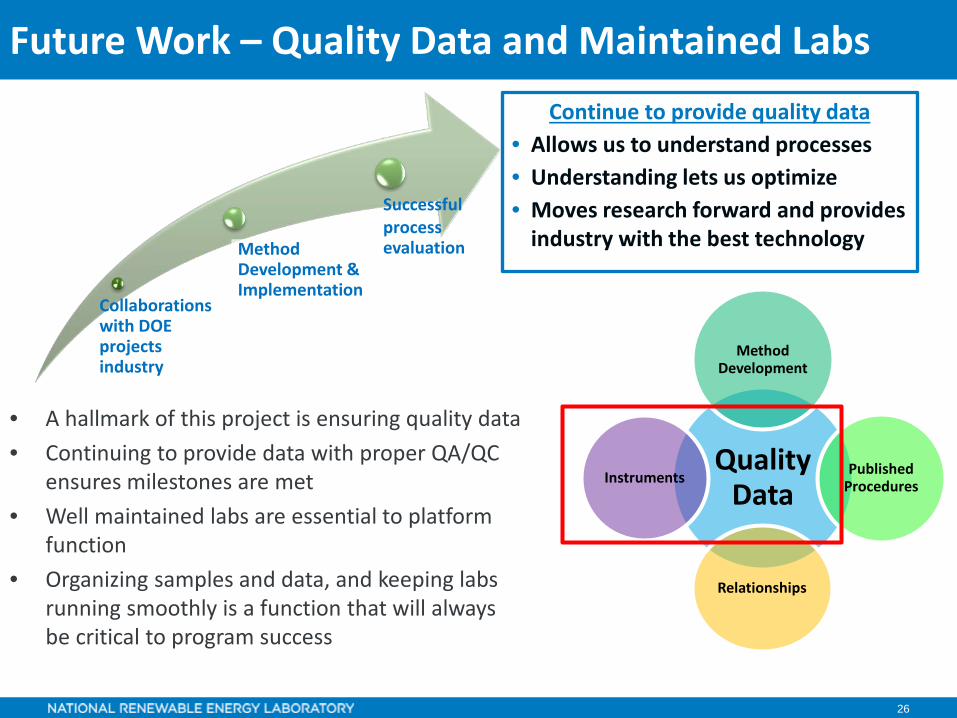
Future Work – Quality Data and Maintained Labs
• A hallmark of this project is ensuring quality data• Continuing to provide data with proper QA/QC
ensures milestones are met• Well maintained labs are essential to platform
function• Organizing samples and data, and keeping labs
running smoothly is a function that will always be critical to program success
Method Development & Implementation
Collaborations with DOE projects industry
Successful processevaluation
Continue to provide quality data• Allows us to understand processes• Understanding lets us optimize• Moves research forward and provides
industry with the best technology
Quality Data
Method Development
Published Procedures
Relationships
Instruments
27
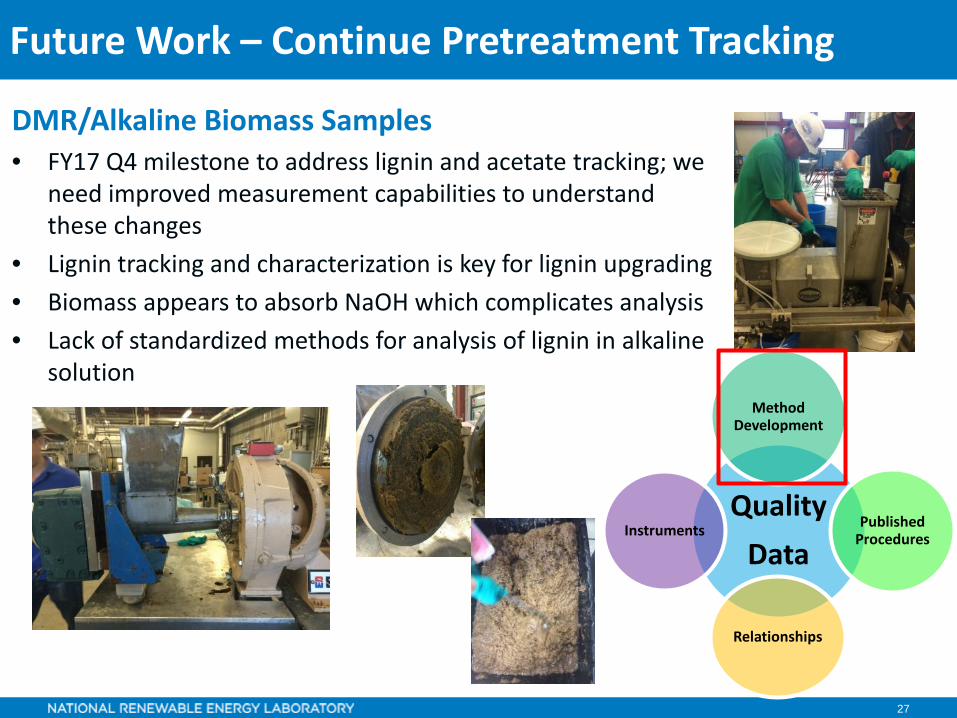
Future Work – Continue Pretreatment Tracking
DMR/Alkaline Biomass Samples• FY17 Q4 milestone to address lignin and acetate tracking; we
need improved measurement capabilities to understand these changes
• Lignin tracking and characterization is key for lignin upgrading• Biomass appears to absorb NaOH which complicates analysis • Lack of standardized methods for analysis of lignin in alkaline
solution
QualityData
Method Development
Published Procedures
Relationships
Instruments
28
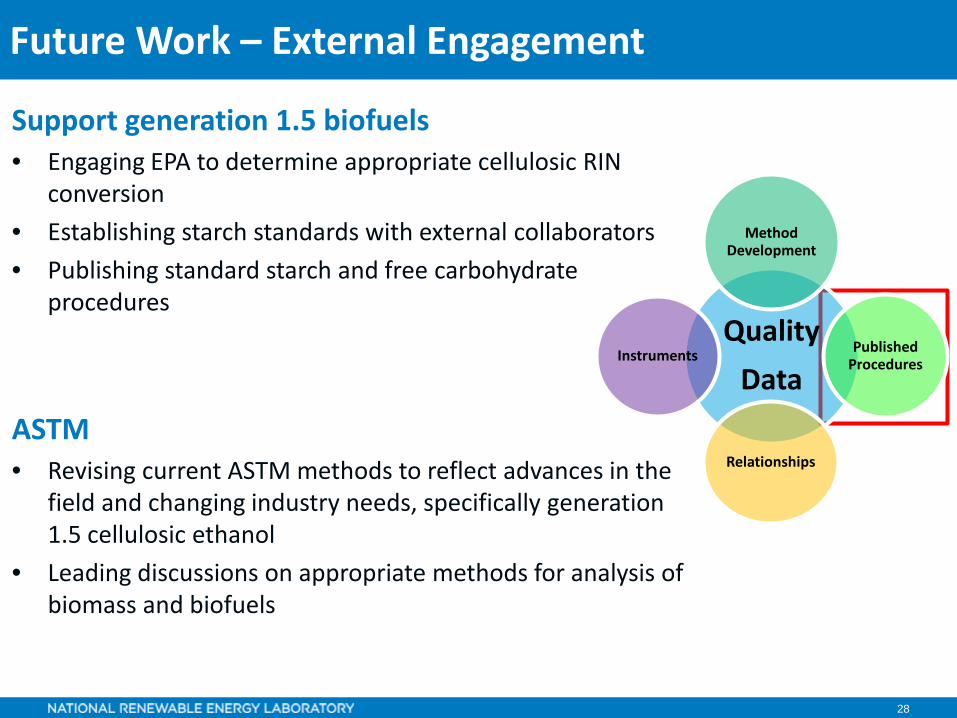
Future Work – External Engagement
Support generation 1.5 biofuels• Engaging EPA to determine appropriate cellulosic RIN
conversion• Establishing starch standards with external collaborators• Publishing standard starch and free carbohydrate
procedures
ASTM• Revising current ASTM methods to reflect advances in the
field and changing industry needs, specifically generation 1.5 cellulosic ethanol
• Leading discussions on appropriate methods for analysis of biomass and biofuels
QualityData
Method Development
Published Procedures
Relationships
Instruments

29
Future Work – Moving to more mature technologies
NIR- online monitoring• At-line and on-line fermentation monitoring• Very low-cost NIR spectroscopy approaches• 2018 milestone to demonstrate in-line saccharification and fermentation
monitoring at the pilot-scale using low-cost near-infrared spectroscopy
Characterize fermentation coproducts• Carbon and nitrogen mass balance around fermentation including
coproduct characterization• Develop standardized procedures for use with current and future organisms• Provide information that will minimize EPS interference in fermentations
We will develop more effective online tools and methods for process optimization, deploying these for industrial and R&D applications

30
Summary
Approach
• Method development
• Quality data• Community
support• Published
procedures• Collaborations• Laboratory
management
Accomplishments
• Developed reactivity NIR models
• Continued improvements in industrially relevant methods
• Tracked DMR carbohydrates for process evaluation
• Developed faster fraction insoluble solids method and at-line NIR capability
Relevance
• Industry support• Guide standards
and references• NIR models
available for license
• LAPs• Quality reliable
data is crucial for processes
• Outreach to key external collaborators and the larger community
• Laboratory Management
Future Work
• Maintain quality data and labs
• DMR process characterization
• Alkaline sample methods
• Support EPA and ASTM standards and regulations
• Maintain and cultivate external relationships
• Fermentation coproduct quantification
• NIR monitoring
Goal: The ADS Project supports and enables biofuel and bioproducts R&D by ensuring high quality analytical data and advancement of the tools available to the wider community through method development and globally adopted procedures
31
Acknowledgements
• Ian Rowe (BETO)• Amie Sluiter• Justin Sluiter• Courtney Payne• Deborah Hyman• David Templeton• Bill Michener• Michelle Reed• Darren Peterson• Jeff Wolfe• Kailee Potter• Ryan Ness• Brenna Black• Kelsey Ramirez
32
Publications & Presentations 2015-2016Payne CE, Wolfrum EJ. Rapid analysis of composition and reactivity in cellulosic biomass feedstocks with near-infrared spectroscopy. Biotechnol Biofuels 2015;8:1–14. Templeton DW, Wolfrum EJ, Yen JH, Sharpless KE. Compositional Analysis of Biomass Reference Materials: Results from an Interlaboratory Study. BioEnergy Res 2015. Sluiter JS, et al. Evaluation of Brazilian Sugarcane Bagasse Characterization: An Interlaboratory Comparison Study. Journal of AOAC International 2016;99:3. Sluiter A, Sluiter J, Wolfrum E, Reed M, Ness R, Scarlata C, et al. Improved methods for the determination of drying conditions and fraction insoluble solids (FIS) in biomass pretreatment slurry. Biomass and Bioenergy 2016;91:234–42Sievers DA, Kuhn EM, Stickel JJ, Tucker MP, Wolfrum EJ. Online residence time distribution measurement of thermochemical biomass pretreatment reactors. Chem Eng Sci 2016;140:330–6. Templeton DW, Sluiter JB, Sluiter A, Payne C, Crocker DP, Tao L, et al. Long-term variability in sugarcane bagasse feedstock compositional methods: sources and magnitude of analytical variability. Biotechnol Biofuels 2016;9:223. Wang DR, Wolfrum EJ, Virk P, Ismail A, Greenberg AJ, McCouch SR. Robust phenotyping strategies for evaluation of stem non-structural carbohydrates (NSC) in rice. J Exp Bot 2016;67:6125–38. Lischeske JJ, Crawford NC, Kuhn E, Nagle NJ, Schell DJ, Tucker MP, et al. Assessing pretreatment reactor scaling through empirical analysis. Biotechnol Biofuels 2016;9:213. Turner MF, Heuberger AL, Kirkwood JS, Collins CC, Wolfrum EJ, Broeckling CD, et al. Non-targeted Metabolomics in Diverse Sorghum Breeding Lines Indicates Primary and Secondary Metabolite Profiles Are Associated with Plant Biomass Accumulation and Photosynthesis. Front Plant Sci 2016;7:953. “Pretreatment Reactor Scaling: Comparing Conversion Performance Across Different Pretreatment Reactors “ (poster), Edward Wolfrum, Daniel Schell, James D. McMillan, Nick Nagle, Melvin Tucker, Erik M. Kuhn, Nathan Crawford and James Lischeske, 38th Symposium on Biotechnology for Fuels and Chemicals, Baltimore MD, April 2016“Effect of drought on composition and bioconversion for Miscanthus, mixed perennial grasses, and switchgrass as bioenergy feedstocks,” (poster) A. Hoover, R. Emerson*, D. Stevens, A. Ray, J. Lacey, M. Cortez, C. Payne, R. Kallenbach, M. Sousek, and R. Farris. 38th Symposium on Biotechnology for Fuels and Chemicals, Baltimore MD, April 2016“NIR/PLS Models to Predict Pretreated Corn Stover Slurry Solids, Isolated and In-situ”, Sluiter, et al, oral presentation., 37th Symposium on Biotechnology for Fuels and Chemicals, May 2015
33
Responses to Previous Reviewers’ CommentsOVERVIEW• Excellent overview, with clear indication of where the project fits in
the overall platform. • Quality data is key.APPROACH• Good technical and management approach. The collaboration
management approach will support many projects and have a greater impact; good to see. Technical approach of focusing on providing what the client is and will be looking for is excellent.
• Good approach, balancing supplying services when they are needed with maintenance, developing
PROGRESS• Outstanding performance to date. Over 6000 analyses done FY14!
Development of tools and methods that have direct impact on industry is terrific. Great project.
• Vast number of analysis complete. Plus QA/QC of those. • QA/QC support and coordinate analyses of data• Develop of software tools to make life easier is excellent. Data
management is a huge undertaking.• Consistency of data across projects/ researchers is vital• Enhanced mass balance closure with enhanced sample measurements
is outstanding and important.• Pro active in developing analytical procedures to keep up with the
focus of the researchers is good.• Technology transfer of models is excellent.• Speed and quality seems to be a theme.• Publishing the analytical procedures is really beneficial to the private
sector.• Up keep of analytical instruments and training.RELEVANCE• This is probably one of the most relevant projects in the portfolio,
supporting so many of the others and providing meaningful analytical
data. Technology transfer to industry is a major plus.• This is so relevant that most of the other work would stop without it.• Key enabling technology for many BETO projects and contributing to
overall goals. Publication of methods has a high impact on the scientific community, enabling more effective R&D.
FUTURE WORK• "Keep doing what you're doing" seems odd for a development project,
but works perfectly here for future work. It seems that it means not just continuing to provide analytical services, but to remain agile and ahead of the industry, providing methodologies and models as needed to advance many projects.
• Directional plan in place. Much is dependent on demands from other projects.
• Keep doing what you are doingOverall Impressions (Not Scored)• This is one of the most important activities in the program. Consistent
and reliable data is of utmost importance.• Great project that has focused its effort on allowing other projects to
progress and/or complete successfully. It sounds like the method development effort is proactive and stays ahead of industry, this is great news. Integration with paying customers has allows the project to progress with nominal funding that should continue in order to support this terrific resource.
• Absolutely the most important support task, system will come to a halt without this being done correctly.
• This activity has stepped up over the years to enable all of the NREL success as well as made pioneering inroads into the fundamental analysis and support to the industry.
• Key activity that seems to run well, responding to the needs of customers, and providing critical data and methods to the community.
• The importance of the analytical methods and procedures and the ability to deliver quality data in a timely manner is huge.
34
Acronyms
• DDMR - deacetylation, dilute acid pretreatment, and mechanical refining
• DMR - deacetylation and mechanical refining• FIS - fraction insoluble solids • NIR - near infrared• PDU – Process Development Unit

35
Additional Slides
Analytical Development & Support (ADS) Project

36
Exopolysaccharides (EPS)• EPS were halting fermentation research• EPS is a slime coat produced in lipid fermentation • EPS clogs HPLC columns, preventing carbohydrate & acid
analysis• Filtering samples through molecular weight cutoff filters was
successful, but expensive and time-consuming• Developed analysis with IC-PAD , requiring no extra filtering• Characterized EPS using analytical hydrolysis approach• EPS carbohydrate composition the same for fermentations
using glucose and xylose
TA – EPS Characterization to Remove Fermentation Barriers
C. curvatus grown on xylose
C. curvatus grown on glucose
Glucose Fermentation
Xylose Fermentation
Lipid Yield 72 63
Glucose 3.9 3.4Xylose 0.2 0.4Mannose 4.3 4.1Total EPS 9.5 8.9
Lipid Production %
EPS Production g/LBiomass sugars
Fermentation with
Cryptococcus curvatus
Lipid Production
EPS isolation and
quantification
37
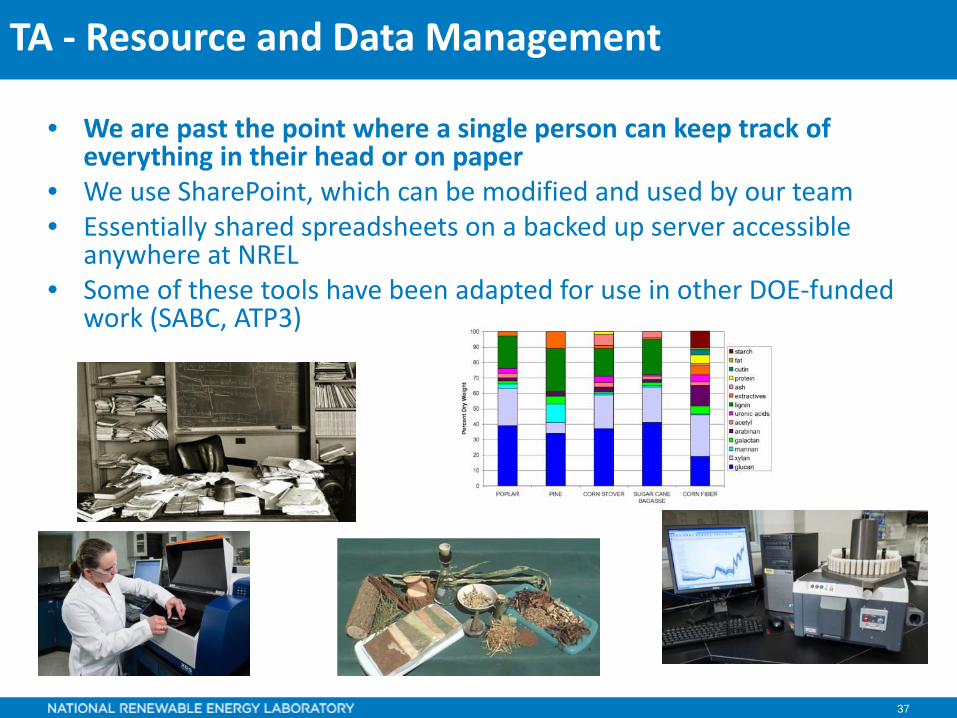
TA - Resource and Data Management
• We are past the point where a single person can keep track of everything in their head or on paper
• We use SharePoint, which can be modified and used by our team• Essentially shared spreadsheets on a backed up server accessible
anywhere at NREL• Some of these tools have been adapted for use in other DOE-funded
work (SABC, ATP3)

38
Near Infrared (NIR) Spectroscopy for Rapid Analysis
Why NIRo Minimal sample preparationo Adaptable instrumentso Multiple scanning optionso Bulk sample analysis
Foss Dispersive NIR
Thermo FT-NIR
Photos by Dennis Schroeder

39
NIR Models for Rapid Compositional Analysis
Corn stover feedstock
Mixed herbaceous feedstock
Pretreated corn stover solids
Pretreated corn stover solids in-situ
Carbohydrate release during pretreatment
Solid matter in pretreated slurry
NIR predicted vs. measured FIS values for pretreated slurry samples
40
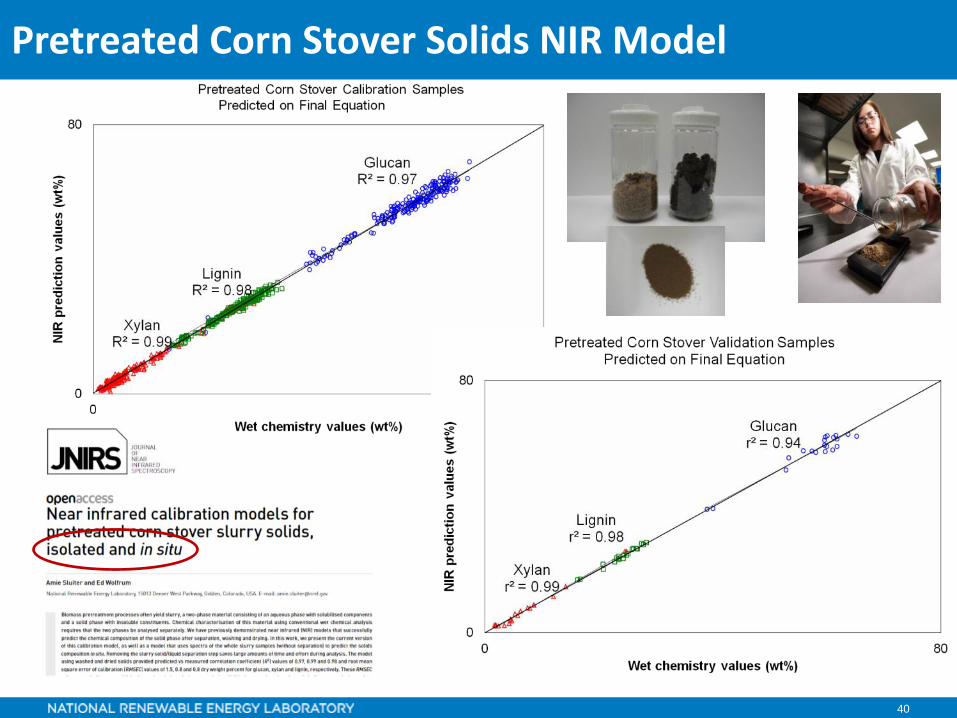
Pretreated Corn Stover Solids NIR Model

41
• 262 calibration samples- acid, steam, DA
• Scans on whole slurry• No liquor background removed• More process relevant
Pretreated Corn Stover Slurry NIR Model

42
Next Generation NIR – Low Cost Instruments
• A new generation of NIR spectrometers are about to become commercially available
• A step change in technology & cost• How well would a low-cost spectrometer
work compared to the standard laboratory system for our applications?– Thermo Antares FT-NIR (~$95,000)– NIRSCAN NANO (~$1,000)
43
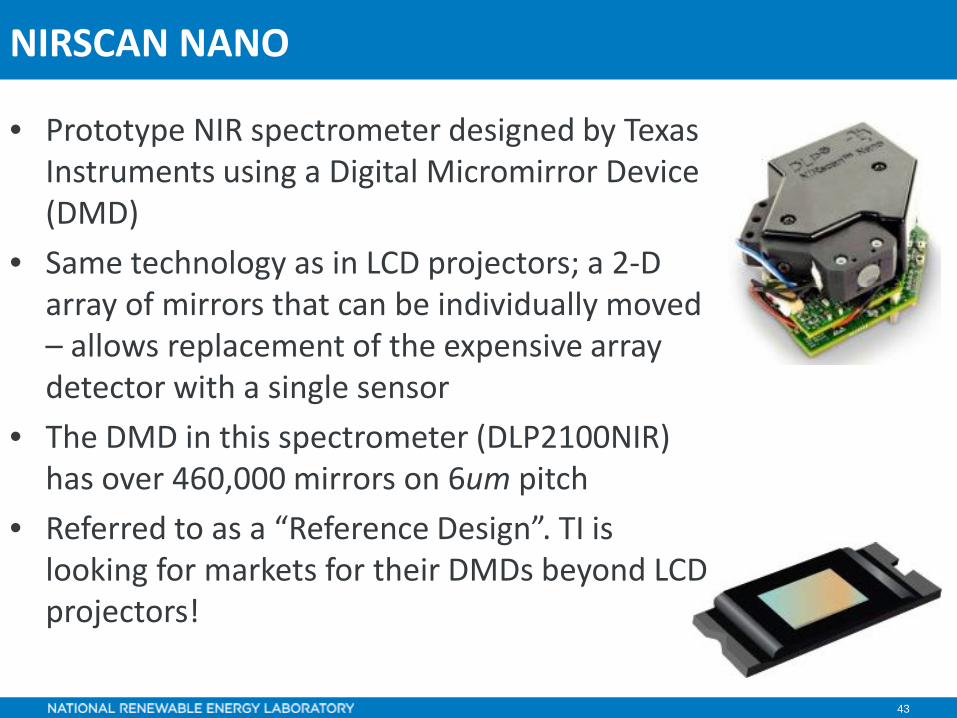
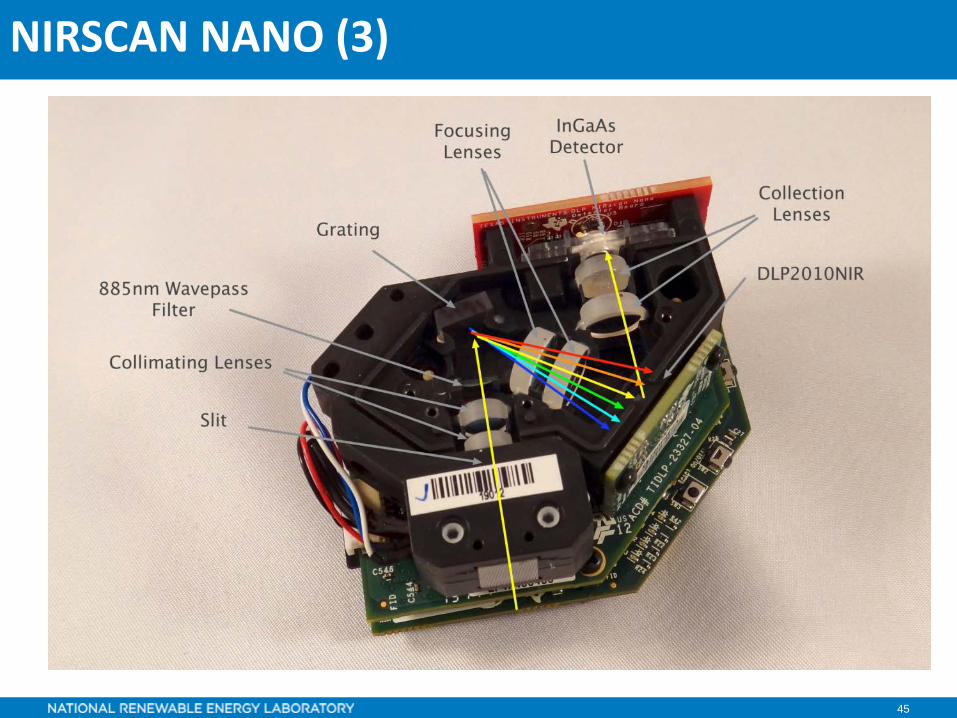
NIRSCAN NANO
• Prototype NIR spectrometer designed by Texas Instruments using a Digital Micromirror Device (DMD)
• Same technology as in LCD projectors; a 2-D array of mirrors that can be individually moved – allows replacement of the expensive array detector with a single sensor
• The DMD in this spectrometer (DLP2100NIR) has over 460,000 mirrors on 6um pitch
• Referred to as a “Reference Design”. TI is looking for markets for their DMDs beyond LCD projectors!
44
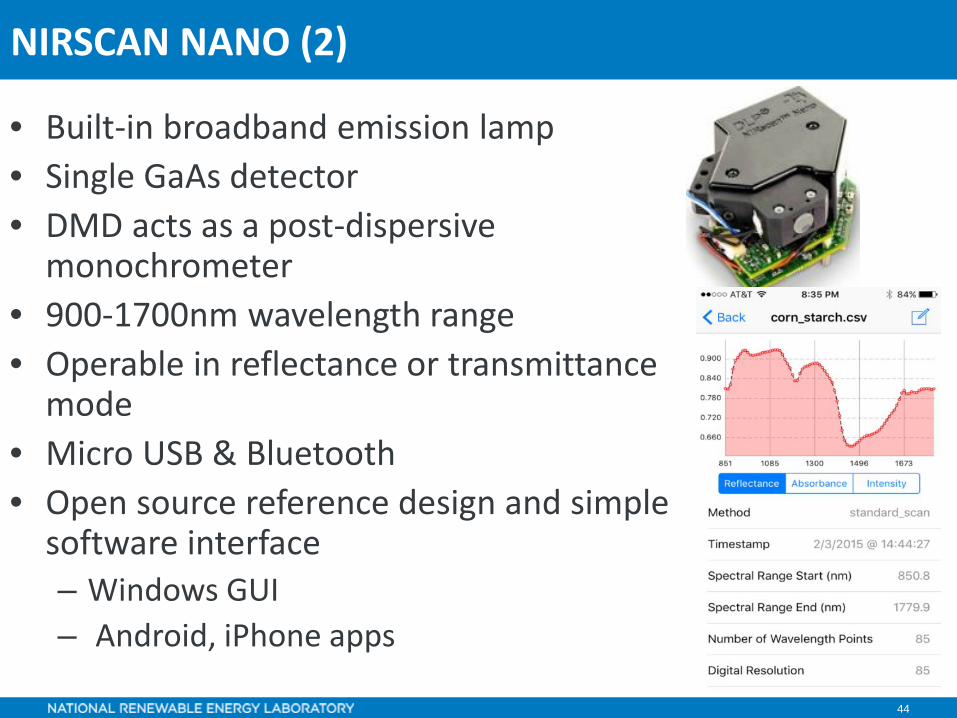
NIRSCAN NANO (2)
• Built-in broadband emission lamp• Single GaAs detector• DMD acts as a post-dispersive
monochrometer• 900-1700nm wavelength range• Operable in reflectance or transmittance
mode• Micro USB & Bluetooth• Open source reference design and simple
software interface– Windows GUI– Android, iPhone apps
45
NIRSCAN NANO (3)
46
Comparing Models from both Spectrometers
• 37 miscanthus samples taken from existing biomass feedstock calibration model
• Thermo-Antares spectra taken using a standard cell holder - previous calibration experiment
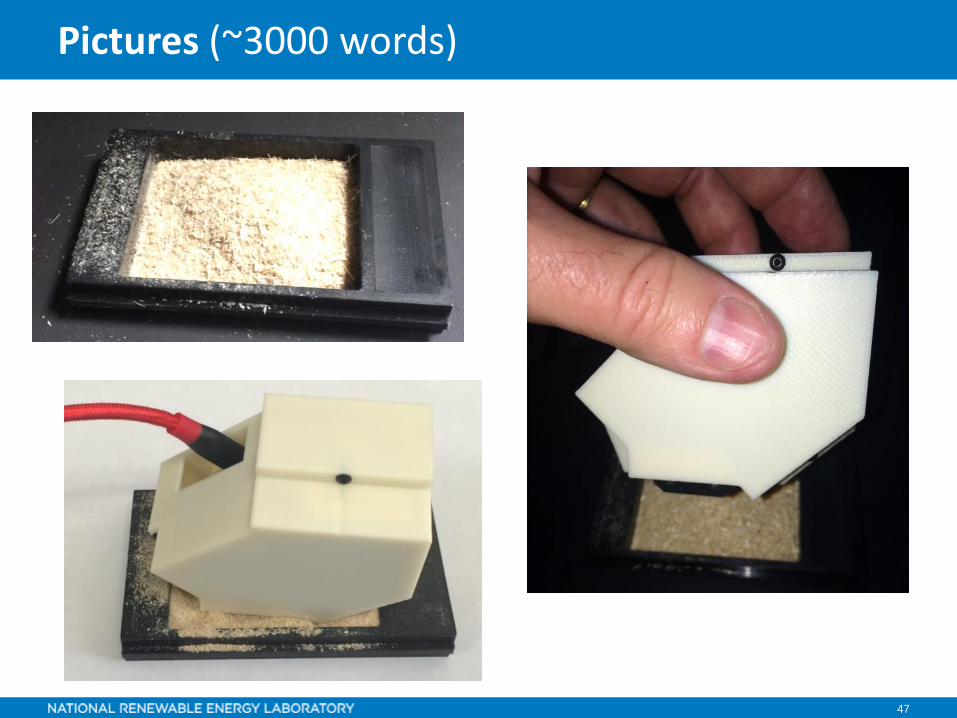
• Milled samples poured into ¼ cup cell (used only as a holder) and smoothed
• NIRSCAN NANO spectrometer placed on top of milled material
• 3 replicate spectra taken with spectrometer rotated between samples
• Replicate spectra averaged
47
Pictures (~3000 words)
48
Experimental Details
• Spectra collected with NIRSCAN NANO Windows application
• Files exported as individual text files• Used R to process spectral files & build models• Spectra transformed (SNV_DT_SG) prior to modeling• Performance based on PLS2 model (calibration &
cross-validation)– correlation coefficient (R2)– root mean squared error (RMSE)– # of Principal Components used
49
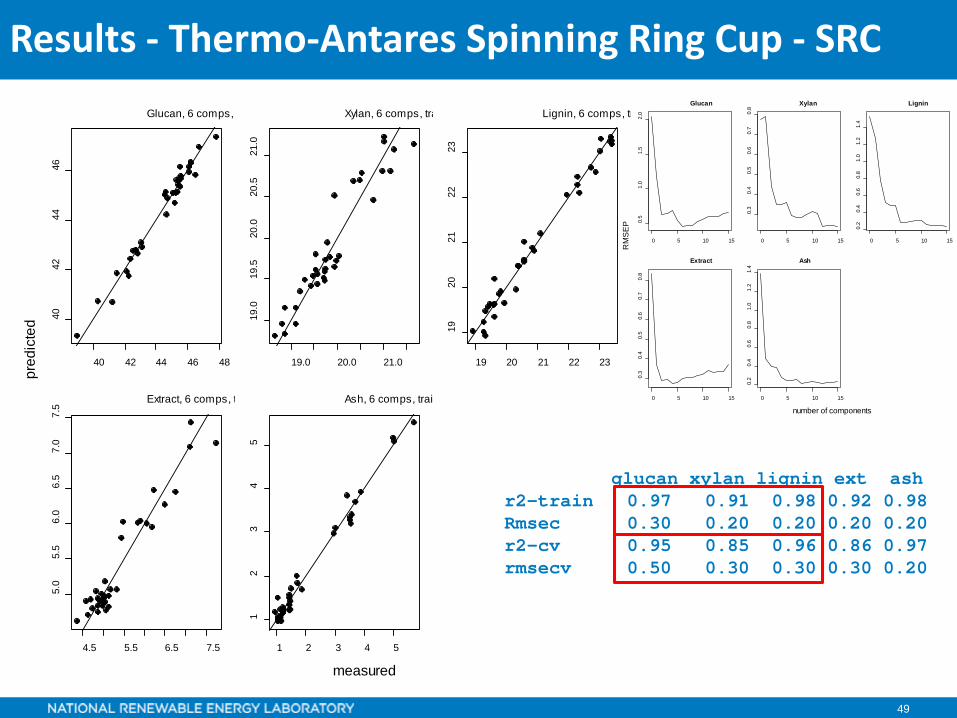
Results - Thermo-Antares Spinning Ring Cup - SRC
glucan xylan lignin ext ashr2-train 0.97 0.91 0.98 0.92 0.98Rmsec 0.30 0.20 0.20 0.20 0.20r2-cv 0.95 0.85 0.96 0.86 0.97rmsecv 0.50 0.30 0.30 0.30 0.20
40 42 44 46 48
4042
4446
Glucan, 6 comps,
19.0 20.0 21.0
19.0
19.5
20.0
20.5
21.0
Xylan, 6 comps, tra
19 20 21 22 23
1920
2122
23
Lignin, 6 comps, tr
4.5 5.5 6.5 7.5
5.0
5.5
6.0
6.5
7.0
7.5
Extract, 6 comps, t
1 2 3 4 5
12
34
5
Ash, 6 comps, trai
measured
pred
icte
d
0 5 10 15
0.5
1.0
1.5
2.0
Glucan
0 5 10 15
0.3
0.4
0.5
0.6
0.7
0.8
Xylan
0 5 10 15
0.2
0.4
0.6
0.8
1.0
1.2
1.4
Lignin
0 5 10 15
0.3
0.4
0.5
0.6
0.7
0.8
Extract
0 5 10 15
0.2
0.4
0.6
0.8
1.0
1.2
1.4
Ash
number of components
RM
SE
P
50
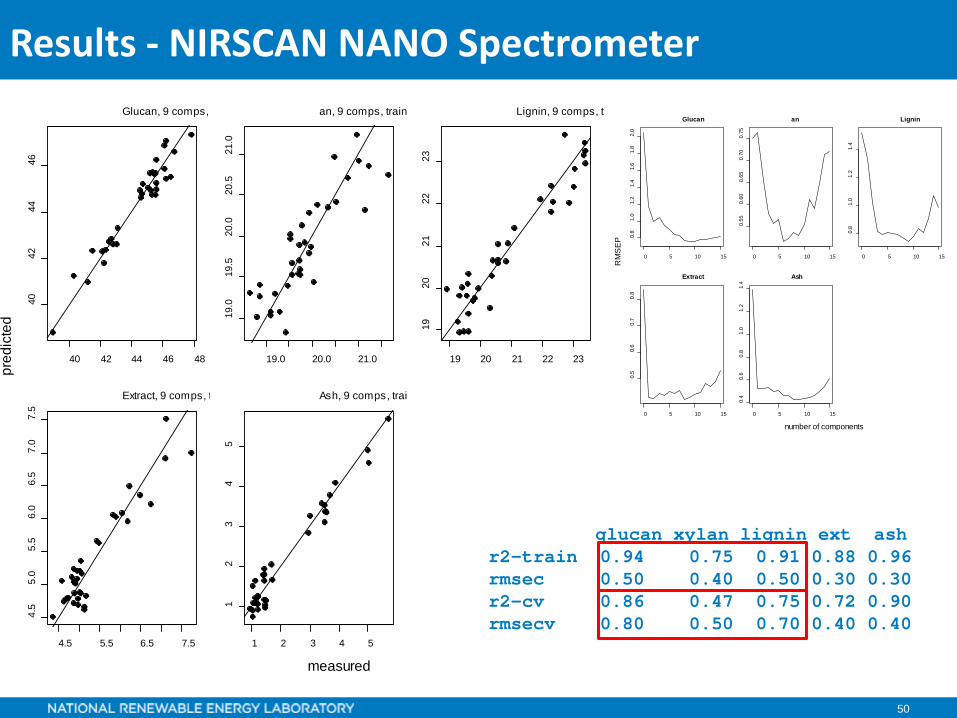
glucan xylan lignin ext ashr2-train 0.94 0.75 0.91 0.88 0.96rmsec 0.50 0.40 0.50 0.30 0.30r2-cv 0.86 0.47 0.75 0.72 0.90rmsecv 0.80 0.50 0.70 0.40 0.40
Results - NIRSCAN NANO Spectrometer
40 42 44 46 48
4042
4446
Glucan, 9 comps,
19.0 20.0 21.0
19.0
19.5
20.0
20.5
21.0
an, 9 comps, train
19 20 21 22 23
1920
2122
23
Lignin, 9 comps, tr
4.5 5.5 6.5 7.5
4.5
5.0
5.5
6.0
6.5
7.0
7.5
Extract, 9 comps, t
1 2 3 4 5
12
34
5
Ash, 9 comps, trai
measured
pred
icte
d
0 5 10 15
0.8
1.0
1.2
1.4
1.6
1.8
2.0
Glucan
0 5 10 15
0.55
0.60
0.65
0.70
0.75
an
0 5 10 15
0.8
1.0
1.2
1.4
Lignin
0 5 10 15
0.5
0.6
0.7
0.8
Extract
0 5 10 15
0.4
0.6
0.8
1.0
1.2
1.4
Ash
number of components
RM
SE
P

51
40 42 44 46 48
4042
4446
Glucan, 5 comps,
19.0 19.5 20.0 20.5 21.0
19.0
19.5
20.0
20.5
21.0
Xylan, 5 comps, tra
20 21 22 23
1920
2122
23
Lignin, 5 comps, tr
4.5 5.5 6.5 7.5
4.5
5.0
5.5
6.0
6.5
7.0
7.5
Extract, 5 comps, t
1 2 3 4 5
12
34
5
Ash, 5 comps, trai
measured
pred
icte
d
glucan xylan lignin ext ashr2-train 0.97 0.79 0.92 0.92 0.96rmsec 0.30 0.30 0.40 0.20 0.30r2-cv 0.92 0.66 0.81 0.87 0.94rmsecv 0.60 0.40 0.60 0.30 0.30
Results - Thermo SRC – Reduced Spectral Range
0 5 10 15
0.5
1.0
1.5
2.0
Glucan
0 5 10 15
0.4
0.5
0.6
0.7
Xylan
0 5 10 15
0.4
0.6
0.8
1.0
1.2
1.4
Lignin
0 5 10 15
0.3
0.4
0.5
0.6
0.7
0.8
Extract
0 5 10 15
0.4
0.6
0.8
1.0
1.2
1.4
Ash
number of components
RM
SE
P
52
Summary – Low-cost NIR Spectrometer
• Calibration model for biomass compositional analysis built with NIRSCAN NANO spectra is not quite as good as model built with Thermo Antaris spectra– Lower R2 values– Approximately 2-fold larger RMSE values– More PCs needed to fit model
• Decreased performance of NIRSCAN NANO appears to be due to a more narrow spectral range rather than a SNR issue – fixable problem in the longer term
• Model using NIRSCAN NANO spectra should be adequate for certain applications at a ~30x cost savings
• Working with an OEM manufacturer to move this work forward