Analytic Methods for Benchmarking Hydrogen and Fuel Cell ... · Analytic Methods for Benchmarking...
36
NREL/PR-5400-64420 NREL is a national laboratory of the U.S. Department of Energy, Office of Energy Efficiency and Renewable Energy, operated by the Alliance for Sustainable Energy, LLC. Analytic Methods for Benchmarking Hydrogen and Fuel Cell Technologies 227 th ECS Meeting, Chicago, Illinois Marc Melaina, Genevieve Saur, Todd Ramsden, Joshua Eichman May 28, 2015
-
Upload
phamnguyet -
Category
Documents
-
view
221 -
download
0
Transcript of Analytic Methods for Benchmarking Hydrogen and Fuel Cell ... · Analytic Methods for Benchmarking...
NREL/PR-5400-64420 NREL is a national laboratory of the U.S. Department of Energy, Office of Energy Efficiency and Renewable Energy, operated by the Alliance for Sustainable Energy, LLC.
Analytic Methods for Benchmarking Hydrogen and Fuel Cell Technologies
227th ECS Meeting, Chicago, Illinois
Marc Melaina, Genevieve Saur, Todd Ramsden, Joshua Eichman
May 28, 2015

2
Presentation Overview: Four Metrics Analysis projects focus on low-carbon and economic transportation and stationary fuel cell applications
Bridging Markets
End-use: Vehicle & Stationary Fuel Cells
Renewable Hydrogen
Production
Integration with
Electricity Markets
1. Resource Potential Renewables, and a focus on biogas
4. Grid Services Estimating revenue streams for electrolysis units
2-3: GHGs & Costs • Hydrogen for
FCEVs • Evaluation of
stationary fuel cells
Analysis tools provide insight into the degree
to which bridging markets can strengthen
the business case for fuel cell applications

Resource Potential

4
Resource Potential Objectives Quantify energy resources for hydrogen production • Alternatives to conventional sources of hydrogen
(e.g., natural gas) • Hedges again fluctuating costs and demand for
fossil fuels • Assist compliance with state policies for
renewable fuels • Shift to low-carbon energy resources Technical Reports Melaina, M.; Penev, M.; Heimiller, D. (2013). Resource
Assessment for Hydrogen Production: Hydrogen Production Potential from Fossil and Renewable Energy Resources. Golden, CO, NREL: NREL/TP-5400-55626.
Saur, G.; Milbrandt, A. (2014). Renewable Hydrogen Potential from Biogas in the United States. Golden, CO, NREL: NREL/TP-5400-60283
Milbrandt, A.; Bush, B; Melaina, M. (2015). Biogas and Hydrogen Systems Market Assessment. Forthcoming.

5
Pressure on resource use Assuming particular future market adoption of FCEVs, we estimating marginal pressure on energy resource use • Reference case (AEO 2013) • “Low carbon” case (AEO 2013) 2040 Demand: 50 M FCEVs, 10 MMT H2
(Melaina et al. 2013)

6
Resource Potential – Analysis Process • Biogas (methane) resource assessment
o Waste water treatment plants (WWTP) o Landfill gas (LFG) o Animal manure o Industrial sources and organic food waste
• Net availability o Estimated based on currently known applications
• H2 from biogas o Conversion by steam methane reforming (SMR)
• Vehicles Supported o Use of 2020 medium case projection of fuel cell electric
vehicles (FCEV) fuel efficiency • Final products
o US maps - national and regional o Tabular estimates – national, regional, top sources o FCEV supported o Final report

7
Resource Potential – Geographically Refined Individual resource maps can be aggregated for total potential.
(Saur, Milbrandt 2014)

8
Resource Potential – Local level
Example – Sacramento, CA
Understanding the distribution of resources on a local level can help characterize challenges and opportunities for different communities.
Source H2
Potential (tonnes)
FCEVs Supported
(thousands) Counties
WWTP 11,800 66.8 39
Landfills 34,700 196.2 5
Animal Manure 34,500 194.9 29
Industrial Institutional Commercial
12,300 69.4 34
Total 93,300 527.3 41
(Saur, Milbrandt 2014)

9
Supply curves for biogas to hydrogen
• Delivery cost included for major urban areas
• Total delivered cost by city & region shown in graph below
• Significant variability by region • Potential to increase economies
of scale by combining multiple sources or direct pipeline injection
PRELIMINARY RESULTS (Milbrandt et al. 2015)

Greenhouse Gas Emissions and Cost of Delivered Energy

11
GREET lifecycle GHG emissions by vehicle-fuel
Nguyen, Ward, Johnson 2013. http://www.hydrogen.energy.gov/program_records.html
Low/medium/high: sensitivity to uncertainties associated with projected fuel economy of vehicles and selected attributes of fuels pathways, e.g., electricity credit for biofuels, electric generation mix, etc.
Potential for very low GHGs

12
Detailed geo-temporal costs from the Scenario Evaluation and Regionalization Analysis (SERA) Model • The SERA model can generate a large volume of scenario results • Production sources can be networked over time to supply multiple end-use
demand centers • SERA can disaggregate national scenarios, such as from National Academies
Demand and Delivery by City Regional/State-level Subsets of Results Station Placement
Internal consistency allows for examination of multiple physical and financial metrics across multiple markets and over time
Cash Flows
Vehicle Adoption Rates
Stand-alone reports cannot capture the full range of possible outputs

13
Average national hydrogen Costs from SERA
2010 2020 2030 2040 2050Year
01
2
3
4
5
6
7
8
910
De
Increase due to rising feedstock
prices and addition of low capacity refueling stations in smaller cities.
This estimate does not account for
currently available excess capacityfor production of hydrogen.
FCEV Emphasis: Nat'l Average Delivered Cost
14
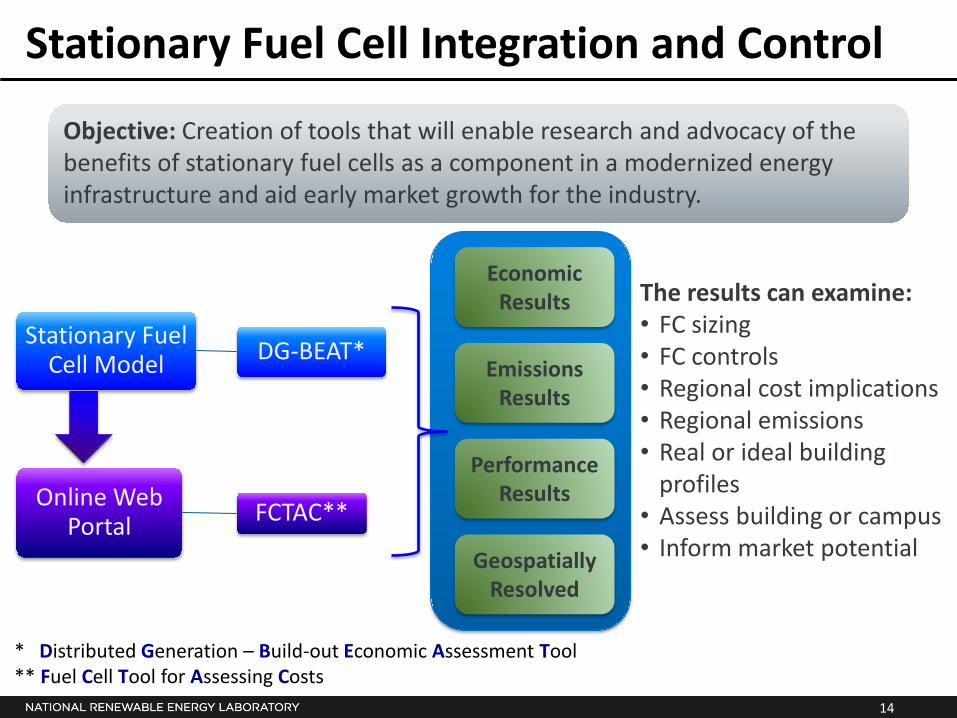
Stationary Fuel Cell Integration and Control
Objective: Creation of tools that will enable research and advocacy of the benefits of stationary fuel cells as a component in a modernized energy infrastructure and aid early market growth for the industry.
Stationary Fuel Cell Model DG-BEAT*
Online Web Portal FCTAC**
Economic Results
Emissions Results
Performance Results
* Distributed Generation – Build-out Economic Assessment Tool ** Fuel Cell Tool for Assessing Costs
The results can examine: • FC sizing • FC controls • Regional cost implications • Regional emissions • Real or ideal building
profiles • Assess building or campus • Inform market potential Geospatially
Resolved

15
DG-BEAT: Fuel Cell Dispatch and Sizing
• 4 FC sizing options o Fixed size: User specified o 100% size: Sized to meet ≈ peak summer demand (ignores outliers 2% of points) • Dependent on FC dispatch strategy chosen
o Cost optimal size: Iterates between base load size and 100% size to find the best NPV* o Emissions optimal size: Iterates to find the lowest net annual emissions
* Net present value
• 5 FC dispatch strategies
Currently 5 FC dispatch strategies and 4 FC sizing strategies Additional optimizations envisioned for both sizing and operations
Presenter
Presentation Notes
For left chart, which strategy is the emissions line? Or is it the emissions with no FC?

16
DG-BEAT: Example National Survey—Cost Hospital with FC only Load following with 100% component sizing Takeaway: By region, only the South didn’t showed cost savings, but the state-by-
state variation is greater. Takeaway: Cost savings are very dependent on electricity and natural gas prices.

17
DG-BEAT: Example National Survey—Emissions
Hospital with FC only GHG emissions minimization control strategy and component sizing Takeaway: Most regions have >50% emissions reductions from hospitals by adding
an FC, but there is state-by-state variation. Takeaway: Emissions savings are dependent on the state grid emissions.

Influence of auxiliary revenue streams

19
Hydrogen energy storage pathways
Source: http://www.nrel.gov/docs/fy15osti/62518.pdf
A.Electrolysis for Grid Support
B.Integration of large-scale central renewables
C.Conversion to grid electricity
D.Distributed production for variable resources
E.Methanation for renewable gas synthesis
F. Hydrogen Separation
20
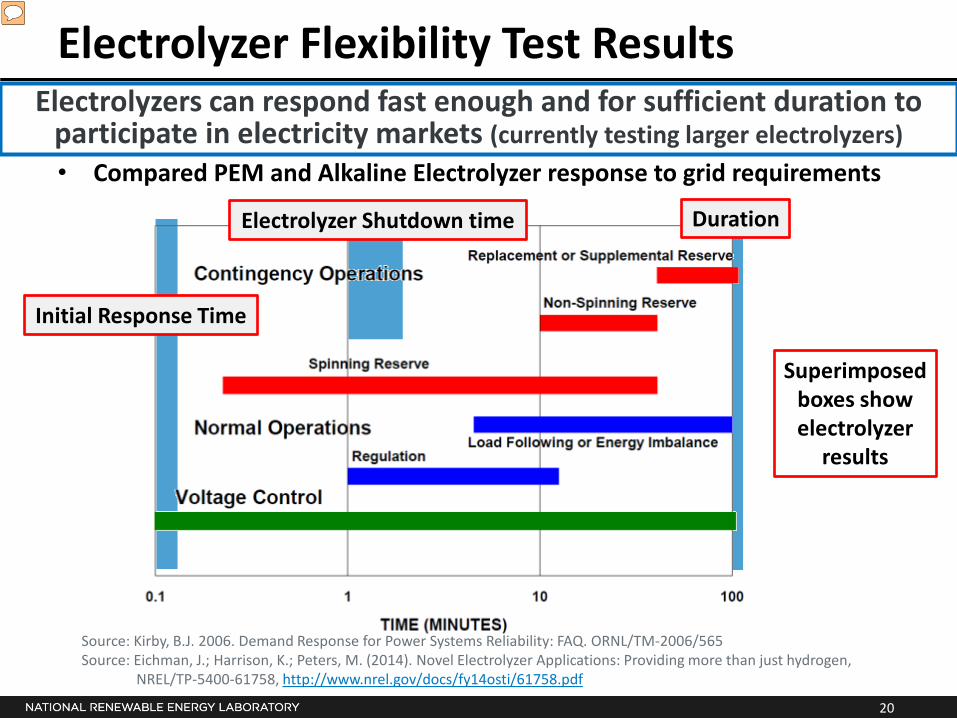
Electrolyzer Flexibility Test Results
• Compared PEM and Alkaline Electrolyzer response to grid requirements
Source: Kirby, B.J. 2006. Demand Response for Power Systems Reliability: FAQ. ORNL/TM-2006/565 Source: Eichman, J.; Harrison, K.; Peters, M. (2014). Novel Electrolyzer Applications: Providing more than just hydrogen, NREL/TP-5400-61758, http://www.nrel.gov/docs/fy14osti/61758.pdf
Initial Response Time
Electrolyzer Shutdown time Duration
Superimposed boxes show electrolyzer
results
Electrolyzers can respond fast enough and for sufficient duration to participate in electricity markets (currently testing larger electrolyzers)
Presenter
Presentation Notes
Image shows typically electricity markets in US. The left side of the bar shows how fast devices have to respond and the right of the bar shows how long they have to be available. (e.g., Spinning reserve must begin responding in less than a minute and must be available for 60 minutes) Superimposed boxes show electrolyzer results from experimental testing. Initial response is on the order of milliseconds (not shown: settling time is on the order of seconds). Since they are demand response devices, they can supply the demand reduction for an infinite period of time. Lastly, a full shutdown to provide Non-spin and replacement takes a few minutes. Technically, electrolyzers can support Reg, LF, SP, NS and RP.
21
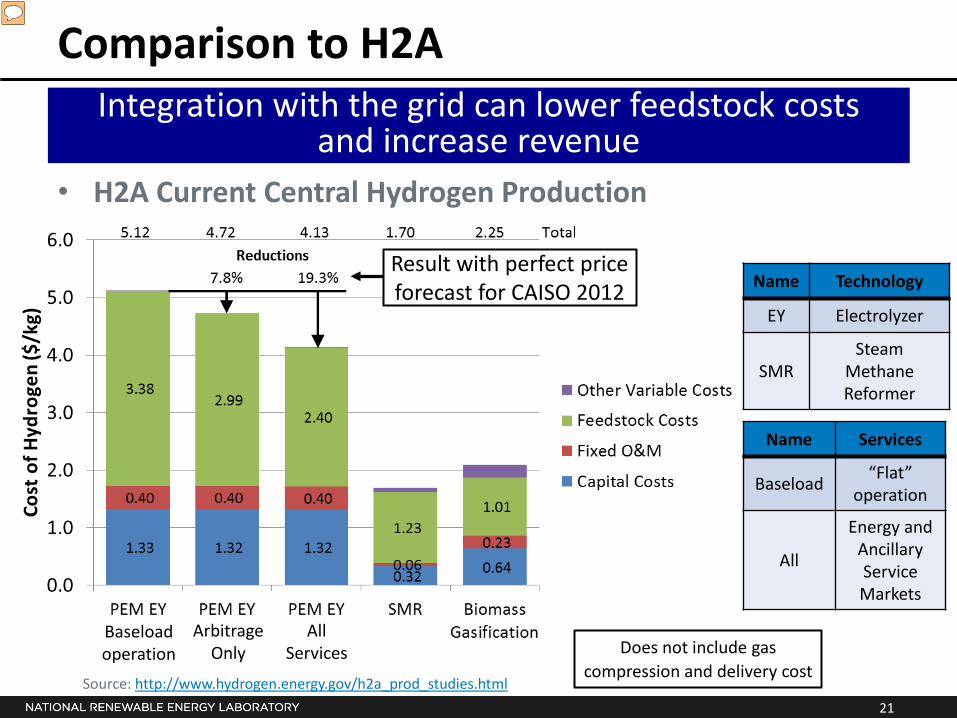
Comparison to H2A
• H2A Current Central Hydrogen Production
Result with perfect price forecast for CAISO 2012
Integration with the grid can lower feedstock costs and increase revenue
Name Technology
EY Electrolyzer
SMR Steam
Methane Reformer
Name Services
Baseload “Flat” operation
All
Energy and Ancillary Service Markets
Does not include gas compression and delivery cost
Arbitrage Only
All Services
Baseload operation
Source: http://www.hydrogen.energy.gov/h2a_prod_studies.html
Presenter
Presentation Notes
Compares the impacts of integration of EYs with elec. markets Baseload is constant operation at 97% Arbitrage includes participation with energy market (reduce production when prices are high and get capacity payment) All services includes energy and ancillary service markets (reduce production when prices are high, get money from providing ancillary services and get capacity payment) Included SMR and biomass for comparison

22
Hydrogen energy storage analysis results
Flexibility Conclusions 1. Electrolyzers can respond sufficiently fast and for a
long enough duration to participate in electricity markets.
Economic Viability Conclusions 1. Sell Hydrogen: Systems providing strictly storage are
less competitive than systems that sell hydrogen 2. Revenue w/ ancillary service > energy only > baseload 3. More storage is not necessarily more competitive in
current energy and ancillary service markets Source: Eichman, J. (2014). “Analysis of fuel cell/electrolyzer cost of energy storage for California electrical grid”, presented
at the 2014 U.S. DOE Hydrogen and Fuel Cells Program Annual Merit Review, Washington, D.C., June 17, 2014. http://www.hydrogen.energy.gov/pdfs/review14/an049_eichman_2014_o.pdf
Presenter
Presentation Notes
Sale of H2 is key for competitiveness AS revenue > Eonly revenue > baseload revenue

23
Summary and Suggestions for Future Research
Summary • Analytic models can provide consistent comparisons
across multiple metrics • Bridging markets (e.g., multiple revenue streams) can
improve business cases under certain market conditions
Future Research • Useful tools must be tailored to particular end-users to
improve decision making • Higher degrees of model/market integration are
needed to inform decisions for “business success”

24
Acknowledgements These projects are supported by the U.S. Department of
Energy’s Fuel Cell Technologies Office DOE Project Manager, Fred Joseck DOE Project Manager, Jason Marcinkoski DOE Project Manager, Dimitrios Papageorgopoulos
Key analysis personnel (for materials presented) Stationary fuel cells:
Michael Penev, Genevieve Saur, Jen Kurtz, Chris Ainscough (NREL) Jack Brouwer, Dustin McClarty (University of California – Irvine)
Biogas resources: Anelia Milbrandt (NREL) Power-to-gas & ancillary markets: Joshua Eichman (NREL) Systems analysis modeling:
Marc Melaina, Brian Bush, Michael Penev, Todd Ramsden (NREL)

26
Backup slides

27
Resource Potential – Biogas Conversion
Wastewater Treatment (WWTP) •1 ft3 biogas/100 gal wastewater [4] •65% CH4*0.03 m3 biogas/ft3 biogas* .7 kg CH4/m3 CH4 [5]
Landfill Gas (LFG) •EPA Landfill Methane Outreach Program (LMOP): Candidate Landfills [6] Animal Manure •EPA State Workbook: Methodologies for Estimating Greenhouse Gas Emissions, Workbook 7 Methane Emissions from Manure Management. [7] Industrial Process and Organic Food Waste •US Census Bureau’s County Business Patterns [8] Methane to Hydrogen •H2A Steam Methane Reforming (SMR) Central Case study : 3.3 kg CH4/kg H2 [9]
Vehicles Supported •Total Costs of Ownership of Future Light-Duty Vehicles : Medium case 2020 : 57 miles/gge & 10,000 miles driven/yr [10] •Transportation Energy Data Book [11] : 2010 car and two-axle, four-tire truck registrations : 230 million vehicles in 2011

28
DG-BEAT: Construction of Model
DG-BEAT* Buildings Controls
Base Load
Diurnal Peaking
Weekend Dip
Load Following
Emissions Minimization
Generation
Fuel Cells
Solar
Wind
Chillers
Vapor Compression
Absorption
Energy Storage
Hot Water
Cold Water
Battery
Economics Emissions Feedstock Costs
Natural Gas
Regional/User Rates
Electricity
TOU* Pricing 16
regions
Net Metering
Visualization
• Distributed Generation Build-out Economic Assessment Tool Codebase is hosted on GitHub (the largest code host in the world) o Allows for distributed collaboration o Open source, controlled access to fuel cell developers, NREL, UCI, and other stakeholders
*Time-Of-Use
Modular Design Building Integrated Systems
Controls Optimization Component Sizing
Presenter
Presentation Notes
Change the green color and make the blue consistent. ----- Meeting Notes (6/2/14 12:04) ----- Make invitation to people who would like to be stakeholders.

29
DG-BEAT: Component Performance
• Fuel Cell o Efficiency, heat recovery, emissions o Heat recovery by temperature o Max/min power, response rate,
turndown ratio • Chiller (Absorption and Electric) o COP by % output o Size (kW and Tons) o Heat/cold available
• Thermal Storage (Cold and Hot) o Tank Size (kWh and gal) o Reservoir Temperatures o Losses o Fill and discharge rates
• Battery o Type and size o Charge/discharge characteristics o Cell characteristics
• Wind and Solar also available
0 0.1 0.2 0.3 0.4 0.5 0.6 0.7 0.8 0.9 10
0.1
0.2
0.3
0.4
0.5
0.6
0.7
0.8
0.9
1
Effi
cien
cy [%
]
% Power
Fuel Cell Performance Curves
0 0.1 0.2 0.3 0.4 0.5 0.6 0.7 0.8 0.9 10
200
400
600
800
1000
1200
1400
1600
1800
2000
Em
issi
ons
(lb/M
Wh)
Electric Efficiency (% LHV)Heat Recovery (% of fuel energy)CO2 emissionsNOx emissionsSO2 emissions
Pre-loaded or user defined component performance characteristics

30
DG-BEAT: Regional Building Profiles
Building types Locations Restaurant: full-service (sit down)
Restaurant: quick-service (fast food) School: primary school
School: secondary school Office: large office
Office: medium office Office: small office
Hospitality: large hotel Hospitality: small hotel/motel
Health care: large hospital Health care: outpatient facility
Retail: big-box, standalone retail store Retail: retail strip mall Retail: supermarket
Mid-rise apartment building Unrefrigerated warehouse
Miami (ASHRAE 1A) Houston (ASHRAE 2A) Phoenix (ASHRAE 2B) Atlanta (ASHRAE 3A)
Los Angeles (ASHRAE 3B-Coast) Las Vegas (ASHRAE 3B-Inland)
San Francisco (ASHRAE 3C) Baltimore (ASHRAE 4A)
Albuquerque (ASHRAE 4B) Seattle (ASHRAE 4C) Chicago (ASHRAE 5A) Boulder (ASHRAE 5B)
Minneapolis (ASHRAE 6A) Helena, MT (ASHRAE 6B) Duluth, MN (ASHRAE 7)
Fairbanks, AK (ASHRAE 8)
Vintages 2010, 2007, 2004, Post-1980, Pre-1980
NREL’s Electricity, Resources, and Building Systems Integration Center has provided energy use profiles* . • 1280 total building profiles • Load profiles include electricity, heating,
cooling (thermal kW & electric kW), electric refrigeration, and exterior lighting
• 15 min time interval data for a year Can also use real building data if available
* Using data from the Commercial Buildings Energy Consumption Survey (CBECS)
31
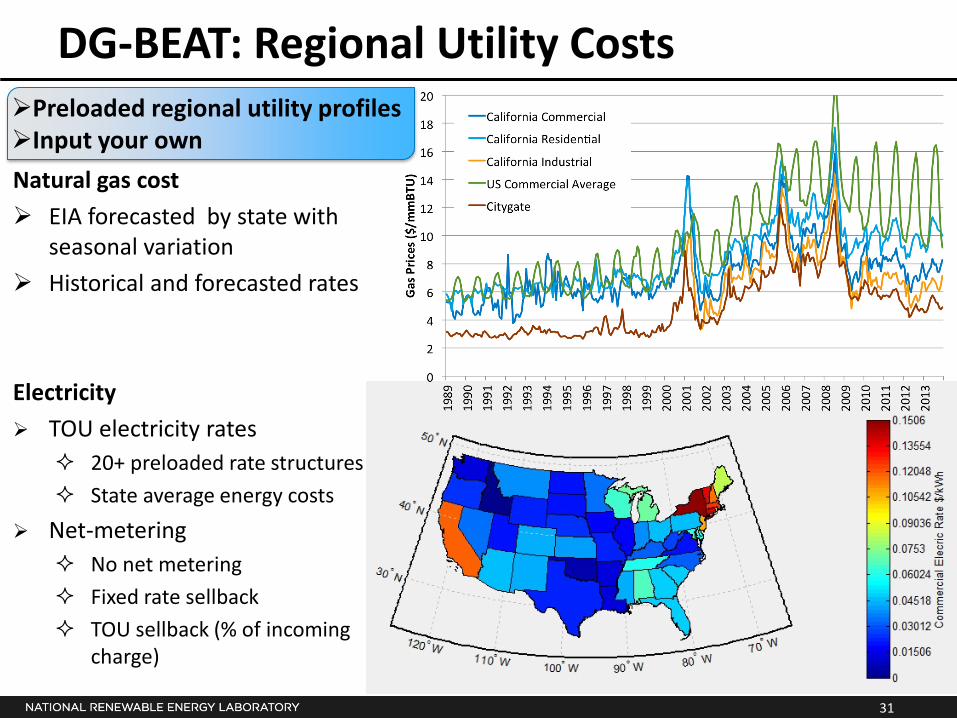
DG-BEAT: Regional Utility Costs
Natural gas cost EIA forecasted by state with
seasonal variation Historical and forecasted rates
Electricity TOU electricity rates
20+ preloaded rate structures State average energy costs
Net-metering No net metering Fixed rate sellback TOU sellback (% of incoming
charge)
Preloaded regional utility profiles Input your own

32
DG-BEAT: Component Sizing
• Electric and Absorption Chillers o Absorption Chiller sized based on heat available or demand whatever lowest o Electric chiller required to meet 100% of remaining peak summer demand
• Thermal Energy Storage (TES) o Sized to shift 100% of cooling from peak hours to off-peak o Sized for hottest day during summer on-peak months
• Battery o Primary purpose is to reduce demand charges during on-peak hours o Set by total kWh or hours of peak demand
Foundations for additional component sizing are implemented Modular designs allows additional component creation
Presenter
Presentation Notes
How is absorption chiller sized or is it also 100% of peak demand? TES Chart – the shifted demand still has a large spike before the rest of the peak is shifted? Why? Battery chart – can we please show the FC following the load rather than predicting it?

33
Hydrogen storage and Power-to-gas (PtG) projects • Germany has 22 green
hydrogen and PtG projects as of 2012 (see figure)
• 2 MW Power-to-Gas project planned for Ontario, Canada o Acts as energy storage
for grid management and regulation
• Two Power-to-Gas pilot
projects In California (SoCalGas, NREL, UC Irvine) o Reduce variability of
renewable generation
Source: www.hydrogenics.com/about-the-company/news-updates/2014/07/25/hydrogenics-selected-for-2-megawatt-energy-storage-facility-in-ontario
Source: www.gtai.de/GTAI/Content/EN/Invest/SharedDocs/ Downloads/GTAI/Info-sheets/Energy-environmental/info-sheet-green-hydrogen-power-to-gas-demonstrational%2520projects-en.pdf
Source: www.bloomberg.com/news/articles/2015-04-13/california-utility-to-make-gas-from-solar-for-pipeline-storage
Presenter
Presentation Notes

34
Opportunities for Power-to-gas • Natural Gas System
o 305,000 miles of transmission pipelines
o 400 underground natural gas storage facilities
o 3.9 Bcf underground storage working gas capacity
• Storage equates to… o ~60 days of NG use
across the U.S. o 38 billion kg of H2
used to produce CH4 from CO2 methanation for one fill
Underground Natural Gas Storage Facilities
Source: www.eia.gov/pub/oil_gas/natural_gas/analysis_publications/ ngpipeline/index.html
CO2 + 4H2 → CH4 + 2H2O (Sabatier process)
Presenter
Presentation Notes
Storage volume is enough for an average of 60 days of gas usage across US

35
Clean Energy Dialogue – US/Canada
• Hydrogen Energy Storage (HES) Workshop o Held May, 2014 in Sacramento, CA and included a diversity of
stakeholders o Explored barriers, policy and next steps for encouraging HES o Workshop proceedings are available
• Example Findings
o Criteria and Barriers – Technical and Economic Viability – Multiple end uses
o Policy – Equal treatment and credit in
markets o Next Steps
– Demonstration and pilot projects
Source: http://www.nrel.gov/docs/fy15osti/62518.pdf
Presenter
Presentation Notes
CED - Innovative solutions for cleaner energy production, distribution, and use

36
Electrolyzer Flexibility Tests
• Testing explored several parameters o Startup and Shutdown o Minimum Turndown o Response Time o Ramp Rate o Frequency Response
Trig
ger S
igna
l
Trigger at 0.02 seconds
5000 samples/second
Response (±1% max current)
Ramp Up: 25%, 50%, and 75% →100%